Section 5
Electricity security
Electricity is the largest single carrier in Nordic final consumption today and the carrier whose security profile is changing fastest. This section combines the system view with the cooperation view in a single sequence. Sub-sections 5.1 and 5.2 set out the demand outlook and the short-term adequacy picture. Sub-sections 5.3 and 5.4 cover the integration pattern across the region and the supply-chain exposures that affect it. Sub-section 5.5 maps the cooperation architecture against the vulnerabilities that 5.1-5.4 set out. The synthesis at 5.6 returns to the trilemma: the same integration that delivers the affordability pillar of the Nordic system also creates the price-transmission and cascade exposures that define the security pillar. In risk-typology terms, the electricity system is where local, regional and global risks compound most readily, and where Nordic cooperation has the deepest existing foundations to build on.
Total Nordic electricity generation output (measured in terawatt-hours) has grown moderately over the last two decades, by 18 per cent between 2004 and 2024. The composition has changed far more than the total (Figure 5.1). Wind generation has grown more than tenfold, hydro and nuclear remain the bulk-volume backbone, and solar power production is rising steeply even if it still remains nascent. The result is that in terms of carbon emissions, the Nordics have the cleanest electricity system in Europe, and one of the most weather-dependent.
Source: Eurostat.
Notes: TWh = terawatt-hours. Coal includes peat. Other renewables include solid and liquid biofuels, biogases, geothermal and renewable municipal waste. Other includes oil, non-renewable waste and unspecified sources.
The weather-dependency becomes more obvious when looking at the Nordic electricity generation capacity. It stood at 141 gigawatts (GW) in 2024, a remarkable 48 GW increase from 2004. Effectively all capacity additions came from solar and wind (45 GW) (Figure 5.2).
Source: Eurostat
Notes: *covers both fossil and renewable combustible fuels (breakdown not available). Includes also geothermal.
The surge in weather-dependent electricity capacity also means that the share of dispatchable capacity, that is, combustible fuels and hydro (for terminology on capacity types, see Annex 1) dropped from 83 per cent in 2004 to 57 per cent in 2024. In other words, balancing the electric grids has become more complex.
Total Nordic electricity consumption in 2024 was essentially at the level of 2004, but the regional overall picture masks divergent national paths (Figure 5.3). On the interconnected mainland, consumption has been broadly flat as parts of electricity-intensive industry (for example, paper) have declined and energy efficiency gains have so far managed to offset the growing demand from electric vehicles, heat pumps and new forms of industrial demand like data centres. In the Island Energy Systems, electricity consumption has grown markedly faster, driven by industrial electrification in Iceland and population and economic growth in the Faroe Islands and Greenland.
Panel a) Interconnected systems.
Source: Eurostat, Ålands statistik och utredningsbyra. Notes: Consumption includes final consumption and consumption for heat pumps, electric boilers and batteries.
Source: Eurostat, Ålands statistik och utredningsbyra. Notes: Consumption includes final consumption and consumption for heat pumps, electric boilers and batteries.
Panel b) Isolated (island) systems.
Source: IEA, national electricity companies.
Source: IEA, national electricity companies.
Notes: The sharp rise in Iceland’s electricity consumption around 2006–2008 reflects the commissioning of large new aluminium smelting capacity, notably the Fjarðaál smelter, rather than broad-based demand growth.
5.1 Future outlook for electricity demand in the Nordics
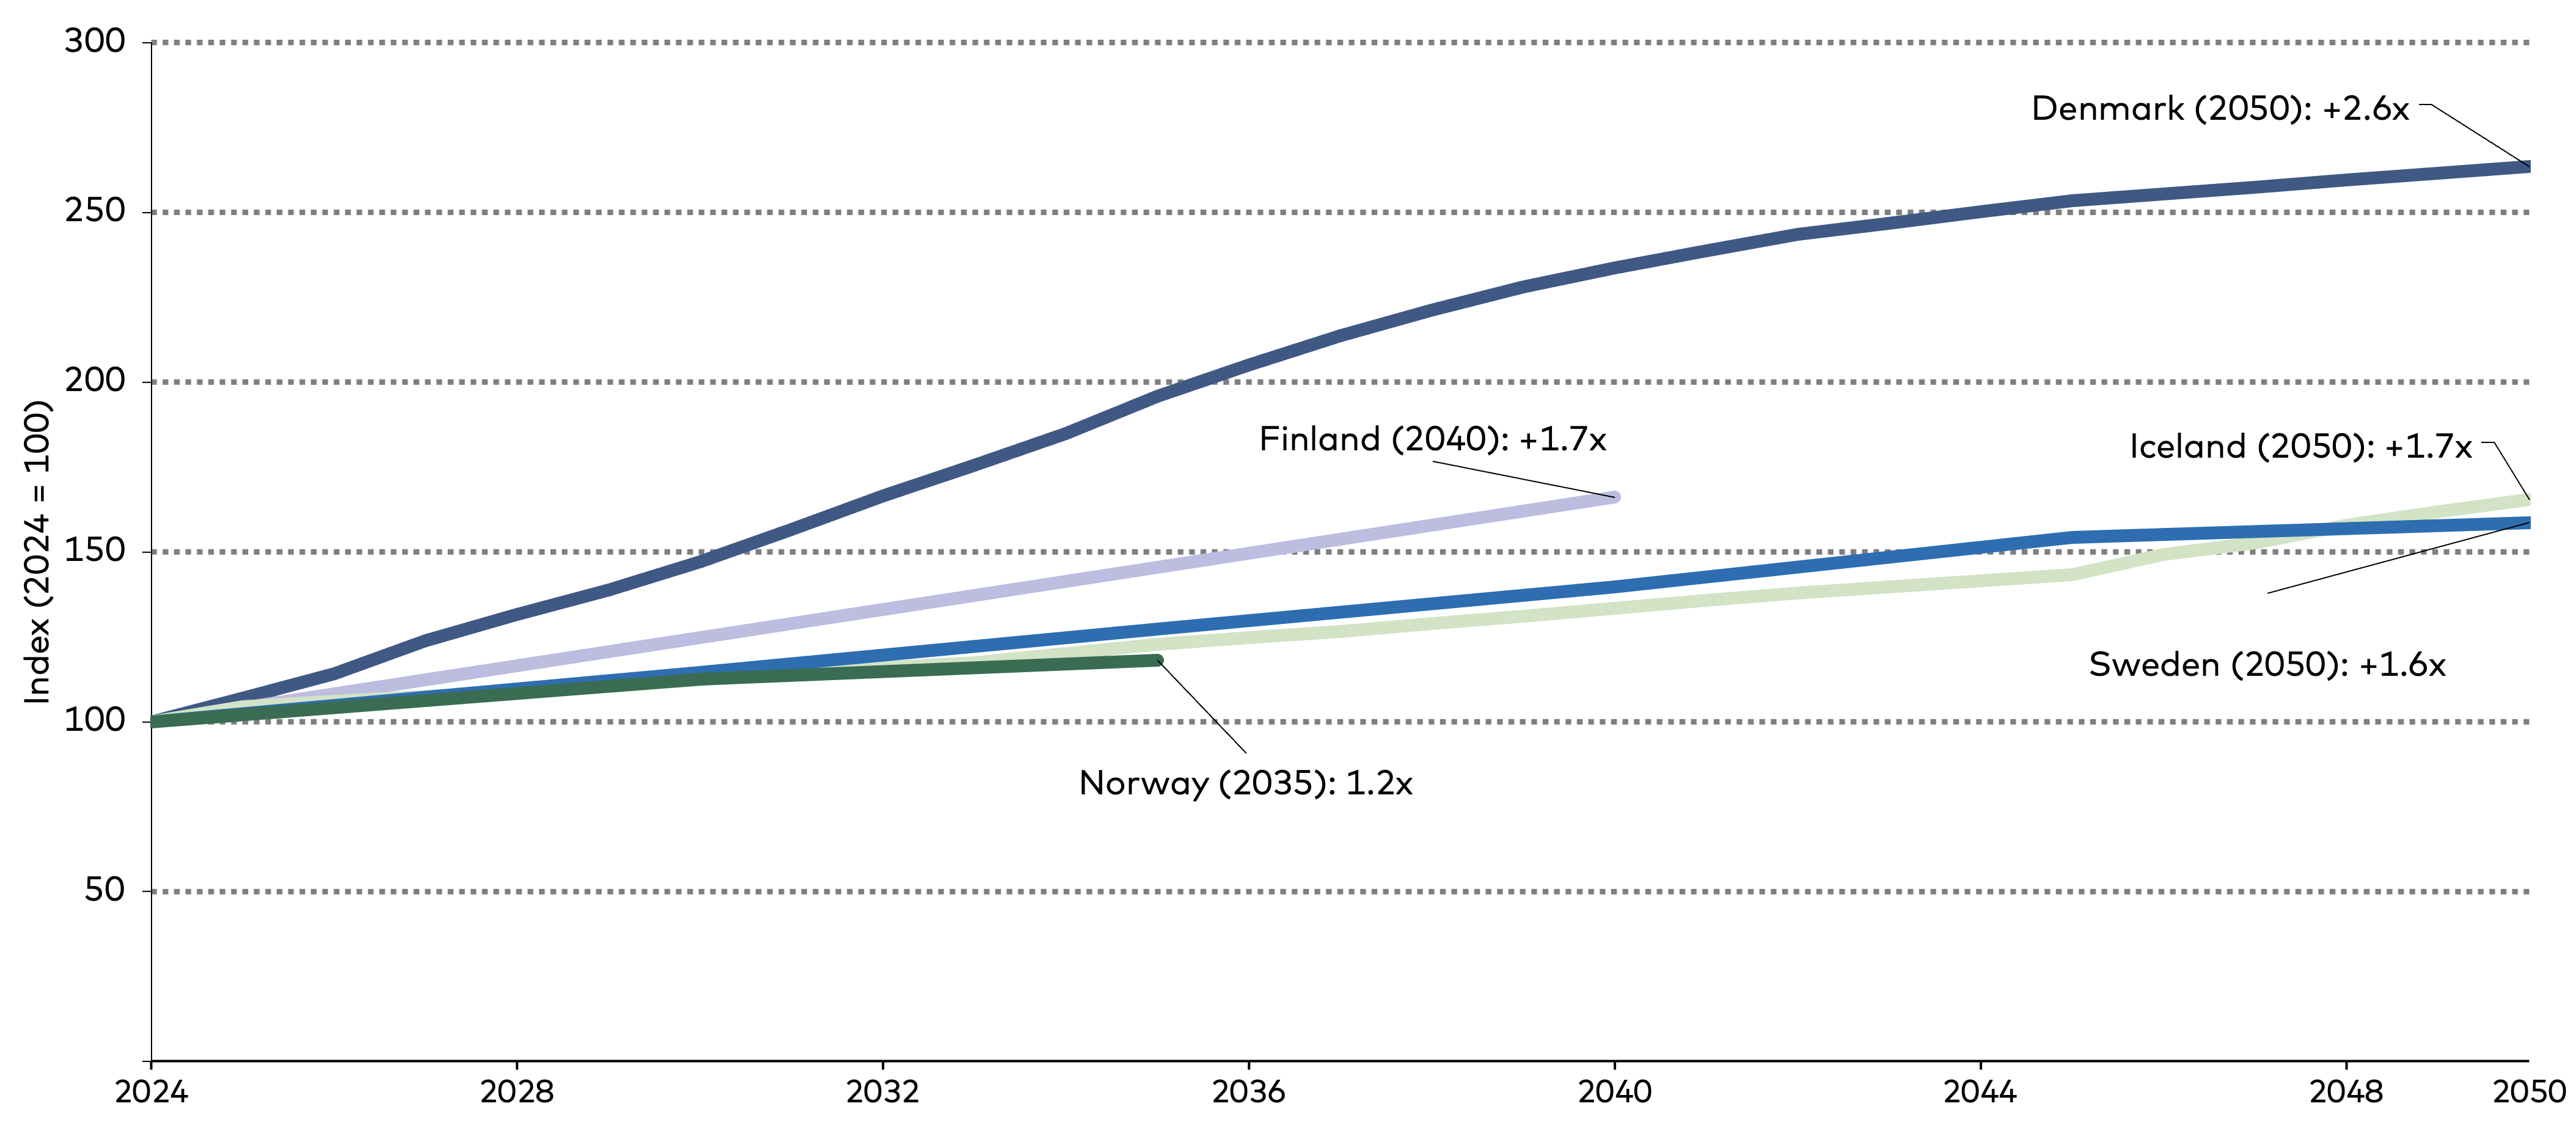
The relevant question for energy security is not the historical trend but the forward demand path. Each Nordic country is responsible for its own electricity planning, typically supported by scenario analysis that incorporates a range of assumptions. The official scenarios (see Annex 1 for sources and methodology) converge on a single message even at the conservative end: Nordic electricity demand will grow substantially over the next two decades (Figure 5.4). Denmark stands out with projections of 2.6 times current consumption by 2050. The other mainland systems sit in the 1.5x to 1.7x range, with Norway at the lower end at 1.2x by 2035.
Source: Author's calculations based on publicly available national electricity scenario data.
Most of the projected growth comes from industry and transport rather than from data centres (Figure 5.5). Data centres have nonetheless been subject to intense public debate across the Nordics over fears of their impact on household electricity prices. In the Nordic national scenarios, industrial electrification (including hydrogen and synthetic fuels) and electric transport account for the bulk of the growth, with data centres a secondary factor in those scenarios that explicitly model them.
Source: Author's calculations based on publicly available national electricity scenario data; IEA Electricity 2026.
Notes: Some national scenarios do not explicitly model data centre demand (Denmark, Norway, Sweden). ‘WEM’ = with existing measures.
EBs, HPs, DH = electric boilers, heat pumps and district heating.
Notes: Some national scenarios do not explicitly model data centre demand (Denmark, Norway, Sweden). ‘WEM’ = with existing measures.
EBs, HPs, DH = electric boilers, heat pumps and district heating.
The energy security risk from projected demand growth is not a uniform demand-supply gap but a timing mismatch between demand additions and grid build-out. Lead times for the critical equipment that makes up an electricity system differ by an order of magnitude depending on equipment type and manufacturer (Figure 5.6). New industrial demand or a data centre can be operational in two to three years from planning to operation. At the same time, on the supply side, new wind farms take seven to ten years from planning to commissioning, and new high-voltage transmission lines seven to eight. The result is local grid congestion as fast-arriving demand outpaces the slower transmission build. Data on grid connection requests, both for generation and demand, are not systematically published, which makes the imbalance difficult to plan around.
Source: Adapted from Fingrid, Kantaverkon kehittämissuunnitelma (TYNDP), www.fingrid.fi
5.2 Short-term electricity system adequacy and winter conditions
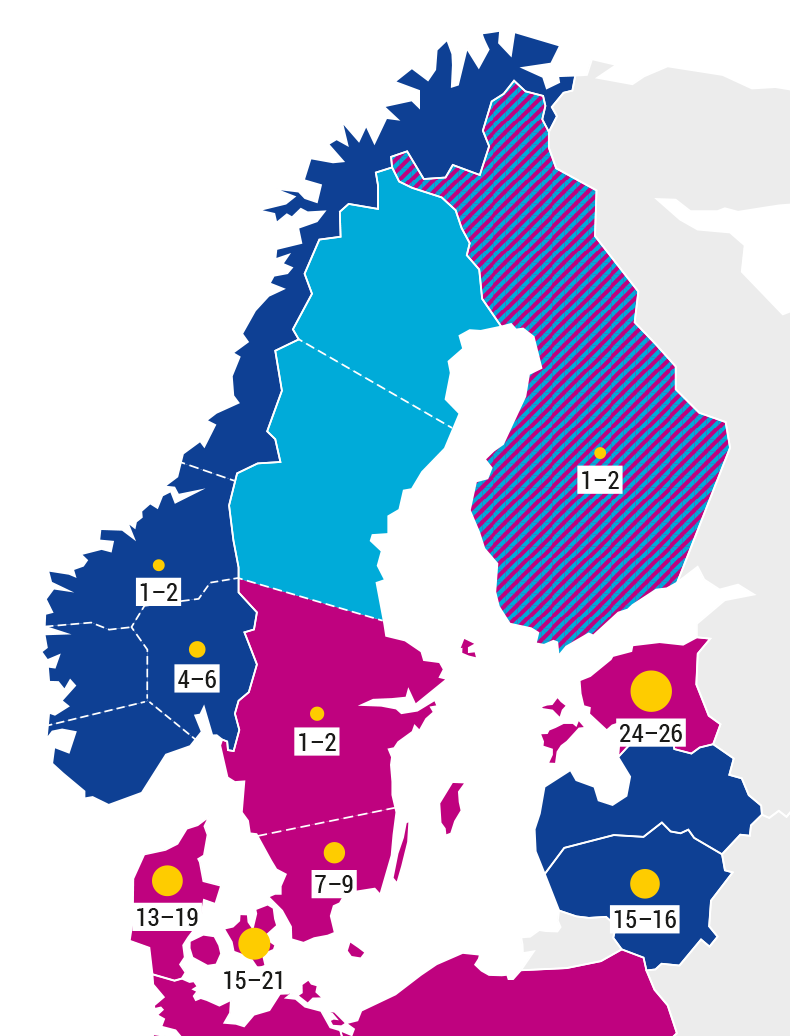
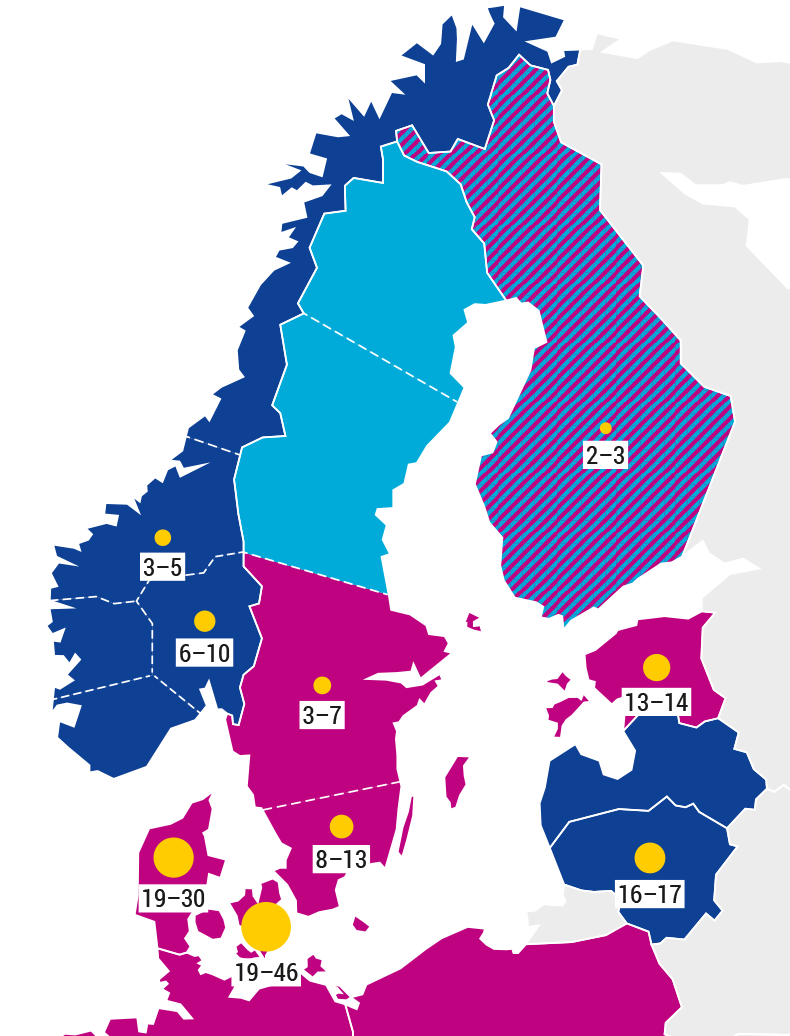
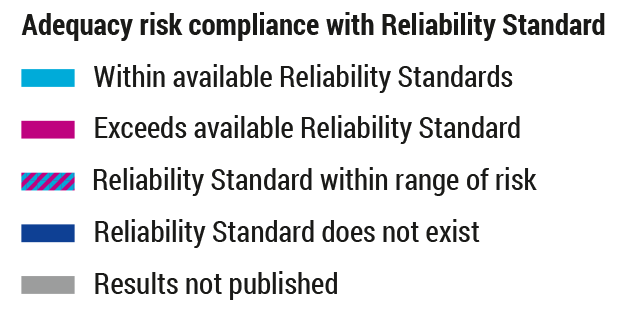
Beyond long-run demand growth, system adequacy in any given winter is the more immediate concern. ENTSO-E publishes the European Resource Adequacy Assessment (ERAA), which models the probability of supply shortages up to ten years ahead at the level of bidding zones. The Nordic results show the risk of imbalance rising in the early 2030s before partially easing later in the decade as new capacity comes online (Figure 5.7). The yellow circles indicate expected loss of load (LOLE) in hours per year (see Annex 1 for detailed methodology).
2028
2030
2032
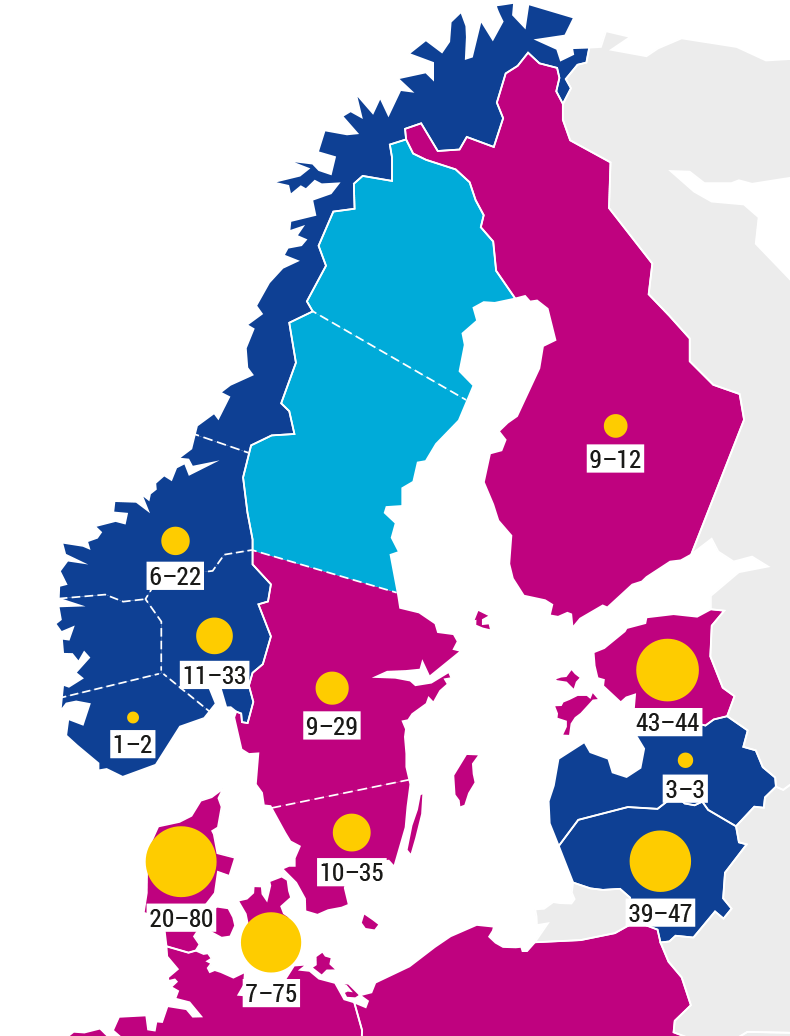
2035
Source: ENTSO-E European Resource Adequacy Assessment 2025, www.entsoe.eu/eraa/2025.
Notes: Yellow circles show modelled loss of load expectation (LOLE) in hours per year. A cross-border project between Sweden and Germany (Hansa PowerBridge I) was cancelled by the Swedish government in 2024. The ERAA modelling assumed the existence of the connection, so post-2030 LOLE values for southern Sweden (SE4) may be underestimated.
The model results moved from theoretical to operational during the winter of 2025–2026 in Finland, when an extreme cold-and-low-wind event came close to a real loss-of-load situation. The episode, summarised in Box 5.1, illustrates the kind of stress test the ERAA is designed to anticipate.
Box 5.1: The 2026 Finnish dunkelflaute
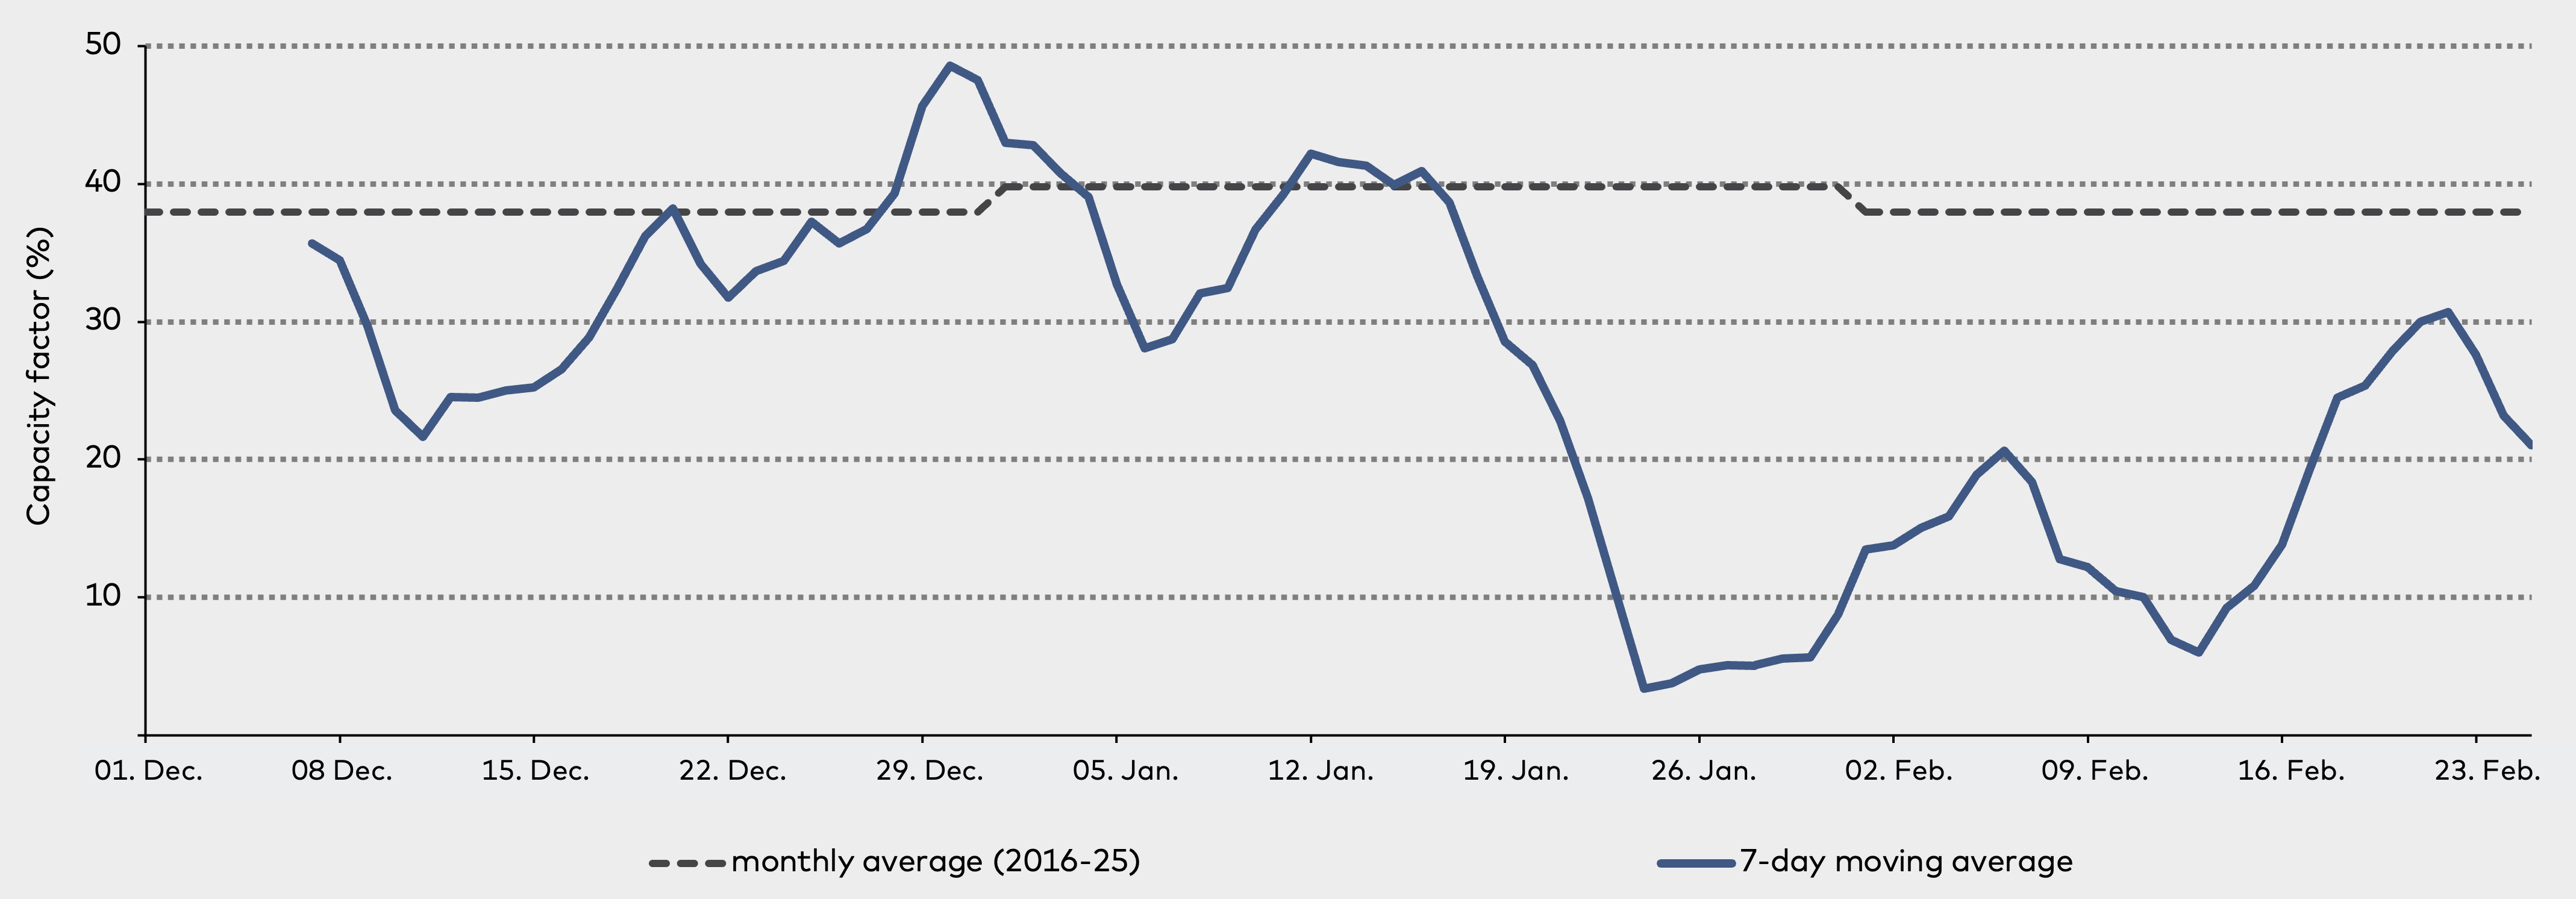
In January and February 2026, Finland experienced an extended period of below-average temperatures and below-average wind speeds, with sufficient ice formation on turbine blades to suppress wind generation further. Wind capacity factors fell well below the 2016–2025 reference range for weeks at a time.
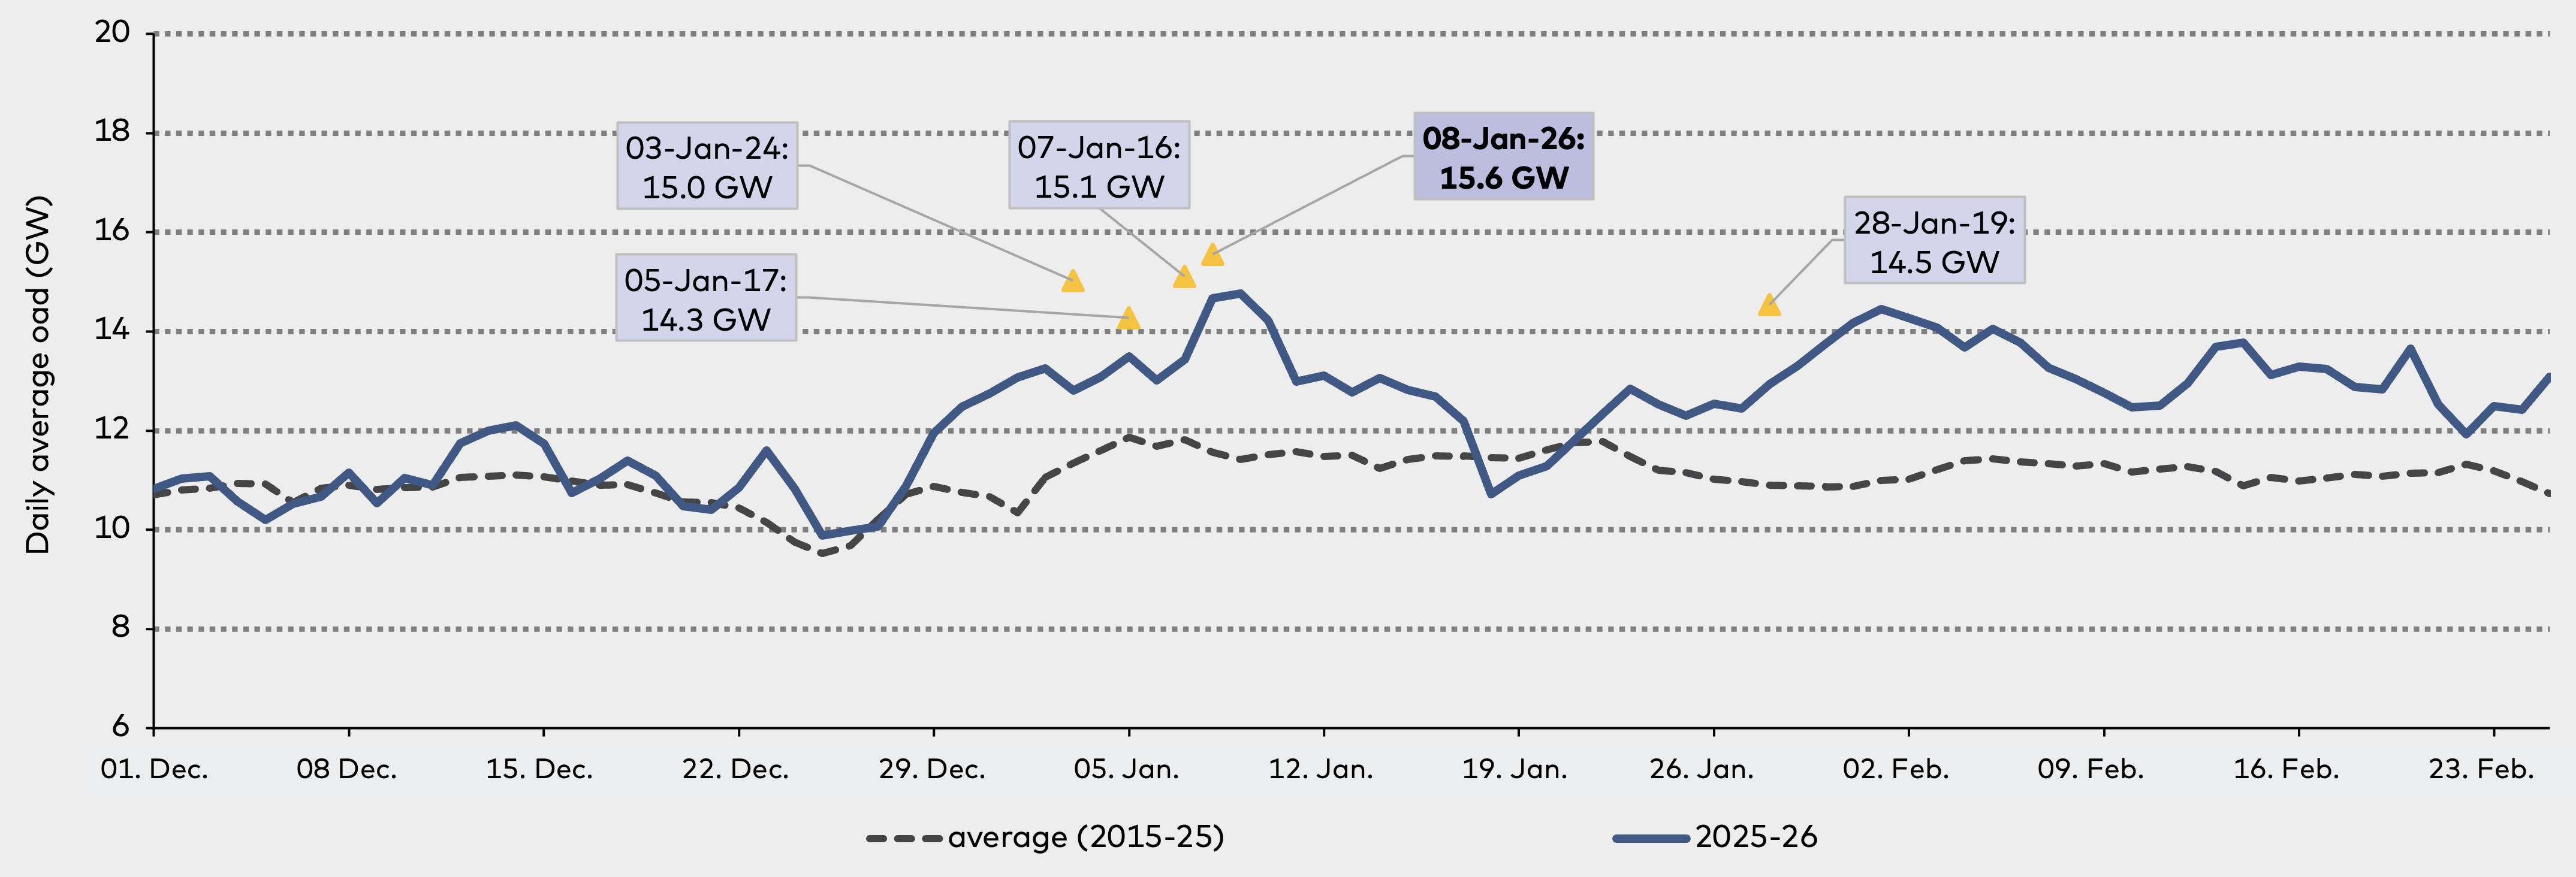
The timing was the worst possible. Finnish electricity demand peaks in January and February in almost every year. Twelve of the last thirteen annual fifteen-minute peak demands have fallen in those two months. The all-time peak load record was set on 8 January 2026 at 15.6 GW.
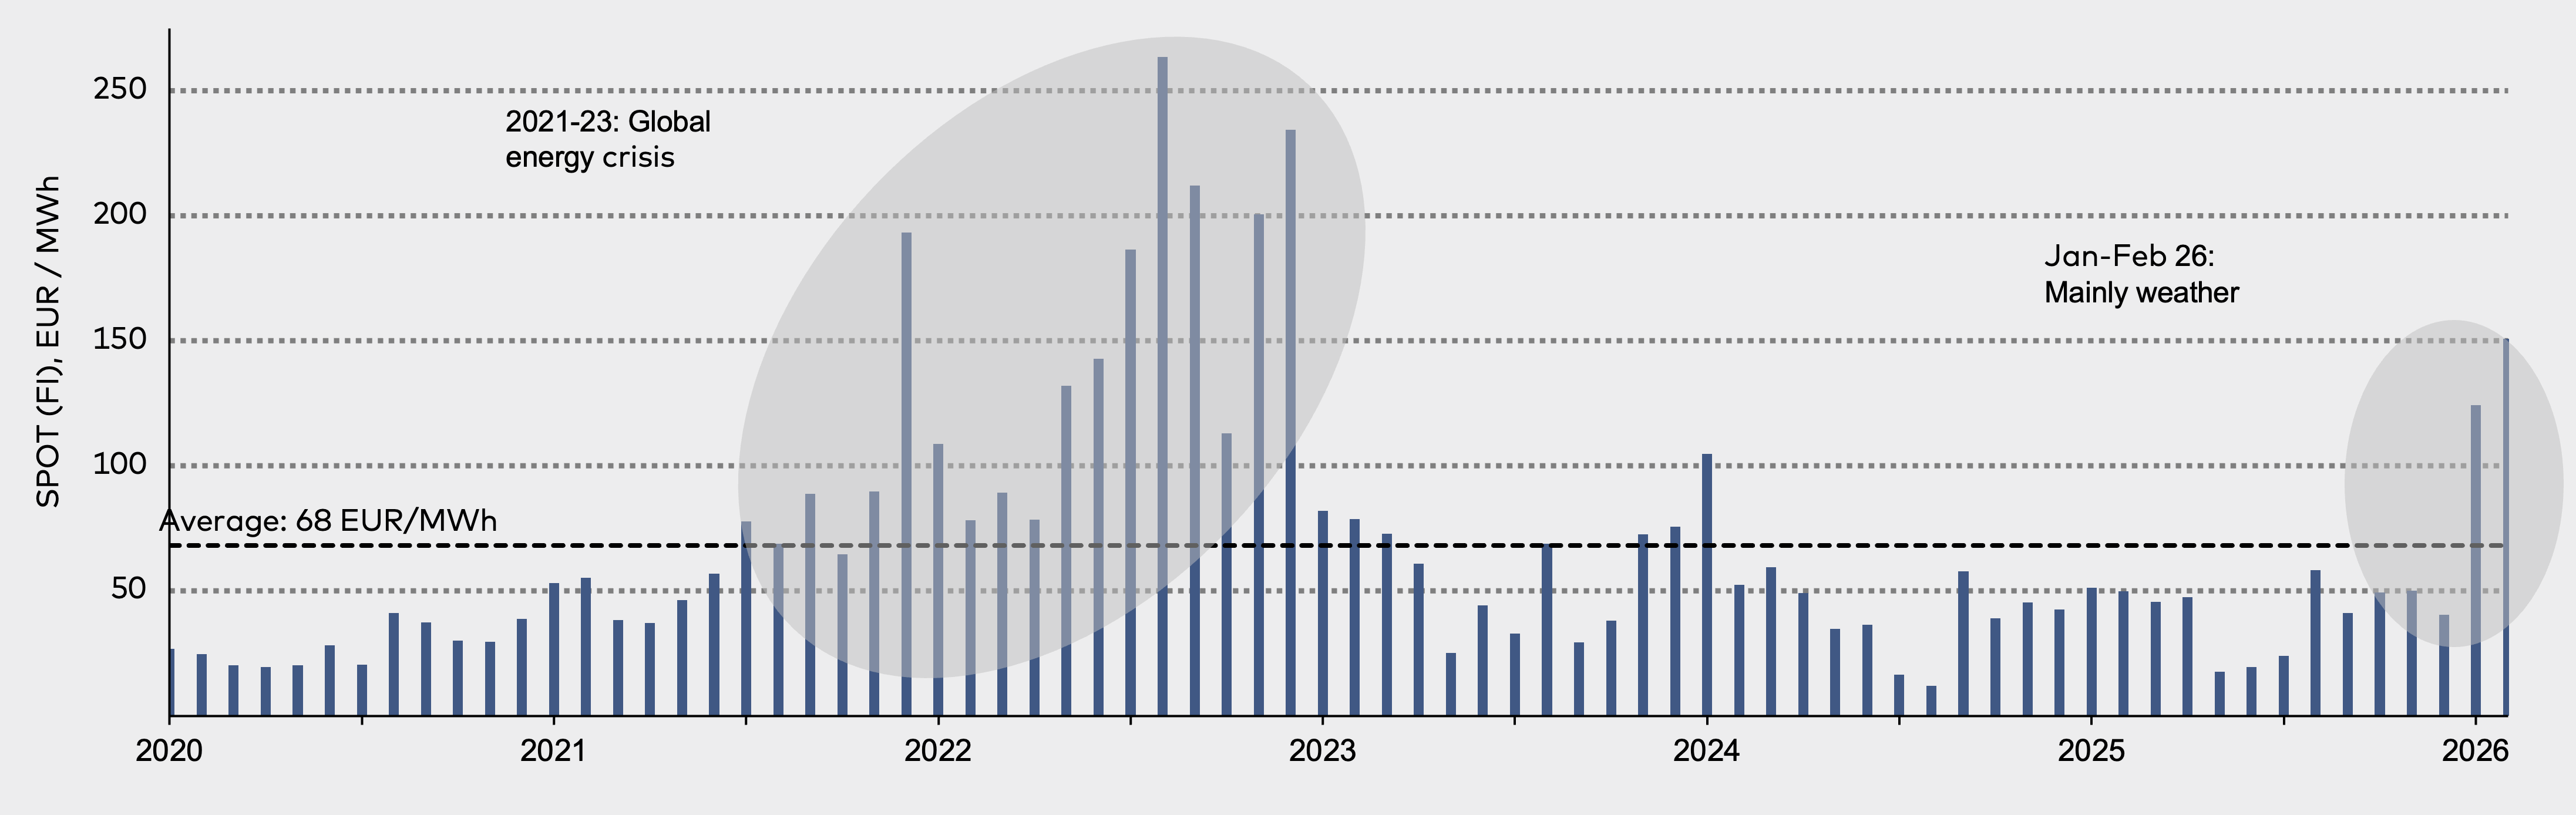
Finnish wholesale electricity prices spiked to levels last seen during the 2021–2023 European energy crisis, even though the underlying cause this time was weather rather than a wider geopolitical shock.
The system held. The new 400 kV AC transmission line between northern Sweden and Finland (“Aurora Line”), commissioned in December 2025, materially improved import capacity when it was needed the most. Had a major Finnish nuclear unit been unavailable during the same period, automatic demand restraint measures might well have been triggered. The episode is the cleanest recent example of why electricity security in the Nordics has to include resilience to compound weather events.
Source: Yle reporting, January–February 2026; Fingrid system data.
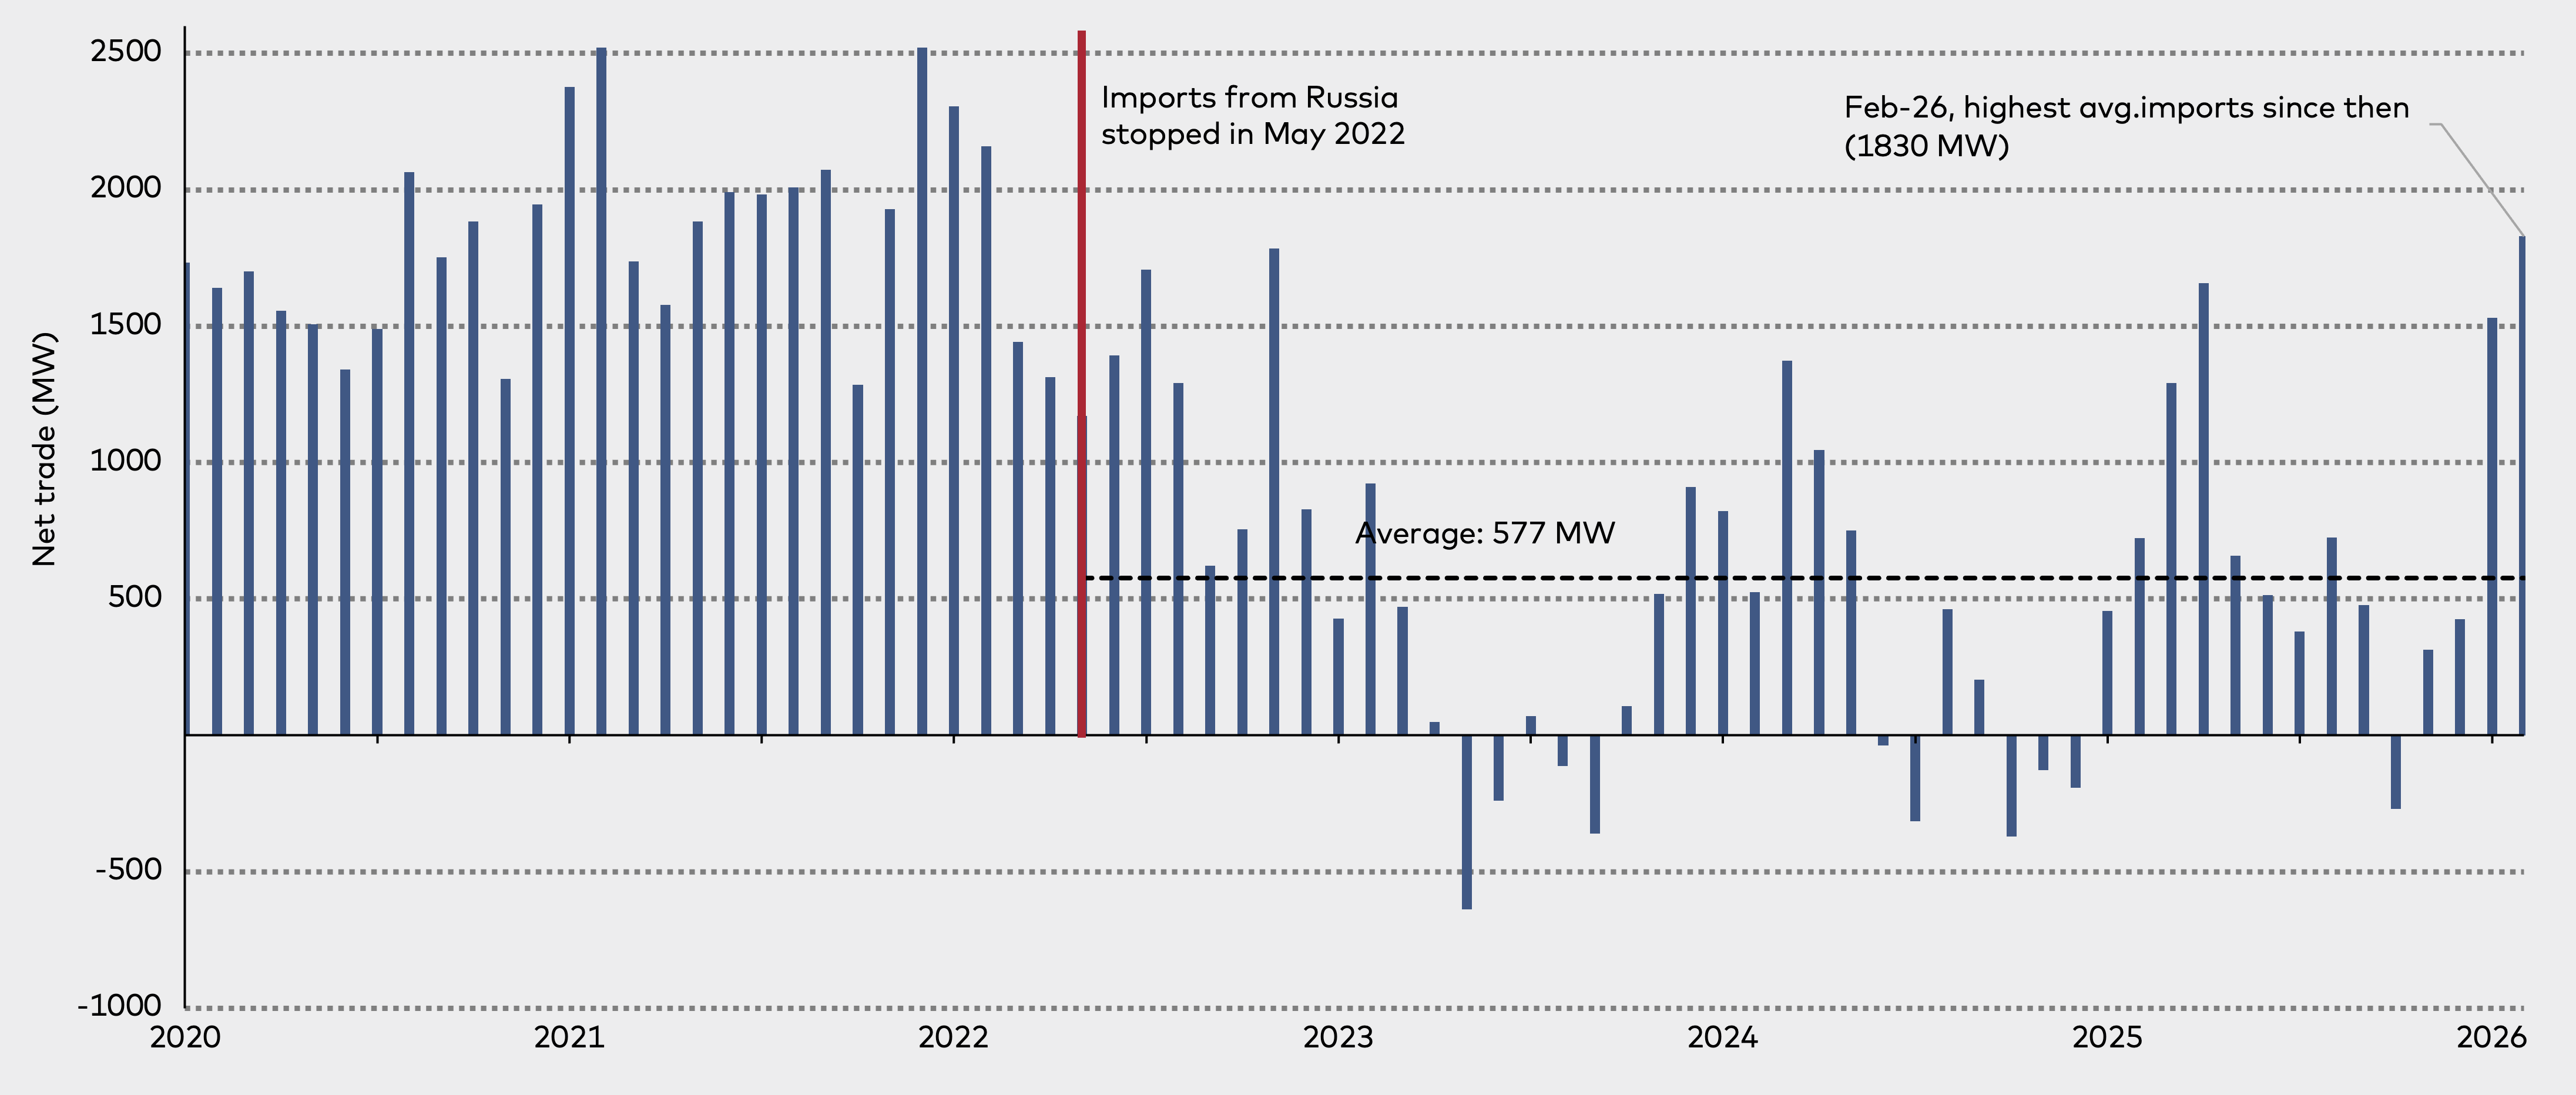
Finnish electricity imports reached their highest sustained levels since the cessation of trade with Russia in May 2022, averaging 1,830 MW in February 2026.
The weather conditions have an immediate impact on wind and solar electricity output. Hydro electricity generation is also dependent on the weather, but with a seasonal time lag. Future hydro capacity also depends on climate change scenarios. Norway closely monitors the fill levels of its hydro reservoirs, in other words the available potential energy in the system (Figure 5.8). These levels are highly relevant for the Nordic electricity system: the maximum storage capacity is roughly 90 TWh, which is more than Finland’s total annual electricity production (83 TWh in 2024).
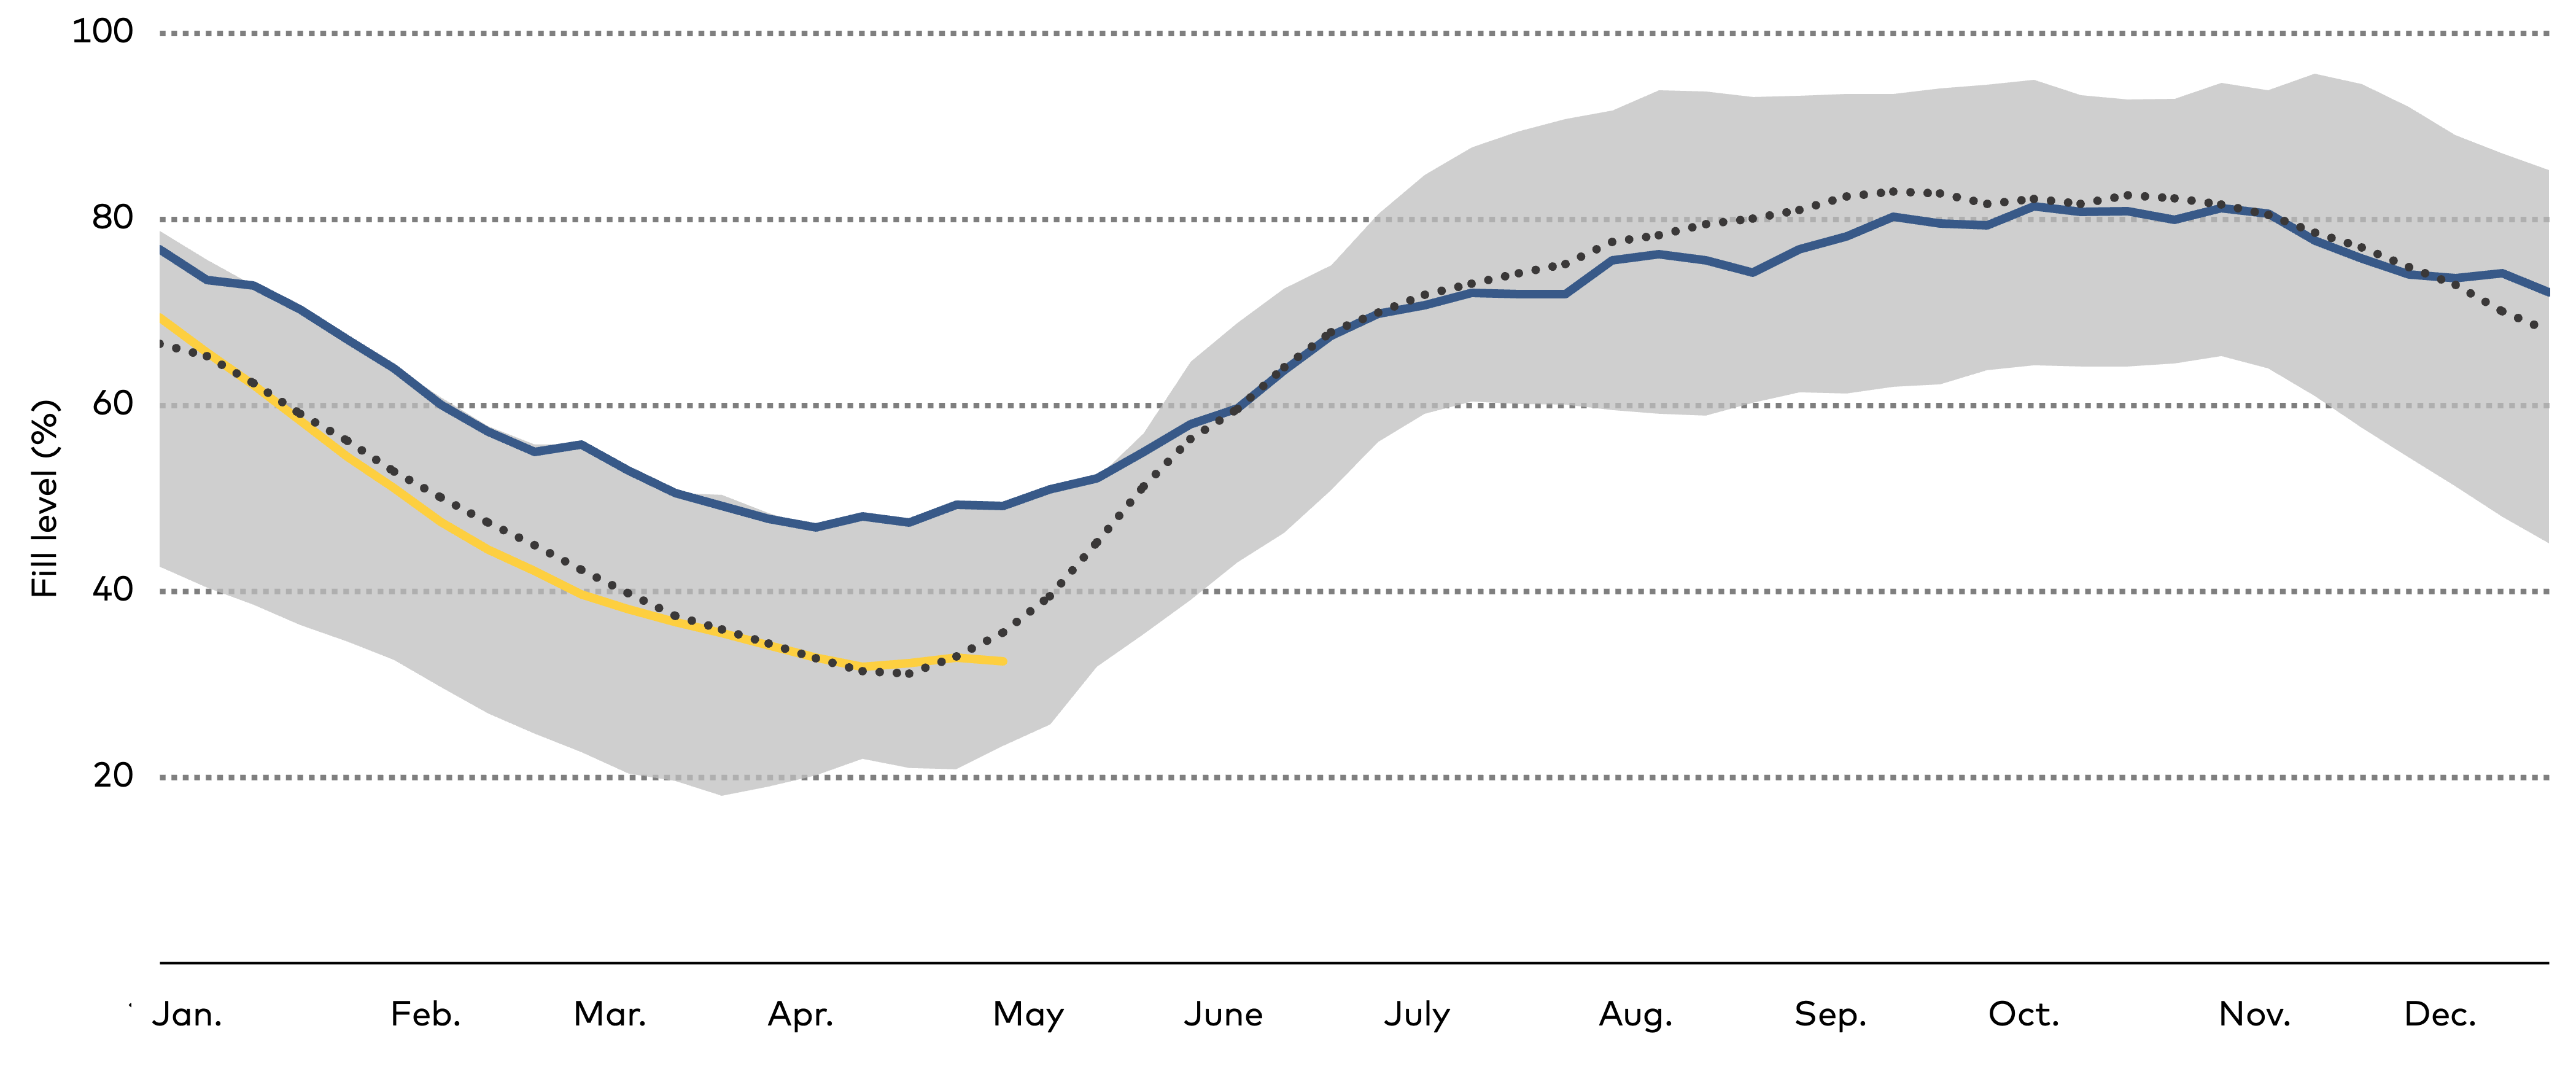
Source: The Norwegian Water Resources and Energy Directorate (NVE)
Notes: Shaded area is between the weekly minimum and maximum fill levels of the last twenty years; the dotted line is the median weekly fill level, which is a more representative metric than the mean because extreme values can skew it.
Water levels in hydro reservoirs follow a clear seasonal pattern. Electricity demand during the winter heating season draws down storage while snow accumulates. By spring, reservoir levels reach their minimum. Through summer, melting snow refills storage as electricity demand remains low. By autumn, rainfall determines the maximum fill level before the next winter season begins.
The storage fill levels of the last twenty years do not show a strong correlation with recent record-warm years. Even so, a changing climate is likely to put pressure on seasonal storage over the long term. If average rain- and snowfall decreases, so does the average peak fill level, while overall growth in electricity demand is likely to push winter demand higher. The minimum water flows of each reservoir are also strictly regulated. Less dispatchable hydropower capacity is therefore likely to be available to the Nordic and European electricity markets over the longer term.
5.3 Electricity infrastructure integration between the Nordics
Geographically the Nordic electricity systems split into the interconnected mainland (Denmark, Finland, Norway, Sweden, with Åland connected through Finland) and the Island Energy Systems of Iceland, the Faroe Islands and Greenland. The Faroe Islands and Greenland operate small distributed grids rather than a single national grid, with Greenland comprising a set of standalone microgrids tied to coastal settlements.
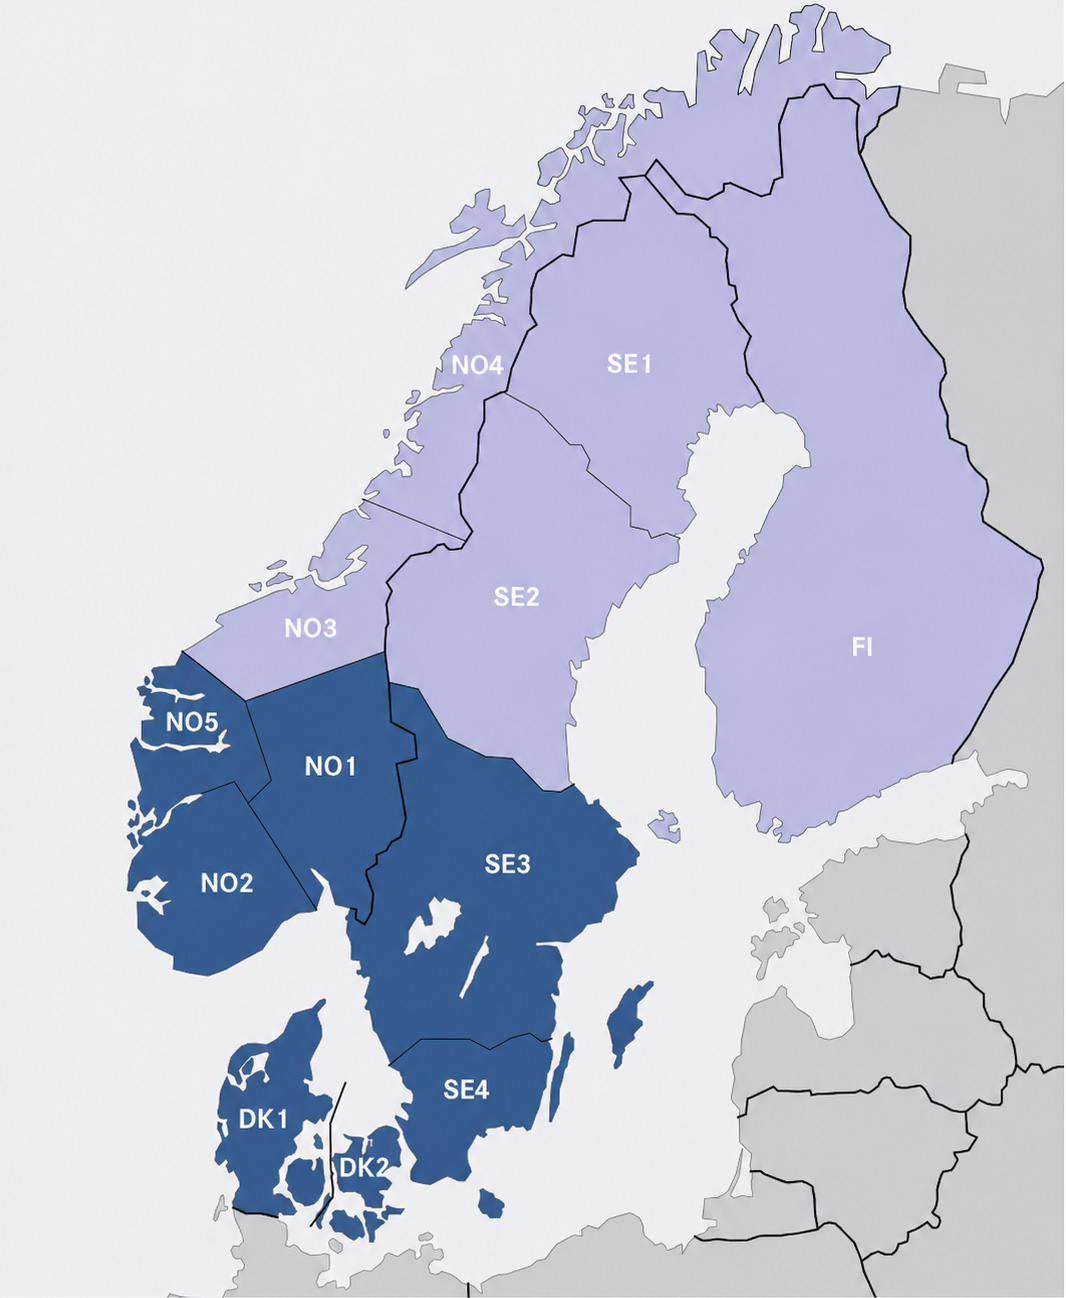
Within the integrated mainland market, transmission capacity has not kept pace with the changing geography of generation and consumption. The dominant flow is now on north–south corridors: hydro and onshore wind sit predominantly in the north of Norway and Sweden, while industrial and population centres are in the south. The result is the splitting of countries into bidding zones (see detailed definition and methodology in Annex 1), with Norway operating five and Sweden four (Figure 5.9). Finland is the only continental Nordic country still operating as a single bidding zone, and the Nordic electricity transmission system operators (TSOs) proposed to maintain the existing zone configuration in the 2025 ENTSO-E review.
Source: Statnett, Nordic Grid Development Perspective 2025, www.statnett.no
Notes: Iceland forms its own price area (IS) but has no interconnections.
Prices in adjacent bidding zones can diverge considerably, and grid congestion is the primary reason why the divergence happens. Nordic countries simultaneously import and export large volumes of electricity. Sweden was the largest net exporter in 2024 (32 TWh) followed by Norway (18 TWh). Denmark, situated geographically between the Nordic and continental grids, runs large flows in both directions and was a small net importer. Across the region, the Nordics were a net exporter of about 45 TWh, mostly to Germany and Great Britain.
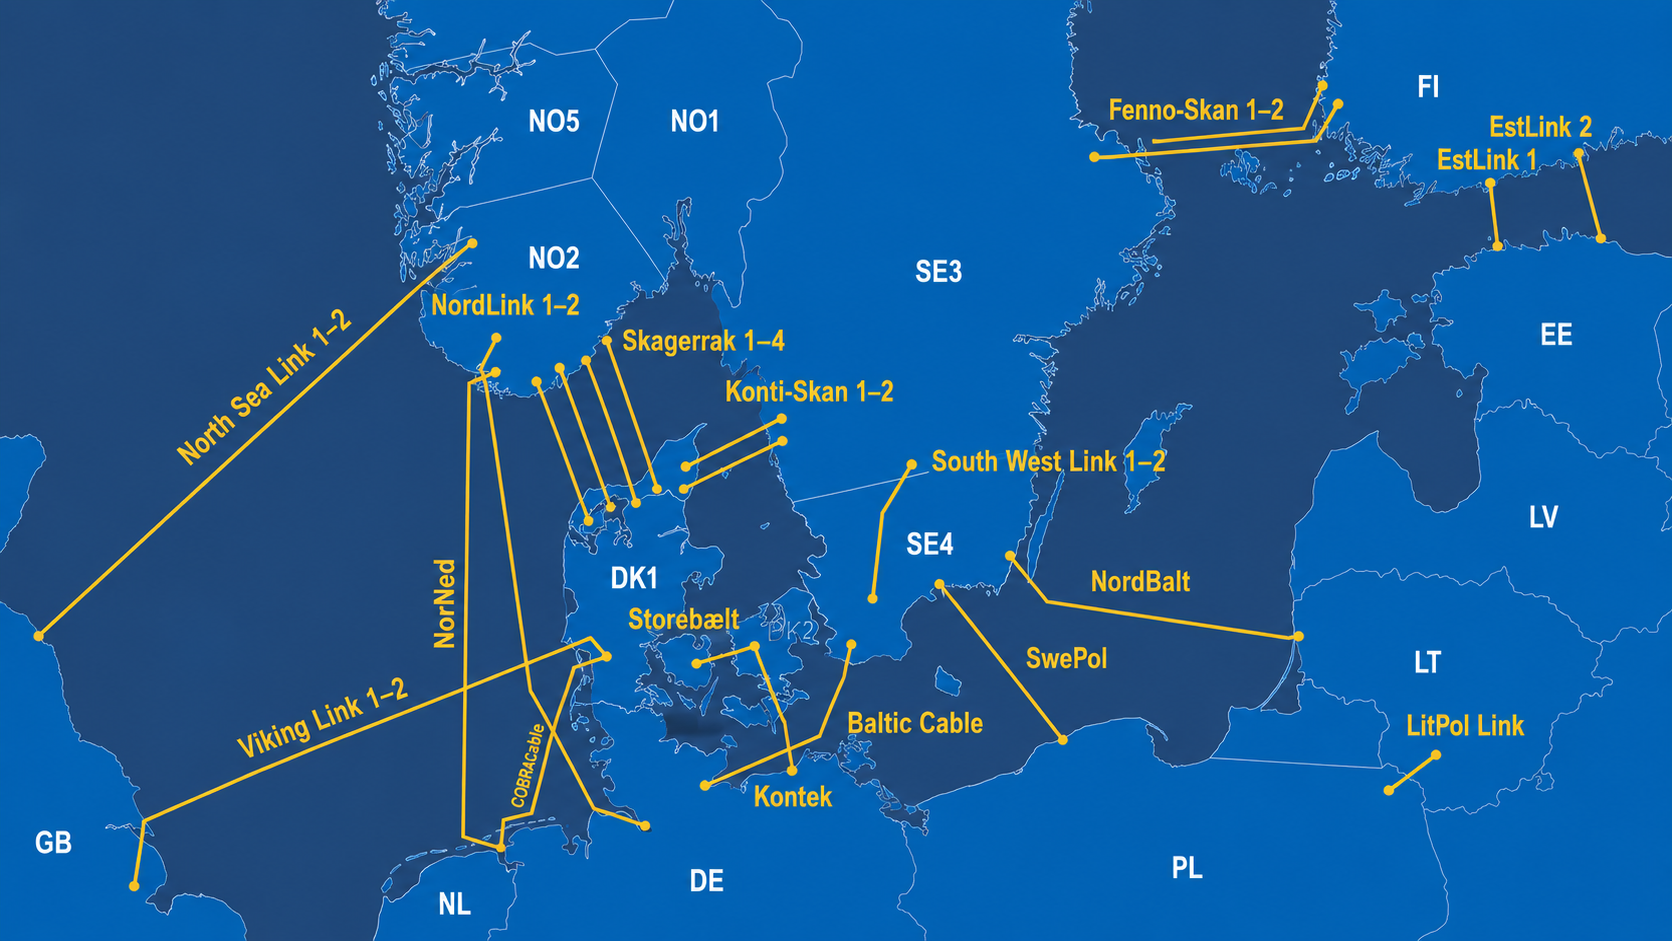
The cross-border infrastructure that supports this trade combines high-voltage direct current (HVDC) interconnectors and, in the Danish case, high voltage alternating-current (HVAC) connections to Germany (for detailed terminology on interconnectors, see Annex 1). The current map of HVDC interconnections is shown in Figure 5.10. The interconnectors are what allow the Nordic system to function as a single market and what make Norwegian and Swedish hydro reservoirs available as a flexibility resource for the wider European system.
The European Commission requires each EU member state to be able to import the equivalent of at least 15 per cent of its installed generation capacity from neighbours.
This is the headline measure of how well connected a country is to the wider European grid. As of 2026, all three Nordic EU members meet the target. The path to get there has not been straightforward. As wind and solar capacity grew rapidly over the past decade, cross-border transmission did not keep pace, and both Finland and Sweden dipped below the 15 per cent threshold for several years. Denmark has remained well above it throughout, reflecting its position as a transit hub between the Nordic and continental European grids.
European Commission, Electricity interconnection targets, European Commission, Electricity interconnection targets, https://energy.ec.europa.eu/topics/infrastructure/electricity-interconnection-targets_en
The politics of building interconnections complicate the technical picture. While more cross-border capacity raises system-level resilience and efficiency, the effects are uneven: in energy-producing regions, integration pushes prices up towards the system average, which is politically contentious. This tension has been visible in Norway, where the current government has resisted renewing ageing cables linking Norway with Denmark rather than face the domestic political cost of higher electricity prices that interconnection brings. Similar concerns were on display in Sweden in May 2026, when Energy Minister Ebba Busch ordered Sweden’s TSO Svenska kraftnät to halt work on Konti-Skan Connect, a planned renewal and expansion of the HVDC links between south-western Sweden and Denmark.
The gap between what the system needs technically and what politics will currently deliver is one of the defining structural tensions in Nordic electricity security.
Reuters (2026), 'Sweden pauses plans for new power cable to Denmark', 8 May 2026, https://www.reuters.com/business/energy/sweden-pauses-plans-new-power-cable-denmark-2026-05-08/
Country | 2021 | 2022 | 2023 | 2024 | 2025 | 2026 |
|---|---|---|---|---|---|---|
Denmark | 45.8 | 42.7 | 41.3 | 36.0 | 36.5 | 35.5 |
Finland | 24.2 | 24.0 | 20.1 | 15.5 | 15.2 | 18.4 |
Sweden | 16.4 | 14.3 | 12.8 | 12.8 | 11.4 | 15.5 |
Source: European Commission, electricity interconnection targets (DG ENER calculations based on import interconnection capacity and generation capacity reported for 10 January 2026, 19:00), via ENTSO-E Winter Outlook 2025–2026.
The 15 per cent cross-border interconnection headline target is complemented by three further tests that give a more practical read on whether the grid is working for consumers and the energy transition. The first asks whether electricity prices in neighbouring zones stay reasonably close to each other. The EU Commission's benchmark is a gap of no more than €2 per megawatt-hour. The second asks whether countries can import enough to meet peak demand if their own generation falls short. The third asks whether export capacity is sufficient to carry renewable electricity to where it is needed. On the first and most visible of these tests, the Nordics are well outside the benchmark: price differences between adjacent bidding zones routinely and significantly exceed €2/MWh, as Figure 5.11 shows. The Nordic electricity system is interconnected but far from a unitary system, and that constraint limits how much the Nordics can support each other when electricity production in one country comes under sustained strain.
Source: Author's calculations based on Nord Pool monthly aggregate wholesale prices.
Notes: Prices expressed as 12-month moving averages. In 2023, prices were recovering from the shock caused by the war in Ukraine. Reference threshold of €2/MWh under the European Commission interconnection adequacy test shown in grey. All five sample bidding-zone pairs exceed the threshold in most months; the FI–NO4 differential averaged over €30/MWh through 2024 and 2025.
5.4 Supply chain vulnerabilities and the energy transition
Where hybrid action and natural hazards manifest in specific events, supply chain risk is a chronic exposure that becomes acute only when an asset fails and the time required to replace it determines the duration of the outage.
Three categories of electricity equipment carry concentrated supply chain risk for Nordic operators. Large power transformers have replacement lead times of twelve to eighteen months and are manufactured by a small number of global suppliers.
HVDC cables and converter station equipment have even longer lead times and depend on manufacturing capacity that is more limited still. Wind turbine components, including nacelles, main bearings, and transformer subsystems, have lead times of six to eighteen months.
Wind power now forms a substantial share of Nordic installed generation capacity, which means wind-component supply chain vulnerability is a systemic issue rather than a marginal technology challenge.
National Infrastructure Advisory Council (2024), Addressing the Critical Shortage of Power Transformers to Ensure Reliability of the U.S. Grid, https://www.cisa.gov/sites/default/files/2024-09/NIAC_Addressing%20the%20Critical%20Shortage%20of%20Power%20Transformers%20to%20Ensure%20Reliability%20of%20the%20U.S.%20Grid_Report_06112024_508c_pdf_0.pdf
National Infrastructure Advisory Council (2024), Addressing the Critical Shortage of Power Transformers to Ensure Reliability of the U.S. Grid, https://www.cisa.gov/sites/default/files/2024-09/NIAC_Addressing%20the%20Critical%20Shortage%20of%20Power%20Transformers%20to%20Ensure%20Reliability%20of%20the%20U.S.%20Grid_Report_06112024_508c_pdf_0.pdf
5.5 Nordic electricity security cooperation
Nordic electricity cooperation is the region’s most institutionally mature energy security cooperation domain by a significant margin, and at the same time the one whose mandate is most visibly mismatched with the post-2022 threat environment. Four layers carry the architecture: the market and operational coordination layer (5.5.1), the system complexity and cascade-risk layer (5.5.2), the cybersecurity layer (5.5.3), and the physical-protection and emergency-response layer (5.5.4). Across all four layers the same pattern recurs: the operational-efficiency mandate is well developed, the threat-response mandate is consultative, and the gap between the two is widening as the system electrifies further. The trilemma trade-off here sits primarily between affordability (which integration delivers) and security (which integration partially undermines through new exposure channels).
5.5.1 Electricity market integration
Two interlocking structures underpin Nordic electricity market integration: Nord Pool as the common market platform and the Nordic Regional Coordination Centre (RCC) as the operational coordination centre. Both have direct but distinct implications for energy security, and in each case the security dimension is currently either underdeveloped relative to the market-efficiency mandate or absent altogether.
5.5.1.1 Nord Pool: the shared electricity market platform
Nord Pool is the commercial exchange that hosts Nordic wholesale electricity trading. It is not a system operator: it runs the auctions on which generators, suppliers and traders buy and sell electricity, and it publishes the resulting prices and volumes, but the physical grid is operated by the national TSOs (Statnett, Svenska kraftnät, Fingrid, Energinet and Landsnet), and security of supply, balancing and emergency response sit with them and with their national authorities.
Nord Pool originated in 1991 with Norway's deregulation of the power sector. It opened to Sweden in 1996 to become the world's first multinational electricity exchange, and progressively integrated Finland, Denmark, the Baltic States and a widening set of Continental and UK markets in the years that followed. Today Nord Pool runs day-ahead and intraday auctions across 15 European countries and 21 bidding zones, making it Europe's largest power exchange by traded volume.
Nord Pool, How does a power exchange work?, https://www.nordpoolgroup.com/en/the-power-market/how-does-a-power-exchange-work/
The ownership structure reflects the same division of roles. Nord Pool is jointly owned by Euronext and TSO Holding, which represents the Baltic and continental Nordic TSOs (Energinet, Fingrid, Statnett, Svenska kraftnät and Litgrid). The Nordic and Baltic TSOs therefore retain a direct ownership stake in the exchange that prices their physical electricity flows, while Euronext provides the wider European market infrastructure.
Nord Pool, About us, https://www.nordpoolgroup.com/en/About-us/
Three operational layers are particularly relevant for energy security. The day-ahead auction sets bidding-zone prices for every hour of the following day. The intraday market then runs continuously up to delivery, allowing market participants to rebalance against changes in wind output, demand, or power generation availability. Underlying both is the Nordic system price, which serves as the reference price for most financial contracts and as the analytical baseline for assessing congestion costs across the region.
The bidding-zone footprint is the geography of price-based adjustment. Norway is divided into five zones (NO1–NO5), Sweden into four (SE1–SE4), Denmark into two (DK1–DK2), with Finland operating as a single zone. Within this footprint, price-based dispatch and market coupling produce the structural effect that matters most for security: when Finnish demand spikes during a midwinter cold snap, the resulting price signal pulls in commercial offers from Sweden and Norway in the same hour, and the TSOs accommodate the resulting flows on the physical grid. Market coupling, operated by the platform, makes this work, while system operation, run by the TSOs, ensures the resulting flows can actually be delivered. In normal conditions, this combination is the system's primary resilience layer, and it functions to a degree that few other parts of the European grid can match.
Energy security functions sit alongside the trading platform in two specific forms. First, Nord Pool runs a market surveillance function under REMIT, the EU Regulation for Wholesale Energy Market Integrity and Transparency, with a dedicated team that monitors trading for insider trading and market manipulation.
This is not energy security in the physical-supply sense, but it is the integrity layer that gives the price signal its credibility and is a critical precondition for trusting market coupling as a security mechanism rather than only as an efficiency mechanism. Second, the data feeds Nord Pool publishes, from bidding-zone prices, capacities, and hydro reservoir levels to regulating-power volumes, are the public reference data on which adequacy assessments, regulatory monitoring and system-stress diagnosis across the Nordic region rely. The exchange does not coordinate emergency response, hold reserves, or run a security-of-supply function in its own right; those functions sit with the TSOs and the dedicated preparedness mechanisms discussed in Section 5.5.4.
Nord Pool, Market surveillance, https://www.nordpoolgroup.com/en/trading/Market-surveillance/
The way market coupling transmits Continental European price shocks into the Nordic region is the clearest affordability-side trade-off in this architecture. The affordability dimension of Nord Pool integration is a structural feature, not a flaw, and its political management is a Nordic-level concern.
5.5.1.2 ENTSO-E and the Nordic Regional Coordination Centre
The Nordic Regional Coordination Centre (Nordic RCC) is the most institutionally mature element of Nordic energy security cooperation. Headquartered in Copenhagen, it is an independent A/S company owned equally by the four mainland Nordic TSOs, and it employs over a hundred staff full-time, plus more than 150 staff seconded from the four TSOs.
Iceland's national TSO operates outside the Nordic RCC because Iceland's grid has no physical connections to mainland Europe.
Nordic Regional Coordination Centre, About / Team, https://nordic-rcc.net/about/team/
The Nordic RCC delivers the regional coordination services mandated by EU Regulation 2019/943 on the internal electricity market and Regulation 2019/941 on risk-preparedness in the electricity sector: coordinated capacity calculation, coordinated security analysis, outage planning coordination, short-term adequacy forecasts, and a critical grid situation function for cross-regional coordination during emergencies. Real-time operation of the grid, including all control room functions, declaration of system states, dispatch of reserves and emergency switching, remains the responsibility of the national TSOs. The Nordic RCC supports the TSOs; it does not replace them.
In the survey conducted for this project, operational coordination of this type, particularly the timely exchange of operational data, was the most positively assessed sub-dimension of any cooperation domain examined, with TSO respondents typically rating it as already well developed or as adding high value with room for further development.
Regulation (EU) 2019/943 on the internal market for electricity and Regulation (EU) 2019/941 on risk-preparedness in the electricity sector, https://eur-lex.europa.eu
Survey of Nordic energy security cooperation conducted for this project, 2026.
The Nordic RCC's mandate is operational efficiency, not security in the threat-and-response sense. It coordinates market coupling, congestion management and security analysis in the technical, system-operations sense, but not comprehensively in terms of threat intelligence, hybrid incident response, or physical protection.
5.5.2 System complexity and cascade risk
As the Nordic power system electrifies further, the share of inverter-based generation rises, and market coupling tightens, the system's exposure to fast-propagating technical cascades grows. The hazard is distinct from cyber attack: cascades arise from the system's own physical and protective dynamics under stress, not from a hostile actor, but they propagate in similar timescales and can affect the system within minutes.
The April 2025 Iberian peninsula blackout exemplifies the dangers of technical cascade events associated with a digitalized and complex system. A sequence of voltage and frequency disturbances on the Iberian network propagated to a system-wide outage within minutes, with millions of customers affected across Spain and Portugal. The post-event investigation by ENTSO-E and the Spanish and Portuguese system operators identified the interaction between high inverter-based generation, reduced system inertia, and protective relay behaviour as central to the cascade dynamics.
The Nordic system has structurally similar features: rising inverter-based-resource shares, increasingly tight market coupling that lets disturbances propagate quickly across borders, and an operational baseline built on the assumption that the system retains enough conventional inertia to ride through disturbances. None of these assumptions is permanent as electrification and the uptake of variable renewable generation advance. The Iberian event is therefore a relevant scenario for Nordic risk planning.
ENTSO-E (2025), Investigation report on the 28 April 2025 Iberian blackout, https://www.entsoe.eu/publications/blackout/28-april-2025-iberian-blackout/
Cascade preparedness is fundamentally a TSO and regulator function, with ENTSO-E as the pan-European analytical layer. The Nordic Regional Coordination Centre coordinates capacity calculation, security analysis, and short-term adequacy forecasts, but is not currently mandated to lead Nordic-specific cascade scenario testing or to apply Iberian-style lessons across the integrated Nordic-Baltic synchronous area.
The Nordic value-add is therefore in regional implementation: joint scenario testing of inverter-based-resource and inertia dynamics under transition pathways, shared protection-relay coordination assumptions across the four mainland TSOs, and a common operational baseline for the post-2025 system. The analytical framework already exists at the ENTSO-E level. What is missing is the Nordic-level instruction to use it for shared adequacy and cascade-resilience exercises on a recurring basis.
5.5.3 Cybersecurity cooperation
The cyber threats affecting the Nordic power system include intrusion into operational technology such as grid control systems, ransomware on energy company IT systems that cripple operational technology, supply-chain software attacks on energy management platforms, and state-sponsored mapping of infrastructure for potential future physical or cyber action.
The structural feature of the Nordic system is that the same digital integration that delivers operational efficiency through market coupling and the balancing infrastructure that lets surplus in one bidding zone backstop deficit in another also multiplies the attack surface. Resilience through integration and exposure through cyber transmission scale together.
European Commission, Critical infrastructure and cybersecurity, https://energy.ec.europa.eu/topics/energy-security/critical-infrastructure-and-cybersecurity_en
The EU CyCLONe network and NIS2 obligations provide the baseline information-sharing and reporting framework for cybersecurity incidents within the EU, and Norway has been implementing the regulation since October 2025.
In terms of practical Nordic cybersecurity cooperation, the Nordic CISO network (an informal peer network of CISOs of Nordic TSOs and major energy operators, meeting through monthly calls and biannual in-person sessions) facilitates exchange of cyber threat information at practitioner level.
Directive (EU) 2022/2555 (NIS2 Directive), https://eur-lex.europa.eu/eli/dir/2022/2555
Interview with senior Nordic energy official, conducted for this project, 2026 (not for attribution).
An institutional layer above the CISO network was added in October 2024, when the four mainland Nordic TSO CEOs formalised an existing informal cooperation as the Nordic Security Group (NordSec).
NordSec sits under the Nordic CEO arrangement and is intended to strengthen security and preparedness coordination among Energinet, Fingrid, Statnett and Svenska kraftnät before and during crises affecting more than one Nordic TSO. It is the most direct institutional response by Nordic TSOs to the post-2022 hybrid threat environment, even while its initial scope is consultative rather than operational.
Svenska kraftnät (2024), 'Nordic cooperation in the security and preparedness area', https://www.svk.se/en/about-us/news/news/nordic-cooperation-in-the-security-and-preparedness-area/
Both mechanisms still operate as strategic discussion forums rather than operational information-sharing systems. Current mechanisms do not yet have the legal frameworks or classification arrangements that would enable real-time exchange of incident data, active vulnerability details, or attack signatures. The gap between strategic discussion and operational sharing is the principal unresolved challenge in Nordic cyber energy security cooperation.
The CRESCENDO initiative, launched in 2025 under the EU Digital Europe Programme, complements these mechanisms at project level. It links the National Coordination Centres of Norway and Finland, the Norwegian University of Science and Technology, and the Danish Energy Agency to deliver Nordic energy sector cybersecurity capacity-building aligned with NIS2 and CER Directive obligations.
CRESCENDO is project-based and time-limited, not a standing operational framework, but it demonstrates that Nordic cyber energy cooperation can attract EU co-funding when it has a defined deliverable.
CRESCENDO project, https://www.project-crescendo.eu/
5.5.4 Physical infrastructure protection and emergency electricity architecture
5.5.4.1 Bilateral interconnector maintenance arrangements
Cross-border interconnectors are governed by bilateral operation and maintenance agreements between the relevant TSOs. These agreements cover normal operational protocols, planned maintenance windows, incident notification chains, and emergency response contacts. They function adequately for peacetime operations and are well embedded in the working relationships between Nordic TSOs.
The bilateral and multilateral operation agreements were not fully designed for the post-2022 threat environment. The Nordic System Operation Agreement, which governs cross-border operational protocols and is updated on a rolling basis, addresses contingencies in the technical sense, such as fault conditions, frequency deviations, and restoration sequences, but the agreement contains no provisions for hybrid attacks, coordinated multi-asset disruption, or the involvement of state-sponsored actors.
The four mainland TSOs recognised this gap and responded at the institutional level by creating NordSec in October 2024 (discussed in Section 5.5.3), but that is a coordination forum, not an updated operational protocol. The gap between what the existing mandates cover and what the current threat environment requires has not yet been fully closed.
ENTSO-E, Nordic System Operation Agreement – Main Agreement, https://eepublicdownloads.entsoe.eu/clean-documents/SOC%20documents/Nordic/Nordic%20SOA_Main%20Agreement.pdf
5.5.4.2 NordBER and the bilateral Nordic emergency electricity architecture
NordBER provides a framework for preparedness coordination against power disruptions across Denmark, Finland, Iceland, Norway and Sweden. It brings together the TSOs and the national authorities responsible for electricity transmission and distribution contingency for regular meetings on information exchange, regional drills and exercises, and policy coordination. The framework has been used to set up cross-border coordination mechanisms during large-scale energy shortages affecting one of its members, and it is the practical channel through which Nordic preparedness officials maintain a shared operating picture between crises.
Danish Energy Agency, Risk preparedness and Nordic cooperation, https://ens.dk/en/supply-and-consumption/risk-preparedness
Complementing NordBER are the bilateral emergency electricity sharing agreements between Nordic TSOs that underpin mutual support during electricity shortfalls. Norway's Statnett and Sweden's Svenska kraftnät, for instance, maintain longstanding arrangements that allow emergency power transfers above normal commercial capacity limits during declared crisis situations.
Equivalent bilateral protocols connect Finland's Fingrid with both Svenska kraftnät and Statnett. These bilateral arrangements are the operational foundation; NordBER is the multilateral coordination layer above them that lets all five countries plan and exercise together.
Statnett (2021), 'New measures ensure better capacity between Norway and Sweden', https://www.statnett.no/en/about-statnett/news-and-press-releases/news-archive-2021/new-measures-ensure-better-capacity-between-norway-and-swedenny-side/
The combined architecture is a genuine Nordic asset. It was, however, designed for the pre-2022 threat environment. NordBER and the underlying bilateral agreements contain no specific provisions for suspected hybrid attacks on interconnectors, for coordinated disruption of multiple assets, or for the involvement of third-country state actors. The question of coordinated multi-asset disruption is, however, beginning to be addressed at the national level. Norway's energy regulator NVE has recently consulted on requiring grid operators to plan for simultaneous sabotage of at least two installations, a direct departure from the weather-and-technical-failure baseline that NordBER was designed around.
What does not yet exist is the Nordic-level equivalent: a shared framework for what happens when the same stress event hits multiple countries at the same time, and a multilateral operational layer capable of rapid response to incidents that cross borders.
Reuters (2025), 'Norway's power grid operators asked to sharpen sabotage preparedness', 17 December 2025, https://www.reuters.com/sustainability/boards-policy-regulation/norways-power-grid-operators-asked-sharpen-sabotage-preparedness-2025-12-17/
5.6 Electricity security: key findings for the Nordics
The Nordic electricity system is one of the cleanest large power systems in the world, but its security profile is more demanding than its low-carbon credentials suggest. Weather-dependent sources now account for nearly three quarters of generation, and the system's adequacy in any given winter depends on hydrological conditions, wind output and temperature simultaneously moving in a favourable direction. The ENTSO-E adequacy modelling points to the early 2030s as the period of highest risk, as demand growth from electrification outpaces new supply and grid build-out.
The interconnected nature of the system is both its greatest strength and a source of structural tension. Cross-border flows allow Norwegian and Swedish hydro to balance variable wind across the region and beyond, and interconnectors have repeatedly cushioned national shortfalls. At the same time, the north-to-south transmission bottlenecks within Norway and Sweden mean that cheap renewable generation in the north does not reliably reach consumers in the south, producing persistent and large price differentials between bidding zones that sit well outside the EU's market integration benchmarks. Resolving this requires transmission investment on a scale and timeline that none of the Nordic countries has yet fully committed to.
The demand side adds further pressure. All national scenarios project substantial electricity demand growth, driven mainly by industrial electrification and transport. New demand can come online in one to two years; new transmission lines take seven to eight. That gap is the central structural risk for Nordic electricity security over the next decade, and it is one that no single country can manage in isolation.
The cooperation architecture is the deepest in the Nordic energy security space, and at the same time the architecture whose mandate gap is widest. Nord Pool and the Nordic RCC provide a market-and-operations layer that few European regions can match, but neither is mandated for security in the threat-and-response sense. The cascade-risk picture set out in Section 5.5.2 is a Nordic implementation problem on top of an ENTSO-E analytical framework that already exists.
The cybersecurity picture in Section 5.5.3 is one of working practitioner cooperation through the CISO network and a new TSO-level layer in NordSec, neither yet operational for real-time information sharing. The physical-protection picture in Section 5.5.4 rests on a NordBER and bilateral architecture designed before the post-2022 threat environment. In trilemma terms, electricity is where affordability and security trade-offs are sharpest and where Nordic cooperation has both the most existing infrastructure and the largest single backlog of unfinished work. Section 8 takes the resulting recommendations forward.