7. Greenland
Introduction
With Greenland spread over a very large area and long distances between cities, fishing takes place across a vast area. Since 95% of the population inhabits West Greenland from Upernavik to Nanortalik, most fishing occurs in Davis Strait and Baffin Bay, but it also occurs in East Greenland waters. Commercial fishing is largely absent north and northeast of Greenland due to sea ice for most of the year and the lack of settlement in these areas. Fishing takes place both in coastal areas with smaller vessels and in offshore waters with large trawlers equipped with onboard processing. Fishing in the Greenlandic zone is also conducted by foreign vessels under fishing agreements with the EU, Norway, the Faroe Islands, and Iceland. Foreign vessels typically don’t land their production in Greenland. Moreover, Greenlandic vessels fish in Norwegian, Faroese, and Icelandic zones following these agreements.
While smaller coastal vessels land all their catches in Greenland, large offshore shrimp trawlers have processing onboard. These vessels process sea-cooked whole shrimp, cooked and finally packed onboard and directly exported when landed. The same applies to offshore vessels fishing for halibut and cod. Offshore vessels earn most of their revenue from sea-cooked whole shrimp processed onboard (Nielsen et al., 2017). However, to ensure jobs on land, offshore vessels are obliged to land a share of their catch for further processing at land-based factories in Greenland. This obligation is typically 25%.
Fishers must land in Greenland to the government-owned company Royal Greenland's or to private factories or wohlesalers. Royal Greenland has a stated obligation to maintain landing opportunities locally. Royal Greenland is the largest processing and wholesale company, which also owns its own fishing fleet, with factories in several cities, as well as companies and sourcing, processing, and sales activities also in Denmark and several other countries. The largest private company is Polar Seafood, which also owns a number of vessels and land-based factories. It also operates in wholesale. Polar Seafood also prevails in Denmark and other countries. Moreover, a few companies own a large offshore vessel with onboard processing. Finally, a number of relatively small private processing and wholesale companies exist, founded on, among other things, Greenland halibut (Reinhardtius hippoglossoides, also known as halibut) and cod.
The seafood value chain revealed in this chapter include fishing of all Greenlandic vessels, both in Greenlandic waters and elsewhere. Catches of foreign vessels fishing in Greenlandic waters are also mentioned, but since typicall ynot landed in Greenland not included in the value chain. The seafood value chain starting in Greenland is mostly for human consumption. However, Greenlandic fishing for capelin takes place in the Icelandic zone, in accordance with the capelin agreement with Iceland and Norway. Moreover, blue whiting is caught in the Faroese zone and in international waters. Both species are for reduction, but they are all landed directly in Iceland and at the Faroe Islands and never come to Greenland.
The overall contribution of the seafood value chain within the country is shown in Table 1, including all domestic fishing, processing, and wholesale activities. The most recent numbers are from 2022.
2019 | 2020 | 2021 | 2022 | |
Turnover (DKK Million) | 6,782 | 5,928 | 6,331 | 7,756 |
EBIT (DKK Million)1 | 819 | 26 | 566 | 840 |
Gross value added (DKK Million)2 | 2,796 | 1,917 | 2,582 | 3,118 |
Employment (no. persons) | 2,778 | 2 ,57 | 2,710 | 2,739 |
Table 7.1: Key economic numbers for the Greenlandic fishery, seafood processing, and trade, 2019–2022, current values. Notes:
1: EBIT is Earnings Before Interest and Taxes.
2: Gross value added is a measure of the contribution of the value chain to the Gross Domestic Product, calculated as turnover minus operating costs excluding salary costs, depreciation, and interest.
Sources: Statistics Greenland (2026a).
In 2022, the turnover of all domestic fishing, processing, and wholesale activities was DKK 7.8 billion, EBIT (profit) DKK 840 million, and gross value added (contribution to GDP) DKK 3.1 billion. The seafood value chain accounts for 13.9% of Greenlandic GDP, which amounts to DKK 22.3 billion, indicating that these activities are important to the Greenlandic economy. Further accounting for the revenue from resource rent taxation in fisheries in 2022 of DKK 480.6 million and correcting for the subsidy from Denmark to Greenland of DKK 3.9 billion, the seafood value chain contributes 19.5% of all economic activities in Greenland. In 2023, 275 fishing vessels were longer than 6 meters (Government of Greenland 2025).
The employment in fisheries registered in 2022 was 2,739 persons, corresponding to 14.8% of the total employment. Statistics Greenland (2026b) further identifies the total number of persons with main occupation in fishing, seafood processing, and seafood trade in 2023 to be 4,483 persons, corresponding to 15.3%. The Fisheries Commission (2021) identifies employment in seafood processing and trade as 1,560, and the Government of Greenland (2025) states that the number of dinghy fishers in 2023 is 1,922, but further states that most of these have a main occupation in other sectors. Dinghies include vessels with an overall length of less than 6 meters.
Shrimp is the most economically important species, as shown in Table 2 for 2019.
Firms (number) | Vessels/factories (number) | Turnover (DKK million) | EBIT (DKK million) | Employment (persons 2017) | |
Offshore shrimp vessels | 5 | 9 | 1,300 | 398 | 336 |
Coastal shrimp vessels | 20 | 20 | 732 | 146 | 244 |
Land-based shrimp factories | 2 | 4 | 1,421 | 102 | . |
Total | 27 | 33 | 3,453 | 646 | 580 |
Table 7.2: The shrimp value chain, 2019. values in nominal terms
Source: Fisheries Commission (2021).
Shrimp is the most economically important species, as shown in Table 2 for 2019. The turnover in the shrimp value chain is DKK 3.5 billion, corresponding to half of the total turnover (Table 1). EBIT forms DKK 646 million, corresponding to 79% of EBIT in the seafood value chain. Hence, shrimp is the most important part of the seafood value chain, comprising only 29 vessels and 4 land-based factories specializing in shrimp. The 9 large offshore trawlers have a permit allowing them to process 75% of their catch on board, while they are obliged to land 25%. Most of the 20 coastal shrimp trawlers land all their catches at the land-based factories, while a few of them have permits to produce 30% onboard. The largest employment in shrimp fishing is on offshore processing trawlers, with 336 employees, while on coastal shrimp trawlers below 80 gross tonnages (GT), there are 244 employees.
Halibut and cod are also important for offshore, coastal, and dinghy vessels. Typically, halibut and cod are targeted by the same vessels. Eight offshore processing vessels hold licenses for halibut, cod, and redfish in West and East Greenland, while two hold licenses for cod, haddock, and saithe in the Barents Sea, following the agreement with Norway. Coastal vessels targeting halibut and cod fish mainly in West Greenland in the Bay of Disco and in the Fiords of Uummannaq and Upernavik. In 2020, 160 licenses were issued for cod and 146 for halibut; however, many vessels hold licenses for both species. Also in 2020, dinghies were fishing in the same areas, with 1,129 licenses for cod and 1 057 for halibut.
Other fisheries also prevail. Offshore vessels are fishing for pelagic species, based on six licenses for capelin in the Icelandic zone, based on the agreement with Iceland, and herring, mackerel, and blue whiting in the Faroese zone and in international waters, based on the agreement with the Faroe Islands. These fisheries, however, are only seasonal side activities, carried out by the same offshore vessels that target halibut and cod most of the year.
The total employment in 2019 at land-based processing factories and wholesale companies is 1,560 persons (Fisheries Commission 2021). The largest activity of those is in the four shrimp factories, but employment also prevails in the many small landing places locally.
Regulations and management
Greenlandic fisheries are regulated independently. The regulation is based on total allowable catches (TACs), where TACs are fixed after accounting for a foreign share, where applicable. This concerns mainly Canada in the west and Iceland in the east. Moreover, a bilateral agreement is in place with the EU, granting quotas to EU vessels in Greenland in return for free access to the EU market and an annual payment from the European Commission. Furthermore, an agreement exists with Norway, allowing two Greenlandic vessels to fish in the Norwegian zone in the Barents Sea mainly for cod, in return for Norwegian vessels fishing in Greenland. An agreement also prevails with the Faroe Islands, exchanging fishing opportunities in each other's zones, and a trilateral agreement exists on capelin fishing in the Icelandic zone with Iceland and Norway.
The shrimp TAC is allocated to fishers under the individual transferable quota scheme, in which each company has the right to catch a specified share of the TAC. The rights are freely transferable, permanent, and annual, except that shrimp trawlers with a capacity below 80 GT cannot sell permanent rights or annual quotas to offshore vessels. This rule prevails in ensuring employment in the coastal fleet and on the land-based factories, where coastal vessels deliver their full catch.
The halibut fishery is also regulated by TACs. TACs are set separately offshore in the Davis Strait and the Baffin Bay, separately inshore in the three areas, the Bay of Disco, Uummannaq, and Upernavik, and a TAC is set for East Greenland. The inshore fisheries are regulated by individual transferable quotas for vessels above 6m, while dinghies have an Olympic fishery but can voluntarily choose to become part of the individual transferable quota system from 2025. Offshore vessels have no access to inshore areas. Offshore halibut fisheries are regulated by individual quotas allocated year by year both in East and West Greenland.
Cod fisheries are regulated by an inshore TAC for the whole area of West Greenland. A minor part is reserved for leisure fishing, with the remaining part for commercial fishers forming an Olympic fishery for licensed vessels, meaning all vessels compete freely for their share of the total allowable catch. Cod fishing of offshore vessels is regulated by individual quotas allocated year by year, both in East and West Greenland. Pelagic fishery with offshore vessels is founded on individual quotas, also allocated year by year.
A further important element of fisheries management is the existence of specific fishing taxes to reallocate parts of the resource rents from the companies to the broader society. Specific fishing taxes prevail for shrimp, halibut, cod, haddock, saithe, redfish, and pelagic fish. The rates are differentiated and depend on the sales prices. For species with a sales price of more than DKK 12 DKK per kg, the tax is 5.5% of the value. When prices increase, the percentage increase. A fixed rate per kg prevails for pelagic species, where sales prices are typically below DKK 12 per kg. The tax revenue collected was in 2022, with DKK 480.6 million, substantial, and helped toto avoid other taxes.
The most important area for Greenlandic vessels in terms of quantities caught is West Greenland, from where 55% originates (2023), while 10% are caught in East Greenland waters. All capelin is caught in the Icelandic zone, following the tripart agreement; most blue whiting and around half of herring are caught in the Faroese zone, following the bilateral agreement with the Faroe Islands, while the other half of herring and all mackerel are caught in the international part of the ICES area. 3 769 tonnes of cod, and all haddock and saithe are caught in the Norwegian part of the Barents Sea, following the bilateral agreement with Norway on mutual fishing opportunities. Since almost all catches in the Icelandic zone, the Faroese zone, and in international waters are pelagic fish with low prices per kg, the dependency of domestic waters is higher in value than the percentages above indicate.
Catches of Greenlandic vessels appear in total in Table 7.3 and for offshore and coastal vessels in Table 7.4.
2019 | 2020 | 2021 | 2022 | 2023 | |
Seafood for cons. | |||||
Demersal fish | |||||
Cod | 42,360 | 37,629 | 42,245 | 43,694 | 54,088 |
Halibut | 45,841 | 42,816 | 45,393 | 45,363 | 45,202 |
Other | 4,552 | 4,263 | 3,838 | 2,516 | 3,998 |
Total | 92,753 | 84,708 | 91,476 | 91,573 | 103,288 |
Pelagic fish | |||||
Mackerel | 30,259 | 26,539 | 33,360 | 17,623 | 29,089 |
Herring | 3,190 | 3,201 | 2,864 | 6,164 | 7,333 |
Total | 33,449 | 29,740 | 36,224 | 23,787 | 36,422 |
Salmon and trout | |||||
Salmon | 0 | 32 | 41 | 25 | 34 |
Trout | 10 | 10 | 10 | 2 | 8 |
Total | 10 | 42 | 51 | 27 | 42 |
Crustaceans/mussels | |||||
Shrimp | 96,096 | 107,470 | 107,917 | 111,170 | 110,078 |
Other | 3,610 | 3,221 | 3,645 | 3,502 | 4,126 |
Total | 99,706 | 110,691 | 111,562 | 114,672 | 114,204 |
Other | |||||
Lumpfish | 7,599 | 8,985 | 4,548 | 4,896 | 5,640 |
Other | 2,020 | 1,745 | 1,762 | 2,375 | 2,138 |
Total | 9,619 | 10,730 | 6,310 | 7,271 | 7,778 |
Total | 235,537 | 235,911 | 245,623 | 237,330 | 261,734 |
Fish for reduction | |||||
Capelin | 788 | 617 | 14,281 | 44,106 | 46,711 |
Blue whiting | 19,753 | 19,551 | 19,340 | 22,878 | 25,987 |
Total | 20,541 | 20,168 | 33,621 | 66,984 | 72,698 |
Total production | 256,078 | 256,079 | 279,244 | 304,314 | 334,432 |
Table 7.3: Total catches of seafood by Greenlandic vessels in 2019-2023 in all waters, tonnes live weight.
Source: Statistics Greenland (2026d).
Table 7.4: Catches of seafood by offshore and coastal vessels in 2019–2023 in all waters, tonnes live weight.
Offshore vessels | Coastal vessels and dinghies | |||||||||
2019 | 2020 | 2021 | 2022 | 2023 | 2019 | 2020 | 2021 | 2022 | 2023 | |
Seafood for cons. | ||||||||||
Demersal fish | ||||||||||
Cod | 22,006 | 19,315 | 28,285 | 28,206 | 31,061 | 20,354 | 18,314 | 13,960 | 15,488 | 23,027 |
Halibut | 15,841 | 15,032 | 16,146 | 16,486 | 15,968 | 30,000 | 27,784 | 29,247 | 28,877 | 29,234 |
Other | 4,261 | 3,892 | 3,456 | 2,259 | 3,783 | 291 | 371 | 382 | 257 | 215 |
Total | 42,108 | 38,239 | 47,887 | 46,951 | 50,812 | 50,645 | 46,469 | 43,589 | 44,622 | 52,476 |
Pelagic fish | ||||||||||
Mackerel | 30,259 | 26,539 | 33,360 | 17,623 | 29,089 | 0 | 0 | 0 | 0 | 0 |
Herring | 3,190 | 3,201 | 2,864 | 6,164 | 7,333 | 0 | 0 | 0 | 0 | 0 |
Total | 33,449 | 29,740 | 36,224 | 23,787 | 36,422 | 0 | 0 | 0 | 0 | 0 |
Salmon and trout | ||||||||||
Salmon | 0 | 0 | 0 | 0 | 0 | 0 | 32 | 41 | 25 | 34 |
Trout | 0 | 0 | 0 | 0 | 0 | 10 | 10 | 10 | 2 | 8 |
Total | 0 | 0 | 0 | 0 | 0 | 10 | 42 | 51 | 27 | 42 |
Crustaceans/mussels | ||||||||||
Shrimp | 53,200 | 57,891 | 60,803 | 62,880 | 62,784 | 42,896 | 49,579 | 47,114 | 48,290 | 47,294 |
Other | 649 | 540 | 569 | 637 | 858 | 2,961 | 2,681 | 3,076 | 2,865 | 3,268 |
Total | 53,849 | 58,431 | 61,372 | 63,517 | 63,642 | 45,857 | 52,260 | 50,190 | 51,155 | 50,562 |
Other | ||||||||||
Lumpfish | 0 | 0 | 0 | 0 | 0 | 7,599 | 8,985 | 4,548 | 4,896 | 5,640 |
Other | 1,820 | 1,690 | 1,549 | 2,042 | 1,758 | 200 | 55 | 213 | 333 | 380 |
Total | 1,820 | 1,690 | 1,549 | 2,042 | 1,758 | 7,799 | 9,040 | 4,761 | 5,229 | 6,020 |
Total | 131,226 | 128,100 | 147,032 | 136,297 | 152,634 | 104,311 | 107,811 | 98,591 | 101,033 | 109,100 |
Fish for reduction | ||||||||||
Capelin | 15 | 0 | 13927 | 43,849 | 46,431 | 773 | 617 | 354 | 257 | 280 |
Blue whiting | 19,753 | 19,551 | 19,340 | 22,878 | 25,987 | 0 | 0 | 0 | 0 | 0 |
Total | 19,768 | 19,551 | 33,267 | 66,727 | 72,418 | 773 | 617 | 354 | 257 | 280 |
Total production | 150,994 | 147,651 | 180,299 | 203,024 | 225,052 | 105,084 | 108,428 | 98,945 | 101,290 | 109,380 |
Source: Statistics Greenland (2026d).
Total catches in 2023 of seafood for human consumption were 261,700 tonnes, with 152,600 tonnes coming from offshore vessels and 109,100 from coastal vessels and dinghies. Shrimp is the most important species in quantity terms with 110,000 tonnes followed by cod with 54 ,100 tonnes, halibut with 45,200 tonnes, and mackerel with 29,100 tonnes. Offshore vessels account for 57% of shrimp catches, and all of mackerel and herring catches. Coastal vessels and dinghies account for 65% of total catches of halibut, 43% of cod, and all lumpfish.
Catches of capelin and blue whiting total 72,700 tonnes. Most are caught by offshore vessels and landed for processing abroad in Iceland and the Faroe Islands.
Foreign vessels also fish in Greenlandic waters as shown in Table 5.
2019 | 2020 | 2021 | 2022 | 2023 | |
Cod | 4,126 | 4,651 | 5,737 | 5,439 | 5,651 |
Halibut | 11,497 | 11,060 | 10,097 | 10,510 | 8,716 |
Other Demersal | 4,985 | 5,114 | 3,604 | 2,727 | 2,229 |
Shrimp | 4,079 | 5,946 | 4,695 | 6,843 | 6,891 |
Other | 403 | 374 | 567 | 496 | 655 |
Total | 25,090 | 27,145 | 24,700 | 26,015 | 24,142 |
Table 7.5: Catches of foreign vessels in the Greenlandic zone in 2019-2023, tonnes live weight.
Source: Statistics Greenland (2026d).
In 2023, catches of foreign vessels formed 6.7% of total catches and 8.4% of catches for human consumption. Most of the catches of foreign vessels (63%) are caught in the waters of East Greenland. Data on catches allocated to countries is not available, but in 2023, TACs of 37,298 tonnes were allocated to foreign vessels. EU vessels, including Danish vessels, hold TACs for 25,904 tonnes in the Greenlandic zone, followed by Norwegian vessels (6,894 tonnes) and Faroese vessels (4 500 tonnes). No other countries hold TACs. EU vessels primarily hold TACs for capelin, shrimp, halibut and cod, while Norwegian vessels focus on TACs for shrimp, cod, halibut and redfish, and Faroese vessels hold TACs mainly for cod.
Statistics including all landings of Greenlandic vessels do not exist. The offical Greenlandic landing statistics only include direct landings and not landing of seafood processed onboard offshore vessels and exported directly. Instead, it is included in the export statistics together with seafood landed in Greenland and exported, while the landing statistics include everything except for this direct export.
Landings formed 123,563 tonnes in 2023 when excluding seafood processed onboard offshore vessels and exported directly. The largest share of the quantity is landed in Ilulissat (22%), Sisimiut receive 17%, Nuuk 16% and Aasiaat 11%.
Landings in quantity and value in the period 2019–2023 are shown in Table 7.6.
Table 7.6: Seafood landings in Greenland by Greenlandic vessels in 2019-2023.
Quantity (tonnes live weight) | Value (DKK million) | |||||||||
2019 | 2020 | 2021 | 2022 | 2023 | 2019 | 2020 | 2021 | 2022 | 2023 | |
Offshore vessels | ||||||||||
Shrimp | 14,618 | 17,495 | 20,383 | 20,274 | 16,347 | 123 | 144 | 168 | 176 | 133 |
Halibut | 5,703 | 2,831 | 4,549 | 5,540 | 5,203 | 85 | 36 | 52 | 79 | 65 |
Cod | 3,807 | 1,855 | 5,438 | 1,669 | 1,883 | 33 | 14 | 29 | 17 | 19 |
Other | 143 | 160 | 326 | 413 | 495 | 0 | 0 | 1 | 1 | 1 |
Total | 24,271 | 22,341 | 30,696 | 27,896 | 23,928 | 241 | 194 | 249 | 272 | 218 |
Coastal vessels/dinghies | ||||||||||
Shrimp | 36,655 | 36,964 | 35,176 | 34,099 | 38,158 | 391 | 352 | 312 | 315 | 364 |
Halibut | 29,935 | 27,759 | 29,225 | 28,757 | 29,268 | 588 | 542 | 547 | 601 | 645 |
Cod | 20,350 | 18,294 | 14,251 | 15,438 | 23,020 | 136 | 105 | 67 | 100 | 158 |
Crabs | 2,803 | 2,510 | 2,808 | 2,722 | 2,714 | 72 | 57 | 75 | 72 | 61 |
Lumpfish | 7,596 | 8,976 | 4,547 | 4,893 | 5,640 | 42 | 46 | 23 | 27 | 38 |
Other | 1,622 | 1,460 | 1,274 | 823 | 835 | 7 | 6 | 6 | 4 | 5 |
Total | 98,961 | 95,963 | 87,281 | 86,732 | 99,635 | 1,237 | 1,108 | 1,030 | 1,119 | 1,270 |
Total | 123,232 | 118,304 | 117,977 | 114,628 | 123,563 | 1,478 | 1,302 | 1,279 | 1,391 | 1,487 |
Source: Statistics Greenland (2026e).
The total landings in 2023 on 123,563 tonnes corresponds to DKK 1.5 billion, with DKK 1.27 billion (81%) delivered from coastal vessels and DKK 218 million (19%) from offshore vessels. The landing value for halibut on DKK 710 million is the largest, followed by shrimp with DKK 497 million and cod with DKK 177 million. Total quantities and values landed are almost stable over the 2019-2023 period, although a minor reduction in both is seen in 2020–2022 in the Covid-19 period.
The status of the main stocks for Greenlandic fisheries is presented in Table 7.7. Quotas are compared to the biological advice and considered sustainable (green box) if set at maximum at the advice, and stocks compared with the safe biological limits and considered within safe biological limits if not below (green box).
Table 7.7: Status of main stocks for Greenlandic fisheries, 2023.
Species/stock | Greenlandic catches (tonnes) | Quota compared to advice (%)1 | Stock within safe biological limits2 |
Shrimp West Greenland | 106,566 | 100% | Yes |
Shrimp East Greenland | 2,786 | 343% | No |
Halibut West Greenland offshore | 12,607 | 112% | Yes |
Halibut East Greenland offshore | 3,361 | 100% | Yes |
Halibut inshore Bay of Disco | 11,435 | 243% | |
Halibut inshore Uummannaq | 8,250 | 190% | |
Halibut inshore Upernavik | 7,300 | 153% | |
Cod East and Southwest Greenland offshore | 27,292 | 219% | |
Cod West Greenland inshore | 11,017 | 185% |
Notes:
1: The percentages measure the quotas for Greenlandic vessels compared to the biological advises from the International Council for Exploration of the Sea for East Greenland and from Northwest Atlantic Fisheries Commission for West Greenland. For stock where quotas are set in accordance with biological advices, the boxes are green, while for stocks where quotas are set higher than biological advices the boxes are red.
2: For stocks, a green box indicates that the current size of the stock is within safe biological limits, a red box that the stock size is below safe biological limits and a white box that reference points are not set for the stock.
Sources: For catches Statistics Greenland (2026d), for advice Greenland Institute of Natural Resources (2024) and for stock status Northwest Atlantic Fisheries Organization (2026) and International Council for Exploration of the Sea (2026).
For the nine stocks of shrimp, halibut, and cod shown, shrimp in West Greenland is within safe biological limits, with quotas set according to the biological recommendation. This stock accounts for 56% of the total catches of the nine stocks and 41% of total catches for human consumption in 2023. Both offshore halibut stocks are also within safe biological limits. The quota in East Greenland is set in accordance with the biological recommendation, while the quota in West Greenland is set just above, but close to, the biological recommendation. For the remaining six stocks, the stock is only known for shrimp in East Greenland, where it is outside the safe biological limit. Reference points are undefined for the remaining five halibut and cod stocks. However, quotas are all set above the recommendation. The most difficult situation for shrimp occurs in East Greenland, where quotas are set more than three times higher than the recommendation. For cod inshore and offshore, quotas are set at 85–119% above the recommendation. For inshore halibut, quotas are set between 53% and 143% above the recommendation. The quota setting has prevailed for a longer period, reflecting a precautionary principle for the main shrimp stock in West Greenland, which is very important to the national economy, while the high quotas for inshore halibut appear to ensure employment.
Trade flows of aquatic food: Greenland
The Greenlandic value chain for fish for human consumption
The structure of the Greenlandic value chain for seafood for human consumption is identified via key figures. These are shown in Figure 7.1, along with quantities and values.
Figure 7.1: The Greenlandic value chain for seafood for human consumption 2023, live weight1
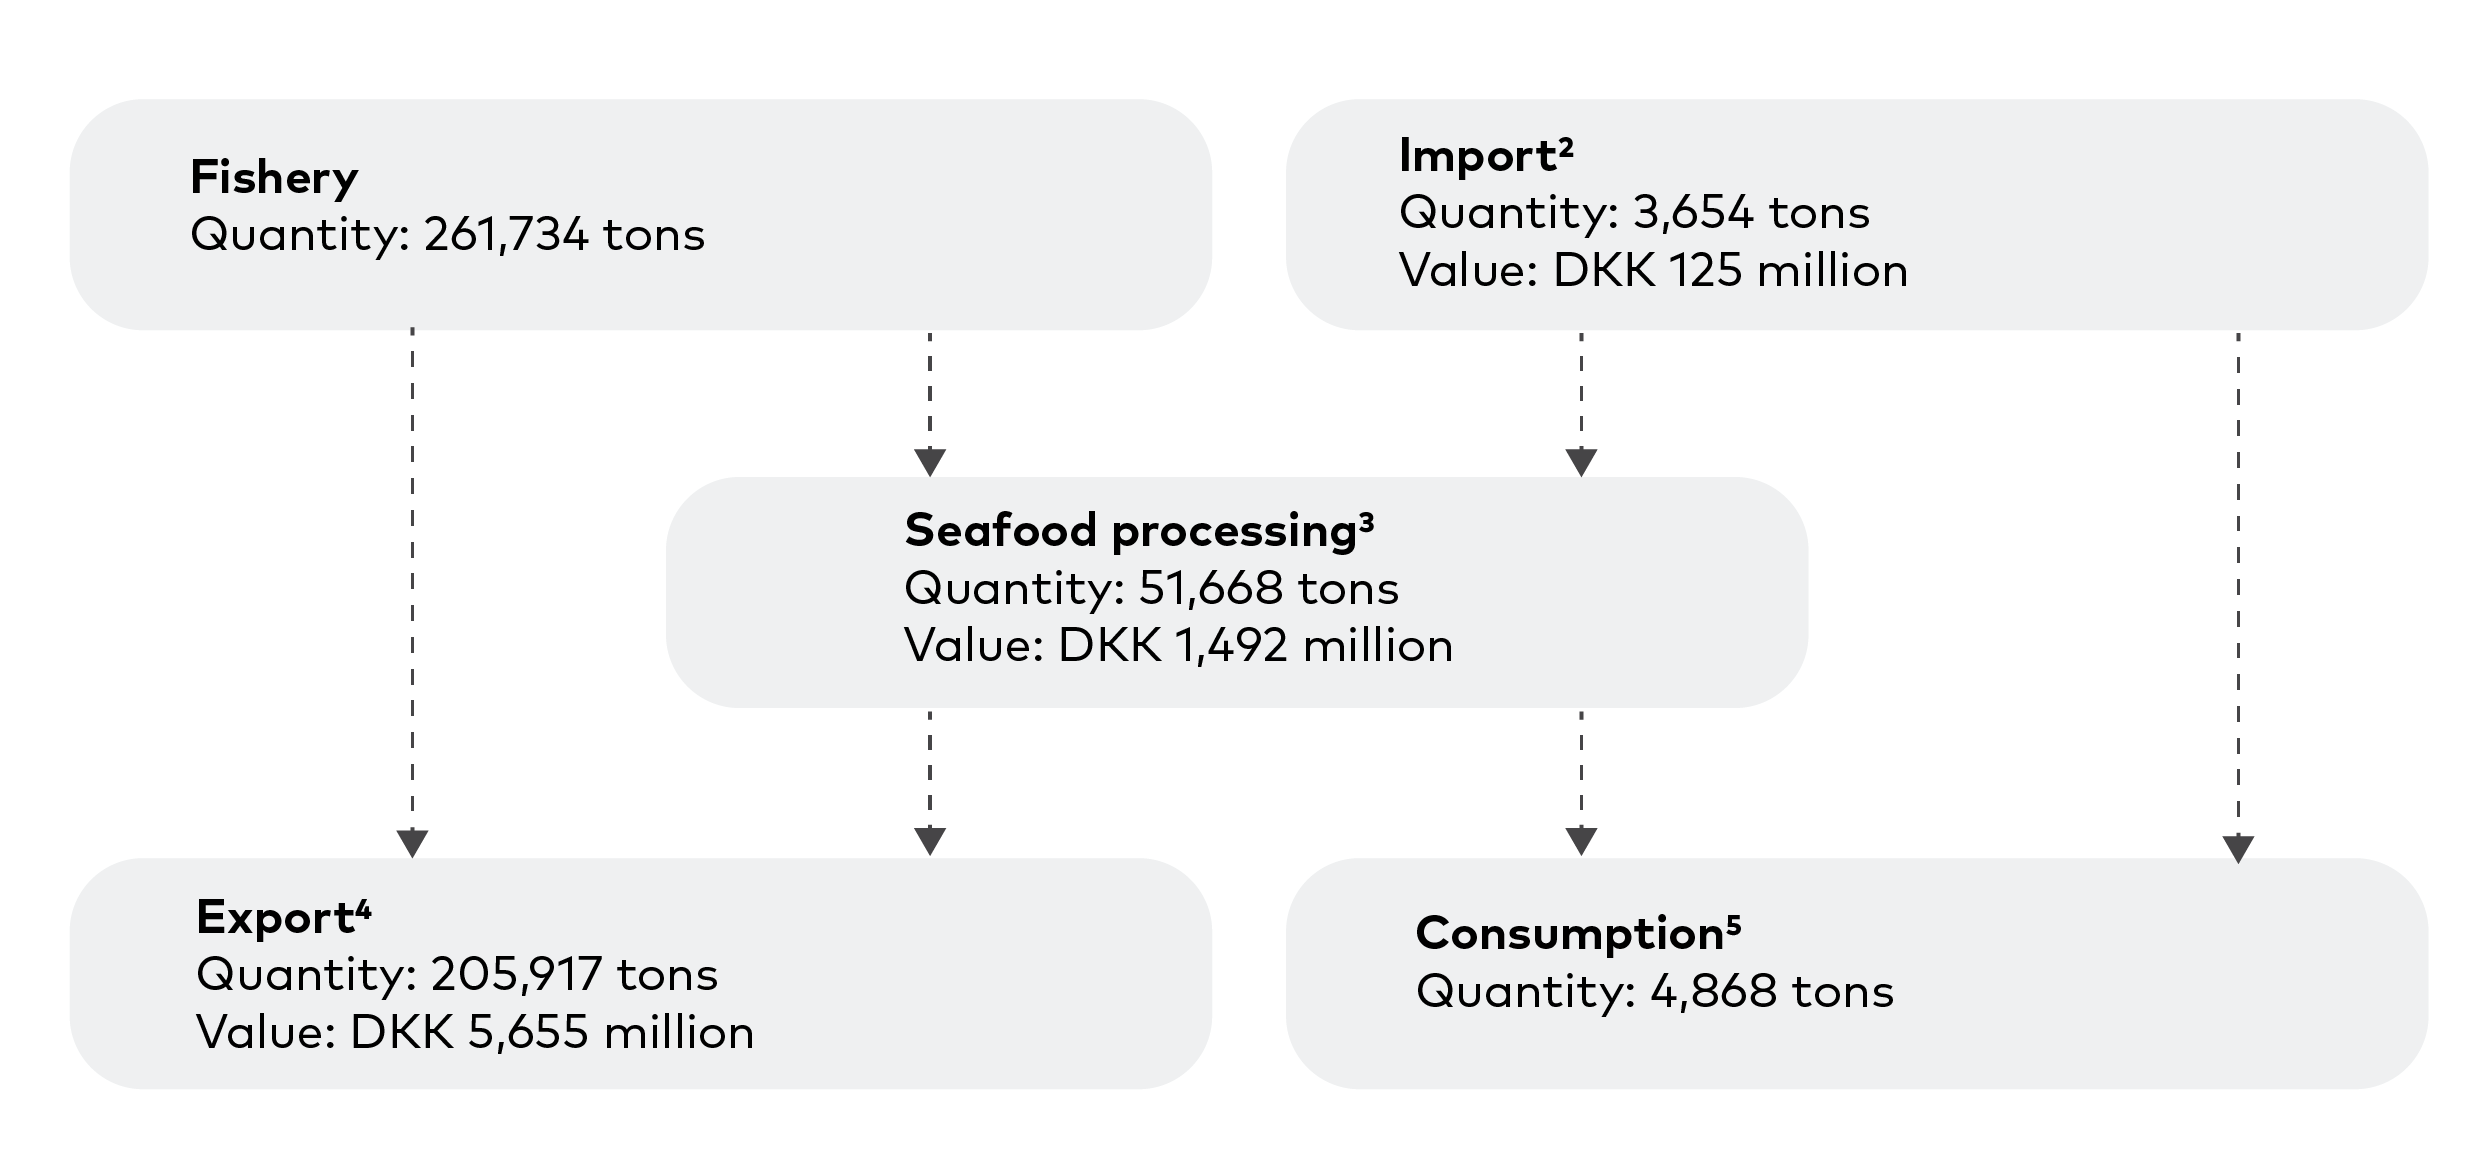
1: Quantities in live weight are known for fishery, while the quantities in live weight equivalents are calculated for seafood processing, import, and export using conversion factors from processed and traded weight to live weight.
2: Import is measured as Danish export to Greenland, since all import comes from Denmark. For import, the same conversion factors as for Denmark are applied.
3: Seafood processing is not registered, but includes exports known to be processed at land-based factories. These are peeled frozen shrimp, frozen fillets of halibut and cod, and dried cod. Processing onboard offshore production trawlers is not included.
4: Export is known from Statistics Greenland (2026f), with product forms being less detailed than in the import statistics based on Statistics Denmark (2026). The conversion factors used are 1.65 for peeled shrimp, 1.3 for J-cut halibut, 2.6 for fillets and dried cod, 2.6 for halibut fillets, and 1.0 for all other products.
5: The total quantity is identified based on an average per capita consumption of 86 kg, based on 2010-2013 as the latest years with available statistics (Food and Agriculture Organization of the United Nations 2018).
Sources: For catches Statistics Greenland (2026d), for import Statistics Denmark (2026), for seafood processing and export Statistics Greenland (2026f), and for consumption Food and Agriculture Organization of the United Nations (2018).
In 2023, 275 vessels and 1,922 dinghies fisher were registered. Specialized shrimp fishing with 9 offshore production trawlers and 20 coastal trawlers is of the greatest economic importance, while the combined offshore fishery with 8 large production trawlers targeting halibut and cod, and seasonal pelagic fishing, follows. Inshore combined fishing in West Greenland after halibut and cod is undertaken by around 150 vessels and by up to 2,000 fishers using dinghies. The total catches for human consumption are 261,700 tonnes. Of these, 123,563 tonnes are landed in Greenland for a value of 1.5 DKK billion, while the rest is directly exported. The direct export is 46,437 tonnes of shrimp, corresponding to 74% of their shrimp catch, 29,178 tonnes of cod (94%), and 10,765 tonnes of halibut (67%). Values for these are not available, as they are registered in the export statistics alongside exports via land-based facilities. For coastal vessels, halibut landings are most important, valued at DKK 645 million, followed by shrimp at DKK 364 million and cod at DKK 158 million.
The import of seafood for human consumption is 3,654 tonnes for a value of DKK 125 million in 2023. Table 7.8 shows the import of groups of species and products.
Quantity (tonnes live weight) | Value (DKK million current price level) | |
Salmon and trout | ||
- Fresh, live | 28 | 2 |
- Frozen | 22 | 1 |
- Fillets | 18 | 1 |
- Smoked, Salted, Dried | 51 | 3 |
- Processed | 13 | 1 |
- Total | 132 | 7 |
Whitefish and flatfish | ||
- Fresh, live | 1 | 0 |
- Frozen | 0 | 0 |
- Fillets | 6 | 0 |
- Smoked, Salted, Dried | 26 | 1 |
- Processed | 69 | 1 |
- Total | 103 | 3 |
Pelagic fish | ||
- Fresh, live | 0 | 0 |
- Frozen | 0 | 0 |
- Fillets | 3 | 0 |
- Smoked, Salted, Dried | 2 | 0 |
- Processed | 179 | 4 |
- Total | 185 | 4 |
Crustaceans and mussels | ||
- Fresh, live | 2,481 | 89 |
- Frozen | 144 | 4 |
- Fillets | 0 | 0 |
- Smoked, Salted, Dried | 3 | 0 |
- Processed | 157 | 3 |
- Total | 2,784 | 97 |
Other and mixed | ||
- Fresh, live | 1 | 0 |
- Frozen | 135 | 6 |
- Fillets | 49 | 1 |
- Smoked, Salted, Dried | 18 | 1 |
- Processed | 245 | 6 |
- Total | 448 | 14 |
Total | ||
- Fresh, live | 2,512 | 91 |
- Frozen | 301 | 11 |
- Fillets | 77 | 3 |
- Smoked, Salted, Dried | 99 | 6 |
- Processed | 663 | 15 |
- Total | 3,652 | 125 |
Table 7.8: Greenlandic import of seafood, 2023, quantity and value1.
1. Danish export to Greenland is applied to measure Greenlandic imports. This implies that imports in the form of landings by non-Greenlandic and non-Danish vessels in Greenland are not included. Total imports to Greenland of unprocessed seafood in 2023 were, according to Statistics Greenland (2026f), DKK 42 million, and total imports of processed meat and seafood were DKK 136 million. Hence, landings of foreign fishers in Greenland can at most be small.
Source: Statistics Denmark (2026).
The largest import item from Denmark is fresh shrimp landed by one Danish vessel that fishes in the Greenlandic zone, based on the agreement between Greenland and the EU. The total value is DKK 89 million (71%). The remaining import, spread across product forms and species, is presumed to be mainly for domestic consumption. Landings may also be made by fishers from the EU, Norway, and the Faroe Islands that fish in the Greenlandic zone (see Table 7.5), but numbers are not available. It is, however, presumed that such landings are small, since it may pay off to land elsewhere.
Landing facilities are available in most harbours where processing may or may not take place. The four largest factories receive and process raw material of shrimp, by boiling, peeling, and packing them as a single frozen product. The four shrimp factories are located in Ilulissat, Sisimiut, Nuuk, and Aasiaat. Landings of halibut are spread across many harbours. Royal Greenland Ltd. has an obligation to buy fish in all harbours along the coast, including small places. Halibut processing is widespread in several harbours, with the largest Royal Greenland factory in Ilulissat. Polar Seafood also processes, among others, in Nuuk and Aasiaat, while another private company, Halibut Greenland, has a factory also in Ilulissat. Halibut are mostly J-cut or processed for fillets and frozen. Landings of cod are also received in several harbours along the coast, although further south than halibut. Fillets and dried cod are produced. While a processing statistic doesn’t exist, the export statistics reveal that the main processing item is frozen peeled shrimp (DKK 1.0 billion), followed by frozen cod fillets (DKK 270 million) and frozen halibut fillets (DKK 161 million) (Statistics Greenland (2026f).
In 2023, export of seafood for human consumption formed 205,900 tonnes of live weight and DKK 5.7 billion, corresponding to 90% of the total export value. This number is known from the officially published statistics from Statistics Greenland (2026e). However, it is assessed that the export statistics are subject to uncertainty. In particular, the values are presumed to be underestimated because most exports are recorded as internal transactions within the government-owned company Royal Greenland. Royal Greenland is present in both Greenland and Denmark and has a special arrangement under the Double Taxation Agreement between Greenland and Denmark (Danish Ministry of Taxation 2026), which allows the company to operate across the two countries. The implication is that estimated, presumably low, values are reported to the statistics. This value chain organization is described in more detail in Nielsen et al (2017). In Table 7.9, export data from Statistics Greenland (2026f) are detailed by species and product, and the values from those statistics are used directly.
Quantity (tonnes live weight) | Value (DKK Million) | |
Total | ||
- Seafood for human consumption | 5,655 | |
- Fish for reduction | 214 | |
- Non-seafood | 636 | |
- Total | 6,504 | |
Seafood for human consumption | ||
Shrimp | ||
- Frozen whole | 52,376 | 1,699 |
- Peeled frozen | 31,619 | 1,022 |
- Total | 83,995 | 2,721 |
Cod | ||
- Frozen whole | 26,035 | 532 |
- Dried/salted | 2,344 | 39 |
- Frozen fillets | 11,821 | 270 |
- Total | 40,201 | 841 |
Halibut | ||
- Frozen whole | 36,284 | 1,389 |
- Frozen fillets | 5,884 | 161 |
- Total | 42,168 | 1,550 |
Other | ||
- Scallops | 97 | 7 |
- Crabs | 1,581 | 127 |
- Lumpfish roe | 1,101 | 41 |
- Haddock whole/fillets fresh/frozen | 323 | 11 |
- Redfish whole/fillets fresh/frozen | 990 | 19 |
- Saithe whole/fillets fresh/frozen | 334 | 6 |
- Herring whole fresh /frozen | 6,665 | 42 |
- Mackerel whole fresh/frozen | 28,070 | 276 |
- Other fish products | 393 | 14 |
- Total | 39,554 | 543 |
Total | 205,917 | 5,655 |
Table 7.9: Greenlandic export, 2023, quantity and nominal value1.
Source: Statistics Greenland (2026f).
Shrimp is the largest export item, accounting for DKK 2.7 billion (48%), followed by halibut with DKK 1.6 billion (27%), cod with DKK 841 million (15%), and mackerel with DKK 276 million (5%). For shrimp, frozen whole is the most important product form, accounting for DKK 1.7 billion, mostly consisting of shrimp processed onboard offshore vessels and exported directly, while the remaining part is shrimp with shell. For halibut, DKK 1.4 billion (90% of the species' exports) is frozen whole, typically J-cut, while for cod, frozen whole accounts for DKK 532 million (63%) and frozen fillets for DKK 270 million (32%).
The total export of DKK 6.5 billion, according to Statistics Greenland (2026f), is destined for Denmark (DKK 5.2 billion), Iceland (DKK 545 million), Norway (DKK 223 million), the Faroe Islands (DKK 45 million), and unknown countries (DKK 536 million). According to Statistics Iceland (2026), DKK 103 million of Iceland's exports consist of capelin and blue whiting, while exports of seafood for human consumption are largely non-existent. The export to Norway consists of DKK 40 million in direct exports from two vessels fishing for cod, haddock, and saithe in the Barents Sea under the bilateral agreement with Norway (Statistics Norway 2025). The export to the Faroe Islands is DKK 64 million, with cod and other groundfish accounting for the largest share (Statistics Faroe Islands 2026).
Although the statistics don’t specify countries of export separately for seafood for human consumption, at least 80% and presumably more is exported to Denmark. But Denmark is only the first destination. Most of the export to Denmark is re-exported. Statistics Greenland (2026f) reports that Danish exports of seafood for human consumption of Greenlandic origin in 2023 were DKK 4.5 billion. The largest market is China, receiving DKK 2.6 billion, followed by other EU countries with DKK 451 million and Norway with DKK 197 million. The difference between Danish imports and exports from Greenland is either consumed in Denmark or processed and possibly re-exported from Denmark. Hence, China is the largest final export market for Greenlandic seafood products. Of the total registered Greenlandic seafood exports for human consumption of DKK 5.7 billion, 46% are exported to China. While the Greenlandic export value is underestimated (Nielsen et al., 2017), the Danish export value reflects the real value, so this share is overestimated. In any case, China appears as a very important market for Greenlandic seafood.
Seafood consumption in Greenland is not known but presumed to be high. It consists of both supermarket purchases and purchases at local markets for fish, seals, and whales. A large share of consumption comes from own catches on dinghies. The Food and Agriculture Organization of the United Nations (2018) estimates that per capita consumption is 86kg of live weight of seafood, corresponding to a total domestic consumption of 4 868 tonnes.
The Greenlandic value chain for fish for reduction
The Greenlandic value chain for fish for reduction is short and only includes fishing. No processing exists. The catches of fish for reduction in 2023 were 72,418 tonnes, with two-third being capelin and the rest blue whiting. Capelin are caught in the Icelandic zone, following the tripartite agreement with Iceland and Norway. 32,283 tonnes of capelin (DKK 91 million) are landed in Iceland, as are 5 985 tonnes of blue whiting for DKK 12 million. Moreover, landings of fish for non-food use at the Faroe Islands were 26,401 tonnes and DKK 119 million, presumably with most being blue whiting. Export of fish for reduction forms a total of DKK 214 million (Statistics Greenland 2026e). Fish waste appears as a side-stream from the processing of seafood for human consumption, leading to exports of DKK 14 million to Denmark in 2023 (Statistics Denmark 2026).
Aquatic food available for consumption in Greenland
There is no statistic on seafood consumption in Greenland. The consumption can be calculated for Greenland, as for the other Nordic countries, as the sum of catches, aquaculture production, and imports minus exports, with all items converted to live weight using conversion factors. However, due to a lack of detail in the published export statistics on product groups, it is not possible to convert to valid live-weight equivalents.
The Food and Agriculture Organization of the United Nations (2018) uses the same methodology to calculate what remains of catches and aquaculture production after accounting for foreign trade for domestic human consumption across all countries worldwide in 2010-2013. In Greenland, the annual per capita consumption of seafood is estimated at 86 kg in live-weight equivalents. This indicates very high per capita seafood consumption in Greenland. With the population of Greenland in 2023, that corresponds to a total domestic seafood consumption in 2023 of 4,868 tonnes. This consumption can be compared with the total export of 205,917 tonnes live weight, implying that in the speculative case where the full supply is consumed domestically, seafood consumption can increase 42-fold. However, given the calculation method based on uncertain conversion factors, consumption is subject to substantial uncertainty. The number is also some years old.
Bjerregaard and Ottendahl (2024) conducted a questionnaire study of eating habits in the Greenlandic population in 2018 and found that each person, on average, eats 33.8 grams/day of seafood products and further 19.7 grams/day of marine mammals (seal meat and whale meat). That corresponds to a per capita seafood consumption of 12.3 kg. per year and a per capita consumption of marine mammals of an additional 7.2 kg. per year. These numbers are measured in edible final prepared seafood and don’t account for waste in preparations, implying that numbers in live weight equivalents are substantially higher. The results for 2018 are compared with a similar study conducted in 2005–2010, and it is found that seafood consumption remained constant (33.0 grams/day in 2005–2010), while consumption of marine mammals decreased by one-third between the two studies (from 30.4 grams/day). Moreover, the study identifies the frequency of seafood consumption and finds that 32% of respondents eat seafood 2 or more times per week, while 24% eat marine mammals 2 or more times per week. The study concludes that eating habits are changing toward traditional Western foods.
The wide range of per capita consumption indicates considerable uncertainty. Reliable, up-to-date knowledge about seafood consumption in Greenland doesn’t exist. However, the limited import data indicate that seafood consumption mostly consists of locally available species.
While reduced international trade in times of crisis can substantially affect the economics of the Greenlandic fishing industry, the effect on Greenlandic and Nordic self-sufficiency in seafood is small. Security in the Greenlandic and Nordic seafood supply is robust due to the very large volumes supplied. However, in times of crisis, it may pose a challenge that a substantial share of seafood is exported to one country, China. While it is possible to export to other countries if the Chinese market is not available, prices are expected to be reduced. That may be especially true for halibut, given the strong demand in China.
Challenges, threats, and opportunities
More developments may potentially affect the Greenlandic seafood supply, although it is not certain whether this will happen.
The first development that affects future catches is the biological state of the fish and shellfish stocks, both in terms of whether the stock sizes are within safe biological limits and whether quotas are set in accordance with biological recommendations. The most important West Greenland shrimp stock is within safe biological limits, and quotas are continuously set in accordance with recommendations. Together with the individual transferable quota regulation, stability is ensured through proper vessel economy and the stable delivery of raw materials to land-based factories, while the specific fishing tax ensures a substantial and stable contribution to the Greenlandic economy.
The situation in the inshore halibut fisheries in the Bay of Disco, Uummannaq, and Upernavik differs, with quotas for all three stocks being set above biological recommendations. While large catches and employment prevail in the short run, they are not biologically sustainable in the long run. The implications can include reduced catches, both consistently and during periods of stock recovery, as well as the risk of stock collapses. The same situation, with quotas set above biological recommendations, prevails in the cod fisheries, both inshore and offshore.
Second, the agreement between the European Commission and the Government of Greenland specifies fishing opportunities of EU vessels in Greenlandic waters, as reflected in the catches in Table 5, allocated for a payment to the Government of Greenland and free access of all Greenlandic seafood products at the EU market (European Union, Government of Greenland and Government of Denmark 2021, European Commission Directorate-General for Maritime Affairs and Fisheries 2024). The agreement allows, on the one hand, exports to the EU without tariffs and provides a subsidy to the Greenlandic economy, and, on the other hand, transfers quotas in Greenlandic waters to EU vessels.
The third development that may affect future catches is climate change, driven by rising marine temperatures. Although potentially more important in the long run than in the short run, this has already been observed. For example, mackerel from the Northeast Atlantic stock have appeared in East Greenland waters in quantities of commercial importance since 2011, leading to 75,194 tonnes caught by Greenlandic vessels in domestic waters in 2014 (Bjorndal et al., 2026). Although no mackerel have been registered as caught in Greenlandic waters since 2019, it reflects that stock abundances are sensitive to changing temperatures. Hence, increasing water temperature may positively affect the abundance of seafood stocks and, in turn, lead to the immigration of new species adapted to higher temperatures. The potential implication is an increase in total seafood biomass, thereby boosting future catches. It may, however, also lead to reduced abundances of species currently inhabiting the area, which are better suited to today's temperatures. Finally, reduced sea ice coverage in the future may provide better access to fishing grounds. That may further increase catches but also reduce the option of long-line fishing from the ice.
Fourth, while no aquaculture currently exists, it offers an opportunity to increase seafood supply. Many marine areas are potentially relevant for cage farming, and the infrastructure for seafood processing and sale is already well-functioning, although both floating ice and pack ice, as well as the need for complex regulations, may pose challenges. Given today's complete absence of an aquaculture industry, its development may take years.
Finally, since a considerable share of exports is destined for one country, China, the domestic seafood value chain will be substantially affected in the hypothetical case where this is no longer possible. Export to China is largely limited to frozen, unprocessed shrimp and halibut, but with large quantities of both. Although both species can be sold in other countries in such a situation, it will be at reduced prices. Especially in a transition period in the short run, and especially for halibut, due to high Chinese demand as a substitute for Patagonian toothfish, which is in low supply and an endangered species (Nielsen et al., 2017).
Given that only some of the above developments may come true, and that the trends point in opposite directions, they don’t provide an unambiguous picture of the future development in the supply of seafood.