6. Finland
Introduction
The Finnish seafood sector consists of around 217 aquaculture enterprises, approximately 2,100 marine commercial fishers, and nearly 1,700 inland fishers. The fish processing industry includes around 116 firms and 50 wholesale companies, though the sector remains small compared with other Nordic countries.
Fisheries account for only a very small share of the Finnish economy, representing 0.1% of the national gross domestic product (FAO, n.d.). Finland’s entire coastline borders the Baltic Sea, a brackish and environmentally vulnerable marine system characterized by low salinity and reduced biodiversity compared with fully marine environments (Pettersen et al., 2025). Finnish fisheries encompass both marine and inland fishing as well as aquaculture, and the country also has a substantial recreational fishing sector.
While fisheries represent a minor share of Finland’s national economy, they hold greater economic significance in Åland. The autonomous archipelago, consisting of around 6,500 islands, has a strong maritime identity closely tied to the blue economy. Although the sector may appear small in scale, both capture fisheries and aquaculture are important local industries, with aquaculture alone contributing an estimated 2–3% of Åland’s GDP (Pettersen et al., 2025).
In the dataset used for the following analyses, figures for Finland and Åland are reported together and will therefore be treated as a single unit. In total, 5,084 people were employed in commercial fishing and fish production (primary sector) in 2023 (Luke, 2026).
Primary production
Finland’s aquatic food production is based on both capture fisheries and aquaculture, supplemented by a substantial recreational fishing sector. Capture fisheries include marine fishing in the Baltic Sea and commercial inland fisheries, with pelagic species—particularly Baltic herring and sprat—dominating marine landings, while vendace and other freshwater species are most important in inland fisheries. Aquaculture production is small in volume compared with capture fisheries, but is economically significant and dominated by rainbow trout, produced mainly in sea and brackish waters, with a smaller share from freshwater farms. The following sections describe recent trends in catches and farmed production and distinguish between raw material used for human consumption and for reduction (meal and oil).
Capture fishery
There is a substantial recreational fishery, but where figures are collected only every even year. For the relevant year 2023, there are no estimated figures.
For recreational fishing, perch and pike are the most important species. In 2022, they made up over half of the total recreational catch.
Type of fishery | 2019 | 2020 | 2021 | 2022 | 2023 |
commercial | 141,526 | 117,659 | 102,375 | 91,798 | 94,456 |
recreational | 31,291 | 34,062 | |||
Total (tonnes) | 141,526 | 148,950 | 102,375 | 125,860 | 94,456 |
Table 6.1: Commercial and recreational fishing in Finland in 2023. Tonnes. Source: Luke, 2026
Most of the commercial catch by Finnish fishermen is landed in Finland, but some is also landed in Estonian and Swedish ports. In recent years, there have been no landings by foreign vessels in Finland (personal correspondence with Luke, Finland).
Landing country | Baltic herring | Sprat |
Finland | 78% | 40% |
Estonia | 13% | 47% |
Sweden | 9% | 13% |
Table 6.2: Commercial marine catch by Finnish fishermen in 2023, share of total. Source: personal correspondence with Luke representatives, January 2026.
Table 6.3 presents total landings by Finnish vessels, including those by Finnish commercial fishers in Finland and abroad. In commercial marine fishing, Baltic herring and sprat made up 94% of the total marine catch in 2023. In inland commercial fishing, vendace is the most important species. Other significant species include pikeperch, perch, and crayfish.
Of the total catch of 94,456 tonnes in 2023, about 70,368 tonnes were landed at Finnish ports. The data do not indicate the share of fish intended for human consumption or reduction, but according to Setälä et al. (2024), more than half of the total herring catch ends up in fish meal production, either in Finland or abroad. This high share going to fishmeal and fish oil is partly since much of the herring in recent years has been too small for the food-grade processing industry. Only 5–25% of herring landings have met the required quality standards for human consumption, meaning that the remainder is largely directed to feed production (Setälä et al, 2024).
Luke has estimated that 18,634 tonnes of domestic Baltic herring and sprat were processed for human consumption in 2023. This implies that of the total domestic landings of 59,969 tonnes of Baltic herring and sprat 41,333 tonnes are available for meal and oil domestically. This implies that only 29,035 tonnes of the domestic catch in 2023 was intended for human consumption.
Specie | 2019 | 2020 | 2021 | 2022 | 2023 |
Pelagic | 134,952 | 111,326 | 96,702 | 86,454 | 88,812 |
Baltic herring total | 112,722 | 92,481 | 76,726 | 68,176 | 69,330 |
Landed domestically | 54,077 | ||||
Sprat total | 16,080 | 12,502 | 14,774 | 13,487 | 14,725 |
Landed domestically | 5,890 | ||||
Other | 6,150 | 6,343 | 5,202 | 4,791 | 4,757 |
Other | 6,159 | 6,066 | 5,402 | 5,131 | 5,469 |
Perch | 1,036 | 964 | 1,007 | 1,177 | 1,198 |
Roach, smelt, and other fish | 1,565 | 1,159 | 1,021 | 895 | 1,102 |
Bream | 824 | 952 | 815 | 877 | 909 |
Other | 2,734 | 2,991 | 2,559 | 2,182 | 2,260 |
Salmonidae | 274 | 236 | 233 | 181 | 146 |
Demersal and flatfish | 141 | 31 | 38 | 32 | 29 |
Total catch | 141,526 | 117,659 | 102,375 | 91,798 | 94,456 |
Total catch landed domestically | 70,368 | ||||
For reduction | 41,333 | ||||
For human consumption | 29,035 |
Table 6.3: Total commercial catch by Finnish commercial fishers, per species and species group. Source: Luke, 2026
Aquaculture production
In aquaculture, rainbow trout is the main species. It accounted for around 95% of all farmed food fish in 2023. Smaller amounts of European whitefish are also produced. About 78% of Finnish aquaculture production occurred in sea and brackish waters, and 21% in freshwater in 2023.
In Finland, the most important cultured species is rainbow trout raised in sea cages (Paisly et al., 2010).
Specie | 2019 | 2020 | 2021 | 2022 | 2023 |
Aquaculture | 15,300 | 15,050 | 14,400 | 16,280 | 15,170 |
Rainbow trout | 14,200 | 14,290 | 13,550 | 15,250 | 14,430 |
European whitefish | 790 | 580 | 690 | 800 | 660 |
Table 6.4: Finnish aquaculture production, tonnes. Source: Luke, 2026
In total, about 44 205 tonnes of the Finnish primary production in 2023 were available for human consumption.
Regulation and management
Finland’s Fishing Act requires that fish stocks be kept in good condition and used in an ecologically, economically, and socially sustainable way. Multi-year management plans support healthy fish populations, allow natural life cycles, and protect the biodiversity of aquatic ecosystems.
Finland also uses various strategies and programs to support recreational and commercial fishing and to manage fishing waters. These initiatives identify key challenges and outline measures to reach desired outcomes. Species-specific strategies address the unique needs of each population and help Finland meet both national and international obligations.
The regulation of fisheries and aquaculture in Finland is shaped by a combination of national legislation and EU-level frameworks, notably the Finnish Fishing Act and the EU Common Fisheries Policy; Finland also complements EU provisions with national measures where relevant (Ministry of Agriculture and Forestry of Finland, n.d.). The Ministry of Agriculture and Forestry is responsible for overall fisheries administration, while regional implementation is carried out by the ELY Centres (Centres for Economic Development, Transport and the Environment). These centres manage tasks such as registering commercial fishers, administering Finland’s share of EU catch quotas, and participating in monitoring and enforcement activities. Although the national Fishing Act (kalastuslaki) forms the core of domestic fisheries legislation, commercial fishing in marine areas is largely governed by the EU’s Common Fisheries Policy, which sets species-specific quotas for herring, sprat, and salmon based on ICES scientific advice.
Commercial species that are subject to quotas are Baltic Sea salmon, cod, Baltic herring, sprat, and plaice (The Pro Fish Association, 2023)
The EU manages Baltic fisheries through science-based catch limits and regulations set under the Common Fisheries Policy, with advice from ICES and other expert bodies and final decisions by EU institutions. Herring and sprat are now the main, well-managed stocks, while cod has collapsed and is only allowed as bycatch. Differences in stock areas and quotas mean management and fishing patterns vary across the Baltic Sea (FAO, n.d.)
Finland has many inland waters suitable for commercial fishing, but private ownership and regulatory requirements can make access difficult for fishermen. Even so, inland fisheries have grown and now account for about 5% of the country’s total commercial catch, a higher share than in many other coastal countries (FAO, n.d.)
In 2026, the status of the main commercially important fish stocks in Finnish waters of the Baltic Sea was evaluated against fishing mortality and biomass reference points under the maximum sustainable yield (MSY) framework. As shown in Table 6.5, fishing pressure is assessed relative to FMSY and stock size relative to the MSY biomass trigger (MSY Btrigger). Green indicates stocks with fishing mortality at or below FMSY and spawning‐stock biomass above MSY Btrigger, while red indicates stocks that are either subject to fishing pressure above FMSY or have biomass below the trigger level. “Not defined” denotes stocks for which MSY reference points are not available and which are assessed using alternative precautionary or stock‐specific reference points.
Among the assessed stocks, plaice in subdivisions 21–32 is in good status with both fishing pressure and stock size above MSY reference levels. Sprat is characterized by fishing pressure above FMSY but with biomass above MSY Btrigger, while central Baltic herring shows fishing pressure below FMSY but stock size still below the MSY trigger. Eastern Baltic cod remains in a depleted state, with spawning‐stock biomass below safe biological limits and no defined MSY fishing mortality reference point. Baltic salmon in the Gulf of Finland is assessed under a precautionary, river‐based framework rather than MSY, and is therefore not classified relative to FMSY or MSY Btrigger.
The Natural Resources Institute Finland (LUKE) monitors herring and sprat stocks annually using sonar surveys and catch samples. Coastal species such as pike-perch, whitefish, and perch are assessed from catches, with full stock assessments mainly for pike-perch in the Archipelago Sea. Salmon and sea trout stocks are monitored in rivers through surveys of spawning adults and juvenile densities (SYKE, n.d.)
Species/stock | Fishing pressure | Stock size |
F ≤ FMSY | SSB ≥ MSY Btrigger | |
Eastern Baltic cod (SD 24–32) | Not defined | Not good |
Central Baltic herring (her.27.25-2932) | Good | Not good |
Sprat in subdivisions 22–32 (Baltic Sea) | Not good | Good |
Plaice in subdivisions 21–32 | Good | Good |
Baltic salmon | Not defined | Not defined |
Table 6.5: Status of main stocks for Finnish fisheries: stock status and fishing pressure. Source: ICES (2025a, 2025g, 2025j, 2025m, 2025n)
Aquaculture in Finland is regulated through a strict permitting system. Production facilities require an environmental permit under the Environmental Protection Act if they use more than 2,000 kg of feed per year, with permit applications processed by the Regional State Administrative Agencies (AVI). Additional requirements may include a Water Act permit, and large-scale marine installations with an annual growth of at least one million kilograms are subject to a mandatory Environmental Impact Assessment (EIA). The tight regulatory framework is a key reason why aquaculture production remains lower today than in the early 1990s (Setälä et al., 2024).
Finland’s Aquaculture Strategy aims to strengthen the sector’s competitiveness while ensuring ecological, economic, and social sustainability. It seeks sustainable growth, including raising Mainland production to 20 million kilos and over €100 million in value, all within strict environmental limits (Ministry of Agriculture and Forestry of Finland, 2022).
Finnish aquaculture occurs both along the coast and in continental areas (inland freshwater systems). These include the brackish coasts of the Gulf of Finland, the Gulf of Bothnia, the Archipelago, and the Åland Islands (Paisly et al., 2010).
Åland regulates its own fisheries and aquaculture under the autonomy granted by the Åland Self-Government Act. As a result, most national development measures apply only to mainland Finland, while Åland’s Government makes its own decisions on fisheries management. Åland also receives a designated share of Finland’s EU fishing quotas and administers these independently. The region plays a major role in Finnish aquaculture. Although fisheries governance is autonomous, Åland participates in national coordination during crises, and preparedness in exceptional circumstances may fall under central government legislation. (Setälä et al., 2024)
Although Åland has autonomous competence over fisheries management and administers its own share of Finland’s EU fishing quotas, the biological stock assessments and MSY reference points used in this study are those provided by ICES for the relevant Baltic Sea stock areas, which apply equally to waters around Åland and mainland Finland.
Tourist fishing is also regulated: There exists a fisheries management fee for all fishers (aged 18–69) in Finland, which gives the right to fish with one rod anywhere in Finland. There are exception; 1) fishing is prohibited in waters containing migratory fish, prohibited areas, and the Åland Islands, 2) there are no fee for angling with a hook and line, ice-fishing, or herring fishing with a rig, 3) the fisher needs a permit from the owner of the water when trolling with multiple rods, trap fishing, or crayfishing (Fishing in Finland, n.d.).
Processing and Value Chain Overview: Finland
Figure 6.1 provides an overview of how fishery and aquaculture products move through the Finnish seafood value chain. It illustrates the main pathways for domestic catches and aquaculture production, as well as imports, through processing and wholesale channels, before reaching different end markets such as retail, fishmongers, open markets, direct sales, food service (HO.RE.CA), and exports.
The Finnish fish processing sector is highly concentrated, with the ten largest companies generating 88% of the sector’s total processing turnover and 85% of wholesale turnover, while concentration levels in primary production remain below 60%. Moreover, just five firms account for roughly half of Finland’s combined fish processing and wholesale revenues, illustrating the structural dominance of a small number of large actors. These leading companies are distributed across different regions of the country rather than clustered in a single area, reflecting a geographically dispersed but commercially consolidated industry landscape (Setälä et al., 2024).
There were 116 fish processing enterprises in Finland in 2023 (Luke, 2026). Most of these were small- and medium-sized enterprises, but the largest companies accounted for the majority of products. Fish is also partially processed by wholesale companies that mediate its trade; there were 50 such wholesalers (Valve et al., 2022).
Finnish processors produced 55 605 tonnes of fish. More than half of this (57%) is domestic fish. The most important species in 2023 was Baltic herring (18,997 tonnes), where 98% was domestic. Imported salmon is the second-most-important raw material for fish processing (17,290 tonnes). Most of this salmon comes from Norway. Rainbow trout is the third most important species in Finnish fish processing, with 13,827 tonnes in 2023, of which 65% were domestic fish. Most of the imported trout is from Sweden.
Fish processing companies employed 975 people and fish wholesalers 503 people in Finland in 2020 (Valve et al., 2022).
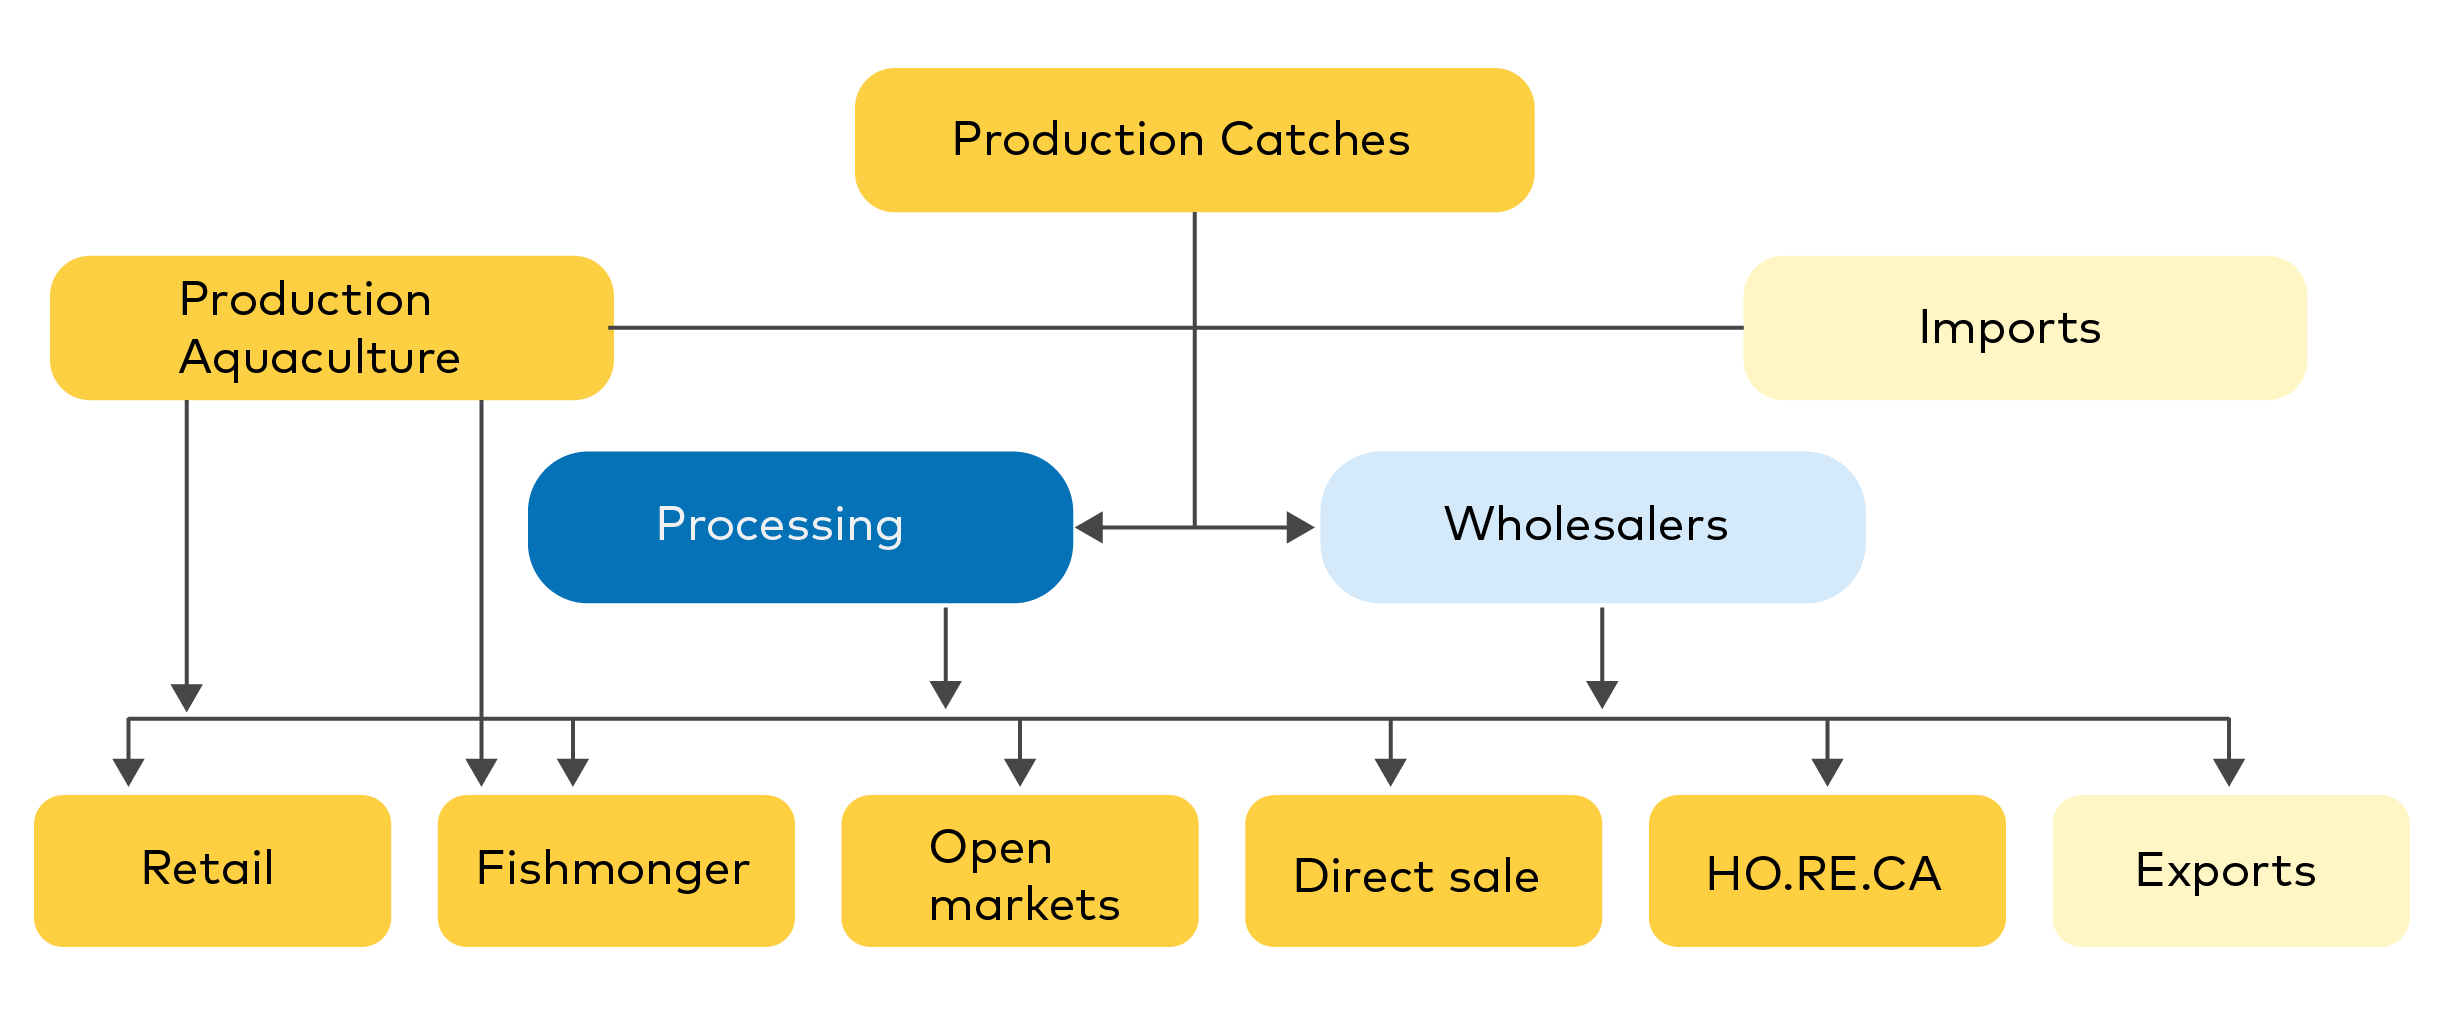
Figure 6.1: The supply chain for fisheries and aquaculture products in Finland. Source: EUMOFA (2026)
In 2023, the fishing fleet of Finland was 3,238 vessels, with a capacity of 15,096 gross tonnage. Most of the fleet is in the 0–11 m segment (98.2%). And nearly 75% use nets, followed by traps 22% (EUMOFA, 2026).
Finnish marine catches take place in the Bothnian Sea (68%), the Archipelago (17%), and the Gulf of Finland (9%). In addition, smaller quantities are caught in areas such as the East of Gotland and the Bothnian Bay (Luke, 2026).
The regions in catch statistics are defined by the residence of the fisherman or enterprise. Some Finnish fishers will also land their fish in other regions and abroad. However, it should not be unreasonable to assume a certain correlation between fishers residence and quantities. Thus, commercial fishing in Finland seems to be strongly concentrated in a few coastal regions. Marine fisheries dominate, with the largest catches taken in Southwest Finland (35,374 tonnes), followed by Åland (9,149 tonnes), Ostrobothnia (14,095 tonnes), North Ostrobothnia (13,088 tonnes), and Satakunta (10,400 tonnes). These regions account for nearly all marine landings. Inland commercial fishing is much smaller in scale and is most significant in South Savo, Lapland, North Karelia, North Savo, Kainuu, and Uusimaa, though each contributes under 1,000 tonnes.
The number of aquaculture facilities and professional fishermen shows a similar regional divide. Marine fish farms are heavily concentrated in Southwest Finland and Åland, which together account for most active marine farms. Inland regions such as Kainuu, South Savo, North Savo, and Lapland host many natural food pond farmers, reflecting the strong role of traditional pond-based rearing and juvenile production rather than large-scale commercial harvests. This explains why several inland areas have a relatively high number of registered aquaculture operators despite reporting little or no production volume.
Regions | Farming | Commercial fishing | Total | ||
Inland | Marine | Inland | Marine | ||
Southwest Finland | 1 | 35,374 | 35,375 | ||
Åland | 5,970 | 9,149 | 15,119 | ||
Ostrobothnia | 788 | 16 | 14,095 | 14,899 | |
North Ostrobothnia | 317 | 13,088 | 13,405 | ||
Satakunta | 573 | 10,400 | 10,973 | ||
Uusimaa | 199 | 7,265 | 7,464 | ||
Varsinais-Suomi | 4,143 | 4,143 | |||
Not specified | 1,746 | 890 | 2,636 | ||
Kainuu | 1,075 | 220 | 1,295 | ||
South Savo | 970 | 970 | |||
Lapland | 407 | 339 | 54 | 800 | |
North Karelia | 503 | 503 | |||
North Savo | 473 | 473 | |||
South Karelia | 318 | 318 | |||
Päijät-Häme | 295 | 295 | |||
Pirkanmaa | 213 | 213 | |||
Central Finland | 209 | 209 | |||
South Ostrobothnia | 100 | 87 | 187 | ||
Southeastern Finland | 150 | 150 | |||
Kanta-Häme | 122 | 122 | |||
Kymenlaakso | 7 | 60 | 67 | ||
Central Ostrobothnia | 6 | 6 | |||
Total | 3,228 | 11,941 | 4,881 | 89,572 | 109,622 |
Table 6.6: Farming and catch (tonnes) per region in 2023. Source: Luke, 2026
According to Luke (2026) 217 fish farming enterprises operated in Finland in 2023 (covering both sea and inland areas). In 2023, Finland had 143 fish farms and 133 natural‑food‑pond farmers (LUKE, 2026)
. These figures represent the number of farms engaged in each production line, and the categories are not additive because some enterprises may operate in more than one production type.
In addition, there are 106 Fry farms.
Marine fishers are most numerous in Ostrobothnia, North Ostrobothnia, Satakunta, Southwest Finland, and Åland, where the main commercial marine fisheries operate along the Bothnian Bay and the Archipelago Sea. Inland fishers, on the other hand, are concentrated in Lapland, North Karelia, South Savo, and North Savo, all of which have extensive lake systems and long-standing freshwater fishing traditions. Overall, these patterns highlight a clear structural divide: the coast supports large commercial fisheries and marine aquaculture, while inland regions are dominated by small-scale pond farming and freshwater fishing activities.
Region | Fish farms | Fishermen | ||
Food fish farms | Natural food pond farms | Marine | Inland | |
Central Ostrobothnia | 0 | 0 | 112 | 12 |
Kymenlaakso | 0 | 0 | 90 | 11 |
Lapland | 9 | 6 | 66 | 219 |
North Ostrobothnia | 0 | 0 | 495 | 158 |
Ostrobothnia | 11 | 6 | 540 | 45 |
Satakunta | 0 | 0 | 168 | 74 |
Southeastern Finland | 3 | 10 | 0 | |
Southwest Finland | 51 | 8 | 280 | 26 |
Uusimaa | 3 | 3 | 149 | 48 |
Åland | 25 | 0 | 206 | |
Central Finland | 5 | 28 | 2 | 117 |
Kainuu | 23 | 21 | 1 | 128 |
Kanta-Häme | 1 | 8 | 3 | 21 |
North Karelia | 4 | 4 | 3 | 240 |
North Savo | 5 | 15 | 2 | 146 |
Pirkanmaa | 0 | 0 | 2 | 115 |
Päijät-Häme | 0 | 0 | 2 | 64 |
South Karelia | 0 | 0 | 4 | 73 |
South Ostrobothnia | 0 | 0 | 5 | 41 |
South Savo | 3 | 24 | 3 | 171 |
Total | 143 | 133 | 2133 | 1,709 |
Table 6.7: Fish farms and fishers per region in 2023. Source: Luke, 2026.
Processing
While nearly all deep-frozen, ungutted products are based on Baltic herring and sprat, most other end-products, such as fresh and frozen filets, smoked products, and ready-to-eat products, are based on salmon and rainbow trout.
Most Finnish caught Baltic herring, and sprat are too small for filleting, with only 5–25% of herring landings meeting food-grade requirements, meaning that domestic consumer-oriented fish processing depends heavily on imported fish rather than domestic pelagic species (Setälä et al, 2024)
End-product (and species) | Tonnes (raw material) | Share of total |
Fresh - fillet | 21,388 | 38% |
Salmon | 13,637 | |
Rainbow trout | 4,915 | |
Baltic herring and sprat | 1,238 | |
Other | 1,598 | |
Deep frozen - ungutted | 16,615 | 30% |
Baltic herring and sprat | 16,511 | |
Other | 104 | |
Smoked | 5,677 | 10% |
Rainbow trout | 3,428 | |
Salmon | 1,582 | |
Other | 667 | |
Deep frozen - other | 2,263 | 4% |
Rainbow trout | 1,953 | |
Other | 310 | |
Deep frozen - fillet | 2,107 | 4% |
Rainbow trout | 1,207 | |
Other | 900 | |
Other | 1,619 | 3% |
Salmon | 490 | |
Other | 1,129 | |
Cold smoked | 1,599 | 3% |
Rainbow trout | 1,193 | |
Other | 406 | |
Ready-to-eat food | 983 | 2% |
Salmon | 267 | |
Baltic herring and sprat | 267 | |
Other | 449 | |
Salted / Slightly salted | 948 | 2% |
Preserve | 911 | 2% |
Fresh - other | 854 | 2% |
Semipreserve | 643 | 1% |
Total | 107,858 | 100% |
Table 6.8: End-products in Finnish fish processing, by species in 2023. Source: Luke, 2026.
Meal and oil
Finland’s fish processing sector is characterized by strategic domestic production of fish meal and oil, primarily in specialized facilities at Kasnäs and Kaskinen (Setälä et al., 2024). This industry leverages the Baltic Sea's significant pelagic resources to enhance the national security of supply. Approximately 80% of the sprat and more than one-third of the herring caught by Finnish vessels were directed toward fish meal production in 2023 (Setälä et al., 2024). Of the total supply of Herring in Finland, about 22,600 tonnes are estimated to be available for domestic meal and oil production (Luke, 2024). This localized processing infrastructure is critical because it enables the extraction of environmental toxins, such as dioxins, providing a safer domestic source of marine proteins and fats. Consequently, Finland has achieved a notable level of self-sufficiency in raw materials; more than 60% of raw materials are of domestic origin (Setälä et al., 2024).
The domestic fish feed industry competes with other producers of fish and livestock feed for raw materials. In 2021, nearly 1,450 million kilograms of feed for other production animals and about 17 million kilograms of pet food were needed in Finland (Setälä et al, 2024).
However, despite this robust domestic base for marine ingredients, the broader Finnish aquaculture industry remains heavily dependent on imports from the Nordic region and global markets. While Finland possesses significant production capacity, nearly half of the finished fish feed used in domestic fish farming is currently imported, with Denmark serving as the primary supplier. Furthermore, specialized start feed for fry weighing less than one gram is not produced within Finland, necessitating total reliance on imports for early-stage development. Even for feed manufactured domestically, the supply chain is vulnerable to global disruptions; essential additives such as vitamins and amino acids are largely sourced from Asian markets.
Trade flows of Aquatic food: Finland
Imports for human consumption
Finnish imports of aquatic food for human consumption are more than twice their own production. Fresh whole salmon from Norway accounts for nearly half of the imports in 2023. Salmon is also the most consumed species in Finland. Prepared herring is primarily sourced from Sweden (62%), followed by Denmark, Poland, and Norway. Sweden is also the largest supplier of fresh, whole trout to Finland. Other prepared species are sourced from a wide variety of countries, both Nordic (mainly Sweden with 19%), European (such as Germany, Spain, and Estonia), and overseas markets such as Thailand (11%) and Mauritius (7%). Tunas are the dominating species in this category (44%), followed by undefined species (32%), prawns, and whitefish species. Europe is the primary source of imports, accounting for 90%, of which 66% are from Nordic countries. Imports from Asia accounted for 6% in 2023.
Products and species | Quantity (Tonnes live weight) | Value (1000 EURO) | ||
Import total | Import Nordic | Import total | Import Nordic | |
Herring | 4,363 | 3,463 | 13,099 | 10,771 |
Fresh whole/live | 377 | 34 | 446 | 165 |
Frozen whole | 21 | 20 | 108 | 94 |
Fillet | 555 | 403 | 1 275 | 942 |
Prepared | 3,254 | 2,889 | 10,897 | 9,315 |
Other | 155 | 117 | 374 | 256 |
Salmon | 51,533 | 49,837 | 339,678 | 329,364 |
Fresh whole/live | 43,947 | 43,947 | 287,660 | 287,660 |
Frozen whole | 95 | 92 | 128 | 114 |
Fillet | 6,216 | 4,984 | 42,794 | 36,037 |
Prepared | 250 | 194 | 1,568 | 1,205 |
Other | 1,025 | 620 | 7,528 | 4,349 |
Trout | 7,480 | 7,141 | 39,916 | 37,998 |
Fresh whole/live | 6,457 | 6,426 | 34,605 | 34,399 |
Frozen whole | 517 | 515 | 2,607 | 2,596 |
Fillet | 37 | 3 | 211 | 28 |
Other | 469 | 197 | 2,493 | 975 |
Sprat | 587 | 238 | 2,545 | 1,187 |
Fresh whole/live | 12 | 254 | ||
Frozen whole | 4 | 11 | ||
Prepared | 571 | 238 | 2,279 | 1,187 |
Other | 46,327 | 12,642 | 163,855 | 59,185 |
Fresh whole/live | 492 | 238 | 4,056 | 2,074 |
Frozen whole | 3,814 | 1,190 | 22,010 | 8,297 |
Fillet | 6,551 | 1,200 | 17,455 | 3,897 |
Prepared | 33,022 | 8,794 | 103,069 | 36,161 |
Other | 2,448 | 1,220 | 17,266 | 8,755 |
Total | 110,290 | 73,321 | 559,094 | 438,504 |
Fresh whole/live | 51,285 | 50,645 | 327,021 | 324,297 |
Frozen whole | 4,452 | 1,817 | 24,864 | 11,101 |
Fillet | 13,359 | 6,591 | 61,735 | 40,904 |
Prepared | 37,097 | 12,114 | 117,813 | 47,867 |
Other | 4,097 | 2,154 | 27,661 | 14,335 |
Table 6.9: Imports for human consumption in 2023. Source: NSC/Eurostat, 2025
Imports of Marine Ingredients and Feed
Finland is self-sufficient in raw materials for its own fishmeal production, but imports other raw materials. The import dependency is 40% (Setälä et al., 2024). In addition, there are imports of products such as meal and oil for feed, where the majority (80%) comes from other Nordic countries (Norway (54%), Denmark (21%), and Sweden (5%). In addition, 15% comes from Estonia. When considering all the feed used in Finnish aquaculture, about half of the finished feed is imported (Setälä et al., 2024).
Product categories | Quantity (tonnes product weight) | Value (1000 EURO) | ||
Import total | Import Nordic | Import total | Import Nordic | |
Animal feed | 57 | 52 | 407 | 29 |
Fish fats and oils | 913 | 426 | 4,095 | 1,629 |
Fish meal | 1,057 | 942 | 2,186 | 1,975 |
Fish waste | 1,571 | 1,571 | 365 | 362 |
Other1 | 296 | 140 | 1,986 | 1,228 |
Total | 3,894 | 3,131 | 9,039 | 5,223 |
Table 6.10: Imports of marine ingredients and feed in 2023: Source: NSC/Eurostat (2025), and Luke (2026).
1. Other contains other fish for human consumption, such as fish liver oils and fish meal, and other fish not for human consumption.
Exports for human consumption
Excluding fish meal exports, the most important product in Finnish exports is fresh, whole salmon. This originates mainly from Norway and is to be considered re-exports to other European countries, such as Poland, the Netherlands, France, Lithuania, and Spain, among others, as well as some exports to Sweden. The second most important product in Finnish exports for human consumption is fresh, whole trout, of which about two-thirds is destined for Estonia and Lithuania. In 2023, 93% of exports for human consumption were destined for European countries, of which 7% for other Nordic countries.
Products and species | Quantity (Tonnes live weight) | Value (1000 EURO) | ||
Export total | Export Nordic | Export total | Export total | |
Herring | 11,006 | 0 | 7,351 | 4 |
Fresh whole/live | - | |||
Frozen whole | 10,960 | 7,141 | ||
Fillet | 20 | - | 23 | - |
Prepared | 26 | 0 | 187 | 4 |
Salmon | 29,881 | 2,379 | 186,686 | 16,852 |
Fresh whole/live | 28,869 | 1,572 | 178,667 | 10,803 |
Frozen whole | - | - | - | - |
Fillet | 677 | 588 | 5,071 | 4,334 |
Prepared | 18 | 12 | 223 | 173 |
Other | 318 | 206 | 2 725 | 1 542 |
Trout | 3,213 | 494 | 18,005 | 2,810 |
Fresh whole/live | 2,937 | 315 | 16,556 | 1,966 |
Frozen whole | 79 | 22 | 448 | 97 |
Fillet | 12 | - | 43 | - |
Other | 184 | 158 | 958 | 747 |
Sprat | 269 | - | 203 | - |
Fresh whole/live | ||||
Frozen whole | 267 | - | 192 | - |
Prepared | 2 | - | 11 | - |
Other | 1,397 | 287 | 19,378 | 3,324 |
Fresh whole/live | 137 | 5 | 1 170 | 83 |
Frozen whole | 821 | 66 | 733 | 26 |
Fillet | 101 | 84 | 562 | 493 |
Prepared | 145 | 13 | 3,416 | 194 |
Other | 194 | 120 | 13,497 | 3,834 |
Total | 45,767 | 3,160 | 231,623 | 24,295 |
Fresh whole/live | 31,943 | 1,892 | 196,392 | 12,852 |
Frozen whole | 12,127 | 87 | 8,515 | 123 |
Fillet | 810 | 672 | 5,699 | 4,826 |
Prepared | 191 | 26 | 3,837 | 372 |
Other | 696 | 484 | 17,180 | 6,123 |
Table 6.11: Export for human consumption in 2023. Source: NSC/Eurostat (2025).
Exports of Marine Ingredients and Feed
Finland is a net exporter of feed products. While they in 2023 imported 3598 fish meal and/or oil, or other animal feed, they exported 8 417 tonnes of the same products. The main markets are Denmark (42%) and Estonia (25%).
A substantial part of the exported Herring and sprat is for reduction; however, the exact quantity is not known. Finnish trawlers land their catches directly in ports in Sweden and Estonia, from where the fish is transported to fishmeal factories in those countries or in Denmark. In addition, herring is frozen in Finland and exported as raw material for fishmeal and furanimal feed production in Denmark (Setälä et al., 2024). Thus, to estimate the share of exports of fresh and frozen whole Herring and Sprat for meal and oil, the destination market is considered; all exports to Sweden, Estonia, and Denmark are assumed to be for meal and oil, while the remaining is assumed to be destined for consumption.
Product categories | Quantity (tonnes product weight) | Value (1000 EURO) | ||
Export total | Export Nordic | Export total | Export Nordic | |
Fresh whole Herring and Sprat | 27,002 | 4,483 | 10,002 | 1,713 |
Frozen whole Herring | 5,282 | 938 | 2,235 | 346 |
Animal feed | 629 | 303 | ||
Fish fats and oils | 1,582 | 986 | 7,251 | 5,033 |
Fish meal | 2,803 | 1,559 | 5,376 | 2,923 |
Fish waste | 3,403 | 1,027 | 1,694 | 515 |
Other | 36 | 3 | 293 | 75 |
Total | 40,737 | 8,996 | 27,155 | 10,604 |
Table 6.12: Exports of marine ingredients for feed in 2023. Source: NSC/Eurostat (2025), and Luke (2026).
Aquatic food available for consumption in Finland
By adding imports to primary production and subtracting exports, the total availability of aquatic food for human consumption in Finland in 2023 is estimated at 108,756 tonnes. This corresponds to approximately 19 kilograms per capita per year.
Luke estimates fish consumption per capita and finds that in Finland in 2023, it was 11.9 kg/capita/year (Luke, 2026). FAO’s apparent consumption figure is substantially higher, with 31.49 kg/capita/year (FAO, 2026). However, these consumption figures are not fully comparable because domestic fish is reported mainly in filleted weight, while FAO uses live weight. In addition, domestic supply also includes recreational fishing (Luke, 2015). In 2023, nearly one-fifth of per capita consumption was from recreational fishing (Luke, 2026).
Primary production | Imports | Exports | Export share | Available for consumption | |
Total quantities (tonnes) | 44,205 | 110,318 | 45,767 | 30% | 108,756 |
Herring and Sprat | 18,634 | 556 | 11,275 | 59% | 7,915 |
Trout | 14,430 | 7,480 | 3,213 | 15% | 18,697 |
Other | 11,141 | 102,282 | 31,279 | 28% | 82,144 |
Quantities per capita (kg) | 8 | 20 | 8 | 19 | |
Herring and Sprat | 3 | 0 | 2 | 1 | |
Trout | 3 | 1 | 1 | 3 | |
Other | 2 | 18 | 6 | 15 |
Table 6.13: Available for consumption in Finland in 2023, total and a selection of species. Tonnes, live weight. Source: own estimations based on Luke (2026) and NSC/Eurostat (2025).
Currently, most domestic herring and sprat are too small for the industrial fillet lines. Expanding domestic herring canning capabilities is identified as a key opportunity to improve long-term storage and accessibility (Setälä et al., 2024).
When looking at what could be available for consumption, including all catches of Baltic herring and Sprat currently used in fish meal production, we find that the available fish reaches 31 kg/capita/year, which is also more in line with the above-mentioned FAO figures.
Primary production | Imports | Exports | Export share | Available for consumption | |
Total quantities (tonnes) | 109,626 | 110,318 | 45,767 | 21% | 174,177 |
Herring and Sprat | 84,055 | 556 | 11,275 | 13% | 73,336 |
Trout | 14,430 | 7,480 | 3,213 | 15% | 18,697 |
Other | 11,141 | 102,282 | 31,279 | 28% | 82,144 |
Quantities per capita (kg/year) | 19 | 20 | 8 | 31 | |
Herring and Sprat | 15 | 0 | 2 | 0 | 13 |
Trout | 3 | 1 | 1 | 0 | 3 |
Other | 2 | 18 | 6 | 0 | 15 |
Table 6.14: Potentially available for consumption in Finland in 2023, total and a selection of species. Tonnes, live weight. Source: own estimations based on Luke (2026) and NSC/Eurostat (2025).
Challenges, threats, and opportunities
This chapter summarizes the main challenges, threats, and opportunities currently facing Finland’s fisheries and aquaculture sectors.
Climate change is significantly altering the Baltic Sea ecosystem, with rising water temperatures and a marked decrease in sea ice cover. For the fishing industry, this has already contributed to an extended trawl fishing season in northern areas, alongside shifts in species composition toward warm-water-associated species. For example, sprat shows higher recruitment following mild winters with little ice. At the same time, these changes pose risks to ice-dependent species such as the ringed seal, as well as cold-adapted fish species whose reproduction is negatively affected by warming conditions. Given the cumulative pressures in the Baltic Sea, including warming, eutrophication, and shifting species distributions, future sustainability will require adaptive management approaches to maintain resilient fish stocks and marine ecosystems (HELCOM, 2024).
The Finnish wild catch and aquaculture sectors face significant structural and environmental hurdles that limit their growth and resilience. Commercial fishing is constrained by an aging trawler fleet with an average age exceeding 30 years and by EU regulations that prohibit investment support for fleet modernization. Furthermore, coastal and inland fishing are severely impacted by increasing populations of seals and cormorants, which damage gear and reduce catch volumes, contributing to a decline in the number of active fishers. In aquaculture, strict environmental permit systems related to the eutrophication of the Baltic Sea remain the primary barrier to expansion, keeping production levels significantly lower than in the early 1990s (Setälä et al., 2024)
Although climate change presents considerable risks to the Baltic Sea, it also creates certain opportunities. Reduced ice cover extends the operational fishing season in northern areas, while shifting species distributions may increase the availability of warm-water–associated pelagic species, such as sprat, which show stronger recruitment in mild, low-ice winters. At the same time, successful nutrientreduction measures could improve oxygen conditions and strengthen ecosystem resilience, offering more stable conditions for both fisheries and aquaculture. Longer ice-free periods also expand the potential for recreational fishing and coastal tourism, while advances in processing technologies may enable greater use of underutilized domestic pelagic resources for human consumption, supporting Finland’s long-term goals for self-sufficiency and food security (HELCOM, 2024).
Additionally, the industry is vulnerable to biological threats, such as fish diseases, where a lack of domestic vaccine production creates a critical dependency on international suppliers.
The seafood processing industry and the broader supply chain exhibit deep strategic vulnerabilities due to high market concentration and a heavy reliance on imports. Currently, the ten largest companies control 88% of the processing turnover, making the national supply chain highly sensitive to the stability of a few major actors.
Despite significant domestic landings of herring and sprat, the processing sector remains dependent on imported raw materials, primarily Norwegian salmon, because a large portion of the domestic catch is too small for modern filleting lines, with only 5–25% of herring landings meeting food-grade requirements (Setälä et al, 2024). Security of supply is further compromised by a reliance on global markets for critical inputs, including fish feed components (often sourced from Denmark), vaccines, and specialized technological equipment from Asia and other Nordic countries (Setälä et al, 2024). This dependency, combined with high sensitivity to energy price volatility and international logistical disruptions (Setälä et al, 2024), underscores the fragility of Finland's current seafood self-sufficiency.
There is a significant potential to enhance Finland’s food security by optimizing the use of domestic pelagic species. The sources highlight that Baltic herring, Finland’s most important fish resource, could be utilized for human consumption to a much greater extent than it is today. Currently, a vast majority of the herring and sprat catch is diverted to animal feed, but in crisis situations, these raw materials could be strategically redirected to the national food supply. Furthermore, Finnish waters contain abundant underutilized stocks—including sprat, smelt, and cyprinids such as roach and bream—that are ecologically sustainable and nutritionally valuable, offering a decentralized reserve of animal protein that remains largely untapped by the commercial food industry.
Although much of the recent herring catch has been too small for traditional filleting lines, the development of new processing methods and an efficient domestic canning line for underutilized species provides a foundation for future growth (Setälä et al., 2024).
Setälä et al. (2024) provide a comprehensive assessment of vulnerabilities and development opportunities in Finland’s seafood sector and is recommended as a read for further information on the topic.