1. Norway
Introduction
Norway is one of the world’s leading producers and exporters of aquatic foods, and the seafood industry remains a key national sector. In 2023, the sector accounted for 2.3% of mainland GDP
and employed 96,000 persons, directly and indirectly, corresponding to 3% of the workforce. Of these, we find 42,000 in the core activities and 54 000 as spillover effects among suppliers, their suppliers, and so on (Nyrud et al., 2024). Aquaculture, and in particular Atlantic salmon farming, is the dominant segment and generates more than half of the industry’s total value creation.
Mainland GDP refers to Norway’s economy excluding offshore oil and gas activities, a quite substantial sector.
With a small domestic population, Norway exports most of its seafood production. The EU is the most important destination, and the Nordic countries account for 12% of Norwegian exports for human consumption and 25% of Norwegian imports of aquatic foods.
A large share of exported volumes is processed abroad, mainly in European hub and processing markets such as Denmark, Poland, and the Netherlands, as well as in Asia. These products are either consumed locally or re-exported to other markets. Although Norway also produces emerging aquatic foods such as algae and seaweed, these volumes remain insignificant in the context of human consumption.
Primary production
Norway’s aquatic food production is built on both capture fishery and aquaculture. Capture fisheries in Norway comprise all wild-caught aquatic resources, including fish, crustaceans, molluscs, and algae, delivered for human consumption, reduction, or other uses. The sector shows considerable variation across species groups, both in landed volumes and economic value. While capture fisheries remain more important in terms of total quantity, aquaculture dominates Norwegian seafood production by value.
Capture fishery
Norway’s capture fishery consists of a wide variety of wild-caught species. Pelagic species such as Norwegian spring-spawning herring and mackerel account for the largest volumes, whereas demersal species, particularly cod, drive economic value. In addition to fish landed for human consumption, a substantial share of pelagic species is directed to reduction, mainly for meal and oil production. Landings of crustaceans and molluscs are modest in volume but important to specific coastal regions and market segments. Nearly all harvested seaweed is directed to non-food uses or employed as an ingredient in food processing, for example, in the production of alginate. The figures in Table 1.1 represent the total catch by Norwegian vessels that is landed in Norway, where about 1,487,043 tonnes were available for consumption, at a value of NOK 27.7 billion, in 2023. In addition, 58,769 tonnes of fish for human consumption were caught by Norwegian vessels and landed abroad. The majority of this was landings of pelagic species such as capelin, Norwegian Spring-spawning herring, and mackerel in Iceland and the Faroe Islands, and North Sea herring in Denmark. These figures should appear in the export statistics and will not be included in the residual analysis.
The availability of aquatic food from fisheries varies considerably from year to year, largely due to quota fluctuations. Among demersal species, cod volumes declined sharply in 2023, while saithe landings increased, and overall demersal value recovered strongly from the low point in 2021, though it remained slightly below the 2022 level. Pelagic catches rose until 2021 and subsequently decreased, yet the total value climbed to NOK 8.2 billion in 2023, driven by strong prices for herring and mackerel. Shellfish and other invertebrates showed steady growth in landed volume, with a value peak in 2022, followed by a mild decline in 2023. Production for reduction purposes displayed high volatility, notably due to a significant rebound in blue whiting landings in 2023.
Table 1.1: Primary production from fisheries. Source: Norwegian Directorate of Fisheries, 2025b.
Quantity (tonnes live weight) | Value (NOK million) | |||||||||
2019 | 2020 | 2021 | 2022 | 2023 | 2019 | 2020 | 2021 | 2022 | 2023 | |
Fishery for human consumption | 1,384,548 | 1,438,463 | 1,661,913 | 1,587,016 | 1,487,043 | 18,910 | 18,949 | 12,872 | 26,875 | 27,655 |
Demersal fish, flatfish, deep-sea spc. | 727,784 | 722,479 | 792,265 | 772,642 | 736,098 | 12,721 | 11,855 | 8,325 | 16,807 | 16,732 |
Cod | 328,589 | 331,198 | 381,457 | 354,213 | 293,609 | 7,450 | 7,334 | 4,980 | 9,874 | 9,433 |
Saithe | 191,862 | 189,159 | 190,411 | 209,356 | 228,120 | 1,638 | 1,651 | 1,131 | 2,763 | 3,008 |
Haddock | 94,992 | 88,847 | 101,551 | 89,467 | 92,265 | 1,568 | 1,263 | 1,122 | 1,695 | 1,513 |
Redfish | 31,646 | 40,680 | 52,645 | 49,273 | 52,821 | 324 | 330 | 304 | 577 | 698 |
Greenland halibut | 17,020 | 17,259 | 16,291 | 16,884 | 16,919 | 646 | 450 | 268 | 669 | 817 |
Other | 63,675 | 55,336 | 49,909 | 53,451 | 52,364 | 1,094 | 828 | 520 | 1,229 | 1,261 |
Pelagic fish | 615,560 | 678,677 | 820,229 | 757,285 | 685,132 | 4,524 | 5,494 | 2,630 | 7,058 | 8,197 |
Norwegian Spring-spawning herring | 391,017 | 395,269 | 467,767 | 359,237 | 356,182 | 1,709 | 2,273 | 1,232 | 2,558 | 3,349 |
Mackerel | 149,669 | 203,102 | 253,202 | 282,348 | 198,832 | 2,396 | 2,688 | 581 | 3,679 | 3,621 |
North sea herring | 55,700 | 64,313 | 57,571 | 55,350 | 59,376 | 317 | 440 | 345 | 403 | 628 |
Other | 19,174 | 15,993 | 41,689 | 60,350 | 70,741 | 102 | 93 | 472 | 419 | 599 |
Molluscs, crustaceans, echinoderms | 39,004 | 34,998 | 47,546 | 55,174 | 63,733 | 1,658 | 1,592 | 1,915 | 3,005 | 2,719 |
Northern shrimp | 26,162 | 22,844 | 31,343 | 37,586 | 38 106 | 941 | 799 | 815 | 1,208 | 1,165 |
Snow crab | 4,056 | 4,315 | 6,861 | 7,964 | 7,636 | 265 | 283 | 641 | 735 | 449 |
King crab | 1,724 | 2,081 | 2,121 | 2,166 | 2,802 | 303 | 371 | 359 | 841 | 781 |
Other | 7,062 | 5,758 | 7,221 | 7,458 | 15,189 | 149 | 139 | 101 | 220 | 324 |
Cartilaginous fish | 2,201 | 2,309 | 1,874 | 1,915 | 2,080 | 7 | 8 | 2 | 4 | 7 |
Aquatic food for reduction | 536,818 | 629,263 | 382,553 | 441,275 | 456,447 | 1,654 | 2,208 | 1,136 | 1,763 | 1,854 |
Blue whiting | 259,774 | 291,542 | 168,613 | 125,362 | 327,731 | 661 | 953 | 408 | 329 | 1 080 |
North sea herring | 56,092 | 38,926 | 28,853 | 65,504 | 43,797 | 269 | 209 | 145 | 362 | 317 |
Other | 220,952 | 298,795 | 185,087 | 250,408 | 84,919 | 724 | 1,046 | 583 | 1,072 | 456 |
Aquatic food: other uses | 166,095 | 155,214 | 162,961 | 173,612 | 189,762 | 254 | 254 | 161 | 223 | 234 |
Total Fishery | 2,087,461 | 2,222,939 | 2,207,426 | 2,201,903 | 2,133,251 | 20,817 | 21,411 | 14,170 | 28,860 | 29,743 |
Another aspect not analysed further in this report is the seasonal pattern of catches throughout the year. Figure 1.1 presents the average monthly landings of aquatic food for human consumption from 2019 to 2023. Clear seasonal peaks emerge across all species groups. Cod and other demersal species dominate landings in winter and early spring, reflecting established seasonal fisheries such as the Skrei fishery. Pelagic species, in contrast, show pronounced peaks in the autumn and in the first months of the year, primarily driven by herring and mackerel fisheries. Shellfish, molluscs, and echinoderms display a more even distribution throughout the year, though several species, particularly shrimp and snow crab, show elevated activity in early summer and autumn. Flatfish and other deep-water species also exhibit stable seasonal patterns, with modest increases in spring and early summer. Cartilaginous fish contribute only small volumes, but their catches show slight peaks in late autumn. Overall, these seasonal dynamics influence both the availability of raw material and the temporal distribution of processing activity within the seafood sector.
Figure 1.1: Average monthly landings of catch by Norwegian vessels 2019-2023. Source: The Norwegian Directorate of Fisheries (2025)
Aquaculture production
Total aquaculture production for human consumption, presented in Table 1.2, amounted to 1.65 million tonnes in 2023, valued at NOK 114.2 billion. Atlantic salmon remains the dominant species, representing 93% of volume and 94% of total value. Trout accounted for 91,000 tonnes, valued at approximately NOK 6 billion.
Production of other farmed species remains limited but is increasing. Farmed Atlantic cod has grown from zero in 2019 to 11.4 thousand tonnes in 2023, following earlier biological and market-related challenges. Farmed molluscs and crustaceans remain small in scale, and seaweed cultivation is still at an early stage, with 768 tonnes produced in 2023, of which 22% was used for human consumption.
Aquaculture for other uses includes algae.
Species, such as lumpfish, have been taken out of the equation because farming of this species is primarily cleaner fish, used in salmonoid aquaculture.
Table 1.2: Primary production from Aquaculture. Source: Norwegian Directorate of Fisheries, 2025a.
Quantity (tonnes live weight) | Value (NOK million) | |||||||||
2019 | 2020 | 2021 | 2022 | 2023 | 2019 | 2020 | 2021 | 2022 | 2023 | |
Aquaculture for human consumption | 1,452,026 | 1,489,577 | 1,664,866 | 1,661,520 | 1,649,847 | 71,709 | 68,716 | 80,434 | 108,259 | 114,239 |
Atlantic salmon | 1,364,042 | 1,388,434 | 1,562,415 | 1,564,948 | 1,542,480 | 67,990 | 64,677 | 75,783 | 102,464 | 107,534 |
Trout | 83,489 | 96,263 | 95,058 | 85,615 | 90,641 | 3,477 | 3,782 | 4,228 | 5,237 | 5,856 |
Cod | 0 | 163 | 1,622 | 5,116 | 11,389 | 0 | 8 | 67 | 189 | 450 |
Molluscs, crustaceans, echinoderms | 2,164 | 2,071 | 2,200 | 2,646 | 2,234 | 29 | 21 | 30 | 17 | 39 |
Halibut | 1,524 | 1,870 | 2,716 | 2,291 | 1,903 | 155 | 175 | 267 | 278 | 259 |
Other | 807 | 776 | 855 | 905 | 1200 | 58 | 53 | 59 | 74 | 100 |
Aquaculture other uses | 117 | 336 | 246 | 221 | 137 | 4,359 | 8,618 | 6,224 | 4,227 | 4,561 |
Regulation and management
Norway has one of the world’s longest coastlines, stretching from Kattegat and Skagerrak in the southeast to the North Sea, Norwegian Sea, and Barents Sea in the north. Including Svalbard, the country’s maritime zones are about seven times larger than its land area. Inland lakes and rivers also provide fish resources, but mainly for recreation and household consumption. In 2023, 62% of the catch by Norwegian vessels was taken within the Norwegian Exclusive Economic Zone (EEZ). This was followed by fisheries in international waters, primarily in the Antarctica and Irminger Sea/Reykjanes Ridge areas, accounting for 19% of the total catch. Catches in the United Kingdom EEZ accounted for 7%, the EU zone for 4%, and the Fisheries Protection Zone around Svalbard for 3%; the remaining ~5% was taken in other areas, including the Icelandic, Faroese, and Russian EEZs.
Modern fisheries management in Norway emerged after the collapse of the spring-spawning herring stock in the 1970s, which underscored the need for strict regulation. The introduction of 200-nautical-mile Exclusive Economic Zones (EEZs) in 1977 gave Norway control over its marine resources and enabled regulated fishing. Over the past five decades, the sector has shifted from open access and heavy subsidies to a quota-based system with individual transferable quotas (ITQs), turning it into a resource rent-generating industry. Today, both fisheries and aquaculture are tightly managed.
Norwegian fisheries management is grounded in scientific advice and international cooperation. Stock assessments from the Norwegian Institute of Marine Research (IMR) and recommendations from the International Council for the Exploration of the Sea (ICES) guide annual Total Allowable Catches (TACs) and conservation measures. These decisions are negotiated through bilateral and multilateral agreements with partners such as the European Union, the United Kingdom, and Russia, and coordinated through regional bodies such as the North East Atlantic Fisheries Commission (NEAFC). Norway also adheres to global frameworks, including the United Nations Convention on the Law of the Sea and the United Nations Fish Stocks Agreement, ensuring sustainable practices and joint efforts to combat illegal fishing.
Table 1.3 shows fishing pressure and stock size for the main commercially important stocks in Norwegian and adjacent waters, evaluated relative to maximum sustainable yield (MSY) reference points in the 2025 advice. Green indicates stocks for which fishing mortality is at or below the MSY level and whose spawning stock biomass is above the MSY trigger level. Red indicates stocks that are either fished above MSY or whose spawning-stock biomass is below the MSY trigger. “Not defined” denotes stocks for which MSY reference points are not available and which are managed using alternative precautionary or management‐plan targets.
Table 1.3: Status of main stocks for Norwegian fisheries: stock status and fishing pressure. Source: ICES (2025b, 2025c, 2025d, 2025f, 2025h, 2025k, 2025l, 2025p, 2025q); IMR (2024a, 2024b, 2024c; 2025a, 2025b)
Species/stock | Fishing pressure | Stock size |
F ≤ FMSY | SSB ≥ MSY Btrigger | |
Northeast Arctic cod (cod.27.1-2) | Not good | Not good |
North Sea cod (Southern substock) | Not good | Not good |
Northern Norwegian Coastal Cod (north of 67°N) | Not defined | Not defined |
Southern Norwegian Coastal cod (between 62°N and 67°N) | Not good | Not good |
Northeast Arctic saithe (subareas 1–2) | Good | Good |
Saithe in the North Sea and Skagerrak | Not good | Not good |
Northeast Arctic haddock (subareas 1-2) | Not good | Good |
Haddock North Sea, Skagerrak (had.27.46a20) | Good | Good |
Norwegian spring-spawning herring (subareas 1, 2, 5; divisions 4.a, 14.a) | Good | Not good |
North Sea autumn-spawning herring (Subarea 4 and divisions 3.a and 7.d) | Not good | Good |
Northeast Arctic Mackerel | Not good | Not good |
Northern shrimp (Barents Sea, subareas 1–2) | Good | Good |
Northern shrimp (Skagerrak & Norwegian Trench, 3.a–4.a East) | Good | Not good |
For several major stocks, fishing pressure is now at or below MSY, including haddock in the North Sea and Skagerrak, Norwegian springspawning herring, North Sea autumnspawning herring, Northeast Atlantic mackerel, and northern shrimp in both the Barents Sea and the Skagerrak–Norwegian Trench. However, for many of these stocks the spawningstock biomass (SSB) is still below the MSY Btrigger level, which means the stocks are recovering even though fishing pressure has been reduced. This is particularly the case for Norwegian springspawning herring, Northeast Atlantic mackerel, and northern shrimp in the Skagerrak–Norwegian Trench.
In contrast, several key demersal stocks still have fishing pressure above MSY and/or SSB below the MSY trigger. Northeast Arctic cod and North Sea cod (southern substock) both have F > MSY and SSB < MSY Btrigger, indicating weak status relative to MSY benchmarks. Northeast Arctic saithe and Northeast Arctic haddock show different patterns: both have SSB ≥ MSY Btrigger, but fishing pressure still exceeds MSY for saithe and is slightly above MSY for haddock. In the North Sea and Skagerrak, saithe is fished at or below MSY, but SSB remains below the trigger.
Northern Norwegian coastal cod (north of 67°N) lacks defined MSY reference points and is therefore shown as “not defined”, reflecting the use of management‑plan or precautionary targets rather than formal MSY benchmarks. Overall, the 2025 advice indicates that while fishing pressure has been brought down to sustainable levels for several pelagic and invertebrate stocks, many stocks in Norwegian waters still have SSB below MSY‑based thresholds, and some demersal stocks continue to show F > MSY and/or SSB < MSY Btrigger. Rebuilding spawning‑stock biomass therefore remains a central task, even where current harvest levels are consistent with MSY.
Aquaculture
Norwegian aquaculture is regulated under the Aquaculture Act and operates under a licensing system based on Maximum Total Biomass (MTB). Salmon farming is controlled through a traffic-light system that adjusts production based on environmental indicators such as sea lice levels, and farms must meet strict standards for fish health, welfare, and biosecurity. The Norwegian government’s White Paper The Future of Aquaculture (Regjeringen, 2025) outlines a new impact-based regulatory framework that proposes replacing today’s volume-based limits with a system based on actual environmental effects, including tradable quotas for sea lice emissions and a fee on lost fish. Other farmed species, such as cod and halibut, fall under the same regulative framework with species-specific rules: cod farming requires monitoring of sexual maturity and spawning risk to protect wild stocks, while halibut farming operates under MTB licenses with strict hygiene and annual safety monitoring. Across all species, Norway promotes environmental responsibility and incentivises green technologies to reduce ecological impact.
Tourist and recreational fishing
Tourist and recreational fishing in Norway are regulated to ensure sustainable use of marine and freshwater resources. Sea angling remains generally allowed for everybody without a license, but other types of regulations have tightened substantially in recent years. Tourist fishing in Norway is regulated much more strictly than recreational fishing by Norwegian residents. Tourists must fish through a registered tourist fishing enterprise if they want to export their catch, and these businesses are required to submit daily digital catch reports, covering all catches, including released fish. Tourists may only use handheld gear, face strict documentation rules, and are subject to steadily tightening export quotas, 15 kg from 2026 and 10 kg from 2027. Norwegian recreational fishers may fish freely with rod and handline and may also use certain forms of passive gear under strict limits. Both groups must follow conservation rules, such as respecting minimum and maximum size limits for different species and observing a fishing prohibition during the closed season for certain species, such as halibut. Reliable figures on tourist and recreational fishing are difficult to obtain, as reporting is limited and participation outside registered operators is largely unmonitored.
Processing and Value Chain Overview: Norway
Figure 1.2 illustrates the Norwegian fisheries and aquaculture value chains. In aquaculture, production begins with smolt farming, where juvenile salmon are raised before being transferred to sea cages for grow-out farming. Once harvested, the fish enter primary processing (slaughtering and initial preparation), followed by secondary processing (filleting, value-added processing, or ready-to-eat products), either in Norway or abroad, before reaching final markets in retail and foodservice.
In the fisheries value chain, wild fish are harvested by the fishing fleet and delivered to local fish processing plants. Here, the fish may undergo further processing, but it is often sold unprocessed to processors or buyers domestically or abroad. The products then move through importers or wholesalers and may undergo additional processing before reaching their end markets globally.
Together, these chains form an integrated system that delivers Norwegian seafood from ocean to consumer.
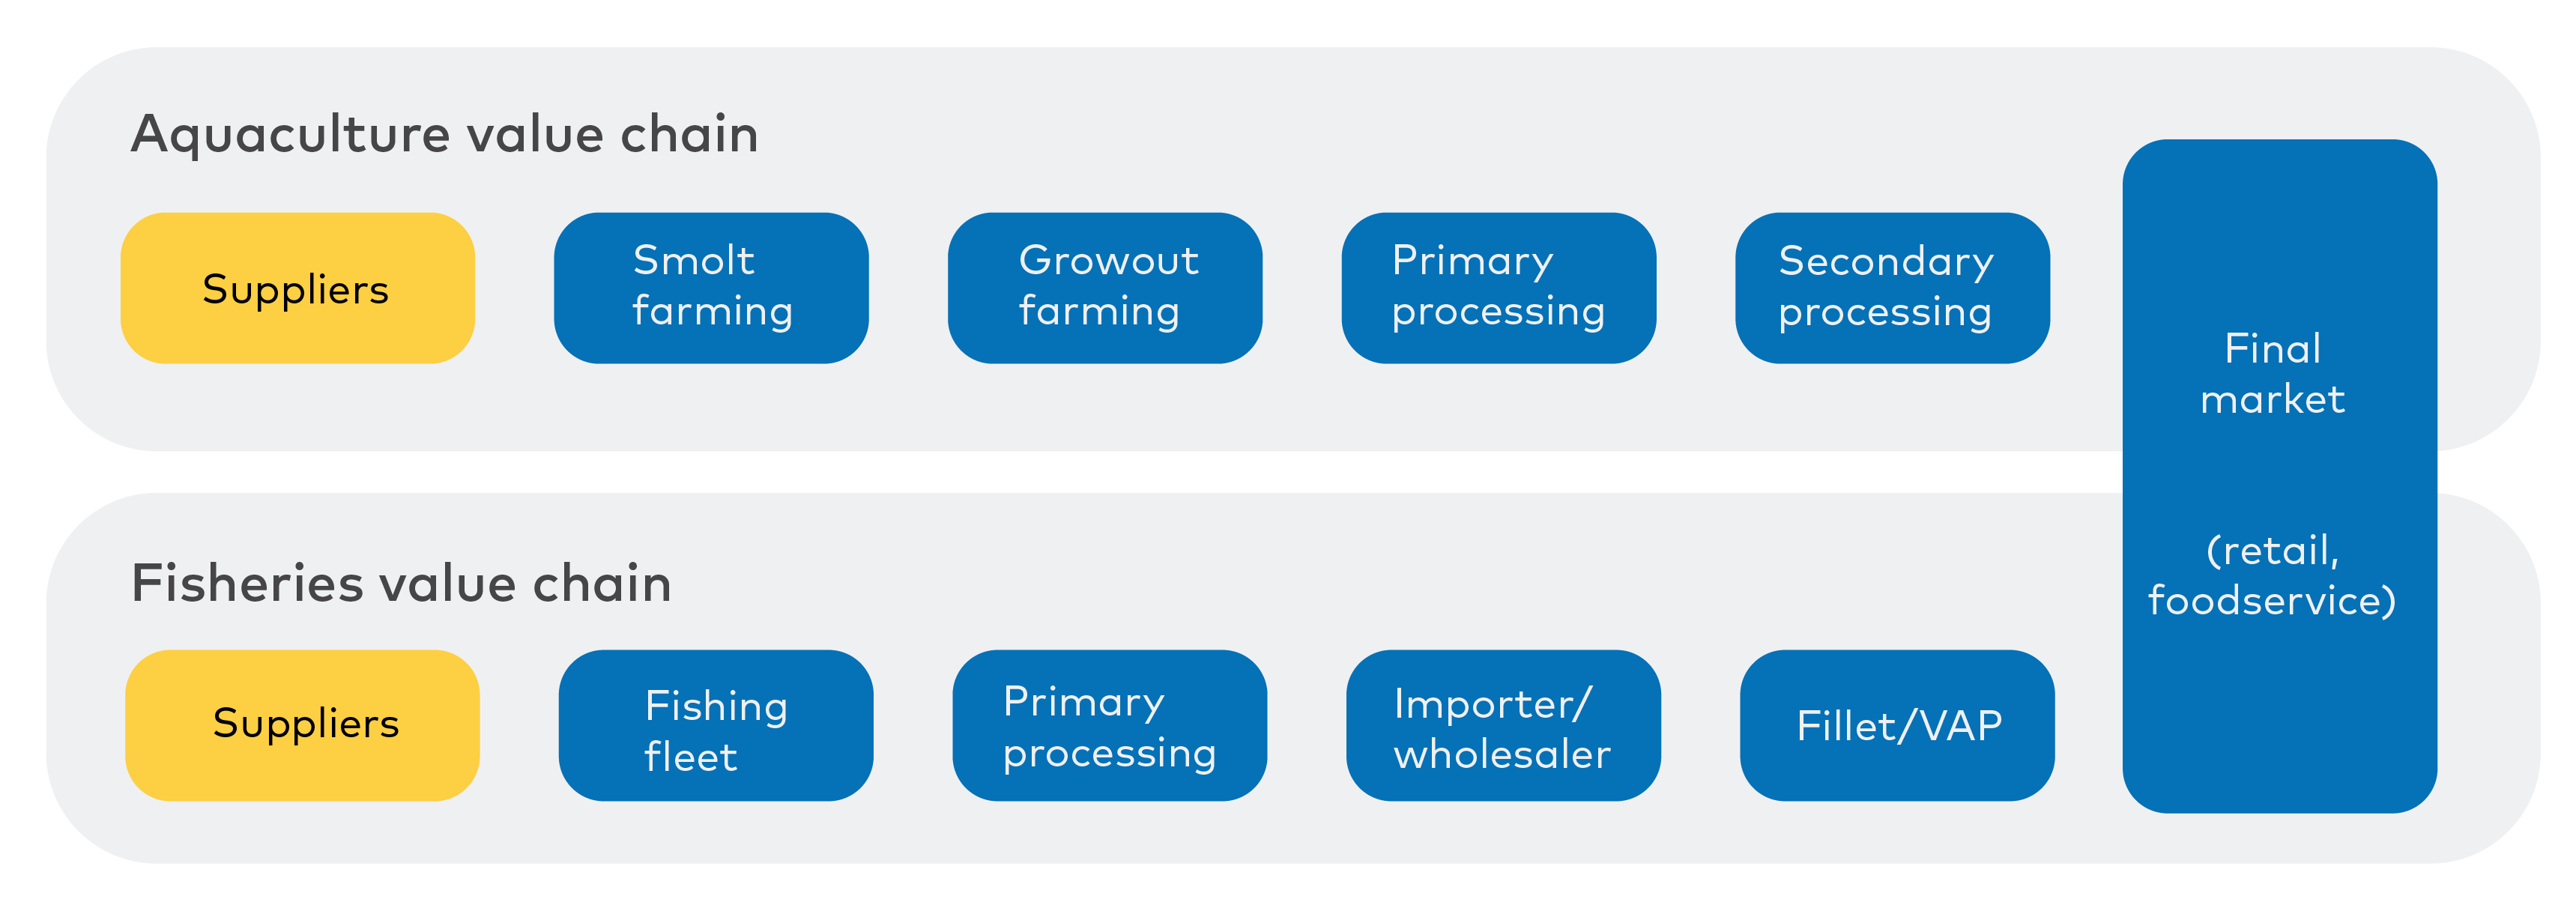
Figure 1.2: Norwegian aquatic food value chain. Source: inspired by Bergesen & Tveterås (2019).
Of the total landings by Norwegian vessels of about 2.5 million tonnes, 84% is landed in Norway, where 70% is fish for human consumption. The remaining 14% of landings by Norwegian vessels are primarily pelagic species for reduction abroad. Norwegian landings abroad are included in the export statistics.
In 2023, 85% of landings at Norwegian ports were by Norwegian vessels, 5% by Nordic vessels (the Faroes, Denmark, and Iceland), and 9% by vessels from other countries, with British vessels dominating. About 71% of the foreign landings in Norway are for human consumption. All landings from foreign vessels in Norway bought by Norwegian companies are included in the official trade statistics.
Table 1.4 presents the number of companies in each sector, total fisheries landings, and aquaculture production by region. About half of the total primary production of aquatic food for human consumption takes place in the two northernmost regions, where both whitefish, pelagic, and crustacean fisheries are particularly important. Møre og Romsdal and Vestland also play significant roles. The eastern regions, despite being home to half the country’s population, account for only 4% of the country's aquatic food production.
There is a strong correlation between where fish are landed or produced and where companies are located. Nearly 60% of companies, as well as production, are in the two northernmost counties (Troms and Finnmark, and Nordland). However, processing does not necessarily occur at the landing site. Fish is frequently sold between companies and across regions. Due to limited public data between catch and exports, it is not possible to determine the exact quantities processed by each company.
Troms and Finnmark, Nordland, and Vestland are the dominant counties in Norwegian seafood production. More than half of all whitefish landings occur in Troms and Finnmark, although most companies are in Nordland. Troms and Finnmark also have the largest share of crustacean landings (primarily Northern shrimp and crabs). Møre og Romsdal dominates the pelagic industry.
Table 1.4: Regional distribution of processors and total landings/farming. Source: Norwegian Directorate of Fisheries (2025a,b)
Region |
Human consumption | ||||||||||
Farmed We do not have the regional distribution for farmed molluscs, crustaceans, and echinoderms for consumption; thus, these figures are incorporated into the “Other” category. | Whitefish | Pelagic | Crustaceans | Total | ||||||
N. of comp | Tot. Prod | N. of comp | Tot. Landings | N. of comp | Tot. Landings | N. of comp | Tot. Landings | N. of comp | Tot. Landings | |
Troms and Finnmark | 13 | 342,741 | 56 | 407,241 | 2 | 57,666 | 24 | 46,504 | 95 | 854,152 |
Nordland | 13 | 367,032 | 73 | 143,656 | 4 | 132,176 | 3 | 7,048 | 93 | 649,912 |
Trøndelag | 17 | 2,43,100 | 10 | 4,456 | 2 | 62,760 | 11 | 2,717 | 40 | 313,033 |
Møre og Romsdal | 16 | 222,704 | 41 | 144,497 | 9 | 209,119 | 5 | 1,955 | 71 | 578,275 |
Vestland | 23 | 344,543 | 11 | 28,536 | 5 | 138,602 | 6 | 280 | 45 | 511,961 |
Rogaland | 6 | 107,850 | 5 | 8,107 | 4 | 54,964 | 7 | 1,205 | 22 | 172,126 |
Other | 9 | 21,877 | 11 | 1,686 | 29,844 | 11 | 4,024 | 31 | 57,430 | |
Total | 97 | 1,649,847 | 207 | 738,178 | 26 | 685,132 | 67 | 63,733 | 397 | 3,136,890 |
The regions where most of Norway's seafood production takes place are also the least populated (see Table 1.5). Located in the far north, these regions are also the furthest away from the main markets. Troms and Finnmark, and Nordland, each with around 240 000 inhabitants, stand out with exceptionally high primary production per capita, 3 523 and 2 696 kg, respectively. In contrast, more densely populated regions such as Rogaland and Trøndelag have far lower percapita production levels. The rest of the country, home to more than 3 million people, accounts for only 18 kg of primary production per capita. This illustrates how seafood production is heavily concentrated in sparsely populated coastal regions, where natural conditions, coastline availability, and industrial structure support large-scale aquaculture and fisheries activity.
Inhabitants (1000) | Primary production per capita | |
Troms and Finnmark | 242 | 3,523 |
Nordland | 241 | 2,696 |
Trøndelag | 478 | 654 |
Møre og Romsdal | 268 | 2,155 |
Vestland | 646 | 792 |
Rogaland | 492 | 350 |
Other | 3 ,120 | 18 |
Total | 5,489 | 571 |
Table 1.5: Inhabitants and primary production available per capita, 2023. Source: SSB (2025)
Marine products for reduction
A substantial share of pelagic fish is used to produce fishmeal and fish oil. In addition to feed production, fishmeal and fish oil serve as key ingredients in omega-3 supplements, protein powders, and a range of health and nutraceutical products.
There are five feed producers in Norway: Cargill/EWOS, Biomar, Skretting, MOWI Feed, and Polarfeed, with ten production facilities spread along the Norwegian coast, from Finnmark in the north to Rogaland in the south. Only Polarfeed is Norwegian owned. In addition, there are smaller producers specializing in live feed and starter feed for farmed cod (Iversen et al., 2024).
In addition, these industries rely on cutoffs from the processing industry, for which no publicly available figures are available.
Region | Meal and oil | ||
Number of companies | Total landings | ||
Primary production | Refinery | ||
Troms and Finnmark | 3 | 1 | 2,044 |
Nordland | 8 | 1 | 13,303 |
Trøndelag | 4 | 1 | 886 |
Møre og Romsdal | 3 | 8 | 58,116 |
Vestland | 3 | 51,817 | |
Rogaland | 5 | 329,963 | |
Other | 2 | 318 | |
Total | 26 | 13 | 456,447 |
Table 1.6: Regional distribution of meal and oil companies. Source: Norwegian Directorate of Fisheries (2025b)
Fish processing in Norway and abroad
The Norwegian industry primarily relies on domestically sourced fish. Some segments, however, depend on imported raw materials; for example, salted and dried cod producers can use frozen fish, including from foreign vessels. The pelagic industry also uses fresh fish from foreign vessels landed in Norway, for both human consumption and reduction.
However, compared to the substantial primary production of aquatic food in Norway, the processing sector is relatively small. Table 1.7 displays the estimated quantities of whole fish available for the Norwegian processing industry.
Of the 3.2 million tonnes of whole fish available in Norway, 2.1 million tonnes are exported as whole fish.
This leaves 1.1 million tonnes that can potentially be used by Norwegian processing (for domestic or foreign consumption). However, some of this fish is frozen, either on land or onboard the vessels. About one-third of the wild-caught fish intended for human consumption, such as cod, saithe, and haddock, is frozen onboard. A substantial share of this frozen fish is landed at independent cold‑storage facilities for later export. These volumes should, in principle, be captured in export statistics; however, because frozen fish is a durable product, some of it may be exported in the year after it is caught. Consequently, exports reported in a given year may include fish landed the previous year.
The figures in the table must not be confused with what is available for consumption in Norway, as a substantial share of this will be exported.
Raw materials of seafood products for human consumption in Norway were estimated by adding the primary production of whole fish and imports of whole fish, and then subtracting exports of whole fish.
This, however, does not illustrate the capacity, as it is potentially substantially larger. Filleting of wild-caught fish is highly seasonal, and a lack of fish due to fewer fish leaves the facilities with no production for many periods of the year. However, when the fish is available, the capacity is used to its maximum.
Specie | Primary production | Imports | Exports | Available for production in Norway |
Atlantic salmon | 1,542,480 | 264 | 1,117,766 | 424,979 |
Trout | 90,641 | 314 | 76,839 | 14,117 |
Herring | 415,558 | 46,105 | 86,484 | 375,179 |
Mackerel | 198,827 | 108,532 | 296,357 | 11,002 |
Cod | 280,521 | 25,547 | 142,895 | 163,172 |
Saithe | 189,423 | 5,674 | 82,322 | 112,774 |
Haddock | 75,262 | 119 | 74,092 | 1,288 |
Shrimps | 38,106 | 9,727 | 13,227 | 34,606 |
Other | 200,431 | 12,950 | 209,076 | 4,306 |
Total | 3,031,249 | 209,233 | 2,099,058 | 1,141,423 |
Table 1.7: Primary production, imports, exports, and quantities available for production in Norway. Source: own estimations based on data from The Norwegian Directorate of Fisheries (2025a,b) and NSC/SSB (2025).
Exports and hub markets
About two-thirds of Norway's total exports of aquatic food for human consumption consist of whole fresh or frozen fish. Approximately 14% of Norway’s exports (in liveweight equivalent) go to other Nordic countries, and more than 80% of this is whole, unprocessed fish.
Among the Nordic countries, Denmark and, to some extent, Sweden serve as important hubs and processing markets for Norwegian seafood. Several nonNordic countries also rely on Norwegian raw material in their processing industries, including the Netherlands and Poland. In addition, large volumes are shipped overseas for secondary processing, particularly to China, where Norwegian fish is processed for other end markets, for example, frozen whitefish fillets for European consumers and mackerel products for the Japanese market. It is estimated that around 40% of Norway’s most important species pass through hub or processing markets before reaching their final consumer destinations (Kontali Analyse AS, 2016; 2019).
Trade flows of Aquatic food: Norway
Imports for human consumption
Norway imported around 250 thousand tonnes of aquatic food for human consumption in 2023. The largest category of imported aquatic foods for human consumption is fresh/chilled products, with more than 90% consisting of fresh whole mackerel, herring, and blue whiting. A share of the imported fresh produce is primarily for meal and oil production. This share is calculated based on official landings statistics and subtracted from the following tables.
Cod and saithe dominate the frozen whole category (95%), with the majority being imports from Russian vessels used in Norwegian (salted and dried) production.
Imports from the Nordic countries are also dominated by fresh products, particularly fresh whole herring and mackerel, which accounted for 66% of imports in 2023. These are primarily landings of Nordic vessels at Norwegian ports, and blue whiting, mackerel, and herring are the dominant species. In 2023, 66% of imports of aquatic food for human consumption were from r European countries outside the Nordic region, while 4% originated from Asia, and 5% from North America.
Given that a relatively large share of fish exported from Norway is shipped as whole fish, a considerable portion of it is subsequently processed abroad. It is assumed that a substantial share of this processed fish is re-imported into Norway. Because the origin of fish cannot be identified in official trade statistics, the actual share of Norwegian fish in imported processed products is uncertain. However, if we assume that the majority of processed fish (i.e., filleted, salted, or otherwise processed) of the major species
(cod, saithe, haddock, salmon, trout, herring, and mackerel) originates from Norwegian catches, the data suggest that only about 17,000 tonnes, or roughly 6% of total imports, can reasonably be assumed to be of Norwegian origin. Of this amount, approximately 7,000 tonnes are imported from other Nordic countries, representing around 12% of Norway’s fish imports from the Nordic region. It is nevertheless likely that some of this fish is originally from, for instance, Russia or the US, particularly products that enter Norway after processing in China.
Shrimps are excluded from this calculation, as Norway imports substantial quantities of other shrimp species, particularly warm‑water varieties, and because the Norwegian shrimp industry relies largely on imported raw material. Domestic catches by Norwegian vessels are insufficient to meet the processing industry’s demand, and imports therefore play a structurally important role in supplying the sector.
Products and species | Quantity (tonnes live weight Live weight figures have been calculated relying on relevant conversion factors from the Norwegian Directorate of Fisheries, EUMOFA, FAO, and adjusted based on industry knowledge. | Value (million NOK) | ||
Import total | Import Nordic | Import total | Import Nordic | |
Salmon | 473 | 434 | 76 | 72 |
Fresh whole/live | 264 | 263 | 23 | 23 |
Frozen whole | 1 | 0 | ||
Fillets | 85 | 62 | 10 | 8 |
Salted, dried, smoked | 90 | 87 | 10 | 10 |
Processed | 34 | 22 | 3 | 3 |
Other | 0 | 0 | 30 | 28 |
Herring | 47,528 | 14,763 | 502 | 168 |
Fresh whole/live | 46,093 | 14,063 | 457 | 148 |
Frozen whole | 12 | 1 | 0 | 0 |
Fillets | 5 | 5 | 0 | 0 |
Salted, dried, smoked | 16 | 10 | 1 | 1 |
Processed | 1,402 | 684 | 44 | 18 |
Other | 0 | 0 | 0 | 0 |
Mackerel | 108,877 | 16,583 | 1,814 | 207 |
Fresh whole/live | 108,530 | 16,244 | 1,810 | 203 |
Frozen whole | 2 | 0 | ||
Fillets | 345 | 339 | 4 | 4 |
Cod | 36,022 | 6,815 | 1,284 | 188 |
Fresh whole/live | 1,473 | 1,473 | 28 | 28 |
Frozen whole | 24,073 | 2,416 | 818 | 75 |
Fillets | 7,554 | 471 | 284 | 18 |
Salted, dried, smoked | 201 | 26 | 11 | 3 |
Processed | 2,721 | 2,429 | 62 | 56 |
Other | 0 | 0 | 79 | 8 |
Saithe | 8,518 | 1,736 | 154 | 42 |
Fresh whole/live | 103 | 102 | 1 | 1 |
Frozen whole | 5,571 | 81 | ||
Fillets | 1,938 | 887 | 33 | 10 |
Processed | 907 | 747 | 39 | 30 |
Other | 0 | 0 | 1 | 0 |
Trout | 365 | 323 | 17 | 14 |
Fresh whole/live | 314 | 314 | 14 | 14 |
Frozen whole | 0 | 0 | ||
Fillets | 51 | 9 | 3 | 1 |
Haddock | 2,157 | 1,558 | 52 | 44 |
Fresh whole/live | 61 | 1 | ||
Frozen whole | 58 | 61 | 1 | 1 |
Fillets | 2,038 | 1,497 | 38 | 32 |
Other | 0 | 0 | 13 | 11 |
Prawns | 13,808 | 7,809 | 1,030 | 463 |
Fresh/live | 214 | 163 | 18 | 12 |
Frozen whole | 9,513 | 6,611 | 517 | 326 |
Processed (peeled) | 4,081 | 1,035 | 495 | 125 |
Other | 33,751 | 13,940 | 1,148 | 373 |
Fresh/live | 9,806 | 9,294 | 160 | 82 |
Frozen | 3,144 | 1,063 | 139 | 38 |
Fillets | 4,769 | 572 | 114 | 17 |
Salted, dried, smoked | 1,096 | 153 | 46 | 20 |
Processed | 14,880 | 2,858 | 589 | 170 |
Other | 56 | 0 | 100 | 46 |
Total | 251,501 | 63,960 | 6,077 | 1,570 |
Fresh/live | 166,858 | 41,917 | 2,511 | 511 |
Frozen | 42,375 | 10,151 | 1,557 | 441 |
Fillets | 16,784 | 3,841 | 485 | 89 |
Salted, dried, smoked | 1,403 | 276 | 69 | 33 |
Processed | 24,026 | 7,774 | 1,233 | 402 |
Other | 56 | 0 | 222 | 94 |
Table 1.8: Imports of fish for human consumption in 2023 (tonnes). Source: NSC/SSB, 2025.
Imports of Marine Ingredients and Feed
The following are listed as meal and/or oil for animal feed in Norwegian imports: 23012010, 15042011, 5119113, 12122910, 15041011, 5119119, 5119111, 12122110, 5119112. In addition, some share of the imports of fresh, whole pelagic fish is for meal and oil; this share is found from the official Norwegian landing statistics.
The following are listed as meal and/or oil for animal feed in Norwegian imports: 23012010, 15042011, 5119113, 12122910, 15041011, 5119119, 5119111, 12122110, 5119112. In addition, some share of the imports of fresh, whole pelagic fish is for meal and oil; this share is found from the official Norwegian landing statistics.
Imports of fresh whole pelagic species include blue whiting, mackerel, sardines/sprat, and herring, which are landed by foreign vessels in Norway. The majority are landings by Nordic vessels.
Flour/meal and pellets are sourced primarily from Iceland, Denmark, and the Faroe Islands (79%), with 17% from North and South America, and the remaining from the rest of Europe.
About 50% of the fish oil is sourced from Nordic countries, while the rest is dominated by overseas markets such as Mexico (10%), Mauritania (9%), and Chile (9%).
The other category consists primarily of algae, and fish oil/flour not for human consumption.
Norwegian aquaculture production is heavily dependent on imports of feed, according to Aas et al (2022): only 8% of the ingredients were sourced from Norway, specifically the fish meal and fish oil. The remaining 92%, including all micro-ingredients, were imported. According to them, salmon feed in 2020 was composed of 12.1% fish meal and 10.3% fish oil, alongside 40.5% plant-based protein sources and 20.1% vegetable oils. Carbohydrate sources accounted for 12.5% of the feed, while micro-ingredients made up 4.1%. An additional 0.4% consisted of emerging ingredients, including insect meal, single-cell proteins, fermented products, and microalgae. This amounted to 1,976,709 tonnes of ingredients, where 239,710 tonnes of marine protein and 203,598 tonnes of marine oils (including 4,531 tonnes of oil from by-products from farmed fish.
Product categories | Quantity (tonnes product weight) | Value (million NOK) | ||
Import total | Import Nordic | Import total | Import Nordic | |
Fresh whole pelagic | 44,472 | 43,946 | 248 | 236 |
Flour/meal/pellets | 228,143 | 180,282 | 5,068 | 3,981 |
Oil | 173,250 | 88,444 | 8,556 | 3,885 |
Other | 93,865 | 64,191 | 1,924 | 355 |
Total | 539,730 | 376,862 | 15,796 | 8,458 |
Table 1.9: Imports of marine ingredients in 2023 (tonnes). Source: NSC/SSB, 2025.
Exports for human consumption
Total exports of aquatic food for human consumption in 2023 amounted to about 3.1 billion tonnes in live weight. About 67% of the total export volume, measured by live weight, is whole fresh/frozen/live fish. As only a small share of this whole fish is made available to consumers in this state, this suggests that a substantial share is further processed abroad
. The main destination markets for the whole products are Poland, Denmark, China, and the Netherlands, which are typical producers or hubs, followed by countries such as France, the UK, and Spain, which are consumer markets but also have substantial fish processing industries.
Of the remaining product, some will be further processed to some extent. For instance, some share of the whole, dried cod will be soaked and produced into portions, a substantial share of the salted whole cod will be dried in Portugal, some salmon fillets will be smoked, and so on.
In addition to the dominance of whole salmon exports, Table 1.10 also illustrates how strongly species differ in their product composition and degree of processing. Pelagic species such as herring and mackerel are exported mainly as frozen whole fish, whereas demersal species, particularly cod and saithe, show a much more diversified product structure, with significant volumes in salted/dried/smoked categories. This reflects long-standing processing traditions and market preferences in Southern Europe, Africa, and parts of Asia. Processed products (including fillets) remain a comparatively small share of total export volume across most species, but they account for a disproportionately high share of value, underscoring the greater profitability of value-added production. The Nordic region accounts for only a modest share of Norway’s total exports (12%) but stands out for a higher share of fresh whole/live products, especially salmon, cod, and saithe, reflecting well-integrated regional supply chains and short distances. About 34% of exports of aquatic food for human consumption were for overseas markets in 2023, of which 19% were to Asia and 8% to North America. While 54% is destined for other European markets.
Products and species | Quantity (tonnes live weight) | Value (million NOK) | ||
Export total | Export Nordic | Export total | Export Nordic | |
Salmon | 1,407,329 | 191,105 | 122,268 | 15,336 |
Fresh whole/live | 1,093,726 | 155,350 | 91,123 | 12,217 |
Frozen whole | 24,040 | 1,079 | 1,990 | 83 |
Fillets | 285,882 | 34,154 | 27,669 | 2,996 |
Salted, dried, smoked | 3,382 | 496 | 387 | 30 |
Processed | 298 | 26 | 27 | 3 |
Other | 0 | 0 | 1,072 | 6 |
Herring | 371,243 | 36,403 | 4,002 | 427 |
Fresh whole/live | 14,696 | 14,695 | 139 | 139 |
Frozen whole | 71,788 | 38 | 953 | 0 |
Fillets | 245,424 | 1,459 | 2,259 | 16 |
Salted, dried, smoked | 9,698 | 6,223 | 125 | 76 |
Processed | 29,637 | 13,989 | 417 | 193 |
Other | 0 | 0 | 110 | 2 |
Mackerel | 325,110 | 3,781 | 6,666 | 76 |
Fresh whole/live | 8,690 | 3,534 | 162 | 70 |
Frozen whole | 287,667 | 236 | 6,106 | 5 |
Fillets | 28,701 | 0 | 396 | 0 |
Processed | 51 | 11 | 3 | 1 |
Cod | 306,360 | 49,800 | 12,214 | 1,904 |
Fresh whole/live | 66,687 | 35,793 | 2,464 | 1,314 |
Frozen whole | 76,208 | 2,058 | 2,636 | 66 |
Fillets | 31,625 | 11,610 | 1,124 | 491 |
Salted, dried, smoked | 131,683 | 290 | 5,901 | 11 |
Processed | 157 | 49 | 88 | 22 |
Saithe | 263,646 | 26,404 | 3,960 | 478 |
Fresh whole/live | 28,069 | 20,945 | 496 | 361 |
Frozen whole | 54,253 | 1,794 | 798 | 29 |
Fillets | 11,392 | 3,655 | 252 | 87 |
Salted, dried, smoked | 169,932 | 10 | 2,411 | 0 |
Other | 0 | 0 | 3 | 1 |
Trout | 92,963 | 3,461 | 5,487 | 151 |
Fresh whole/live | 66,246 | 2,192 | 3,544 | 93 |
Frozen whole | 10,592 | 795 | 487 | 33 |
Fillets | 13,207 | 362 | 1,097 | 21 |
Salted, dried, smoked | 2,917 | 112 | 359 | 5 |
Haddock | 80,779 | 10,742 | 1,704 | 247 |
Fresh whole/live | 14,392 | 8,862 | 325 | 187 |
Frozen whole | 59,700 | 15 | 1,203 | 1 |
Fillets | 6,607 | 1,865 | 174 | 59 |
Salted, dried, smoked | 79 | 0 | 1 | 0 |
Other | 0 | 0 | 1 | 0 |
Prawns | 23 341 | 13 985 | 1 261 | 655 |
Fresh/live | 679 | 675 | 20 | 20 |
Frozen whole | 12,547 | 8,483 | 384 | 216 |
Processed (peeled) | 9,499 | 4,213 | 797 | 360 |
Salted, dried, smoked | 615 | 613 | 60 | 60 |
Other | 252,963 | 31,703 | 7,334 | 1,243 |
Fresh/live | 93,392 | 27,842 | 2,184 | 863 |
Frozen | 115,684 | 2,847 | 3,301 | 154 |
Fillets | 646 | 328 | 24 | 11 |
Salted, dried, smoked | 42,696 | 483 | 1 178 | 58 |
Processed | 521 | 180 | 73 | 89 |
Other | 23 | 22 | 575 | 69 |
Total | 3,123,732 | 367,383 | 164,894 | 20,518 |
Fresh/live | 1,386,578 | 269,888 | 100,456 | 15,264 |
Frozen | 712,480 | 17,343 | 17,858 | 588 |
Fillets | 623,484 | 53,433 | 32,995 | 3,681 |
Salted, dried, smoked | 361,003 | 8,227 | 10,422 | 240 |
Processed | 40,164 | 18,469 | 1,404 | 667 |
Other | 24 | 22 | 1,759 | 77 |
Table 1.10: Exports of fish for human consumption in 2023 (tonnes). Source: NSC/SSB, 2025.
Exports of Marine Ingredients and Feed
Exports of aquatic produce for feed and other uses amounted to 411 thousand tonnes in 2023, and more than half were to the other Nordic countries.
Exports for Feed and other products are dominated by fresh whole pelagic (blue whiting, mackerel, sardines/sprats, and herring), which are landings by Norwegian vessels in foreign ports, mainly in other Nordic countries, where Denmark is by far the most important.
The main markets for Norwegian fish meal and pellets are the United Kingdom (32%), the USA (15%), the Faroe Islands (13%), and Denmark (10%).
Most of the fish oil is exported to Turkey (51%), followed by Denmark (17%) and Greece (9%). Other markets are a combination of other European and overseas markets.
Product categories | Quantity (tonnes product weight) | Value (million NOK) | ||
Export total | Export Nordic | Export total | Export Nordic | |
Fresh whole pelagic | 68,435 | 52,251 | 246 | 199 |
Flour/meal/pellets | 67,214 | 16,135 | 1,505 | 278 |
Oil | 81,882 | 14,506 | 1,884 | 369 |
Other | 193,267 | 146,548 | 3,236 | 598 |
Total | 410,798 | 229,441 | 6,871 | 1,444 |
Table 1.11: Exports of marine ingredients in 2023 (tonnes). Source: NSC/SSB, 2025.
Aquatic food available for consumption in Norway
Aquatic food available for consumption in Norway reflects the balance between domestic production and trade. Norway has substantial harvests from both capture fisheries and aquaculture, but a large share of this production is exported. The figures below show the volumes that remain in the country after accounting for these trade flows, expressed as live-weight equivalents and grouped by key species.
The wide range of product forms produced and traded in Norway means that precise conversion factors are not available; some trade categories are broad and may include multiple product types. The species shown in the table should therefore be regarded as illustrative examples. For example, for salmon, a large share of exports consists of whole fish, which makes live‑weight estimates relatively reliable. For cod, however, nearly half of the production is salted, dried, or both, and differences in processing practices and storage times affect the appropriate conversion to live weight
.
In addition, variations may arise due to seasonal factors (for example, cod during periods of high stomach content) or differences between facilities in how the fish is cut.
It is important to emphasize that these figures do not represent what is actually consumed in Norway, but rather what is theoretically available. Storage losses, waste, re-exports, and irregularities such as unreported landings (Svorken et al., 2023) all influence the quantities ultimately consumed. Recreational fishing for own consumption is also not included in these figures.
The estimates are presented in Table 1.13. In total, 48 kg per capita is available for human consumption in 2023. These figures are closely aligned with FAO’s estimate of 49 kg per capita (FAO, 2026). Salmon is by far the largest species, followed by herring and cod. For comparison, the Norwegian Directorate of Health reports that 30.4 kg per capita in live weight (equivalent to 18.5 kg per capita edible weight) of fish and seafood was available to consumers in 2023, based on sales from wholesalers to retail and foodservice (Norwegian Directorate of Health, 2025)
.
These figures do not include direct sales from producer to consumer, such as distributors and retailers who have a license to buy fish directly from the fisher.
Primary production | Imports | Exports | Export share | Available for consumption | |
Total quantities (tonnes) | 3,136,890 | 251,501 | 3,123,732 | 92% | 264,659 |
Salmon | 1,542,480 | 473 | 1,407,329 | 91% | 135,624 |
Herring | 415,558 | 47,528 | 371,243 | 80% | 91,844 |
Cod | 304,998 | 36,022 | 306,360 | 90% | 34,660 |
Other | 873,854 | 167,477 | 1,038,801 | 100% | 2,530 |
Quantities per capita (kg/year) | 571 | 46 | 569 | 48 | |
Salmon | 281 | 0 | 256 | 25 | |
Herring | 76 | 9 | 68 | 17 | |
Cod | 56 | 7 | 56 | 6 | |
Other | 159 | 31 | 189 | 0,5 |
Table 1.12: Available for consumption in Norway in 2023, total and a selection of species. Tonnes, live weight. Source: Own estimations based on The Norwegian Directorate of Fisheries (2025a,b) and NSC/SSB (2025).
Potential availability
In a theoretical scenario where all landings were directed to human consumption, total availability would increase by nearly 650 thousand tonnes to about 3,78 million tonnes. This would raise aquatic food availability from the current 48 kg per capita per year to 165 kg per capita per year. Of this, the volume of herring and mackerel that, in 2023, was for reduction, would contribute nearly 64,000 tonnes. However, approximately 338,000 tonnes would come from blue whiting, which currently is not used for human consumption in Norway. This theoretical scenario illustrates the magnitude of Norway’s latent seafood resources, even though only a share of these volumes is realistically available for human consumption
A more likely scenario would be to increase only the 64,000 tonnes from herring and mackerel, which would still increase the availability of aquatic food to 60 kg per capita per year.
Challenges, threats, and opportunities
Norway possesses a significant untapped potential for national food security through its massive seafood production. According to Grünfeld et al. (2023), the theoretical maximum capacity is estimated at 76% of the average daily requirement (2350 kcal). Aquaculture, particularly the production of fat-rich salmon, is a primary source of calories in this context, accounting for roughly two-thirds of the total potential caloric output (Grünfeld et al., 2023). However, seafood production in Norway fluctuates to such an extent that in some months (such as October and November) it can cover more than 100% of the population’s energy needs, while in other months (such as April and May) it falls to around 55–60% (Grünfeld et al., 2023).
In addition to its potential for food security, Norway faces several governance-related challenges, particularly in the international management of shared pelagic stocks. The nations fishing for mackerel have disagreed on quota allocations, leading to catches far above scientific advice, declining recruitment, and a marked reduction in stock size and distribution over the past decade (Institute of Marine Research, 2025b). The situation is similar for Norwegian spring-spawning herring, where the fishing nations do not agree on each country’s total quota. Thus, since 2013, it has been fished substantially more than recommended by scientists (Institute of Marine Research, 2023).
Climate change represents another primary structural driver shaping future opportunities and risks for Norwegian fisheries. Its impact is expected to differ across Norwegian species (Kjesbu et al., 2021). Cold‑temperate stocks in northern areas, such as Northeast Arctic cod, Northeast Arctic haddock, Northeast Arctic saithe, Norwegian Coastal cod (North), Norwegian spring‑spawning herring, Northern shrimp (northern stock), and Northeast Atlantic mackerel, are projected to benefit from warming due to expanded feeding areas, increased primary and secondary production, and retreating sea ice. In contrast, cold‑temperate stocks located near their southern thermal limits, including North Sea cod and Norwegian Coastal cod (South), are expected to decline as rising temperatures exceed tolerable thresholds and key prey organisms shift northward. North Sea herring represents an exception among North Sea cold‑temperate stocks, as it is nonetheless projected to experience a positive directional effect. The assessments are based on a combination of expert analyses and scientific models of physical and biological ocean processes for the year 2041, under a moderate greenhouse gas emissions scenario.
Stocks | Directional effect of climate change |
Northeast Arctic cod | Positive |
North sea cod | Negative |
Cod, Norwegian Coastal - North | Positive |
Cod, Norwegian Coastal - South | Negative |
Northeast Arctic saithe | Positive |
Norwegian spring-spawning herring | Positive |
Northeast Arctic haddock | Positive |
North sea herring | Positive |
Northern shrimp | Positive |
Northeast Atlantic mackerel | Positive |
Table 1.13: Climate risk for different species (Kjesbu et al., 2021).
Despite Norway’s large production capacity, several systemic vulnerabilities could limit the country’s ability to utilise this potential in a crisis. Grünfeld et al. (2023) also find that Norway possesses a highly robust cold-storage and logistics infrastructure: national freezing and storage capacity is more than sufficient to smooth out seasonal fluctuations in landings, and domestic transport capacity is considered adequate to redirect seafood from export markets to domestic consumption when needed.
However, the seafood value chain remains highly exposed to external shocks. Energy supply is identified as the most critical threat: the entire infrastructure, from diesel-dependent fishing vessels to electricity-reliant cold storage and domestic transport, depends on prioritized energy access during a crisis (Grünfeld et al., 2023). Geopolitical conflicts or trade disruptions could also reduce the availability of feed inputs and restrict access to vital fishing grounds such as the Barents Sea (Grünfeld et al., 2023).
Norway always maintains a substantial standing biomass in sea-based aquaculture. As of 31 December 2023, the live biomass of Atlantic salmon and rainbow trout amounted to 882,261 tonnes (Norwegian Directorate of Fisheries, 2025a). This biomass is not included in the earlier availability estimates because it represents fish that have not yet been slaughtered. However, in a crisis, it constitutes a significant strategic reserve that could, in principle, be slaughtered and redirected to domestic consumption. The presence of such a large livestock underscores aquaculture’s dual role, both as a significant export industry and as a potential buffer for national food security.
A further major vulnerability concerns reliance on feed. The aquaculture industry depends heavily on imported feed ingredients: 92% of the raw materials for fish feed are currently sourced from abroad (Aas et al., 2022). Disruptions in global supply chains for fishmeal, fish oil, plant proteins, or micro‑ingredients would quickly constrain Norwegian aquaculture production. This reliance is considered one of the sector’s most significant systemic vulnerabilities. There is political recognition of this risk, and Norway aim to increase the share of domestically produced feed ingredients to 25% by 2034 (Research Council of Norway, 2025).