8. Emission sector contributions to health effects and external costs in 2030
Based on the urban background concentrations modelled with UBM for the Nordic capital cities, the EVA-system has been used to model the share of health effects and related external costs from individual emission sectors in each selected Nordic capital city in 2030 sub-divided by transboundary, country, and city boundaries.
8.1 Assumptions
Population data in 2019 and 2030
The population data applied in the current version of the EVA system are based on information from Eurostat.
The most recent gridded population dataset from Eurostat is valid for 2018 on a 1 km x 1 km grid (https://ec.europa.eu/eurostat/web/gisco/geodata/reference-data/population-distribution-demography/geostat). In this project, this distribution has been scaled so the annual totals sum up to the available reported and projected national totals in the specific years of 2019 and 2030. A baseline projection of the development in national totals and the age distribution for 2030 has also been obtained from Eurostat (https://ec.europa.eu/eurostat/databrowser/view/proj_19np/default/table?lang=en).
The national reported and projected totals for 2019 and 2030 and the fraction of the population aged 30 years and above are given in Table 8.1.
Table 8.1. Inhabitants in the five Nordic countries in 2019 and 2030 (mio.) and the share of individuals aged 30+. Lowest panel displays the change in total population density from 2019 to 2030.
DK | FI | IS | NO | SE | |
Year | 2019 | 2019 | 2019 | 2019 | 2019 |
Total | 5.8 | 5.5 | 0.4 | 5.3 | 10.2 |
Above 30 | 3.7 | 3.7 | 0.2 | 3.4 | 6.5 |
Above 30 in % | 64% | 66% | 59% | 63% | 64% |
Year | 2030 | 2030 | 2030 | 2030 | 2030 |
Total | 6.0 | 5.5 | 0.4 | 5.8 | 11.1 |
Above 30 | 4.0 | 3.8 | 0.3 | 3.8 | 7.2 |
Above 30 in % | 67% | 70% | 64% | 66% | 65% |
Year | 2019 to 2030 | 2019 to 2030 | 2019 to 2030 | 2019 to 2030 | 2019 to 2030 |
Difference in % | 3% | 0% | 17% | 8% | 8% |
Like in many other European countries, the inhabitants in the Nordic countries have increased their expected lifetime and the fraction of people older than 30 years are increasing slightly in all the Nordic countries towards 2030. The total population is also projected to increase between less than 1% (Finland) to about 17% (Iceland).
The spatial distribution of the gridded population data from 2018 is shown in Figure 8.1.
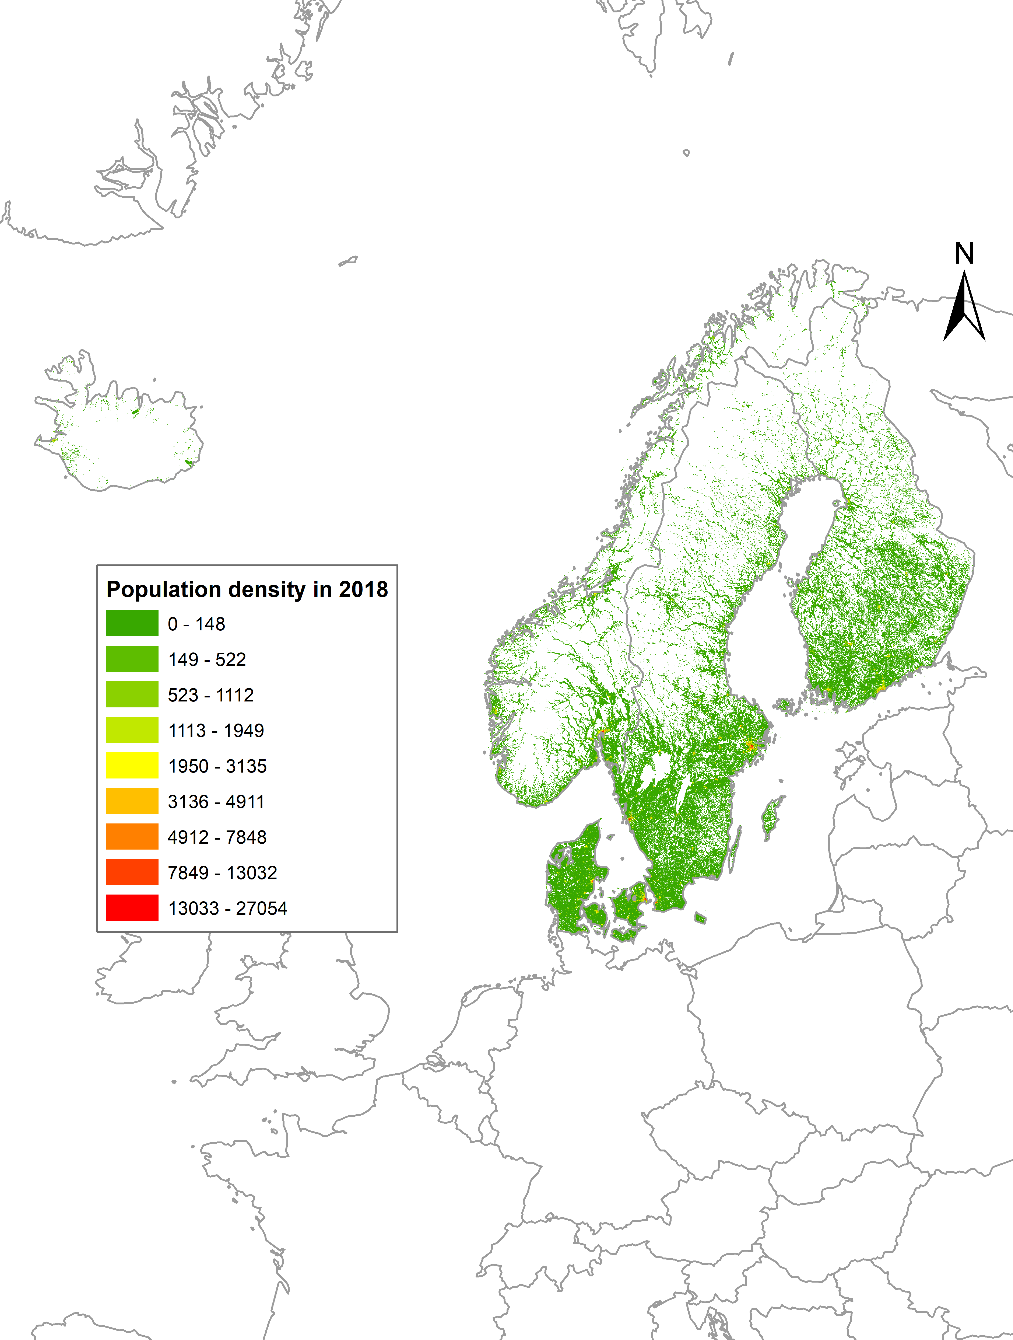
Figure 8.1. Population density in the Nordic countries from Eurostat on 1 km x 1 km in 2018 (inhabitants/km2).
Standard costs for mortality and morbidity
The EVA model system applies a set of standard costs for acute and chronic mortality as well as for morbidity, derived for Denmark. To apply the EVA system for other countries, this set of standard costs can either be replaced by a set of locally developed standard costs that applies for the specific country, or be transformed to represent another country using the OECD benefit transfer methodology formula (OECD 2012: 138):
Here VSL is the value of a statistical life, and Y is the Gross Domestic Product (GDP) per capita (adjusted for purchasing power parity - PPP) and ß is the income elasticity based on the OECD central estimate.
The official VSL values for Denmark, Norway and Sweden were used to derive by benefit transfer VSL values for Finland and Iceland, which to our knowledge, that do not have official recommendations on VSL-values for socio-economic analysis. Subsequently we calculated a population weighted Nordic average for VSL.
The Nordic value of a life year (VOLY) were derived from the Nordic-VSL using the standard OECD methodology, whereby VSL is the net present value of the sum of discounted VOLY’s over the average remaining lifetime for a traffic fatality (see also DØRS, 2016). A declining discount rate of 3% for the first 35 years and 2% for the remaining time was used, derived with the Ramsey formula (cf. European Commission, 2014). The value of a chronic VOLY was calculated by assuming an average air pollution victim latency period of five years, cf. US-EPA methodology. A premature death is equivalent to a loss of 11.4 life years in Denmark, 10.4 years in Finland, 12.6 years in Iceland, 10.7 years in Norway and 9.5 years in Sweden.
Data for GDP has been obtained from Eurostat and results are provided as 2020-prices.
For morbidity, while the exposure-response functions reflect the background incidence in each of the Nordic countries, the unit costs (e.g. for hospitalizations) are derived from Danish circumstances.
Exposure-response relationships in EVA-system for current project
The assumptions related to exposure-response functions in this project are the same as in the version of the EVA-system used in the Danish national air quality monitoring program for 2020 (Ellermann et al., 2022). Exposure-response relationships in the applied version of the EVA-system are based on WHO (2013).
Assumptions about exposure-response relationships for the different pollutants are important especially for PM2.5 that is responsible for most of the health impacts. For PM2.5 we use a relative risk of 1.062 based on WHO (2013), that is, a 6.2% increase in mortality per 10 µg/m3 increase in annual mean PM2.5. Furthermore, no lower threshold of health effects for PM2.5 is assumed based on the precautionary principle. Available studies only include concentration levels down to 2.4 µg/m3 but the exposure-response relationships are stronger for lower levels compared with higher levels and health effects will most likely continue below 2.4 µg/m3 (WHO, 2021; Raaschou-Nielsen et al., 2020; Sommar et al., 2021). For NO2 a threshold of 20 µg/m3 (WHO, 2013) is assumed below which no effects occur. Health effects from ozone primarily originate from exposure to high concentrations, so a parameter (SOMO35) is used, where only ozone concentrations above 35 ppb (=70 μg/m3) are taken into account (WHO, 2013).
The assumptions about thresholds, relative risks (RR), age groups affected and the valuation of health endpoints are given in Table 8.2.
Table 8.2. The health endpoints and relative risks (RR) used in the EVA system for the present analysis. It is mainly based on a set of RR recommended by HRAPIE/WHO for use in health and cost assessments (Héroux et al., 2015). The RR for SO2 is taken from the ExternE project. The valuation (the standard costs) are based on work done in the NordicWelfAir project and represents the weighted average cost across the five Nordic countries (given in 2020 prices in Euros).
Health endpoint | Pollutant | Range | Ages | RR per 10 μg/m3 | Valuation |
Mortality: | |||||
Acute mortality | O3 | >35* ppb | all | 1.0029 | 4526000 €/case |
NO2 (1h max) | no thresh. | all | 1.0027 | 4526000 €/case | |
PM2.5 | no thresh. | all | 1.0123 | 4526000 €/case | |
SO2 | no thresh. | all | 1.00072 | 4526000 €/case | |
Acute mortality infants | PPM2.5 (from PPM10) | no thresh. | Infants, postneonatal | 1.0400 | 6789000 €/case |
Chronic mortality | PM2.5 | no thresh. | >30 | 1.062 | 141000 €/YOLL |
NO2 | >20 ug/m3 | >30 | 1.0550 | 141000 €/YOLL | |
Hospital admissions (HA): | |||||
Cardiovascular HA/incl. stroke | PM2.5 | no thresh. | all | 1.0091 | 16494 €/case |
Cardiovascular HA/excl. stroke | O3 | >35* ppb | >65 | 1.0089 | 16368 €/case |
Respiratory HA | PM2.5 | no thresh. | all | 1.0190 | 10247 €/case |
Respiratory HA | O3 | >35* ppb | >65 | 1.0044 | 10247 €/case |
Respiratory HA | NO2 | no thresh. | all | 1.0180 | 10247 €/case |
Bronchitis (KOL)/children | PM2.5 from PM10 | no thresh. | <16 | 1.0480 | 167 €/case |
Bronchitis (KOL)/adults | PM2.5 from PM10 | no thresh. | >16 | 1.1170 | 40664 €/case |
Asthma symptoms/children | PM2.5 from PM10 | no thresh. | <16 | 1.0280 | 1366 €/case |
Days with restricted activity (sick days) (RAD) | PM2.5 | no thresh. | all | 1.0470 | 160 €/day |
Working days lost (WLD) | PM2.5 | no thresh. | >30 | 1.0460 | 301 €/day |
Days with minor restricted activity (MRAD) | O3 | >35* ppb | all | 1.0154 | 81 €/day |
Lung cancer morbidity | PM2.5 | no thresh. | >30 | 1.14 | 74943 €/case |
*Actually as SOMO35 calculated from the sum of the highest ozone concentrations, and indicates the sum of 8-hour daily maximum values over 35 ppb during the year. | |||||
Revisions and sensitivity analysis for Danish conditions
The exposure-response relationships in the EVA-system has been under revision during the course of the current project in light of the new WHO AQG from 2021 and the studies behind.
WHO’s new guidelines (WHO, 2021) encompass a thorough review of the international research on the association between exposure to a number of air pollutants and effects on human health. The review documents that the health impacts are larger than previously known and that the impacts on human health are observed at lower concentration levels than previously documented, which is of particular relevance for the Nordic countries with generally lower concentrations. For example, the relative risk for chronic mortality associated with PM2.5 has in the new guidelines increased from 1.062 to 1.08. Other things being equal, this will lead to higher estimates of health effects of air pollution.
The new guidelines from WHO have been implemented in the model calculations of the health impacts for Denmark in the most recent air quality assessment for 2021 (Ellermann et al., 2023). This has resulted in a change in the number of premature deaths originating from the different air pollutants. However, the overall number of premature deaths is approximately the same as previous years despite these changes. This is due to a parallel update of the average life expectancy and to the recommendation in the new WHO guidelines to use of a new lower threshold as well as changes in RRs for the health impact of NO2. The result is a lower number of premature deaths in general as well as from NO2 exposure, which balances out the higher number of premature deaths due to the change in RR for PM2.5.
A sensitivity analysis was also carried out in relation to the air quality assessment for 2021 for Denmark. The baseline assumes a relative risk for PM2.5 of 1.08 with no threshold value for this pollutant resulting in 3,900 premature deaths in Denmark. Scenarios with a relative risk for PM2.5 of 1.08 and a threshold of 2.4 µg/m3 gave 2,600 premature deaths, a relative risk for PM2.5 of 1.12 (as has been seen in Danish cohort studies, see Ellermann et al., 2023) and no threshold gave 5,800 premature deaths and a relative risk for PM2.5 of 1.12 and a threshold of 2.4 µg/m3 gave 3,800 premature deaths. This illustrates that prediction of the number of premature deaths is highly sensitive to the assumptions applied.
Emission sector contributions in selected Nordic countries
In the following sections we will provide information for each of the Nordic capital cities on mortality and morbidity effects of air pollution and related external costs in 2019 and 2030, and the contribution from different emission sectors as well as the contribution from the city, the country of the city and abroad sources. Estimates are based on calculations with DEHM, UBM and the EVA-system.
8.2 Health effects and sector contributions in København
Mortality and morbidity effects of air pollution in 2019 and 2030
A summary of mortality and morbidity effects of air pollution in 2019 and 2030 is shown in Table 8.3. Note that figures are rounded for case except for percentage figures.
Total premature deaths are predicted to be approx. 400 in 2019 and 300 in 2030 showing a decrease of approx. 20%. The decrease is a combined effect of an increase in population including more elderly persons and a decrease in air pollution levels. It is also seen that approx. 2/3 of the premature deaths are related to chronic premature deaths due to long-term exposure and approx. 1/3 to acute premature deaths due to short-term exposure with elevated air pollution levels.
The number of morbidity cases is also predicted to decrease from 2019 to 2030.
Aarhus University carried out a health impact assessment in 2019 for the Municipality of København that estimated 440 premature deaths, that is, in the same range as the above estimate as expected although also with some differences in the assumptions about the geographic extent of København, emissions, population data and life expectancy (Jensen et al. 2021).
Health effects | 2019 | 2030 | Difference |
Acute mortality (PM2.5, SO2, NO2, O3) | 140 | 110 | -20% |
Chronic mortality (PM2.5, NO2) | 270 | 200 | -23% |
Total premature deaths (PM2.5, SO2, NO2, O3) | 410 | 310 | -22% |
Hospital admissions due to respiratory symptoms (PM2.5, NO2, O3) | 490 | 410 | -17% |
Hospital admissions due to cardio-vascular diseases (PM2.5, O3) | 130 | 120 | -8% |
Episodes with asthma among children (PM2.5) | 30 | 25 | -18% |
Episodes with bronchitis among adults (PM2.5) | 290 | 240 | -17% |
Episodes with bronchitis among children (PM2.5) | 1300 | 1200 | -11% |
Working days lost (PM2.5) | 18000 | 15000 | -14% |
Days with restricted activity (sick days) (PM2.5) | 220000 | 190000 | -17% |
Days with minor restricted activity (O3) | 35000 | 34000 | -1% |
Lung cancer morbidity (PM2.5) | 50 | 45 | -14% |
Total inhabitants | 594679 | 610810 | 3% |
Inhabitants over age of 30 years | 381011 | 406416 | 7% |
Inhabitants over age of 30 years (%) | 64% | 67% | 4% |
Table 8.3. Mortality and morbidity effects of air pollution in København in 2019 and 2030 (figures rounded).
Contribution of different emission sectors in 2030
The analysis of the contribution of the different emission sectors focuses on 2030 to illustrate the potential benefits of regulation of the different emission sectors in the future.
City to city
Table 8.4 shows the contribution to København of the emission sectors within København.
Approx. 50 premature deaths can be attributed to emission sources within the city equivalent to about 15% of the total number of premature deaths (310).
It is seen that the two single largest contributions to mortality and morbidity in 2030 are the emission sectors road transport (SNAP7) and residential wood combustion (SNAP2). Obviously, agriculture (SNAP10) does not contribute to premature deaths as there is very limited agriculture in København.
Negative values for days with minor restricted activity due to ozone is a result of chemistry in the atmosphere, where NOx emissions (NO+NO2) emitted in the city lead to lower ozone concentrations in the city as NO consumes ozone in formation of NO2.
Table 8.4. Contributions to mortality and morbidity in København from the emission sectors within København in 2030 (figures rounded).
City contribution to city | City to city | ||||||
Health effects of air pollution in 2030 | SNAP2 | SNAP7 | SNAP8 | SNAP10 | SNAP134 | SNAP569 | All |
Acute mortality (PM2.5, SO2, NO2, O3) | 2 | 7 | 5 | 0 | 5 | 1 | 20 |
Chronic mortality (PM2.5, NO2) | 7 | 7 | 2 | 0 | 7 | 1 | 24 |
Total premature deaths (PM2.5, SO2, NO2, O3) | 10 | 15 | 7 | 0 | 12 | 3 | 47 |
Hospital admissions due to respiratory symptoms (PM2.5, NO2, O3) | 7 | 24 | 14 | 0 | 16 | 2 | 64 |
Hospital admissions due to cardio-vascular diseases (PM2.5, O3) | 3 | 1 | -1 | 0 | 0 | 0 | 3 |
Episodes with asthma among children (PM2.5) | 1 | 1 | 0 | 0 | 0 | 0 | 3 |
Episodes with bronchitis among adults (PM2.5) | 8 | 7 | 1 | 0 | 2 | 2 | 20 |
Episodes with bronchitis among children (PM2.5) | 28 | 23 | 2 | 0 | 6 | 5 | 63 |
Working days lost (PM2.5) | 540 | 440 | 33 | 1 | 120 | 97 | 1200 |
Days with restricted activity (sick days) (PM2.5) | 6500 | 5400 | 400 | 11 | 1400 | 1200 | 15000 |
Days with minor restricted activity (O3) | -220 | -1300 | -890 | -1 | -750 | -110 | -3200 |
Lung cancer morbidity (PM2.5) | 2 | 1 | 0 | 0 | 0 | 0 | 4 |
Country to city
Table 8.5 shows the contribution to København from the emission sectors within Denmark disregarding emissions from København.
Residential wood combustion (SNAP2) is the emission sector with the largest contribution, followed by road transport. Off-road is also a relatively large contributor (SNAP8) as well as agriculture (SNAP10). The contribution from agriculture is related to ammonia emissions that are transformed to ammonium in the atmosphere and thereby becomes part of secondary particles contributing to PM2.5 as ammonium nitrate and ammonium sulphate.
The contribution from Danish emissions to premature deaths in København is approx. 70 which is about 23% of the total premature deaths in København.
Table 8.5. Contribution to mortality and morbidity in København from emission sectors in Denmark (excluding København) in 2030 (Figures rounded).
Contribution of Denmark to city | Denmark to city | ||||||
Health effects of air pollution in 2030 | SNAP2 | SNAP7 | SNAP8 | SNAP10 | SNAP134 | SNAP569 | All |
Acute mortality (PM2.5, SO2, NO2, O3) | 5 | 7 | 8 | 2 | 7 | 1 | 30 |
Chronic mortality (PM2.5, NO2) | 13 | 8 | 4 | 6 | 5 | 2 | 38 |
Total premature deaths (PM2.5, SO2, NO2, O3) | 19 | 16 | 13 | 8 | 12 | 3 | 71 |
Hospital admissions due to respiratory symptoms (PM2.5, NO2, O3) | 15 | 23 | 22 | 7 | 19 | 3 | 89 |
Hospital admissions due to cardio-vascular diseases (PM2.5, O3) | 5 | 2 | 0 | 3 | 1 | 1 | 11 |
Episodes with asthma among children (PM2.5) | 2 | 1 | 0 | 1 | 1 | 0 | 5 |
Episodes with bronchitis among adults (PM2.5) | 15 | 8 | 3 | 7 | 4 | 2 | 39 |
Episodes with bronchitis among children (PM2.5) | 49 | 25 | 9 | 17 | 13 | 7 | 120 |
Working days lost (PM2.5) | 970 | 490 | 190 | 420 | 270 | 140 | 250 |
Days with restricted activity (sick days) (PM2.5) | 12000 | 5900 | 2300 | 5100 | 3200 | 1700 | 30000 |
Days with minor restricted activity (O3) | -320 | -930 | -1100 | 310 | -420 | 89 | -2400 |
Lung cancer morbidity (PM2.5) | 3 | 2 | 1 | 1 | 1 | 1 | 8 |
Abroad to city
Table 8.6 shows a summary of the contribution from emissions abroad to the city together with city to city contribution and contribution from Denmark (with København excluded).
The contribution from abroad is only given as the total health effects and is not broken down on emission sectors.
The contribution from emissions abroad to premature deaths in København is approx. 140, which is about 63% of the total premature deaths in København.
Table 8.6. Summary of contributions from city to city, Denmark to city and contribution from abroad to health effects in København in 2030 (number of cases).
City to city | Denmark to city | Contribution from abroad | Total | |
Health effects of air pollution in 2030 | All | All | All | All |
Acute mortality (PM2.5, SO2, NO2, O3) | 20 | 30 | 60 | 110 |
Chronic mortality (PM2.5, NO2) | 24 | 38 | 140 | 200 |
Total premature deaths (PM2.5, SO2, NO2, O3) | 50 | 70 | 200 | 310 |
Total premature deaths (percentage) | 15% | 23% | 63% | 100% |
Hospital admissions due to respiratory symptoms (PM2.5, NO2, O3) | 64 | 89 | 250 | 410 |
Hospital admissions due to cardio-vascular diseases (PM2.5, O3) | 3 | 11 | 110 | 120 |
Episodes with asthma among children (PM2.5) | 3 | 5 | 17 | 25 |
Episodes with bronchitis among adults (PM2.5) | 20 | 39 | 180 | 240 |
Episodes with bronchitis among children (PM2.5) | 63 | 120 | 970 | 1200 |
Working days lost (PM2.5) | 1200 | 2500 | 12000 | 15000 |
Days with restricted activity (sick days) (PM2.5) | 15000 | 30000 | 140000 | 190000 |
Days with minor restricted activity (O3) | -3200 | -2400 | 40000 | 34000 |
Lung cancer morbidity (PM2.5) | 4 | 8 | 32 | 45 |
The contributions are also visualised as a histogram in Figure 8.2
Figure 8.2. Visualisation of emission sector contributions to the premature deaths in København in 2030.
8.3 External costs and sector contributions in København
This section summarises the external costs of health effects in København in 2030 and the emission sector contributions to the costs.
The external costs will be similarly distributed as the health effects described in the previous section and hence a more concise description will be given in this section. The external costs are dominated by the costs associated with premature death.
External costs of health effects of air pollution in 2019 and 2030
The total costs of air pollution in København in 2019 is estimated to 1.1 billion EUR and 0.89 billion EUR in 2030. The decrease in costs is 21% from 2019 to 2030 similar to the predicted reduction in premature deaths of 22%.
External costs of mortality and morbidity of air pollution in 2030
The distribution of external costs on mortality and morbidity in 2030 is shown in Table 8.7.
Approx. 94% of the external costs in København in 2030 is associated with mortality and 6% with morbidity.
Health effects in 2030 | Mio. EUR | % |
Acute mortality (PM2.5, SO2, NO2, O3) | 500 | |
Chronic mortality (PM2.5, NO2) | 330 | |
Total premature deaths (PM2.5, SO2, NO2, O3) | 830 | 94% |
Hospital admissions due to respiratory symptoms (PM2.5, NO2, O3) | 4 | |
Hospital admissions due to cardio-vascular diseases (PM2.5, O3) | 2 | |
Episodes with asthma among children (PM2.5) | 0 | |
Episodes with bronchitis among children and adults (PM2.5) | 10 | |
Working days lost (PM2.5) | 5 | |
Days with restricted activity (sick days) (PM2.5) | 30 | |
Days with minor restricted activity (O3) | 3 | |
Lung cancer morbidity (PM2.5) | 3 | |
Total morbidity | 56 | 6% |
Total premature death and morbidity | 890 | 100% |
Table 8.7. External costs of health effects in København in 2030 (mio. EUR).
Contribution of different emission sectors in 2030
The contribution to the external costs of different emission sectors as well as the contribution from the city, the country of the city and from sources abroad are for København shown in Table 8.8.
As expected the distribution of external costs closely follows the distribution of premature deaths shown in the previous section.
Table 8.8. Emission sector contributions to external costs of air pollution in København in 2030 (mio. EUR).
2030 | City contribution to city | Contribution of Denmark to city | City to city | Denmark to city | Contribution from abroad | Total | ||||||||||
SNAP2 | SNAP7 | SNAP8 | SNAP10 | SNAP134 | SNAP569 | SNAP2 | SNAP7 | SNAP8 | SNAP10 | SNAP134 | SNAP569 | All | All | All | All | |
Cost of health effects | 25 | 48 | 25 | 0 | 35 | 7 | 48 | 48 | 46 | 20 | 41 | 9 | 140 | 210 | 530 | 890 |
Costs in % | 3% | 5% | 3% | 0% | 4% | 1% | 5% | 5% | 5% | 2% | 5% | 1% | 16% | 24% | 60% | 100% |
8.4 Health effects and sector contributions in Stockholm
Mortality and morbidity effects of air pollution in 2019 and 2030
A summary of mortality and morbidity effects of air pollution in 2019 and 2030 is shown in Table 8.9.
The total number of premature deaths is predicted to approx. 600 in 2019 and approx. 500 in 2030 showing a decrease of approx. 19%. The decrease is a combined effect of an increase in population including more elderly persons and a decrease in air pollution levels. It is also seen that approx. 2/3 of premature deaths are related to chronic premature deaths due long-term exposure and approx. 1/3 to acute premature deaths due to short-term exposure to elevated air pollution levels.
The number of morbidity cases is predicted to decrease from 2019 to 2030.
Health effects | 2019 | 2030 | Difference |
Acute mortality (PM2.5, SO2, NO2, O3) | 200 | 160 | -24% |
Chronic mortality (PM2.5, NO2) | 420 | 350 | -17% |
Total premature deaths (PM2.5, SO2, NO2, O3) | 620 | 510 | -19% |
Hospital admissions due to respiratory symptoms (PM2.5, NO2, O3) | 590 | 470 | -20% |
Hospital admissions due to cardio-vascular diseases (PM2.5, O3) | 180 | 180 | -1% |
Episodes with asthma among children (PM2.5) | 42 | 37 | -11% |
Episodes with bronchitis among adults (PM2.5) | 400 | 380 | -5% |
Episodes with bronchitis among children (PM2.5) | 1700 | 1600 | -5% |
Working days lost (PM2.5) | 81000 | 78000 | -4% |
Days with restricted activity (sick days) (PM2.5) | 440000 | 410000 | -6% |
Days with minor restricted activity (O3) | 52000 | 55000 | 4% |
Lung cancer morbidity (PM2.5) | 36 | 35 | -4% |
Total inhabitants | 1064033 | 1154401 | 8% |
Inhabitants over age of 30 years | 677363 | 750685 | 11% |
Inhabitants over age of 30 years (%) | 64% | 65% | 2% |
Table 8.9. Mortality and morbidity effects of air pollution in Stockholm in 2019 and 2030.
Contribution of different emission sectors in 2030
The analysis of the contribution of the different emission sectors focuses on 2030 to illustrate the potential benefits of regulation of the different emission sectors in the future.
City to city
Table 8.10 shows the contribution to Stockholm of the emission sectors within Stockholm.
Approx. 200 premature deaths can be attributed to emission sources within the city, which is equivalent to about 35% of total premature deaths (500). The percentage attributed to emission sources within the city is higher for Stockholm compared with København (15%). Possible explanations could be that the geographic extent of Stockholm is larger and the population is also larger and background concentrations of (long-range transported) PM2.5 are lower.
It is seen that the single largest contribution to mortality and morbidity in 2030 is from the emission sector transport (SNAP7) and the combined sectors of energy, industrial combustion and industrial processes (SNAP134) are responsible for the second largest contribution whereas residential wood combustion (SNAP2) seems to be of less importance compared with København. Agriculture (SNAP10) does not contribute to premature deaths as there is very limited agriculture in Stockholm.
Negative values for days with minor restricted activity due to ozone is a result of chemistry in the atmosphere, where NOx emissions lead to lower ozone concentrations.
Table 8.10. Contribution to mortality and morbidity in Stockholm from emission sectors in Stockholm in 2030 (figures rounded).
Health effects of air pollution in 2030 | City contribution to city | City to city | |||||
SNAP2 | SNAP7 | SNAP8 | SNAP10 | SNAP134 | SNAP569 | All | |
Acute mortality (PM2.5, SO2, NO2, O3) | 5 | 21 | 7 | 0 | 25 | 1 | 60 |
Chronic mortality (PM2.5, NO2) | 14 | 50 | 8 | 0 | 36 | 7 | 110 |
Total premature deaths (PM2.5, SO2, NO2, O3) | 19 | 71 | 15 | 0 | 61 | 8 | 180 |
Hospital admissions due to respiratory symptoms (PM2.5, NO2, O3) | 13 | 53 | 21 | 0 | 47 | 2 | 140 |
Hospital admissions due to cardio-vascular diseases (PM2.5, O3) | 4 | 14 | 1 | 0 | 8 | 3 | 29 |
Episodes with asthma among children (PM2.5) | 2 | 5 | 1 | 0 | 3 | 1 | 11 |
Episodes with bronchitis among adults (PM2.5) | 15 | 50 | 5 | 0 | 28 | 8 | 110 |
Episodes with bronchitis among children (PM2.5) | 48 | 160 | 15 | 0 | 89 | 26 | 340 |
Working days lost (PM2.5) | 3100 | 10000 | 950 | 1 | 5700 | 1700 | 22000 |
Days with restricted activity (sick days) (PM2.5) | 16000 | 55000 | 5000 | 8 | 30000 | 8700 | 110000 |
Days with minor restricted activity (O3) | -500 | -2100 | -940 | -5 | -1300 | -6 | -4900 |
Lung cancer morbidity (PM2.5) | 1 | 5 | 0 | 0 | 3 | 1 | 10 |
Country to city
Table 8.11 shows the contribution to Stockholm from the emission sectors within Sweden disregarding emissions from Stockholm.
The contribution from Swedish emissions to premature deaths in Stockholm is approx. 90 which is about 18% of total premature deaths in Stockholm.
The three largest contributions to health effects are from the emission sectors road transport (SNAP7), residential wood combustion (SNAP2) and the combined sectors of energy, industrial combustion and industrial processes (SNAP134). Off-road emissions also contribute (SNAP8) as well as agriculture (SNAP10). The contribution from agriculture is related to ammonia emissions that are transformed to ammonium nitrate and ammonium sulphate in the atmosphere and thereby becomes part of secondary particles of PM2.5.
Table 8.11. Contribution to mortality and morbidity in Stockholm from emission sectors in Sweden in 2030 (figures rounded).
Health effects of air pollution in 2030 | Contribution of Sweden to city | Sweden to city | |||||
SNAP2 | SNAP7 | SNAP8 | SNAP10 | SNAP134 | SNAP569 | All | |
Acute mortality (PM2.5, SO2, NO2, O3) | 5 | 10 | 4 | 1 | 7 | 1 | 28 |
Chronic mortality (PM2.5, NO2) | 14 | 25 | 4 | 5 | 10 | 4 | 63 |
Total premature deaths (PM2.5, SO2, NO2, O3) | 19 | 35 | 8 | 6 | 17 | 5 | 90 |
Hospital admissions due to respiratory symptoms (PM2.5, NO2, O3) | 11 | 25 | 10 | 4 | 14 | 2 | 66 |
Hospital admissions due to cardio-vascular diseases (PM2.5, O3) | 5 | 8 | 1 | 2 | 4 | 2 | 23 |
Episodes with asthma among children (PM2.5) | 2 | 3 | 0 | 1 | 1 | 1 | 7 |
Episodes with bronchitis among adults (PM2.5) | 16 | 27 | 4 | 5 | 11 | 5 | 67 |
Episodes with bronchitis among children (PM2.5) | 50 | 84 | 12 | 14 | 32 | 15 | 200 |
Working days lost (PM2.5) | 3200 | 5500 | 820 | 1100 | 2200 | 1000 | 14000 |
Days with restricted activity (sick days) (PM2.5) | 17000 | 29000 | 4300 | 5700 | 11000 | 5400 | 73000 |
Days with minor restricted activity (O3) | -1 | -300 | -15 | 440 | 350 | 140 | 610 |
Lung cancer morbidity (PM2.5) | 1 | 2 | 0 | 0 | 1 | 0 | 6 |
Abroad to city
Table 8.12 shows a summary of the contribution from emissions abroad to the city together with city-to-city contribution and contribution from Sweden (excluding the city).
The contribution from abroad is only given as the total health effects and is not broken down on emission sectors.
The contribution from emissions abroad to premature deaths in Stockholm is approx. 240, which is about 47% of the total premature deaths in Stockholm. The percentage is lower than for København (63%) due to lower background concentration of PM2.5 in Stockholm compared with København, but also because the contribution from Stockholm itself plays a larger role as explained above.
City to city | Country to city | Contribution from abroad | Total | |
Health effects of air pollution in 2030 | All | All | All | All |
Acute mortality (PM2.5, SO2, NO2, O3) | 60 | 28 | 68 | 160 |
Chronic mortality (PM2.5, NO2) | 120 | 63 | 170 | 350 |
Total premature deaths (PM2.5, SO2, NO2, O3) | 180 | 90 | 240 | 500 |
Total premature deaths (percentage) | 35% | 18% | 47% | 100% |
Hospital admissions due to respiratory symptoms (PM2.5, NO2, O3) | 140 | 66 | 270 | 470 |
Hospital admissions due to cardio-vascular diseases (PM2.5, O3) | 29 | 23 | 130 | 180 |
Episodes with asthma among children (PM2.5) | 11 | 7 | 19 | 37 |
Episodes with bronchitis among adults (PM2.5) | 110 | 67 | 210 | 380 |
Episodes with bronchitis among children (PM2.5) | 340 | 210 | 1100 | 1600 |
Working days lost (PM2.5) | 22000 | 14000 | 43000 | 78000 |
Days with restricted activity (sick days) (PM2.5) | 115000 | 73000 | 230000 | 410000 |
Days with minor restricted activity (O3) | -4900 | 610 | 59000 | 55000 |
Lung cancer morbidity (PM2.5) | 10 | 6 | 20 | 35 |
Table 8.12. Summary of contributions from city to city, country to city and contribution from abroad to health effects in Stockholm in 2030 (number of cases). (Figures rounded).
The contributions are also visualised as a histogram in Figure 8.3.
Figure 8.3. Visualisation of emission sector contributions to premature deaths in Stockholm in 2030.
8.5 External costs and sector contributions in Stockholm
This section summarises the external costs of health effects in Stockholm in 2030 and emission sector contributions.
The external costs will be similarly distributed as the health effects and hence a more concise description for external costs is given in the following. The external costs are dominated by the costs associated with premature mortality. The number of premature deaths is dominated by chronic deaths whereas costs are dominated by acute deaths due to the higher costs for acute deaths compared with chronic deaths.
External costs of health effects of air pollution in 2019 and 2030
The total costs of air pollution in Stockholm in 2019 is estimated to 1.6 billion EUR and to 1.3 billion EUR in 2030. The decrease in costs is 20% from 2019 to 2030, similar to the predicted reduction in premature deaths of 19%.
External costs of mortality and morbidity of air pollution in 2030
The distribution of external costs on mortality and morbidity in 2030 is shown in Table 8.13.
Approx. 91% of the external costs in Stockholm in 2030 is associated with mortality and 9% with morbidity, similar to results from København (94%/6%).
Health effects in 2030 | Mio. EUR | % |
Acute mortality (PM2.5, SO2, NO2, O3) | 710 | |
Chronic mortality (PM2.5, NO2) | 460 | |
Total premature deaths (PM2.5, SO2, NO2, O3) | 1200 | 91% |
Hospital admissions due to respiratory symptoms (PM2.5, NO2, O3) | 5 | |
Hospital admissions due to cardio-vascular diseases (PM2.5, O3) | 3 | |
Episodes with asthma among children (PM2.5) | 0 | |
Episodes with bronchitis among children and adults (PM2.5) | 16 | |
Working days lost (PM2.5) | 24 | |
Days with restricted activity (sick days) (PM2.5) | 66 | |
Days with minor restricted activity (O3) | 4 | |
Lung cancer morbidity (PM2.5) | 3 | |
Total morbidity | 120 | 9% |
Total premature death and morbidity | 1300 | 100% |
Table 8.13. External costs of health effects in Stockholm in 2030 (million EUR) (rounded figures).
Contribution of different emission sectors in 2030
The contribution to external costs of different emission sectors as well as the contribution from the city, the country of the city and from sources abroad are for Stockholm shown in Table 8.14.
As expected the distribution of external costs closely follows the distribution of premature deaths shown in the previous section.
Table 8.14. Sector contributions to external costs of air pollution in Stockholm in 2030 (mio. EUR). (Rounded figures).
2030 | City contribution to city | Contribution of Sweden to city | City | Sweden | Abroad | Total | ||||||||||
SNAP2 | SNAP7 | SNAP8 | SNAP10 | SNAP134 | SNAP569 | SNAP2 | SNAP7 | SNAP8 | SNAP10 | SNAP134 | SNAP569 | All | All | All | All | |
Cost of health effects | 47 | 180 | 46 | 0 | 170 | 18 | 45 | 88 | 23 | 15 | 47 | 11 | 460 | 230 | 600 | 1290 |
Costs in % | 4% | 14% | 4% | 0% | 13% | 1% | 3% | 7% | 2% | 1% | 4% | 1% | 36% | 18% | 47% | 100% |
8.6 Health effects and sector contributions in Helsinki
Mortality and morbidity effects of air pollution in 2019 and 2030
A summary of mortality and morbidity effects of air pollution in 2019 and 2030 is shown in Table 8.15.
Total premature deaths are predicted to approx. 390 in 2019 and 330 in 2030 showing a decrease of approx. 15%. The decrease is a combined effect of an increase in population including more elderly persons and a decrease in air pollution levels. It is also seen that approx. 60% of premature deaths are related to chronic premature deaths due long-term exposure and approx. 40% to acute premature deaths due to short-term exposure with elevated air pollution levels.
The number of morbidity cases is also predicted to decrease from 2019 to 2030.
Health effects | 2019 | 2030 | Difference |
Acute mortality (PM2.5, SO2, NO2, O3) | 170 | 140 | -18% |
Chronic mortality (PM2.5, NO2) | 220 | 190 | -13% |
Total premature deaths (PM2.5, SO2, NO2, O3) | 390 | 330 | -15% |
Hospital admissions due to respiratory symptoms (PM2.5, NO2, O3) | 460 | 370 | -19% |
Hospital admissions due to cardio-vascular diseases (PM2.5, O3) | 120 | 110 | -7% |
Episodes with asthma among children (PM2.5) | 40 | 29 | -29% |
Episodes with bronchitis among adults (PM2.5) | 230 | 200 | -11% |
Episodes with bronchitis among children (PM2.5) | 930 | 750 | -19% |
Working days lost (PM2.5) | 17000 | 16000 | -9% |
Days with restricted activity (sick days) (PM2.5) | 180000 | 160000 | -13% |
Days with minor restricted activity (O3) | 16000 | 16000 | -1% |
Lung cancer morbidity (PM2.5) | 26 | 23 | -9% |
Total inhabitants | 687693 | 687865 | 0% |
Inhabitants over age of 30 years | 456697 | 478652 | 5% |
Inhabitants over age of 30 years (%) | 66% | 70% | 5% |
Table 8.15. Mortality and morbidity effects of air pollution in Helsinki in 2019 and 2030. (Rounded figures).
Contribution of different emission sectors in 2030
The analysis of the contribution of the different emission sectors focuses on 2030 to illustrate the potential benefits of regulation of the different emission sectors in the future.
City to city
Table 8.16 shows the contribution to Helsinki of the emission sectors within Helsinki.
Approx. 80 premature deaths can be attributed to emission sources within the city, equivalent to about 25% of total premature deaths (330). The percentage attributed to emission sources within the city is higher than for København (15%), but lower than for Stockholm (35%). Possible explanations could be that the size of the population in Helsinki is similar to København, but background concentrations of PM2.5 are lower.
The largest contribution comes from the combined sectors of energy, industrial combustion and industrial processes (SNAP134), but the largest single contribution is from the emission sector road transport (SNAP7). Residential wood combustion (SNAP2) has the fourth largest contribution. Agriculture (SNAP10) does not contribute to premature deaths as there is very limited agriculture in Helsinki.
Negative values for days with minor restricted activity due to ozone is a result of chemistry in the atmosphere, where NOx emissions lead to lower ozone concentrations.
Table 8.16. Contribution to mortality and morbidity in Helsinki from emission sectors in Helsinki in 2030. (Figures rounded).
Health effects of air pollution in 2030 | City contribution to city | City to city | |||||
SNAP2 | SNAP7 | SNAP8 | SNAP10 | SNAP134 | SNAP569 | All | |
Acute mortality (PM2.5, SO2, NO2, O3) | 1 | 7 | 5 | 0 | 35 | 1 | 48 |
Chronic mortality (PM2.5, NO2) | 5 | 14 | 4 | 0 | 8 | 3 | 35 |
Total premature deaths (PM2.5, SO2, NO2, O3) | 6 | 21 | 9 | 0 | 43 | 3 | 83 |
Hospital admissions due to respiratory symptoms (PM2.5, NO2, O3) | 4 | 22 | 16 | 0 | 54 | 1 | 96 |
Hospital admissions due to cardio-vascular diseases (PM2.5, O3) | 2 | 4 | 0 | 0 | -2 | 1 | 5 |
Episodes with asthma among children (PM2.5) | 1 | 2 | 1 | 0 | 1 | 0 | 4 |
Episodes with bronchitis among adults (PM2.5) | 5 | 15 | 4 | 0 | 5 | 3 | 32 |
Episodes with bronchitis among children (PM2.5) | 14 | 38 | 9 | 1 | 13 | 8 | 83 |
Working days lost (PM2.5) | 420 | 1100 | 270 | 17 | 390 | 230 | 2400 |
Days with restricted activity (sick days) (PM2.5) | 4300 | 12000 | 2800 | 170 | 4000 | 2400 | 25000 |
Days with minor restricted activity (O3) | -82 | -780 | -810 | -2 | -2100 | -4 | -3800 |
Lung cancer morbidity (PM2.5) | 1 | 2 | 0 | 0 | 0 | 0 | 3 |
Contribution from Finland to city
Table 8.17 shows the contribution to Helsinki from the emission sectors within Finland disregarding emissions from Helsinki.
The contribution from emissions in Finland to premature deaths in Helsinki is approx. 70 which is about 21% of total premature deaths in Helsinki.
The three emission sectors with the largest contribution to health effects are the combined sectors of energy, industrial combustion and industrial processes (SNAP134), road transport (SNAP7) and residential wood combustion (SNAP2). Off-road emissions are also contributing (SNAP8) as well as agriculture (SNAP10). The contribution from agriculture is related to ammonia emissions that are transformed to ammonium nitrate and ammonium sulphate in the atmosphere and thereby become part of secondary particles of PM2.5.
Table 8.17. Contribution to mortality and morbidity in Helsinki from emission sectors in Finland in 2030.
Health effects of air pollution in 2030 | Contribution of Finland to city | Finland to city | |||||
SNAP2 | SNAP7 | SNAP8 | SNAP10 | SNAP134 | SNAP569 | All | |
Acute mortality (PM2.5, SO2, NO2, O3) | 3 | 6 | 3 | 1 | 14 | 0 | 27 |
Chronic mortality (PM2.5, NO2) | 12 | 13 | 5 | 2 | 8 | 2 | 43 |
Total premature deaths (PM2.5, SO2, NO2, O3) | 16 | 19 | 8 | 3 | 22 | 2 | 70 |
Hospital admissions due to respiratory symptoms (PM2.5, NO2, O3) | 9 | 19 | 10 | 3 | 35 | 1 | 77 |
Hospital admissions due to cardio-vascular diseases (PM2.5, O3) | 5 | 5 | 2 | 1 | 1 | 1 | 15 |
Episodes with asthma among children (PM2.5) | 2 | 2 | 1 | 0 | 1 | 0 | 6 |
Episodes with bronchitis among adults (PM2.5) | 13 | 14 | 5 | 2 | 7 | 2 | 42 |
Episodes with bronchitis among children (PM2.5) | 34 | 35 | 12 | 5 | 16 | 4 | 110 |
Working days lost (PM2.5) | 1000 | 1100 | 390 | 190 | 520 | 130 | 3300 |
Days with restricted activity (sick days) (PM2.5) | 10000 | 11000 | 4000 | 1900 | 5300 | 1300 | 34000 |
Days with minor restricted activity (O3) | -120 | -390 | -210 | 140 | -650 | 33 | -1200 |
Lung cancer morbidity (PM2.5) | 1 | 1 | 0 | 0 | 1 | 0 | 4 |
Abroad to city
Table 8.18 shows a summary of the contribution from abroad to the city together with city to city contribution and contribution from Finland.
The contribution from abroad is only given as the total health effects and is not broken down on emission sectors.
The contribution from emissions abroad to premature deaths in Helsinki is approx. 180 which is about 53% of total premature deaths in Helsinki. The percentage is comparable to Stockholm (47%) for the same reasons as given for Stockholm when compared with København.
City to city | Country to city | Contribution from abroad | Total | |
Health effects of air pollution in 2030 | All | All | All | All |
Acute mortality (PM2.5, SO2, NO2, O3) | 48 | 27 | 66 | 140 |
Chronic mortality (PM2.5, NO2) | 35 | 43 | 110 | 190 |
Total premature deaths (PM2.5, SO2, NO2, O3) | 83 | 70 | 180 | 330 |
Total premature deaths (percentage) | 25% | 21% | 53% | 100% |
Hospital admissions due to respiratory symptoms (PM2.5, NO2, O3) | 96 | 77 | 200 | 370 |
Hospital admissions due to cardio-vascular diseases (PM2.5, O3) | 5 | 15 | 87 | 110 |
Episodes with asthma among children (PM2.5) | 4 | 6 | 18 | 29 |
Episodes with bronchitis among adults (PM2.5) | 32 | 42 | 130 | 200 |
Episodes with bronchitis among children (PM2.5) | 83 | 110 | 560 | 750 |
Working days lost (PM2.5) | 2400 | 3300 | 9800 | 16000 |
Days with restricted activity (sick days) (PM2.5) | 25000 | 34000 | 100000 | 160000 |
Days with minor restricted activity (O3) | -3800 | -1200 | 21000 | 16000 |
Lung cancer morbidity (PM2.5) | 3 | 4 | 16 | 23 |
Table 8.18. Summary of contributions from city to city, country to city and contribution from abroad to health effects in Helsinki in 2030 (number of cases).
The contributions are also visualised as a histogram in Figure 8.4.
Figure 8.4. Visualisation of emission sector contributions to premature deaths in Helsinki in 2030.
8.7 External costs and sector contributions in Helsinki
This section summarises the external costs of health effects in Helsinki in 2030 and the emission sector contributions.
The external costs are dominated by the costs associated with premature mortality. The number of premature deaths are dominated by the chronic deaths whereas costs are dominated by acute deaths due to the higher costs for acute deaths compared with chronic deaths.
External costs of health effects of air pollution in 2019 and 2030
The total costs of air pollution in Helsinki in 2019 is estimated to 1.2 billion EUR and 0.9 billion EUR in 2030. The decrease in costs is 16% from 2019 to 2030 similar to the predicted reduction in premature deaths of 15%.
External costs of mortality and morbidity of air pollution in 2030
The distribution of external costs on mortality and morbidity in 2030 is shown in Table 8.19.
Approx. 95% of the external costs in Helsinki in 2030 is associated with mortality and 5% with morbidity similar to results from København (94%/6%) and Stockholm (91%/9%).
Health effects in 2030 | Mio. EUR | % |
Acute mortality (PM2.5, SO2, NO2, O3) | 640 | |
Chronic mortality (PM2.5, NO2) | 280 | |
Total premature deaths (PM2.5, SO2, NO2, O3) | 920 | 95% |
Hospital admissions due to respiratory symptoms (PM2.5, NO2, O3) | 4 | |
Hospital admissions due to cardio-vascular diseases (PM2.5, O3) | 2 | |
Episodes with asthma among children (PM2.5) | 0 | |
Episodes with bronchitis among children and adults (PM2.5) | 8 | |
Working days lost (PM2.5) | 5 | |
Days with restricted activity (sick days) (PM2.5) | 25 | |
Days with minor restricted activity (O3) | 1 | |
Lung cancer morbidity (PM2.5) | 2 | |
Total morbidity | 50 | 5% |
Total premature death and morbidity | 960 | 100% |
Table 8.19. External costs of health effects in Helsinki in 2030 (mio. EUR). (Figures rounded).
Contribution of different emission sectors in 2030
The contribution to external costs of different emission sectors as well as the contribution from the city, the country of the city and sources from abroad are for Helsinki shown in Table 8.20.
As expected the distribution of external costs closely follows the distribution of premature deaths shown in the previous section.
Table 8.20. Sector contributions to external costs of air pollution in Helsinki in 2030 (million EUR). (Figures rounded).
2030 | City contribution to city | Contribution of Finland to city | City | Finland | Abroad | Total | ||||||||||
SNAP2 | SNAP7 | SNAP8 | SNAP10 | SNAP134 | SNAP569 | SNAP2 | SNAP7 | SNAP8 | SNAP10 | SNAP134 | SNAP569 | All | All | All | All | |
Cost of health effects | 15 | 55 | 29 | 1 | 170 | 8 | 37 | 48 | 22 | 8 | 77 | 4 | 280 | 200 | 490 | 960 |
Costs in % | 2% | 6% | 3% | 0% | 18% | 1% | 4% | 5% | 2% | 1% | 8% | 0% | 29% | 20% | 51% | 100% |
8.9 Health effects and sector contributions in Reykjavík
Mortality and morbidity effects of air pollution in 2019 and 2030
A summary of mortality and morbidity effects of air pollution in 2019 and 2030 is shown in Table 8.21.
Total premature deaths are predicted to approx. 39 in 2019 and also 39 in 2030. The reason why the number of premature deaths is not changing is a combined effect of a large increase in population including more elderly persons and a decrease in air pollution levels.
Health effects | 2019 | 2030 | Difference |
Acute mortality (PM2.5, SO2, NO2, O3) | 22 | 21 | -5% |
Chronic mortality (PM2.5, NO2) | 16 | 18 | 9% |
Total premature deaths (PM2.5, SO2, NO2, O3) | 39 | 39 | 1% |
Hospital admissions due to respiratory symptoms (PM2.5, NO2, O3) | 57 | 58 | 2% |
Hospital admissions due to cardio-vascular diseases (PM2.5, O3) | 13 | 14 | 9% |
Episodes with asthma among children (PM2.5) | 6 | 6 | -8% |
Episodes with bronchitis among adults (PM2.5) | 36 | 37 | 4% |
Episodes with bronchitis among children (PM2.5) | 200 | 300 | 9% |
Working days lost (PM2.5) | 3900 | 4300 | 9% |
Days with restricted activity (sick days) (PM2.5) | 31400 | 32000 | 2% |
Days with minor restricted activity (O3) | 11900 | 11500 | -3% |
Lung cancer morbidity (PM2.5) | 3 | 4 | 9% |
Total inhabitants | 226661 | 264756 | 17% |
Inhabitants over age of 30 years | 134433 | 168473 | 25% |
Inhabitants over age of 30 years (%) | 59% | 64% | 7% |
Table 8.21. Mortality and morbidity effects of air pollution in Reykjavík in 2019 and 2030. (Figures rounded).
Contribution of different emission sectors in 2030
The analysis of the contribution of the different emission sectors focuses on 2030 to illustrate the potential benefits of regulation of the different emission sectors in the future.
City to city
Table 8.22 shows the contribution to Reykjavík of the emission sectors within Reykjavík.
Approx. 17 premature deaths can be attributed to emission sources within the city equivalent to about 43% of total premature deaths (39). The percentage attributed to emission sources within the city is higher than for København (15%), Helsinki (25%) and Stockholm (35%). The reason is mainly related to the location of Iceland in the North Atlantic Ocean with relative low contributions from emission sources abroad.
The contribution from different emission sources in Reykjavík shows a very different pattern than for the other Nordic capital cities. The largest contribution comes from the off-road sector (SNAP8) related to the fishing fleet. However, in the emission inventory these emissions are allocated to harbour areas and therefore the concentration contributions from this sector is overestimated as emissions correctly should be allocated to sea areas. Residential wood combustion (SNAP2) is insignificant.
Negative values for days with minor restricted activity due to ozone is a result of chemistry in the atmosphere, where NOx emissions lead to lower ozone concentrations.
Table 8.22. Contribution to mortality and morbidity in Reykjavík from emission sectors in Reykjavík in 2030.
Health effects of air pollution in 2030 | City contribution to city | City to city | |||||
SNAP2 | SNAP7 | SNAP8 | SNAP10 | SNAP134 | SNAP569 | All | |
Acute mortality (PM2.5, SO2, NO2, O3) | 0 | 1 | 11 | 2 | 1 | 0 | 15 |
Chronic mortality (PM2.5, NO2) | 0 | 1 | 1 | 0 | 0 | 1 | 4 |
Total premature deaths (PM2.5, SO2, NO2, O3) | 0 | 2 | 12 | 2 | 1 | 0 | 17 |
Hospital admissions due to respiratory symptoms (PM2.5, NO2 ,O3) | 0 | 1 | 22 | 4 | 1 | 0 | 28 |
Hospital admissions due to cardio-vascular diseases (PM2.5, O3) | 0 | 0 | -1 | 0 | 0 | 0 | 0 |
Episodes with asthma among children (PM2.5) | 0 | 0 | 0 | 0 | 0 | 0 | 1 |
Episodes with bronchitis among adults (PM2.5) | 0 | 2 | 2 | 0 | 1 | 1 | 7 |
Episodes with bronchitis among children (PM2.5) | 0 | 8 | 8 | 0 | 2 | 3 | 21 |
Working days lost (PM2.5) | 2 | 256 | 258 | 8 | 74 | 95 | 694 |
Days with restricted activity (sick days) (PM2.5) | 14 | 1912 | 1926 | 62 | 552 | 708 | 5175 |
Days with minor restricted activity (O3) | -9 | -103 | -2522 | -425 | -46 | -3 | -3108 |
Lung cancer morbidity (PM2.5) | 0 | 0 | 0 | 0 | 0 | 0 | 1 |
Contribution from Iceland to city
Table 8.23 shows the contribution to Reykjavík from the emission sectors within Iceland disregarding emissions from Reykjavík.
The contribution from emissions in Iceland to premature deaths in Reykjavík is approx. 11 which is about 27% of total premature deaths in Reykjavík.
The two largest contributions to health effects come from emissions from the off-road sector (SNAP8) and the combined sector of energy, industrial combustion and industrial processes (SNAP134).
Table 8.23. Contribution to mortality and morbidity in Reykjavík from emission sectors in Iceland in 2030. (Rounded figures).
Health effects of air pollution in 2030 | Contribution of Iceland to city | Iceland to city | |||||
SNAP2 | SNAP7 | SNAP8 | SNAP10 | SNAP134 | SNAP569 | All | |
Acute mortality (PM2.5, SO2, NO2, O3) | 0 | 0 | 5 | 1 | 2 | 0 | 8 |
Chronic mortality (PM2.5, NO2) | 0 | 0 | 1 | 1 | 1 | 0 | 4 |
Total premature deaths (PM2.5, SO2, NO2, O3) | 0 | 0 | 6 | 1 | 3 | 0 | 11 |
Hospital admissions due to respiratory symptoms (PM2.5, NO2, O3) | 0 | 0 | 13 | 1 | 2 | 0 | 16 |
Hospital admissions due to cardio-vascular diseases (PM2.5 ,O3) | 0 | 0 | 0 | 0 | 1 | 0 | 1 |
Episodes with asthma among children (PM2.5) | 0 | 0 | 0 | 0 | 0 | 0 | 1 |
Episodes with bronchitis among adults (PM2.5) | 0 | 1 | 3 | 2 | 3 | 1 | 9 |
Episodes with bronchitis among children (PM2.5) | 0 | 2 | 9 | 2 | 8 | 1 | 23 |
Working days lost (PM2.5) | 1 | 85 | 308 | 213 | 282 | 44 | 933 |
Days with restricted activity (sick days) (PM2.5) | 8 | 632 | 2299 | 1589 | 2102 | 326 | 6957 |
Days with minor restricted activity (O3) | 21 | 12 | -1095 | 14 | -15 | -4 | -1067 |
Lung cancer morbidity (PM2.5) | 0 | 0 | 0 | 0 | 0 | 0 | 1 |
Contribution to city from emissions from abroad
Table 8.24 shows a summary of the contribution from abroad to the city together with city to city contribution and contribution from Iceland.
The contribution from abroad is only given as the total health effects and is not broken down on emission sectors.
The contribution from emissions from abroad to premature deaths in Reykjavík is approx. 11 which is only approx. 30% of the total premature deaths in Reykjavík. The percentage is the lowest compared with the other Nordic capital cities. The reason is the relatively low PM2.5 concentrations causing less chronic mortality compared with other capital cities.
Health effects of air pollution in 2030 | City to city | Country to city | Contribution from abroad | Total |
All | All | All | All | |
Acute mortality (PM2.5, SO2, NO2, O3) | 15 | 8 | -2 | 21 |
Chronic mortality (PM2.5, NO2) | 4 | 4 | 9 | 18 |
Total premature deaths (PM2.5, SO2, NO2, O3) | 17 | 11 | 11 | 39 |
Total premature deaths (percentage) | 43% | 27% | 30% | 100% |
Hospital admissions due to respiratory symptoms (PM2.5, NO2, O3) | 28 | 16 | 14 | 58 |
Hospital admissions due to cardio-vascular diseases (PM2.5, O3) | 0 | 1 | 13 | 14 |
Episodes with asthma among children (PM2.5) | 1 | 1 | 4 | 6 |
Episodes with bronchitis among adults (PM2.5) | 7 | 9 | 21 | 37 |
Episodes with bronchitis among children (PM2.5) | 21 | 23 | 258 | 302 |
Working days lost (PM2.5) | 694 | 933 | 2656 | 4282 |
Days with restricted activity (sick days) (PM2.5) | 5175 | 6957 | 19802 | 31934 |
Days with minor restricted activity (O3) | -3108 | -1067 | 15651 | 11475 |
Lung cancer morbidity (PM2.5) | 1 | 1 | 1 | 4 |
Table 8.24. Summary of contributions from city to city, country to city and contribution from abroad to health effects in Reykjavík in 2030 (number of cases).
The contributions are also visualised as a histogram in Figure 8.5.
Figure 8.5. Visualisation of emission sector contributions to premature deaths in Reykjavík in 2030.
8.10 External costs and sector contributions in Reykjavík
This section summarises the external costs of health effects in Reykjavík in 2030 and sector contributions.
The external costs are dominated by the costs associated with premature mortality. In case of Reykjavík, the number of premature deaths are dominated by acute deaths, which is different from the other Nordic capital cities where chronic deaths dominate.
External costs of health effects of air pollution in 2019 and 2030
The total costs of air pollution in Reykjavík in 2019 is estimated to 0.14 billion EUR and also 0.14 billion EUR in 2030. The costs are the same in 2019 and 2030 similar to the predicted number of premature deaths.
External costs of mortality and morbidity of air pollution in 2030
The distribution of external costs on mortality and morbidity in 2030 is shown in Table 8.25.
Approx. 93% of the external costs in Reykjavík in 2030 is associated with mortality and 7% with morbidity similar to results from København (94%/6%), Stockholm (91%/9%) and Helsinki (95%/5%).
Health effects in 2030 | Mio. EUR | % |
Acute mortality (PM2.5, SO2, NO2, O3) | 96 | |
Chronic mortality (PM2.5, NO2) | 31 | |
Total premature deaths (PM2.5, SO2, NO2, O3) | 127 | 93% |
Hospital admissions due to respiratory symptoms (PM2.5, NO2, O3) | 1 | |
Hospital admissions due to cardio-vascular diseases (PM2.5, O3) | 0 | |
Episodes with asthma among children (PM2.5) | 0 | |
Episodes with bronchitis among children and adults (PM2.5) | 2 | |
Working days lost (PM2.5) | 1 | |
Days with restricted activity (sick days) (PM2.5) | 5 | |
Days with minor restricted activity (O3) | 1 | |
Lung cancer morbidity (PM2.5) | 0 | |
Total morbidity | 10 | 7% |
Total premature death and morbidity | 138 | 100% |
Table 8.25. External costs of health effects in Reykjavík in 2030 (million EUR).
Contribution of different emission sectors in 2030
The contribution to external costs of different emission sectors as well as the contribution from the city, the country of the city and sources from abroad are for Reykjavík shown in Table 8.26.
As expected the distribution of external costs closely follows the distribution of premature deaths shown in the previous section.
Table 8.26. Sector contributions to external costs of air pollution in Reykjavík in 2030 (mio. EUR).
2030 | City contribution to city | Contribution of Iceland to city | City | Iceland | Abro-ad | Total | ||||||||||
SNAP2 | SNAP7 | SNAP8 | SNAP10 | SNAP134 | SNAP569 | SNAP2 | SNAP7 | SNAP8 | SNAP10 | SNAP134 | SNAP569 | All | All | All | All | |
Cost of health effects | 0 | 5 | 51 | 7 | 6 | 1 | 0 | 1 | 24 | 4 | 11 | 1 | 70 | 41 | 26 | 137 |
Costs in % | 0% | 4% | 37% | 5% | 4% | 1% | 0% | 1% | 18% | 3% | 8% | 1% | 51% | 30% | 19% | 100% |
8.11 Health effects in Oslo
Data for 2030 is not available for Oslo due to data problems described in chapter 5, and hence health effects and related costs as well as sector contributions are not available.
Mortality and morbidity effects of air pollution in 2019
A summary of mortality and morbidity effects of air pollution for Oslo in 2019 is shown in Table 8.27.
The total number of premature deaths is calculated to approx. 450 in 2019.
Health effects | 2019 |
Acute mortality (PM2.5, SO2, NO2, O3) | 130 |
Chronic mortality (PM2.5, NO2) | 320 |
Total premature deaths (PM2.5, SO2, NO2, O3) | 450 |
Hospital admissions due to respiratory symptoms (PM2.5, NO2, O3) | 490 |
Hospital admissions due to cardio-vascular diseases (PM2.5, O3) | 150 |
Episodes with asthma among children (PM2.5) | 24 |
Episodes with bronchitis among adults (PM2.5) | 390 |
Episodes with bronchitis among children (PM2.5) | 1600 |
Working days lost (PM2.5) | 25000 |
Days with restricted activity (sick days) (PM2.5) | 300000 |
Days with minor restricted activity (O3) | 21000 |
Lung cancer morbidity (PM2.5) | 52 |
Total inhabitants | 697526 |
Inhabitants over age of 30 years | 439860 |
Inhabitants over age of 30 years (%) | 63% |
Table 8.27. Mortality and morbidity effects of air pollution in Oslo in 2019.
It is also for Oslo seen that approx. 2/3 of the premature deaths are related to chronic premature deaths due long-term exposure and approx. 1/3 to acute premature deaths due to short-term exposure with elevated air pollution levels.
8.12 External costs in Oslo
This section summarises the external costs of health effects in Oslo.
The external costs are dominated by the costs associated with premature mortality. The number of premature deaths is dominated by chronic deaths whereas costs are dominated by acute deaths due to higher costs for acute deaths compared with chronic deaths.
The total costs of air pollution in Oslo in 2019 is estimated to 1.2 billion EUR.
8.13 Summary of health effects and costs for capital cities
Premature mortality
A summary of the number of premature deaths in the Nordic capital cities due to air pollution is given in Table 8.28.
Key factors in determination of the number of premature deaths are air quality levels of PM2.5, NO2 and O3 and the number of inhabitants. This is also evident from the results in Table 8.28. Although populations are expected to grow from 2019 to 2030, premature deaths are predicted to decrease as air quality improves.
Area (km2) | Inhabitants in 2019 | Inhabitants in 2030 | 2019 | 2030 | Difference | |
København | 95 | 594,679 | 610,810 | 410 | 310 | -22% |
Stockholm | 207 | 1,064,033 | 1,154,401 | 620 | 510 | -19% |
Helsinki | 195 | 687,693 | 687,865 | 390 | 330 | -15% |
Reykavik | 173 | 226,661 | 264,756 | 39 | 39 | 1% |
Oslo | 262 | 664,000 | 697,526 | 450 | n.a. | n.a. |
Table 8.28. Number of premature deaths in the capital cities in 2019 and 2030.
The distribution of premature death caused by emissions from the city, from the country and from abroad for the Nordic capital cities is shown in Table 8.29.
The contribution from the city ranges from 15% to 43%, from the country from 18% to 27% and from abroad from 30% to 60%. Reykjavík has the highest contribution from the city and the lowest from abroad. The opposite picture is seen for København with the lowest contribution from the city and the highest contribution from abroad.
From city | From country | From abroad | Total | |
København | 15% | 23% | 63% | 100% |
Stockholm | 35% | 18% | 47% | 100% |
Helsinki | 25% | 21% | 53% | 100% |
Reykavík | 43% | 27% | 30% | 100% |
Oslo | n.a. | n.a. | n.a. | n.a. |
Table 8.29. Percentage of premature deaths in the Nordic capital cities in 2030 distributed on contributions from city to city, from country and from abroad.
External costs
The external costs related to air pollution for the capital cities are given in Table 8.30.
Area (km2) | Inhabitants in 2019 | Inhabitants in 2030 | 2019 | 2030 | Difference | |
København | 95 | 594,679 | 610,810 | 1.1 | 0.9 | -21% |
Stockholm | 207 | 1,064,033 | 1,154,401 | 1.6 | 1.3 | -20% |
Helsinki | 195 | 687,693 | 687,865 | 1.2 | 0.9 | -16% |
Reykavík | 173 | 226,661 | 264,756 | 0.14 | 0.14 | -2% |
Oslo | 262 | 664,000 | 697,526 | 1.2 | n.a. | n.a. |
Table 8.30. External costs related to health effects of air pollution in capital cities in 2019 and 2030. Billion EUR.