2. Overall methodology
In this chapter, the overall methodology for addressing the three main tasks of the project is presented: (1) Projection of air quality for 2030 for the Nordic countries and selected cities, (2) Sector specific contribution to air quality in 2030 and health effects and related external costs, and (3) Evaluation of air quality monitoring in Nordic countries.
To address the analyses in (1) and (2), the regional scale air quality model (DEHM) and the urban scale air quality model (UBM) have been set up and applied, and to address health impacts and related external costs the integrated modelling system - EVA (Economic Valuation of Air Pollution) was used. A brief description of these model tools is provided below, followed by a description of the selection of cities and model boundaries. Aarhus University has developed all the models. Finally, a description of the methodologies for addressing task (3) is outlined.
2.1 Regional scale air quality modelling (DEHM)
The Danish Eulerian Hemispheric Model (DEHM) is a state-of-the-art, three-dimensional, atmospheric chemistry transport model (CTM) developed to study long-range transport of air pollution across the Northern Hemisphere. DEHM was originally developed in the early 1990s in the modelling group of ENVS in order to study atmospheric transport of sulphur-dioxide and sulphate into the Arctic (Christensen, 1997). The model has been modified, extended and up-dated continuously since then (Frohn et al., 2001; Brandt et al., 2012). The original simple sulphur-dioxide-sulphate chemistry has been replaced by a more comprehensive chemical scheme, including 80 chemical species, 9 primary particles and 158 chemical reactions. The DEHM model has also been used for studies of additional components, including POPs, mercury, pollen, CO2 and ultrafine particles.
The model includes descriptions of the atmospheric transport and mixing, the chemical processes as well as the removal by rain and the deposition/removal to land and water surfaces. Natural emissions of e.g. sea salt and biogenic VOCs are calculated on-line in the model, while anthropogenic emission input data are based on a number of international (e.g. EMEP) and national inventories. For Denmark the high-resolution (1 km x 1 km) emissions from the SPREAD model is applied (Plejdrup et al., 2021). The driving meteorological data are obtained from the Weather Research and Forecasting model (WRF, Skamarock et al., 2008), also run routinely at ENVS, or from the ECMWF Integrated Forecasting System (IFS, http://dx.doi.org/10.21957/zw5j5zdz5).
The model domain covers most of the Northern Hemisphere, discretized on a polar stereographic projection true at 60°N, and includes a two-way nesting procedure with several nests, allowing for higher spatial resolution over selected areas. The setup is flexible and can change from study to study.
The most commonly applied setup includes three nested domains with higher resolution over Europe, Northern Europe and Denmark. Currently the finest resolution is 5.56 km x 5.56 km for a domain covering Denmark. The vertical discretization is defined on an irregular grid with 29 layers up to ~18 km. The thickness of the lowest layer is 15–25 m and varies with meteorological conditions.
The DEHM model has been developed and applied as a part of the Danish Air Quality Monitoring Programme (NOVANA) for more than 15 years – with focus both on chemical species important for human health (ozone, NO2, particles, etc.) and on deposition of reduced and oxidized nitrogen to marine and terrestrial eco-systems (Ellermann et al., 2022).
The model has also been applied for more than 30 years in the Arctic Monitoring and Assessment Programme (AMAP) in several assessments to study the atmospheric transport to and deposition within the Arctic of sulphur, sulphate, ozone, NOx, VOC’s, lead, Hg, Black Carbon, POPs and other components and is a reference model in AMAP.
The DEHM model has through the years been included in a number of international model intercomparison exercises together with similar state-of-the-art models from both Europe and North America (latest e.g. AQMEII phase 1 and 3) and for different areas (Europe, North America and Arctic).
DEHM is one of 11 European models of the EU-funded CAMS2-40 ‘Regional production’ (an extension of CAMS-50). CAMS2-40 is part of the Copernicus Atmosphere Monitoring Service (CAMS), providing air quality forecasts and analysis for Europe on a daily basis.
2.2 Urban scale air quality modelling (UBM)
The Urban Background Model (UBM) (Brandt et al., 2012; 2013a,b) is a high-resolution Gaussian plume-in-grid model for prediction of background concentrations with a 1 km x 1 km resolution. It is in its standard setup for Denmark, capable of calculating hourly values of 17 health related chemical components for a period covering 1979 to present. The emissions for this setup are obtained from the SPREAD model that provides spatially distributed national emissions from all sectors on a 1 km x 1 km grid for Denmark based on various geographic variables applied for the different emission sectors (Plejdrup et al., 2021).
The model is coupled to the long-range chemical transport model, DEHM, for chemical boundary conditions and to the WRF model for meteorology. UBM is developed for downscaling air pollution at high resolution using a Gaussian plume-in-grid model applying high-resolution emission data (1 km x 1 km) and includes simplified chemistry for the reactions governing O3, NO2 and NO. The coupled model DEHM/UBM includes the gaseous air pollution components nitrogen-oxides (NOx, NO2), ozone (O3), carbon monoxide (CO), sulphur dioxide (SO2) and ammonia (NH3) and the particulate matter fractions PM10 and PM2.5, as well as the individual components of PM2.5 and PM10: mineral dust, black carbon (BC), organic matter (OM), nitrate (NO3-), sulphate (SO42-), ammonium (NH4+), (and the sum of the latter three; Secondary Inorganic Aerosols (SIA)), Secondary Organic Aerosols (SOA) and sea salt.
The model is continuously evaluated against observations from the Danish monitoring network, but also from other measuring campaigns and observations in other countries (see e.g. Hvidtfeldt et al., 2018; Kumar et al., 2019; Khan et al., 2019, Raaschou-Nielsen et al., 2020). In the just finalized research project NordicWelfAir, UBM has been setup and evaluated for a domain covering continental Scandinavia (Frohn et al., 2022)
The model has been used for air pollution forecasting at high resolution for cities since 1998 and is a central part of the Danish Air Quality Monitoring Programme for calculating air pollution levels and trends as well as input to the EVA model system for performing assessments of health impacts and related external costs (Ellermann et al., 2022). UBM has been used in many advisory projects for Governmental decision support. The model also forms the basis for a large number of epidemiological and health impact assessment research projects.
2.3 Modelling health effects and related external costs of air pollution (EVA-system)
The integrated model system EVA (Frohn et al., 2022, Andersen et al., 2007, 2008, Brandt et al., 2013a,b), is based on the impact-pathway approach (Friedrich and Bickel, 2001) and is used for assessment of health impacts from air pollution, including both health effects and related external costs (sometimes also referred to as “indirect costs”), which can be attributed to air pollution exposure. Air pollution components important for health impacts and included in the EVA system are: NO2, SO2, O3 and PM2.5, where the individual constituents of PM2.5 are: mineral dust, BC, OC, SIA, SOA and sea salt.
The EVA model is coupled to the air pollution models DEHM and UBM for regional-scale and local-scale health impact assessments, respectively. EVA includes gridded population data, exposure-response functions for health impacts in terms of a number of morbidity endpoints and mortality, and economic valuation of the health impacts from air pollution.
To calculate the impacts of the total air pollution levels or of emissions from a specific source or sector, concentrations and population data are combined to estimate human exposure. Then the health effect response is calculated using an exposure-response function, and applying economic valuation for the different health effects provides the estimation of the external costs.
The different elements of the EVA-system are illustrated in Figure 2.1.
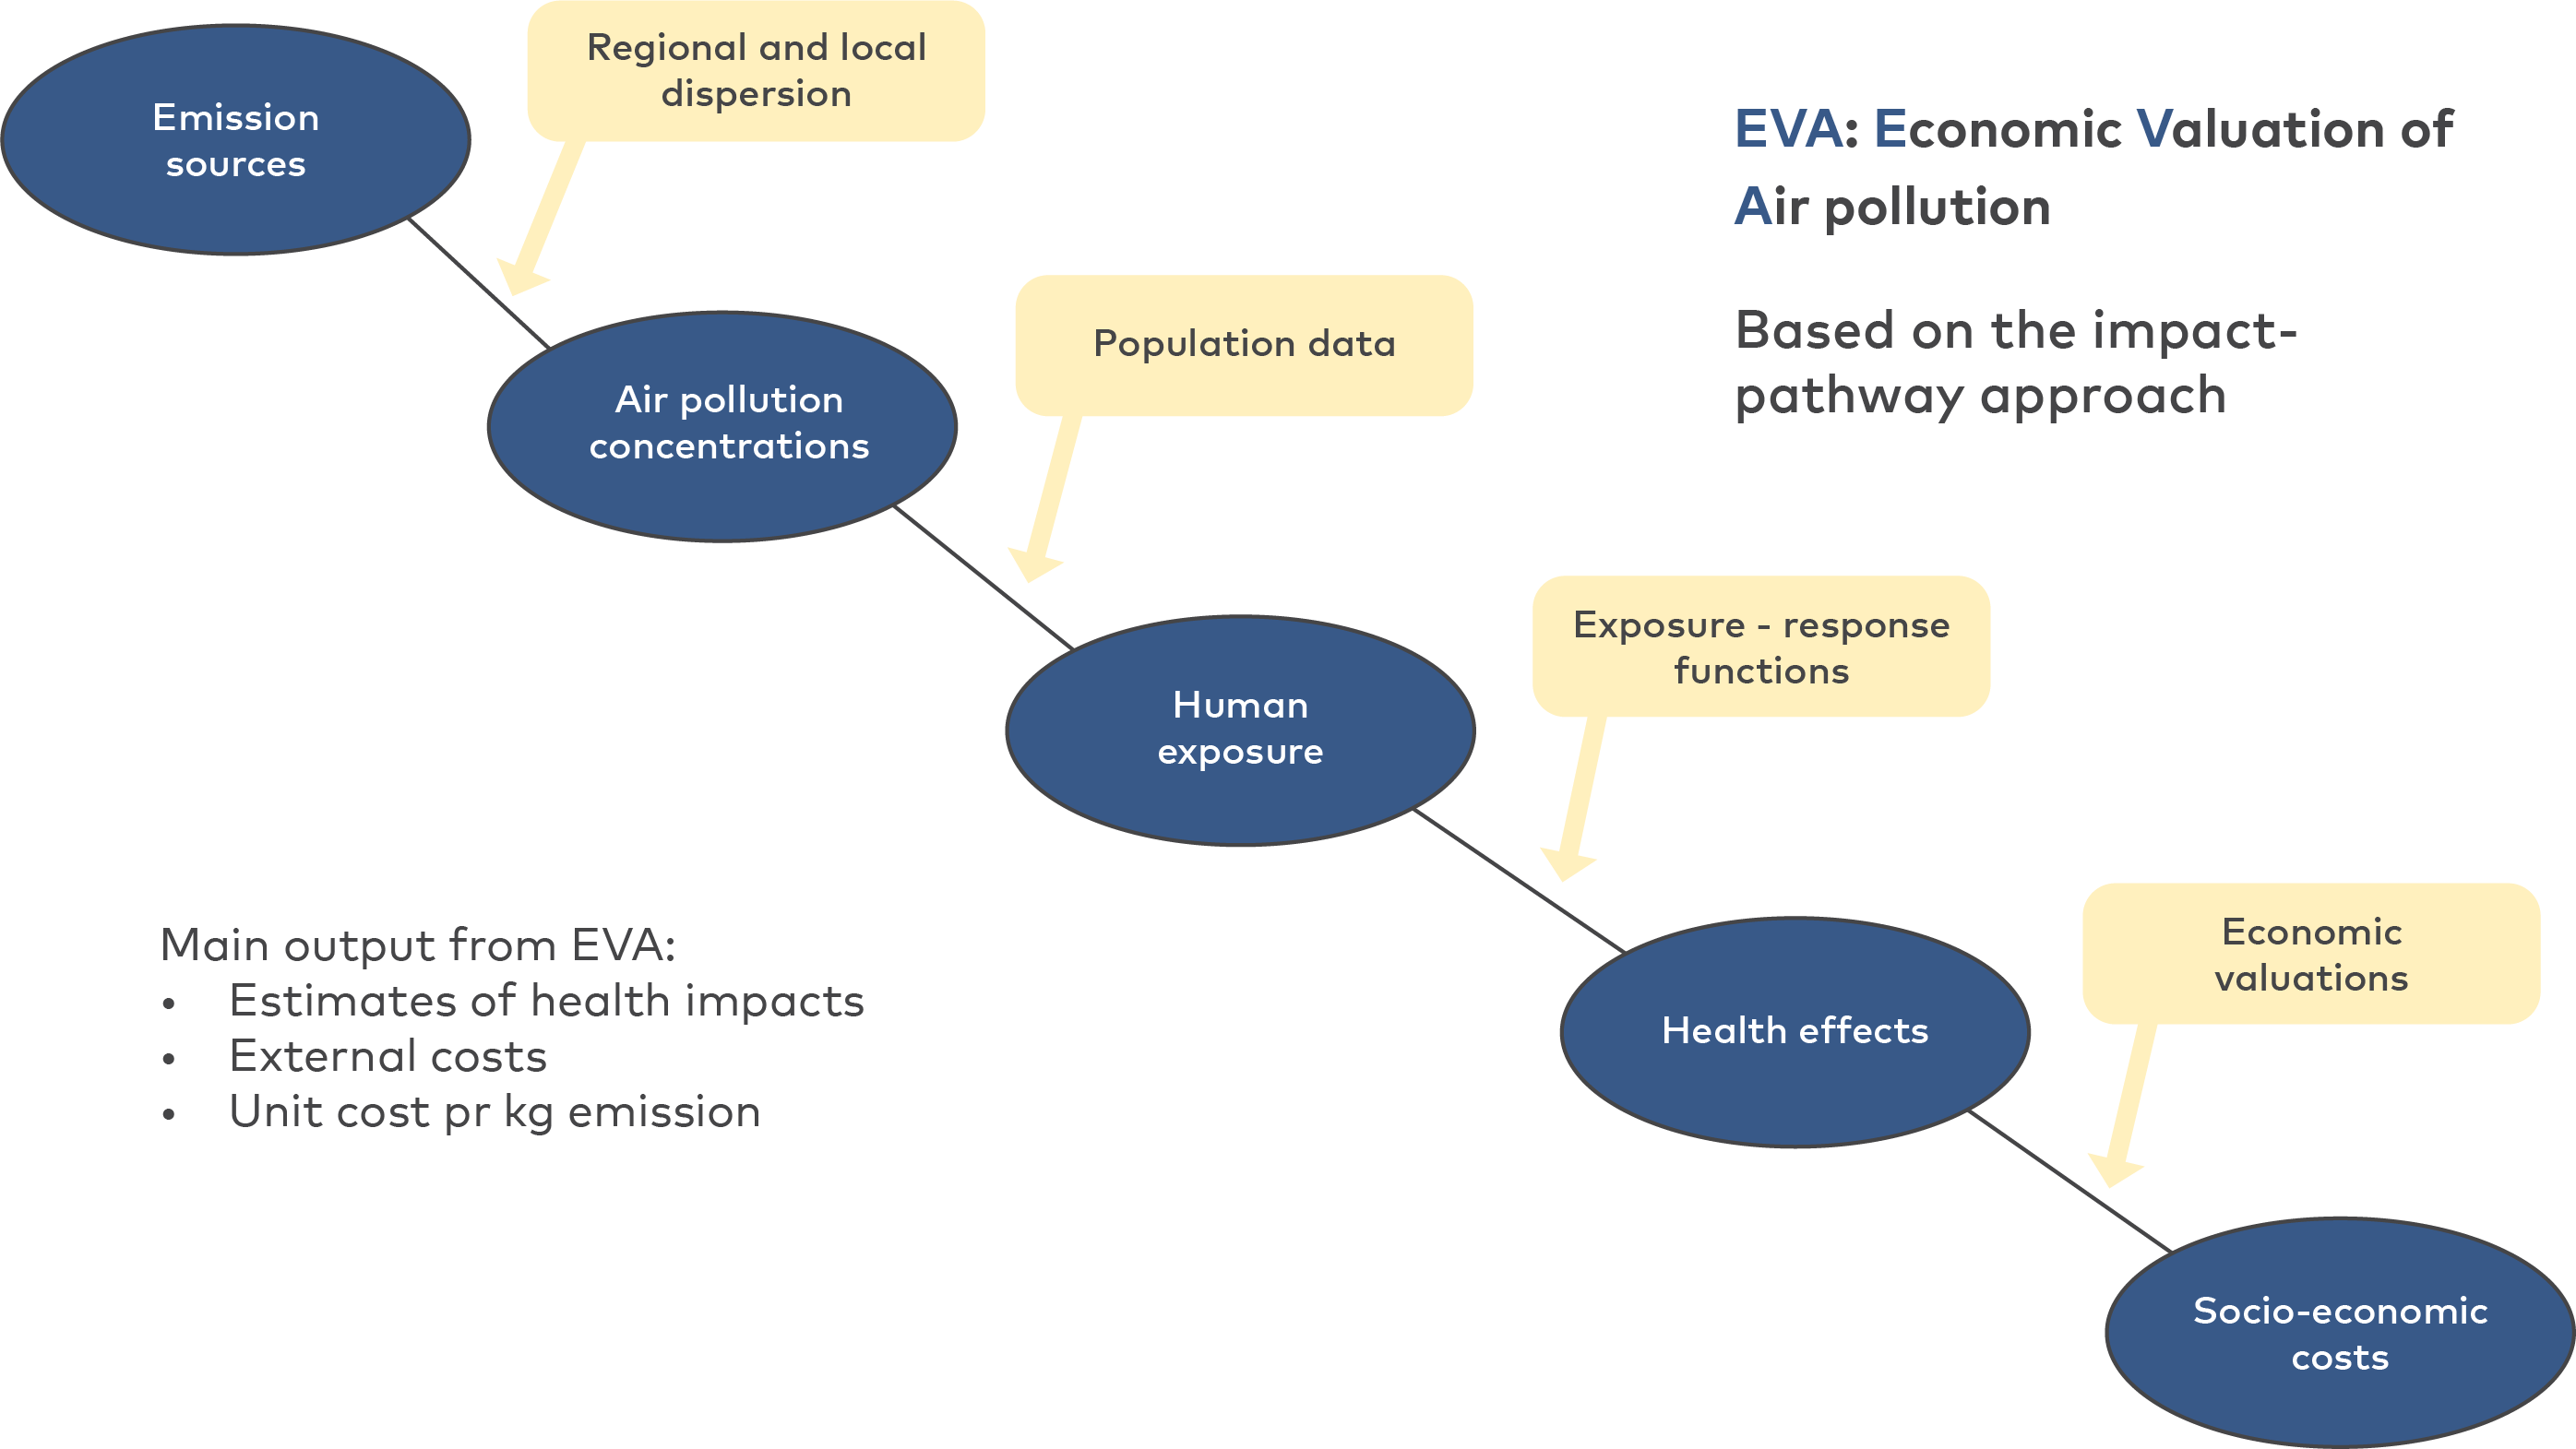
Figure 2.1. Illustration of the elements (yellow boxes) and data/results of the EVA-system (blue ovals).
The EVA model system can be used at different scales – e.g. for Europe based on DEHM, or for Denmark with high geographic resolution (1 km x 1 km) based on UBM.
The EVA-system is part of the Danish national air quality monitoring program, where annual estimates for health effects and related external costs of air pollution are carried out for Denmark. The EVA-system has also been applied to estimate the contributions of Nordic anthropogenic emissions to air pollution and premature mortality over the Nordic region and in the Arctic (Im et al., 2019) and it has been compared with other state-of-the-art assessment tools (Anenberg et al., 2016; Lehtomaki et al., 2020).
The EVA model system applies a set of standard costs for acute and chronic mortality, derived for Denmark (Andersen et al., 2019). To apply the EVA system for other countries, we transformed the costs data to represent other countries using the OECD benefit transfer methodology formula (OECD 2012: 138).
Population data for 2030 has been established for the Nordic countries based on data from Eurostat.
2.4 Selection of cities and model boundaries
A national expected average exposure concentration in 2030 for selected cities in the Nordic countries must be calculated. The task is to model the sector specific contribution to the air quality in 2030 as the total share of transboundary, country, and city pollution for the Nordic countries and for the selected cities.
Based on the number of inhabitants in the largest cities in the Nordic countries, cities were selected in each country to cover the largest cities, but also to have a good geographical coverage.
Model boundaries of cities and country
The definition of city boundaries is not trivial as it depends on what is considered to belong to the city.
To use a standardized approach across the Nordic countries, the geographic datasets that contain the boundaries of cities, greater cities and functional urban areas were used as defined according to the EC-OECD city definition and used for the Eurostat Urban Audit data collection. The data was used as GIS files downloaded from https://ec.europa.eu/eurostat/data/database. These datasets are used as the starting point for demarcation of the geographic extend of the city areas for each of the selected cities. The selected cities and model boundaries are described in chapter 3.
The country boundary is given by the borders of each Nordic country and the transboundary contribution is defined as everything arising from sources outside each country border.
Given these boundaries, the requested average exposure concentration can be calculated using the models described above and the share of the emission sectors’ contribution to the air pollution concentrations as well as to the health impacts and related external costs can be calculated by applying the EVA-system.
2.5 WHO AQG 2021
In chapter 4, there is a summary of the WHO AQG from 2005 and 2021 together with the air quality limit and target values of the present and proposed EU Air Quality Directive (from 2008 and 2022 respectively).
WHO has tightened their recommendations significantly from 2005 to 2021, based on the new knowledge and better documentation of the harmful effects of air pollution, especially at lower concentration levels as is the case in the Nordic countries (WHO 2006; 2021). The present EU limit values are significantly higher than the WHO guidelines in both 2005 and 2021 (EU, 2008).
In October 2022, the European Commission published proposals for revised air quality limit values in the draft revision of the Air Quality Directive (European Commission, 2022). This is a proposal and therefore not the final revised limit values. The final limit values will only be available once they have been negotiated and adopted by the European Parliament and the Council. The EU Commission's proposal for revised limit values is lower than the current limit values for 2008, but not as low as the WHO guidelines from 2021.
An important difference between the WHO guidelines and EU limit values is that WHO guidelines are recommendations and EU limit values are legally binding for the EU member states and the countries have to prepare action plans to comply within a reasonable time, if exceedances are observed.
The EU Air Quality Directive requires limit values to be complied with by certain years at the latest. The WHO guidelines do not operate with similar year of compliance, as they are recommendations, so there are no specific objectives that the guidelines should be complied with at specific years.
As the purpose of the project is to gain a better understanding of the implications of the new WHO guidelines in a Nordic setting, the following analysis will focus on comparison of model results with the new WHO guidelines from 2021.
2.6 Evaluation of air quality monitoring in Nordic countries
An analysis is carried out of available measurements in 2021 from rural, urban background and street stations in the selected cities and compared with the new WHO guidelines. This analysis gives an indication of the concentration contribution of the cities (difference between urban background and rural concentrations) and further the contributions of hotspots (difference between street concentrations and urban background concentrations). The latter complements the modelling activities that only include rural and urban back-ground concentrations.
Additionally, a comparison between measurement data from 2021 and the former and new WHO AQG is carried out for each of the Nordic countries where the maximum value of any measuring station within the country is compared with the WHO guidelines. This provides an overview of exceedances of the new WHO guidelines in the Nordic countries. Furthermore, it also describes how the exceedances have changed between the former and new WHO guidelines.
Further, the proposed new European air quality directive is described and the overall implications for the Nordic countries as well as general recommendations for the revision are outlined. National experts within air quality monitoring have been sub-contracted from Swedish Environmental Protection Agency (Sweden), NILU (Norway), FMI (Finland) and Environmental Agency of Iceland (Iceland) for the evaluation of the air quality monitoring.