Smoking, Snuff, Nicotine Pouches, and E-Cigarettes
Background
The use of tobacco and nicotine products —including smoking, snuff, nicotine pouches and e-cigarettes—poses serious risks to both health and environmental sustainability. Smoking is a leading cause of premature death and is associated with lung cancer, cardiovascular disease, stroke and respiratory disorders (WHO, 2025). Smokeless nicotine products and e-cigarettes, though often perceived as less harmful, still deliver addictive nicotine and toxic chemicals. Youth and young adults are especially vulnerable to nicotine addiction (Vestbo et al., 2022; U.S. Department of Health and Human Services, 2016). Environmental consequences include microplastic pollution from cigarette butts and used pouches, deforestation from tobacco farming, and biodiversity loss (WHO, 2022).
Analytical Notes
This chapter presents data on daily smoking, snuff, nicotine pouch and e-cigarette use (both with and without nicotine) among adults in the Nordic countries, as well as total nicotine product use. Note that in 2014, no countries assessed e-cigarette use and Denmark did not assess snuff use. “Smoking” refers to tobacco smoking.
Unless otherwise noted, all differences between specific groups (country, age, gender, education level) noted in the text and tables are statistically significant (p < 0.05), while comparisons to the Nordic average are qualitative.
Exact p-values can be found in the Appendix 5. For each analysis, all available observations with non-missing values for the specific variable being analyzed and the relevant grouping variable(s) were included. For variable-specific sample sizes, see Appendix 6. Exact values used in the figures are available in Appendix 7.
Background Analytical notes Key findings Results Discussion References |
Background
The use of tobacco and nicotine products —including smoking, snuff, nicotine pouches and e-cigarettes—poses serious risks to both health and environmental sustainability. Smoking is a leading cause of premature death and is associated with lung cancer, cardiovascular disease, stroke and respiratory disorders (WHO, 2025). Smokeless nicotine products and e-cigarettes, though often perceived as less harmful, still deliver addictive nicotine and toxic chemicals. Youth and young adults are especially vulnerable to nicotine addiction (Vestbo et al., 2022; U.S. Department of Health and Human Services, 2016). Environmental consequences include microplastic pollution from cigarette butts and used pouches, deforestation from tobacco farming, and biodiversity loss (WHO, 2022).
Analytical Notes
This chapter presents data on daily smoking, snuff, nicotine pouch and e-cigarette use (both with and without nicotine) among adults in the Nordic countries, as well as total nicotine product use. Note that in 2014, no countries assessed e-cigarette use and Denmark did not assess snuff use. “Smoking” refers to tobacco smoking.
Unless otherwise noted, all differences between specific groups (country, age, gender, education level) noted in the text and tables are statistically significant (p < 0.05), while comparisons to the Nordic average are qualitative.
Exact p-values can be found in the Appendix 5. For each analysis, all available observations with non-missing values for the specific variable being analyzed and the relevant grouping variable(s) were included. For variable-specific sample sizes, see Appendix 6. Exact values used in the figures are available in Appendix 7.
Key findings
Status 2024
- In 2024, nearly one in four adults in the Nordic Region used nicotine products daily, including smoking, snuff or nicotine pouches, and e-cigarettes.
- Daily smoking affected about one in ten adults, while daily snuff or pouch use was 14 % in the Nordic Region.
- Daily smoking was lower in Sweden than in Denmark and Finland and lower in Iceland than in Denmark.
- Snuff and pouch use was higher in Iceland, Norway, and Sweden, than in Denmark and Finland.
- E-cigarette use was relatively low (≈3 %), highest in Iceland.
Trends 2014–2024
- Daily smoking declined markedly across the Nordic Region—from ≈16 % to 10 %—with decreases in all countries except Sweden, where rates were already low.
- Daily use of snuff or nicotine pouches increased in Finland, Iceland, and Sweden, reflecting a regional shift from smoked to smokeless products.
- Nicotine use remained relatively stable, as declines in smoking were offset by rising snuff and pouch use.
Demographic patterns
Gender:
- Men were more likely than women to use snuff or nicotine pouches daily.
- Smoking and e-cigarette use showed no gender differences.
- Overall, total nicotine use was higher among men.
Age:
- Daily smoking increased with age and was highest among adults 45–65-year-olds.
- Snuff and pouch use was highest among young adults (18–29 years) and lowest in the oldest group.
- E-cigarette use showed no consistent age pattern.
Education:
- Daily smoking followed an inverse social gradient, decreasing as the level of education increased.
- Snuff, pouch, and e-cigarette use were also more common among those with low or medium levels of education than among those in the high education group.
- Consequently, total nicotine use was lowest among adults with higher levels of education in all countries.
Results
Nordic Region
Status 2024
In 2024, the overall prevalence of nicotine use (including daily smoking, snuff or nicotine pouch use, and e-cigarette use) was 23.7% in the Nordic Region. The highest proportions were observed in Norway (27.7%), Iceland (27.0%), and Sweden (25.7%).
Approximately one in ten adults in the Nordic Region reported daily smoking. The proportion of daily smoking was lower in Sweden than in Denmark and Finland, and lower in Iceland than in Denmark.
In 2024, 13.6% of adults reported daily use of snuff or nicotine pouches. Usage was higher in Iceland, Norway and Sweden compared with Denmark and Finland.
The daily use of e-cigarettes in 2024 was 2.8% across the region, with the highest prevalence in Iceland (7.1%), followed by Denmark (3.8%).
Trends 2014–2024
Between 2014 and 2024, the prevalence of daily tobacco smoking in the Nordic Region decreased significantly, from 15.6% to 9.9%. A similar downward trend was observed across all Nordic countries except Sweden, where smoking rates were already low.
Trend data for snuff and pouch use are incomplete, as Denmark did not collect these data in 2014, but statistically significant increases were observed in Finland, Iceland, and Sweden over the period.
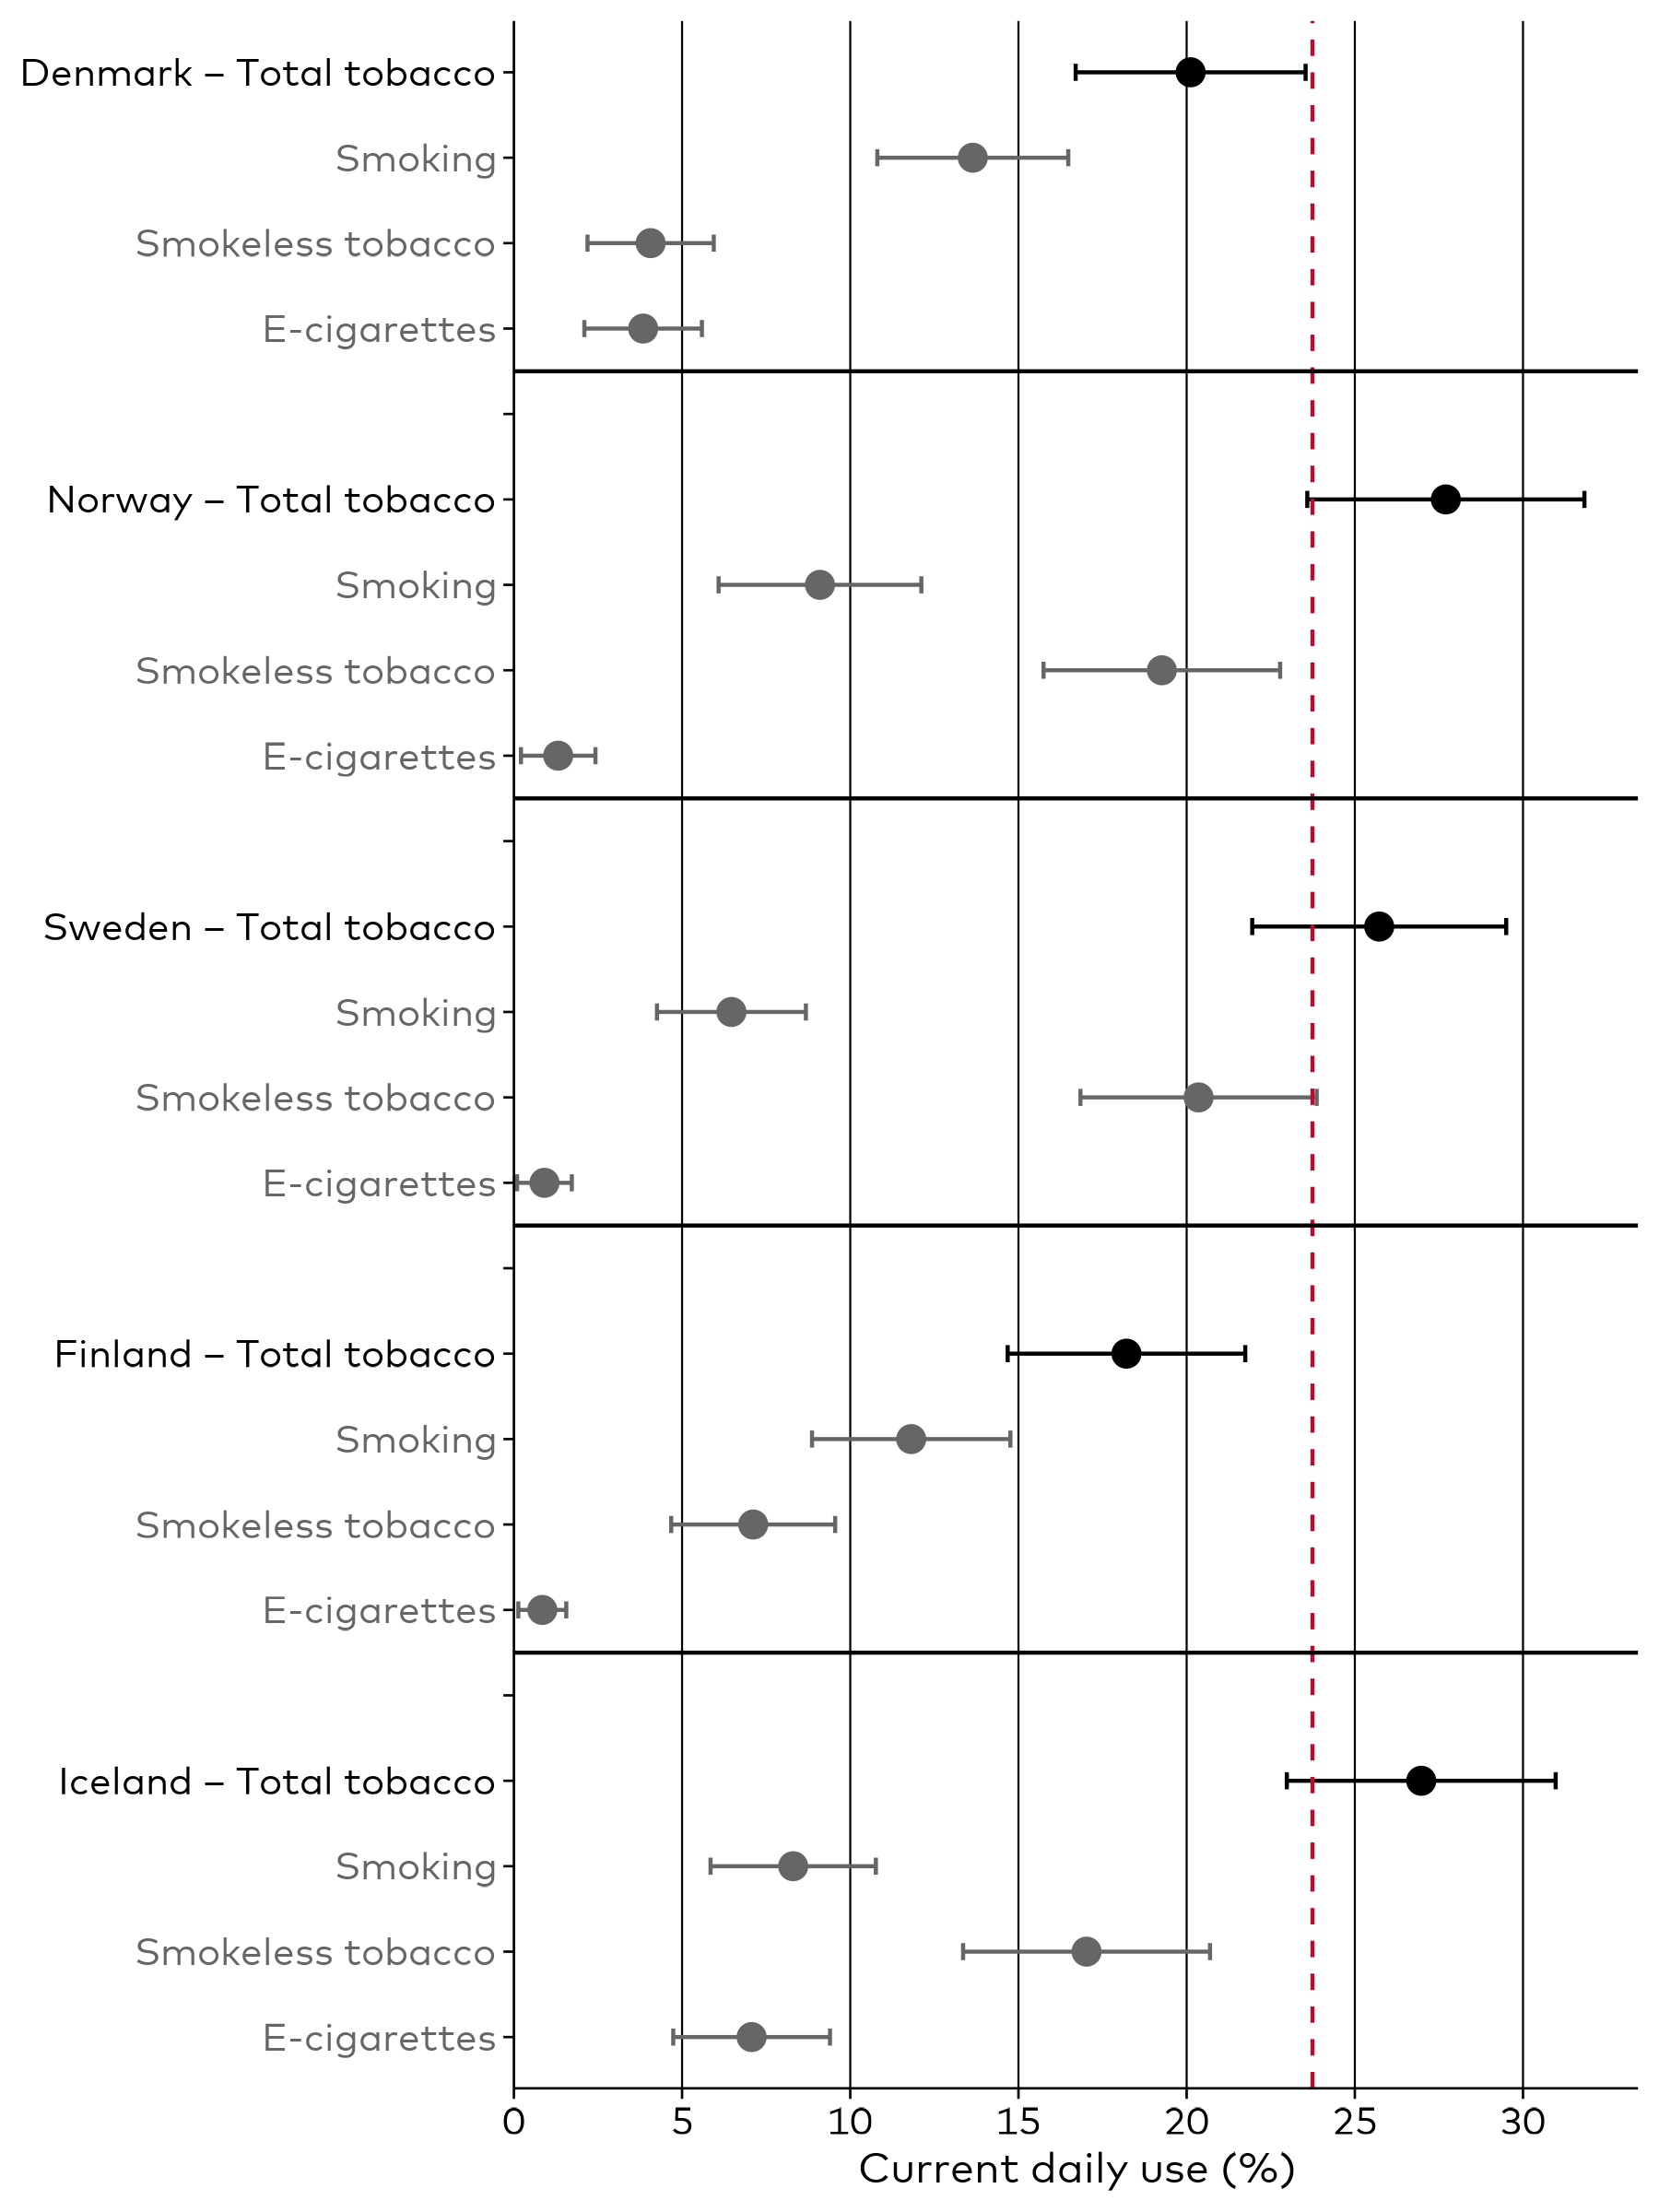
The dashed red line indicates the proportion of current daily users of any nicotine product (tobacco, smoking, smokeless nicotine containing products (snuff and nicotine pouches) and/or e-cigarettes) in the Nordic region.
Values to the left of the red line indicate lower proportion than the Nordic Average.
Each country contributes equally to the Nordic average.
N | 2008 | 1004 |
|---|---|---|
Current daily smoking, smokeless nicotine products, or e-cigarettes (%) | 20.1 (16.7; 23.5) | |
Current daily smoking (%) | 21.4 (19.1; 23.7) * | 13.6 (10.8; 16.5) * |
Current daily use of smokeless nicotine-containing product (%) | 4.1 (2.2; 5.9) | |
Current daily use of e-cigarettes (%) | 3.8 (2.1; 5.6) | |
Current daily smoking or smokeless nicotine products (%) | 17.4 (14.2; 20.6) |
* indicates statistically significant difference (p < 0.05) between survey years within a country or region.
Grey cells indicate values not collected and/or not valid for comparison.
N refers to the number of participants in that survey year in that country or region. See Appendix 6 for variable-specific sample sizes.
Grey cells indicate values not collected and/or not valid for comparison.
N refers to the number of participants in that survey year in that country or region. See Appendix 6 for variable-specific sample sizes.
N | 1057 | 1010 |
|---|---|---|
Current daily smoking, smokeless nicotine products, or e-cigarettes (%) | 30.1 (25.0; 35.2) | 27.7 (23.6; 31.8) |
Current daily smoking (%) | 14.2 (10.1; 18.3) * | 9.1 (6.1; 12.1) * |
Current daily use of smokeless nicotine-containing product (%) | 16.9 (12.4; 21.5) | 19.3 (15.8; 22.8) |
Current daily use of e-cigarettes (%) | 1.3 (0.2; 2.4) | |
Current daily smoking or smokeless nicotine products (%) | 30.1 (25.0; 35.2) | 27.3 (23.2; 31.4) |
* indicates statistically significant difference (p < 0.05) between survey years within a country or region.
Grey cells indicate values not collected and/or not valid for comparison.
N refers to the number of participants in that survey year in that country or region. See Appendix 6 for variable-specific sample sizes.
Grey cells indicate values not collected and/or not valid for comparison.
N refers to the number of participants in that survey year in that country or region. See Appendix 6 for variable-specific sample sizes.
N | 1801 | 999 |
|---|---|---|
Current daily smoking, smokeless nicotine products, or e-cigarettes (%) | 23.4 (20.5; 26.3) | 25.7 (22.0; 29.5) |
Current daily smoking (%) | 9.5 (7.1; 11.9) | 6.5 (4.3; 8.7) |
Current daily use of smokeless nicotine-containing product (%) | 14.8 (12.6; 17.0) * | 20.4 (16.8; 23.9) * |
Current daily use of e-cigarettes (%) | 0.9 (0.1; 1.7) | |
Current daily smoking or smokeless nicotine products (%) | 23.4 (20.5; 26.3) | 25.3 (21.5; 29.1) |
* indicates statistically significant difference (p < 0.05) between survey years within a country or region.
Grey cells indicate values not collected and/or not valid for comparison.
N refers to the number of participants in that survey year in that country or region. See Appendix 6 for variable-specific sample sizes.
Grey cells indicate values not collected and/or not valid for comparison.
N refers to the number of participants in that survey year in that country or region. See Appendix 6 for variable-specific sample sizes.
N | 1717 | 1020 |
|---|---|---|
Current daily smoking, smokeless nicotine products, or e-cigarettes (%) | 20.0 (17.7; 22.4) | 18.2 (14.7; 21.7) |
Current daily smoking (%) | 17.8 (15.6; 20.0) * | 11.8 (8.9; 14.8) * |
Current daily use of smokeless nicotine-containing product (%) | 2.1 (1.2; 3.1) * | 7.1 (4.7; 9.5) * |
Current daily use of e-cigarettes (%) | 0.8 (0.1; 1.6) | |
Current daily smoking or smokeless nicotine products (%) | 20.0 (17.7; 22.4) | 17.9 (14.4; 21.4) |
* indicates statistically significant difference (p < 0.05) between survey years within a country or region.
Grey cells indicate values not collected and/or not valid for comparison.
N refers to the number of participants in that survey year in that country or region. See Appendix 6 for variable-specific sample sizes.
Grey cells indicate values not collected and/or not valid for comparison.
N refers to the number of participants in that survey year in that country or region. See Appendix 6 for variable-specific sample sizes.
N | 2012 | 1021 |
|---|---|---|
Current daily smoking, smokeless nicotine products, or e-cigarettes (%) | 20.7 (18.3; 23.1) * | 27.0 (23.0; 31.0) * |
Current daily smoking (%) | 15.2 (13.1; 17.3) * | 8.3 (5.8; 10.8) * |
Current daily use of smokeless nicotine-containing product (%) | 5.7 (4.2; 7.3) * | 17.0 (13.4; 20.7) * |
Current daily use of e-cigarettes (%) | 7.1 (4.7; 9.4) | |
Current daily smoking or smokeless nicotine products (%) | 20.7 (18.3; 23.1) | 23.4 (19.5; 27.4) |
* indicates statistically significant difference (p < 0.05) between survey years within a country or region.
Grey cells indicate values not collected and/or not valid for comparison.
N refers to the number of participants in that survey year in that country or region. See Appendix 6 for variable-specific sample sizes.
Grey cells indicate values not collected and/or not valid for comparison.
N refers to the number of participants in that survey year in that country or region. See Appendix 6 for variable-specific sample sizes.
N | 8595 | 5054 |
|---|---|---|
Current daily smoking, smokeless nicotine products, or e-cigarettes (%) | 23.7 (22.0; 25.4) | |
Current daily smoking (%) | 15.6 (14.4; 16.8) * | 9.9 (8.7; 11.1) * |
Current daily use of smokeless nicotine-containing product (%) | 13.6 (12.1; 15.0) * | |
Current daily use of e-cigarettes (%) | 2.8 (2.1; 3.5) | |
Current daily smoking or smokeless nicotine products (%) | 22.3 (20.6; 23.9) |
* indicates statistically significant difference (p < 0.05) between survey years within a country or region.
Grey cells indicate values not collected and/or not valid for comparison.
N refers to the number of participants in that survey year in that country or region. See Appendix 6 for variable-specific sample sizes.
Grey cells indicate values not collected and/or not valid for comparison.
N refers to the number of participants in that survey year in that country or region. See Appendix 6 for variable-specific sample sizes.
Demographic Differences
Gender
In the Nordic Region, and within each of the five Nordic countries, the proportion of people smoking daily was similar between men and women in 2024.
However, daily use of snuff or nicotine pouches was considerably higher among men (19.8%) than among women (6.8%)—a consistent pattern observed across all countries. Daily use was nearly 2.5 times higher among men in Norway and Sweden, and almost three times higher in Iceland. In Denmark and Finland, about 1% of women reported daily use of these products.
There were no statistically significant gender differences in e-cigarette use.
When considering total nicotine use, the overall prevalence was higher among men than women across the Nordic Region and in each country.
N | 482 | 522 |
|---|---|---|
Current daily smoking, smokeless nicotine products, or e-cigarettes (%) | 24.9 (19.7; 30.1) * | 15.3 (10.9; 19.7) * |
Current daily smoking (%) | 15.7 (11.3; 20.1) | 11.6 (8.0; 15.1) |
Current daily use of smokeless nicotine-containing product (%) | 7.0 (3.8; 10.3) * | 1.0 (-0.7; 2.8) * |
Current daily use of e-cigarettes (%) | 3.6 (1.6; 5.7) | 4.0 (1.2; 6.9) |
Current daily smoking or smokeless nicotine products (%) | 22.3 (17.2; 27.3) * | 12.5 (8.6; 16.3) * |
* indicates statistically significant difference (p < 0.05) between survey years within a country or region.
N refers to the number of participants in that survey year in that country or region. See Appendix 6 for variable-specific sample sizes.
N refers to the number of participants in that survey year in that country or region. See Appendix 6 for variable-specific sample sizes.
N | 499 | 511 |
|---|---|---|
Current daily smoking, smokeless nicotine products, or e-cigarettes (%) | 33.3 (27.4; 39.1) * | 22.0 (16.2; 27.7) * |
Current daily smoking (%) | 7.2 (3.9; 10.5) | 11.1 (6.1; 16.1) |
Current daily use of smokeless nicotine-containing product (%) | 27.4 (21.9; 33.0) * | 10.9 (7.0; 14.7) * |
Current daily use of e-cigarettes (%) | 0.8 (0.1; 1.6) | 1.8 (-0.3; 3.9) |
Current daily smoking or smokeless nicotine products (%) | 32.6 (26.7; 38.4) * | 21.8 (16.0; 27.6) * |
* indicates statistically significant difference (p < 0.05) between survey years within a country or region.
N refers to the number of participants in that survey year in that country or region. See Appendix 6 for variable-specific sample sizes.
N refers to the number of participants in that survey year in that country or region. See Appendix 6 for variable-specific sample sizes.
N | 463 | 536 |
|---|---|---|
Current daily smoking, smokeless nicotine products, or e-cigarettes (%) | 32.4 (26.5; 38.2) * | 18.8 (14.2; 23.4) * |
Current daily smoking (%) | 4.8 (2.0; 7.6) | 8.2 (4.8; 11.7) |
Current daily use of smokeless nicotine-containing product (%) | 28.1 (22.5; 33.7) * | 12.3 (8.4; 16.2) * |
Current daily use of e-cigarettes (%) | 0.5 (-0.0; 1.0) | 1.3 (-0.2; 2.9) |
Current daily smoking or smokeless nicotine products (%) | 31.9 (26.1; 37.7) * | 18.4 (13.8; 22.9) * |
* indicates statistically significant difference (p < 0.05) between survey years within a country or region.
N refers to the number of participants in that survey year in that country or region. See Appendix 6 for variable-specific sample sizes.
N refers to the number of participants in that survey year in that country or region. See Appendix 6 for variable-specific sample sizes.
N | 480 | 540 |
|---|---|---|
Current daily smoking, smokeless nicotine products, or e-cigarettes (%) | 23.4 (18.0; 28.8) * | 12.0 (7.8; 16.1) * |
Current daily smoking (%) | 12.8 (8.5; 17.0) | 10.7 (6.6; 14.7) |
Current daily use of smokeless nicotine-containing product (%) | 12.0 (7.8; 16.3) * | 1.2 (-0.1; 2.4) * |
Current daily use of e-cigarettes (%) | 0.6 (0.0; 1.3) | 1.1 (-0.3; 2.5) |
Current daily smoking or smokeless nicotine products (%) | 23.3 (17.9; 28.7) * | 11.5 (7.3; 15.6) * |
* indicates statistically significant difference (p < 0.05) between survey years within a country or region.
N refers to the number of participants in that survey year in that country or region. See Appendix 6 for variable-specific sample sizes.
N refers to the number of participants in that survey year in that country or region. See Appendix 6 for variable-specific sample sizes.
N | 439 | 582 |
|---|---|---|
Current daily smoking, smokeless nicotine products, or e-cigarettes (%) | 32.4 (26.5; 38.2) * | 21.1 (15.9; 26.4) * |
Current daily smoking (%) | 7.9 (4.3; 11.5) | 8.7 (5.4; 12.1) |
Current daily use of smokeless nicotine-containing product (%) | 24.9 (19.2; 30.6) * | 8.5 (4.2; 12.7) * |
Current daily use of e-cigarettes (%) | 6.3 (3.3; 9.3) | 7.9 (4.3; 11.5) |
Current daily smoking or smokeless nicotine products (%) | 29.2 (23.3; 35.0) * | 17.2 (12.2; 22.3) * |
* indicates statistically significant difference (p < 0.05) between survey years within a country or region.
N refers to the number of participants in that survey year in that country or region. See Appendix 6 for variable-specific sample sizes.
N refers to the number of participants in that survey year in that country or region. See Appendix 6 for variable-specific sample sizes.
N | 2363 | 2691 |
|---|---|---|
Current daily smoking, smokeless nicotine products, or e-cigarettes (%) | 29.2 (26.6; 31.7) * | 17.9 (15.7; 20.1) * |
Current daily smoking (%) | 9.7 (8.0; 11.4) | 10.1 (8.3; 11.8) |
Current daily use of smokeless nicotine-containing product (%) | 19.8 (17.5; 22.1) * | 6.8 (5.3; 8.3) * |
Current daily use of e-cigarettes (%) | 2.4 (1.6; 3.2) | 3.2 (2.1; 4.4) |
Current daily smoking or smokeless nicotine products (%) | 27.8 (25.3; 30.3) * | 16.3 (14.2; 18.5) * |
* indicates statistically significant difference (p < 0.05) between survey years within a country or region.
N refers to the number of participants in that survey year in that country or region. See Appendix 6 for variable-specific sample sizes.
N refers to the number of participants in that survey year in that country or region. See Appendix 6 for variable-specific sample sizes.
Age
In the Nordic Region, daily smoking increased with age, reaching 13.5% among adults 45–65-year-olds. A similar pattern was observed in Denmark, Finland, and Norway. In contrast, daily use of snuff or nicotine pouches decreased with age—most common among 18–29-year-olds (22.6%) and lowest among 45–65-year-olds (8%)—a trend consistent across all countries.
There were no statistically significant age-related differences in daily e-cigarette use in the Nordic Region or in any of the five Nordic countries.
When considering total nicotine use, no age differences were observed regionally, although in Iceland, total nicotine use decreased with age.
N | 115 | 248 | 641 |
|---|---|---|---|
Current daily smoking, smokeless nicotine products, or e-cigarettes (%) | 22.9 (14.6; 31.3) | 18.1 (12.3; 23.9) | 19.9 (15.3; 24.4) |
Current daily smoking (%) | 5.5 (1.5; 9.5) [b] | 13.5 (8.3; 18.8) [a] | 18.3 (13.8; 22.9) [a] |
Current daily use of smokeless nicotine-containing product (%) | 12.4 (5.9; 18.9) [b] | 2.5 (-0.1; 5.0) [a] | 0.4 (-0.0; 0.9) [a] |
Current daily use of e-cigarettes (%) | 7.4 (1.8; 13.1) | 2.5 (0.5; 4.6) | 2.7 (1.0; 4.4) |
Current daily smoking or smokeless nicotine products (%) | 17.1 (9.9; 24.3) | 16.0 (10.4; 21.7) | 18.5 (14.0; 23.1) |
Different letters (a, b, c) indicate statistically significant difference (p < 0.05) between age groups within a country or region after a statistically significant global test (p < 0.05).
No Letters (a, b, c) indicate no statistically significant difference (p >= 0.05) between age groups within a country or region and/or no statistically significant global test (p >= 0.05).
N refers to the number of participants with the age group in that country or region. See Appendix 6 for variable-specific sample sizes.
N | 121 | 245 | 644 |
|---|---|---|---|
Current daily smoking, smokeless nicotine products, or e-cigarettes (%) | 27.1 (17.7; 36.5) | 26.6 (20.3; 32.9) | 28.6 (22.4; 34.8) |
Current daily smoking (%) | 3.3 (0.1; 6.5) [b] | 5.7 (2.6; 8.8) [b] | 13.5 (8.1; 18.9) [a] |
Current daily use of smokeless nicotine-containing product (%) | 26.1 (16.8; 35.4) [a] | 21.8 (15.9; 27.8) [a] | 14.9 (10.2; 19.6) [a] |
Current daily use of e-cigarettes (%) | -0.0 (-0.0; 0.0) | 0.5 (-0.5; 1.4) | 2.4 (0.2; 4.5) |
Current daily smoking or smokeless nicotine products (%) | 27.1 (17.7; 36.5) | 26.1 (19.9; 32.3) | 28.0 (21.8; 34.2) |
Different letters (a, b, c) indicate statistically significant difference (p < 0.05) between age groups within a country or region after a statistically significant global test (p < 0.05).
No Letters (a, b, c) indicate no statistically significant difference (p >= 0.05) between age groups within a country or region and/or no statistically significant global test (p >= 0.05).
N refers to the number of participants with the age group in that country or region. See Appendix 6 for variable-specific sample sizes.
No Letters (a, b, c) indicate no statistically significant difference (p >= 0.05) between age groups within a country or region and/or no statistically significant global test (p >= 0.05).
N refers to the number of participants with the age group in that country or region. See Appendix 6 for variable-specific sample sizes.
N | 78 | 335 | 586 |
|---|---|---|---|
Current daily smoking, smokeless nicotine products, or e-cigarettes (%) | 29.7 (18.8; 40.5) | 27.1 (21.8; 32.4) | 22.5 (17.5; 27.5) |
Current daily smoking (%) | 4.9 (-0.9; 10.6) | 6.3 (3.0; 9.5) | 7.5 (4.2; 10.7) |
Current daily use of smokeless nicotine-containing product (%) | 26.0 (15.7; 36.4) [a] | 22.9 (17.8; 28.0) [a] | 15.3 (11.0; 19.6) [a] |
Current daily use of e-cigarettes (%) | -0.0 (-0.0; 0.0) | 0.6 (-0.2; 1.5) | 1.6 (-0.1; 3.4) |
Current daily smoking or smokeless nicotine products (%) | 29.7 (18.8; 40.5) | 26.5 (21.2; 31.8) | 22.0 (17.0; 27.0) |
Different letters (a, b, c) indicate statistically significant difference (p < 0.05) between age groups within a country or region after a statistically significant global test (p < 0.05).
No Letters (a, b, c) indicate no statistically significant difference (p >= 0.05) between age groups within a country or region and/or no statistically significant global test (p >= 0.05).
N refers to the number of participants with the age group in that country or region. See Appendix 6 for variable-specific sample sizes.
No Letters (a, b, c) indicate no statistically significant difference (p >= 0.05) between age groups within a country or region and/or no statistically significant global test (p >= 0.05).
N refers to the number of participants with the age group in that country or region. See Appendix 6 for variable-specific sample sizes.
N | 71 | 248 | 701 |
|---|---|---|---|
Current daily smoking, smokeless nicotine products, or e-cigarettes (%) | 12.5 (4.0; 21.1) | 19.0 (14.0; 24.0) | 20.5 (14.9; 26.2) |
Current daily smoking (%) | 2.5 (-0.9; 5.8) [b] | 9.8 (6.0; 13.6) [c] | 18.5 (12.9; 24.2) [a] |
Current daily use of smokeless nicotine-containing product (%) | 10.1 (2.0; 18.1) [ab] | 9.7 (5.9; 13.5) [b] | 3.3 (1.1; 5.5) [a] |
Current daily use of e-cigarettes (%) | 1.2 (-1.2; 3.6) | 0.8 (-0.3; 2.0) | 0.7 (0.1; 1.2) |
Current daily smoking or smokeless nicotine products (%) | 12.5 (4.0; 21.1) | 18.5 (13.6; 23.5) | 20.2 (14.6; 25.9) |
Different letters (a, b, c) indicate statistically significant difference (p < 0.05) between age groups within a country or region after a statistically significant global test (p < 0.05).
No Letters (a, b, c) indicate no statistically significant difference (p >= 0.05) between age groups within a country or region and/or no statistically significant global test (p >= 0.05).
N refers to the number of participants with the age group in that country or region. See Appendix 6 for variable-specific sample sizes.
No Letters (a, b, c) indicate no statistically significant difference (p >= 0.05) between age groups within a country or region and/or no statistically significant global test (p >= 0.05).
N refers to the number of participants with the age group in that country or region. See Appendix 6 for variable-specific sample sizes.
N | 86 | 307 | 628 |
|---|---|---|---|
Current daily smoking, smokeless nicotine products, or e-cigarettes (%) | 42.9 (32.1; 53.7) [b] | 25.7 (20.1; 31.3) [c] | 17.3 (13.1; 21.4) [a] |
Current daily smoking (%) | 7.8 (1.7; 13.9) | 7.4 (3.6; 11.3) | 9.4 (6.1; 12.7) |
Current daily use of smokeless nicotine-containing product (%) | 37.0 (26.3; 47.7) [b] | 15.6 (11.0; 20.3) [c] | 4.7 (2.5; 7.0) [a] |
Current daily use of e-cigarettes (%) | 10.0 (3.3; 16.7) | 7.4 (4.0; 10.9) | 4.8 (2.4; 7.1) |
Current daily smoking or smokeless nicotine products (%) | 40.6 (29.8; 51.4) [b] | 21.4 (16.0; 26.7) [a] | 13.6 (9.9; 17.4) [a] |
Different letters (a, b, c) indicate statistically significant difference (p < 0.05) between age groups within a country or region after a statistically significant global test (p < 0.05).
No Letters (a, b, c) indicate no statistically significant difference (p >= 0.05) between age groups within a country or region and/or no statistically significant global test (p >= 0.05).
N refers to the number of participants with the age group in that country or region. See Appendix 6 for variable-specific sample sizes.
No Letters (a, b, c) indicate no statistically significant difference (p >= 0.05) between age groups within a country or region and/or no statistically significant global test (p >= 0.05).
N refers to the number of participants with the age group in that country or region. See Appendix 6 for variable-specific sample sizes.
N | 471 | 1383 | 3200 |
|---|---|---|---|
Current daily smoking, smokeless nicotine products, or e-cigarettes (%) | 27.5 (23.0; 32.0) | 23.3 (20.8; 25.8) | 22.1 (19.7; 24.5) |
Current daily smoking (%) | 4.9 (2.8; 7.1) [b] | 8.5 (6.8; 10.3) [c] | 13.5 (11.4; 15.6) [a] |
Current daily use of smokeless nicotine-containing product (%) | 22.6 (18.3; 26.8) [b] | 14.5 (12.4; 16.6) [c] | 8.0 (6.4; 9.5) [a] |
Current daily use of e-cigarettes (%) | 4.1 (2.0; 6.1) | 2.4 (1.5; 3.4) | 2.4 (1.6; 3.2) |
Current daily smoking or smokeless nicotine products (%) | 25.8 (21.4; 30.2) | 21.6 (19.2; 24.1) | 20.8 (18.5; 23.2) |
Different letters (a, b, c) indicate statistically significant difference (p < 0.05) between age groups within a country or region after a statistically significant global test (p < 0.05).
No Letters (a, b, c) indicate no statistically significant difference (p >= 0.05) between age groups within a country or region and/or no statistically significant global test (p >= 0.05).
N refers to the number of participants with the age group in that country or region. See Appendix 6 for variable-specific sample sizes.
No Letters (a, b, c) indicate no statistically significant difference (p >= 0.05) between age groups within a country or region and/or no statistically significant global test (p >= 0.05).
N refers to the number of participants with the age group in that country or region. See Appendix 6 for variable-specific sample sizes.
Education
Daily tobacco smoking was less common among adults with a high level of education, and this pattern was consistent across all Nordic countries.
The daily use of snuff or nicotine pouches was also lowest among adults with a high level of education in the Nordic Region, as well as in Sweden and Iceland.
For e-cigarettes, the lowest prevalence was found among adults with a high level of education in the Nordic Region. The same could not be observed in the five Nordic countries. In Denmark, daily e-cigarette use was slightly higher among those with a medium level of education than among those with a high level of education.
When considering total nicotine use, adults with a higher level of education generally reported lower use across all Nordic countries.
N | 55 | 367 | 578 |
|---|---|---|---|
Current daily smoking, smokeless nicotine products, or e-cigarettes (%) | 35.5 (22.8; 48.3) [b] | 21.2 (16.6; 25.9) [b] | 10.7 (7.8; 13.6) [a] |
Current daily smoking (%) | 26.6 (15.1; 38.0) [b] | 13.5 (9.9; 17.2) [b] | 7.5 (5.1; 9.8) [a] |
Current daily use of smokeless nicotine-containing product (%) | 6.6 (-0.6; 13.7) | 4.5 (1.7; 7.3) | 2.6 (0.8; 4.4) |
Current daily use of e-cigarettes (%) | 4.0 (-1.5; 9.6) [ab] | 5.9 (3.1; 8.6) [b] | 0.7 (0.0; 1.4) [a] |
Current daily smoking or smokeless nicotine products (%) | 33.1 (20.7; 45.6) [b] | 17.3 (13.0; 21.6) [c] | 10.1 (7.2; 12.9) [a] |
Different letters (a, b, c) indicate statistically significant difference (p < 0.05) between education levels within a country or region after a statistically significant global test (p < 0.05).
No Letters (a, b, c) indicate no statistically significant difference (p ≥ 0.05) between education levels within a country or region and/or no statistically significant global test (p ≥ 0.05).
N refers to the number of participants with the education level in that country or region. See Appendix 6 for variable-specific sample sizes.
N | 31 | 338 | 637 |
|---|---|---|---|
Current daily smoking, smokeless nicotine products, or e-cigarettes (%) | 41.8 (24.4; 59.3) [b] | 28.1 (22.9; 33.2) [b] | 19.8 (16.2; 23.4) [a] |
Current daily smoking (%) | 22.1 (7.5; 36.6) [b] | 9.3 (6.0; 12.5) [b] | 3.3 (1.9; 4.7) [a] |
Current daily use of smokeless nicotine-containing product (%) | 19.8 (5.6; 34.0) | 20.0 (15.3; 24.7) | 17.0 (13.5; 20.5) |
Current daily use of e-cigarettes (%) | 3.0 (-2.8; 8.9) | 1.4 (0.2; 2.5) | 0.7 (0.0; 1.4) |
Current daily smoking or smokeless nicotine products (%) | 41.8 (24.4; 59.3) [b] | 26.9 (21.8; 32.0) [ab] | 19.8 (16.2; 23.4) [a] |
Different letters (a, b, c) indicate statistically significant difference (p < 0.05) between education levels within a country or region after a statistically significant global test (p < 0.05).
No Letters (a, b, c) indicate no statistically significant difference (p ≥ 0.05) between education levels within a country or region and/or no statistically significant global test (p ≥ 0.05).
N refers to the number of participants with the education level in that country or region. See Appendix 6 for variable-specific sample sizes.
No Letters (a, b, c) indicate no statistically significant difference (p ≥ 0.05) between education levels within a country or region and/or no statistically significant global test (p ≥ 0.05).
N refers to the number of participants with the education level in that country or region. See Appendix 6 for variable-specific sample sizes.
N | 32 | 377 | 585 |
|---|---|---|---|
Current daily smoking, smokeless nicotine products, or e-cigarettes (%) | 45.7 (28.0; 63.3) [b] | 29.3 (23.8; 34.8) [b] | 17.6 (14.0; 21.2) [a] |
Current daily smoking (%) | 16.2 (3.0; 29.5) [a] | 7.0 (4.4; 9.6) [a] | 3.4 (1.6; 5.1) [a] |
Current daily use of smokeless nicotine-containing product (%) | 32.6 (15.9; 49.3) [ab] | 23.6 (18.3; 29.0) [b] | 14.5 (11.2; 17.8) [a] |
Current daily use of e-cigarettes (%) | 2.8 (-2.7; 8.3) | 0.6 (-0.1; 1.4) | 0.6 (0.1; 1.2) |
Current daily smoking or smokeless nicotine products (%) | 45.7 (28.0; 63.3) [b] | 28.8 (23.4; 34.3) [b] | 17.0 (13.5; 20.6) [a] |
Different letters (a, b, c) indicate statistically significant difference (p < 0.05) between education levels within a country or region after a statistically significant global test (p < 0.05).
No Letters (a, b, c) indicate no statistically significant difference (p >≥0.05) between education levels within a country or region and/or no statistically significant global test (p ≥ 0.05).
N refers to the number of participants with the education level in that country or region. See Appendix 6 for variable-specific sample sizes.
N | 34 | 434 | 550 |
|---|---|---|---|
Current daily smoking, smokeless nicotine products, or e-cigarettes (%) | 32.2 (16.3; 48.1) [b] | 20.6 (16.0; 25.2) [b] | 10.4 (6.9; 13.9) [a] |
Current daily smoking (%) | 27.7 (12.9; 42.6) [b] | 11.8 (8.6; 15.0) [b] | 6.0 (3.3; 8.8) [a] |
Current daily use of smokeless nicotine-containing product (%) | 7.2 (-2.6; 17.0) | 9.5 (5.8; 13.3) | 4.4 (2.1; 6.7) |
Current daily use of e-cigarettes (%) | 0.0 (0.0; 0.0) | 0.8 (-0.1; 1.6) | 1.3 (-0.3; 2.8) |
Current daily smoking or smokeless nicotine products (%) | 32.2 (16.3; 48.1) [b] | 20.1 (15.6; 24.7) [b] | 10.3 (6.8; 13.8) [a] |
Different letters (a, b, c) indicate statistically significant difference (p < 0.05) between education levels within a country or region after a statistically significant global test (p < 0.05).
No Letters (a, b, c) indicate no statistically significant difference (p ≥ 0.05) between education levels within a country or region and/or no statistically significant global test (p ≥ 0.05).
N refers to the number of participants with the education level in that country or region. See Appendix 6 for variable-specific sample sizes.
N | 118 | 313 | 585 |
|---|---|---|---|
Current daily smoking, smokeless nicotine products, or e-cigarettes (%) | 42.3 (32.5; 52.1) [b] | 27.1 (20.9; 33.2) [c] | 14.7 (10.6; 18.8) [a] |
Current daily smoking (%) | 16.4 (9.3; 23.4) [b] | 5.5 (2.8; 8.2) [a] | 3.8 (1.5; 6.0) [a] |
Current daily use of smokeless nicotine-containing product (%) | 26.3 (16.8; 35.8) [b] | 16.3 (10.7; 21.8) [ab] | 10.3 (6.6; 14.0) [a] |
Current daily use of e-cigarettes (%) | 9.3 (3.5; 15.2) | 7.3 (3.7; 10.8) | 4.2 (1.8; 6.7) |
Current daily smoking or smokeless nicotine products (%) | 38.6 (28.8; 48.4) [b] | 21.8 (15.9; 27.6) [c] | 13.0 (9.0; 17.0) [a] |
Different letters (a, b, c) indicate statistically significant difference (p < 0.05) between education levels within a country or region after a statistically significant global test (p < 0.05).
No Letters (a, b, c) indicate no statistically significant difference (p ≥ 0.05) between education levels within a country or region and/or no statistically significant global test (p ≥ 0.05).
N refers to the number of participants with the education level in that country or region. See Appendix 6 for variable-specific sample sizes.
No Letters (a, b, c) indicate no statistically significant difference (p ≥ 0.05) between education levels within a country or region and/or no statistically significant global test (p ≥ 0.05).
N refers to the number of participants with the education level in that country or region. See Appendix 6 for variable-specific sample sizes.
N | 270 | 1829 | 2935 |
|---|---|---|---|
Current daily smoking, smokeless nicotine products, or e-cigarettes (%) | 39.6 (33.3; 45.9) [b] | 25.1 (22.8; 27.4) [c] | 14.8 (13.2; 16.4) [a] |
Current daily smoking (%) | 21.4 (16.2; 26.6) [b] | 9.5 (8.1; 10.9) [c] | 4.7 (3.8; 5.7) [a] |
Current daily use of smokeless nicotine-containing product (%) | 18.8 (13.5; 24.0) [b] | 14.6 (12.6; 16.7) [b] | 10.0 (8.6; 11.3) [a] |
Current daily use of e-cigarettes (%) | 4.6 (2.1; 7.1) [b] | 3.0 (2.1; 4.0) [b] | 1.4 (0.8; 2.0) [a] |
Current daily smoking or smokeless nicotine products (%) | 38.0 (31.7; 44.3) [b] | 22.9 (20.7; 25.2) [c] | 14.2 (12.6; 15.8) [a] |
Different letters (a, b, c) indicate statistically significant difference (p < 0.05) between education levels within a country or region after a statistically significant global test (p < 0.05).
No Letters (a, b, c) indicate no statistically significant difference (p ≥ 0.05) between education levels within a country or region and/or no statistically significant global test (p ≥ 0.05).
N refers to the number of participants with the education level in that country or region. See Appendix 6 for variable-specific sample sizes.
No Letters (a, b, c) indicate no statistically significant difference (p ≥ 0.05) between education levels within a country or region and/or no statistically significant global test (p ≥ 0.05).
N refers to the number of participants with the education level in that country or region. See Appendix 6 for variable-specific sample sizes.
Discussion
Summary of results
The results show a continued decline in daily tobacco smoking across the Nordic Region between 2014 and 2024, with the overall proportion falling from 15.6% to 9.9%.
At the same time, alternative nicotine use—especially snuff and nicotine pouches—has increased, with a Nordic average of 13.6% people with daily use in 2024. The emergence and growing availability of nicotine pouches may explain much of this increase.
The use of e-cigarettes remains relatively low overall (2.8%), but varies substantially by country, with Iceland showing higher rates (7.1%).
When all nicotine products are considered together, nearly one in four adults (23.7%) in the Nordic Region reported daily use in 2024, indicating that overall nicotine exposure remains high despite reductions in smoking.
Gender patterns reveal that men are more likely than women to use snuff or nicotine pouches, while smoking and e-cigarette use appear more evenly distributed between genders.
Age patterns show that older adults are more likely to smoke, whereas younger adults are more inclined to use snuff or nicotine pouches.
An inverse social gradient persists: individuals with higher education consistently report lower daily smoking and nicotine use, reinforcing the established link between education and health behaviours.
Interpretation
The findings indicate a major shift in nicotine consumption patterns in the Nordic Region over the past decade.
While traditional smoking is declining, smokeless products are increasing. This substitution toward smokeless products, such as snuff and nicotine pouches, may reduce exposure to combustion-related toxins but still maintains nicotine dependence at a population level.
The growing popularity of these products among younger adults and men raises new public health concerns. While these products may have played a role in reducing smoking prevalence, their increasing use among individuals who might not otherwise have smoked suggests a broadening base of people using nicotine.
Comparison to other results
National data from the Nordic countries show that trends in smoking and smokeless tobacco use are broadly consistent with NORMO findings (Sundhedsstyrelsen, 2022; Finnish Institute for Health and Welfare, 2024; Directorate of Health, 2025; Statistics Norway, 2025; Folkhälsomyndigheten, 2024). However, the figures from the data collection of NORMO in 2024 are slightly higher than most national data, except in Denmark, where they are similar.
For e-cigarette use, national data for Norway and Sweden align closely with NORMO, while NORMO figures for Denmark and Iceland are somewhat higher.
Some of these discrepancies may be explained by differences in age group definitions across surveys, as national monitoring systems often use slightly younger or broader population ranges than NORMO.
Overall, both NORMO and national datasets show a decline in smoking and an increase in smokeless nicotine product use, confirming a consistent regional trend toward product substitution rather than complete cessation.
Strengths and limitations
A key strength of the questionnaire used in 2024 regarding nicotine use portion is its comprehensive and harmonized monitoring of multiple nicotine products across all Nordic countries, enabling a clear picture of the evolving landscape of nicotine use.
However, methodological differences—such as variation in age ranges or survey questions between NORMO and national data—limit direct comparability.
Additionally, the rapidly changing nicotine market (e.g., new pouch brands and e-cigarette formulations) makes it difficult to fully capture the scope and diversity of use within a single data collection cycle.
References
Directorate of Health. (2025). Public Health Watch – Monitoring selected health determinants [Microsoft Power BI dashboard]. https://www.landlaeknir.is/
Finnish Institute for Health and Welfare (THL). (2024). Tobacco statistics. https://thl.fi/en/statistics-and-data/data-and-services/health-statistics/tobacco-statistics
Folkhälsomyndigheten. (2024). Use of tobacco and nicotine products. The Public Health Agency of Sweden. https://www.folkhalsomyndigheten.se/the-public-health-agency-of-sweden/living-conditions-and-lifestyle/and-use-of-tobacco-and-nicotine-products/
Statistics Norway. (2025). Tobacco, alcohol and other drugs: 07692 – Daily users of snus and occasional users of snus (16–79 years), by age, contents, year and sex. Statbank Norway. https://www.ssb.no/en/statbank/table/07692/
Sundhedsstyrelsen. (2022). Danskernes rygevaner 2022. Sundhedsstyrelsen. https://www.sst.dk/da/Udgivelser/2022/Danskernes-rygevaner-2022
U.S. Department of Health and Human Services. (2016). E-cigarette use among youth and young adults: A report of the Surgeon General. Centers for Disease Control and Prevention, National Center for Chronic Disease Prevention and Health Promotion, Office on Smoking and Health. https://www.cdc.gov/tobacco/sgr/e-cigarettes/index.htm
Vestbo, J., Andreasen, J. T., Bast, L. S., Lund, L., & Pisinger, C. (2022). Nikotinbrug blandt børn og unge – konsekvenser og forebyggelse (pp. 1–96). Vidensråd for Forebyggelse. https://vidensraad.dk/rapport/nikotinbrug-blandt-boern-og-unge-konsekvenser-og-forebyggelse
World Health Organization. (2022). Tobacco: Poisoning our planet. World Health Organization. https://www.who.int/publications/i/item/9789240051287
World Health Organization. (2025). Effects of tobacco on health. https://www.who.int/europe/news-room/fact-sheets/item/effects-of-tobacco-on-health