Alcohol
Background
Alcohol consumption is associated with negative health effects such as increased risk of certain cancers and injuries, and it tends to have a negative effect on overall diet quality (NNR2023). Based on the overall evidence, it is recommended to limit alcohol consumption and avoid binge drinking, as no safe lower limit for alcohol intake has been established.
Consumption of alcoholic beverages also contributes to environmental impacts similar to those of non-alcoholic beverages, with climate effects linked to energy use, transportation and post-use.
Analytical Notes
This chapter presents population-level data on alcohol consumption frequency over the last twelve months (times per week), the number of standard drinks per week over the last seven days, and the proportion of people reporting binge drinking (≥ 5 standard drinks per occasion at least once during the past month).
Unless otherwise noted, all differences between specific groups (country, age, gender, education level) noted in the text and tables are statistically significant (p < 0.05), while comparisons to the Nordic average are qualitative.
Exact p-values can be found in the Appendix 5. For each analysis, all available observations with non-missing values for the specific variable being analyzed and the relevant grouping variable(s) were included. For variable-specific sample sizes, see Appendix 6. Exact values used in the figures are available in Appendix 7.
Background Analytical notes Key findings Results Discussion References |
Background
Alcohol consumption is associated with negative health effects such as increased risk of certain cancers and injuries, and it tends to have a negative effect on overall diet quality (NNR2023). Based on the overall evidence, it is recommended to limit alcohol consumption and avoid binge drinking, as no safe lower limit for alcohol intake has been established.
Consumption of alcoholic beverages also contributes to environmental impacts similar to those of non-alcoholic beverages, with climate effects linked to energy use, transportation and post-use.
Analytical Notes
This chapter presents population-level data on alcohol consumption frequency over the last twelve months (times per week), the number of standard drinks per week over the last seven days, and the proportion of people reporting binge drinking (≥ 5 standard drinks per occasion at least once during the past month).
Unless otherwise noted, all differences between specific groups (country, age, gender, education level) noted in the text and tables are statistically significant (p < 0.05), while comparisons to the Nordic average are qualitative.
Exact p-values can be found in the Appendix 5. For each analysis, all available observations with non-missing values for the specific variable being analyzed and the relevant grouping variable(s) were included. For variable-specific sample sizes, see Appendix 6. Exact values used in the figures are available in Appendix 7.
Key Findings
Status 2024
- Alcoholic beverages were consumed about once to twice per week on average across the region.
- Adults in Denmark drank most frequently; those in Finland and Iceland least frequently.
- Binge drinking was highest in Denmark and lowest in Sweden.
- Amount consumed, i.e. standard drinks per week, the countries mirrored the frequency pattern (highest in Denmark, lowest in Iceland).
Trends 2014–2024
- Frequency: Largely unchanged at the regional level; Finland decreased.
- Binge drinking: Declined in Norway and Sweden, nudging the Nordic average down.
- People who ever consume alcohol: Declined region-wide, driven by Iceland and Sweden.
Demographic patterns
Gender:
- Men were higher than women for both drinking frequency and binge drinking
- Men also consumed more standard drinks per week.
Age:
- The 45–65-year-olds drank more frequently; binge drinking decreases with age. The 18–29-year-olds consumed the most drinks per week; the 30–44-year-olds consumed the fewest.
Education:
- Minimal differences overall.
- In Finland, those with lower levels of education reported more frequent consumption.
- The proportion of people who consume alcohol was higher among the high education group in Sweden and for the Nordic Region overall.
Results
Status 2024
On average, alcoholic beverages were consumed 1.5 times per week in the Nordic Region. Consumption was least frequent in Finland and Iceland and most frequent in Denmark. Across the region, 39% of adults reported binge drinking — defined as having consumed more than five standard drinks on at least one occasion during the past month.
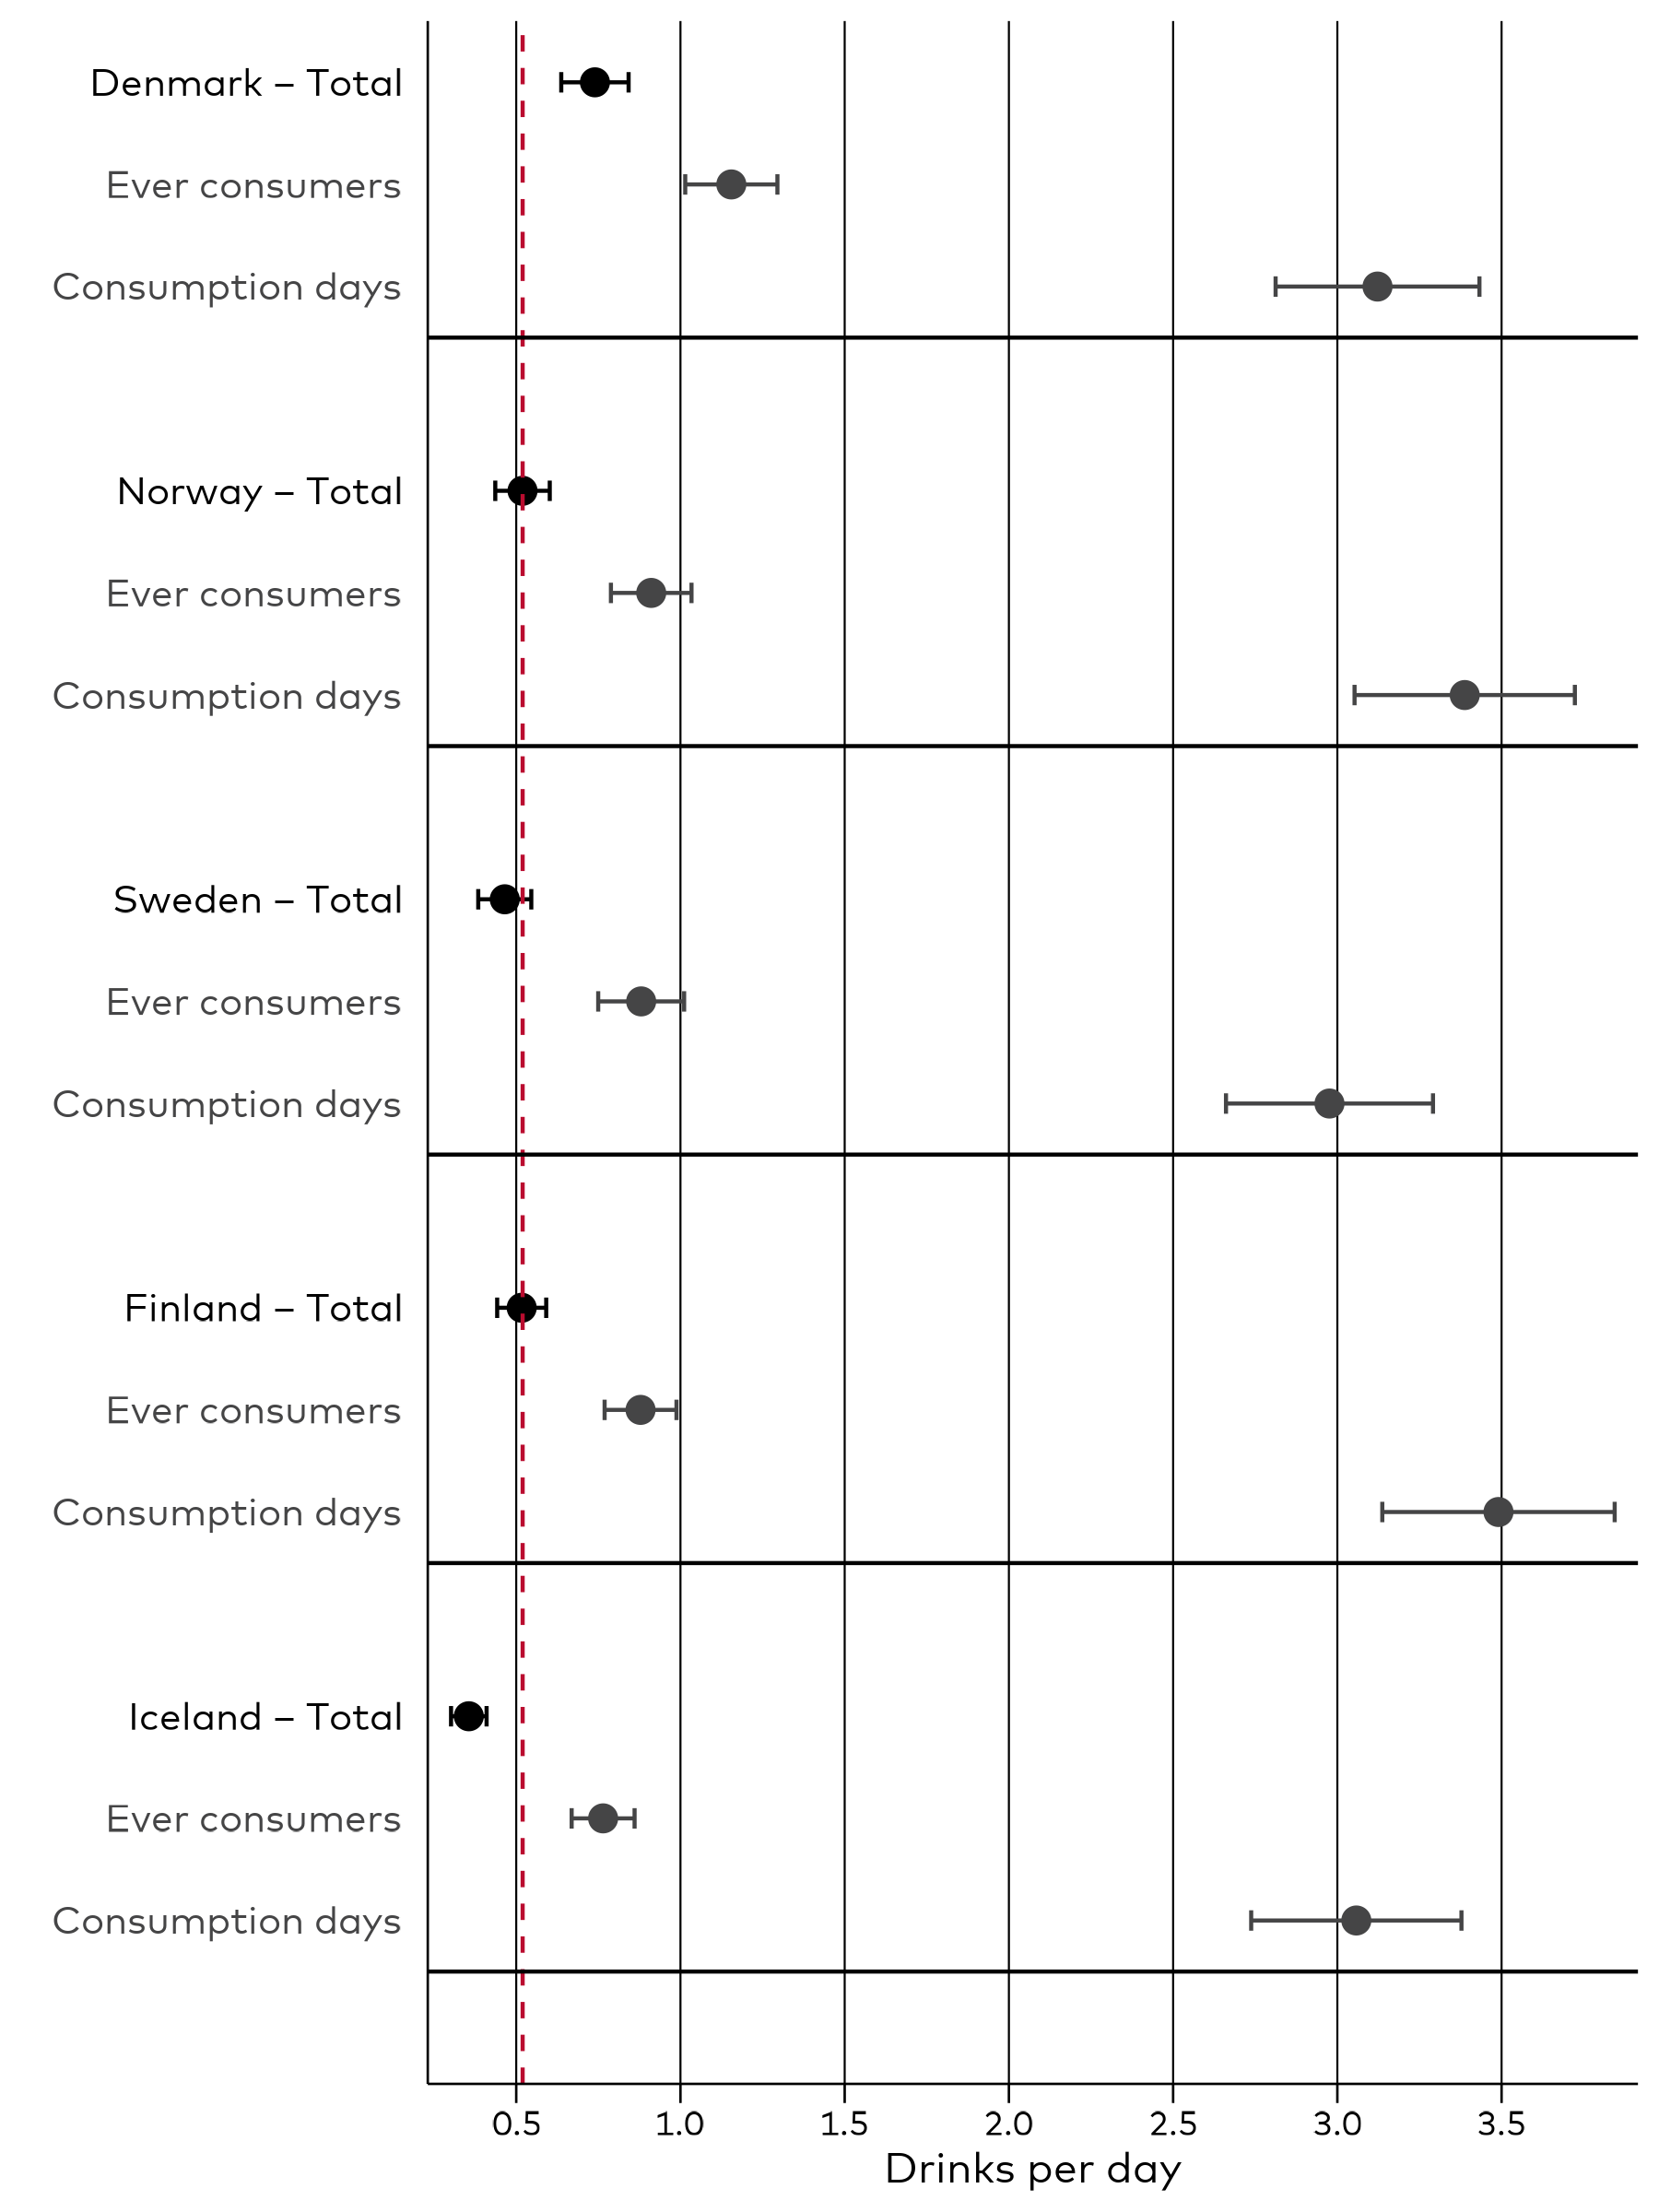
The mean consumption in the Nordic Region was 3.6 standard drinks per week, equivalent to 0.5 drinks per day. Denmark stands out with the highest consumption at 5.2 standard drinks per week (0.7 per day) — about 1.6 drinks more than Norway and Finland, 1.9 more than Sweden, and 3 more than Iceland.
The proportion of adults who consumed alcohol at all also varied across countries. Iceland had a significantly lower share of people who consume alcohol (77.6%) than the other Nordic countries, except Sweden.
The number of drinks per drinking occasion among people who consume alcohol likewise differs by country. Adults in Finland and Norway tended to consume slightly more per occasion than those in the other Nordic countries.
Trend 2014–2024
The frequency of alcoholic beverage consumption has remained largely unchanged in the Nordic Region since 2014. Only Finland showed a statistically significant decrease.
The proportion of people reporting binge drinking has declined in Norway and Sweden, contributing to a slight overall decrease in the Nordic average.
The proportion of adults who consume alcohol has also decreased across the region—from 89.3% to 84.1%—although the decrease was statistically significant only in Iceland and Sweden.

The mean consumption of standard drinks per day are shown for the Nordic average (a dashed red line) and for the five Nordic countries. The number of drinks per day for those who drink alcohol and the drinks per day on drinking days are shown in grey.
Results
Status 2024
On average, alcoholic beverages were consumed 1.5 times per week in the Nordic Region. Consumption was least frequent in Finland and Iceland and most frequent in Denmark. Across the region, 39% of adults reported binge drinking — defined as having consumed more than five standard drinks on at least one occasion during the past month.
The mean consumption in the Nordic Region was 3.6 standard drinks per week, equivalent to 0.5 drinks per day. Denmark stands out with the highest consumption at 5.2 standard drinks per week (0.7 per day) — about 1.6 drinks more than Norway and Finland, 1.9 more than Sweden, and 3 more than Iceland.
The proportion of adults who consumed alcohol at all also varied across countries. Iceland had a significantly lower share of people who consume alcohol (77.6%) than the other Nordic countries, except Sweden.
The number of drinks per drinking occasion among people who consume alcohol likewise differs by country. Adults in Finland and Norway tended to consume slightly more per occasion than those in the other Nordic countries.
Trend 2014–2024
The frequency of alcoholic beverage consumption has remained largely unchanged in the Nordic Region since 2014. Only Finland showed a statistically significant decrease.
The proportion of people reporting binge drinking has declined in Norway and Sweden, contributing to a slight overall decrease in the Nordic average.
The proportion of adults who consume alcohol has also decreased across the region—from 89.3% to 84.1%—although the decrease was statistically significant only in Iceland and Sweden.
The mean consumption of standard drinks per day are shown for the Nordic average (a dashed red line) and for the five Nordic countries. The number of drinks per day for those who drink alcohol and the drinks per day on drinking days are shown in grey.
N | 2008 | 1004 |
|---|---|---|
Alcohol consumption frequency (% ever) | 91.1 (89.5; 92.6) * | 87.8 (85.1; 90.5) * |
Alcohol consumption frequency (times per week) | 2.5 (2.3; 2.7) | 2.3 (2.0; 2.6) |
Alcohol consumption amount (standard drinks per week) | 5.2 (4.5; 5.9) | |
Binge Drinking (%) | 46.3 (43.6; 48.9) | 45.5 (41.6; 49.4) |
* indicates statistically significant difference (p< 0.05) between survey years within a country or region.
Grey cells indicate values not collected and/or not valid for comparison.
N refers to the number of participants in that survey year in that country or region. See
Appendix 6 for variable-specific sample sizes.
Binge Drinking is ≥5 standard drinks per drinking occasion at least once during the last month.
Alcohol consumption frequency over the past 12 months.
Alcohol consumption amount over the past seven days.
N | 1057 | 1010 |
|---|---|---|
Alcohol consumption frequency (% ever) | 90.9 (88.3; 93.6) * | 86.3 (83.1; 89.5) * |
Alcohol consumption frequency (times per week) | 1.6 (1.4; 1.8) | 1.4 (1.3; 1.6) |
Alcohol consumption amount (standard drinks per week) | 3.6 (3.1; 4.2) | |
Binge Drinking (%) | 51.5 (46.8; 56.3) * | 36.6 (32.5; 40.7) * |
* indicates statistically significant difference (p< 0.05) between survey years within a country or region.
Grey cells indicate values not collected and/or not valid for comparison.
N refers to the number of participants in that survey year in that country or region. See
Appendix 6 for variable-specific sample sizes.
Binge Drinking is ≥5 standard drinks per drinking occasion at least once during the last month.
Alcohol consumption frequency over the past 12 months.
Alcohol consumption amount over the past seven days.
Grey cells indicate values not collected and/or not valid for comparison.
N refers to the number of participants in that survey year in that country or region. See
Appendix 6 for variable-specific sample sizes.
Binge Drinking is ≥5 standard drinks per drinking occasion at least once during the last month.
Alcohol consumption frequency over the past 12 months.
Alcohol consumption amount over the past seven days.
N | 1801 | 999 |
|---|---|---|
Alcohol consumption frequency (% ever) | 89.2 (86.7; 91.6) * | 82.4 (79.1; 85.7) * |
Alcohol consumption frequency (times per week) | 1.5 (1.4; 1.6) | 1.5 (1.3; 1.6) |
Alcohol consumption amount (standard drinks per week) | 3.3 (2.7; 3.8) | |
Binge Drinking (%) | 40.9 (37.9; 43.9) * | 32.4 (28.5; 36.4) * |
* indicates statistically significant difference (p< 0.05) between survey years within a country or region.
Grey cells indicate values not collected and/or not valid for comparison.
N refers to the number of participants in that survey year in that country or region. See
Appendix 6 for variable-specific sample sizes.
Binge Drinking is ≥5 standard drinks per drinking occasion at least once during the last month.
Alcohol consumption frequency over the past 12 months.
Alcohol consumption amount over the past seven days.
Grey cells indicate values not collected and/or not valid for comparison.
N refers to the number of participants in that survey year in that country or region. See
Appendix 6 for variable-specific sample sizes.
Binge Drinking is ≥5 standard drinks per drinking occasion at least once during the last month.
Alcohol consumption frequency over the past 12 months.
Alcohol consumption amount over the past seven days.
N | 1717 | 1020 |
|---|---|---|
Alcohol consumption frequency (% ever) | 89.0 (87.3; 90.6) | 86.3 (83.6; 89.1) |
Alcohol consumption frequency (times per week) | 1.5 (1.4; 1.7) * | 1.2 (1.1; 1.4) * |
Alcohol consumption amount (standard drinks per week) | 3.6 (3.1; 4.1) | |
Binge Drinking (%) | 44.5 (41.6; 47.3) | 41.4 (37.1; 45.8) |
* indicates statistically significant difference (p< 0.05) between survey years within a country or region.
Grey cells indicate values not collected and/or not valid for comparison.
N refers to the number of participants in that survey year in that country or region. See
Appendix 6 for variable-specific sample sizes.
Binge Drinking is ≥5 standard drinks per drinking occasion at least once during the last month.
Alcohol consumption frequency over the past 12 months.
Alcohol consumption amount over the past seven days.
Grey cells indicate values not collected and/or not valid for comparison.
N refers to the number of participants in that survey year in that country or region. See
Appendix 6 for variable-specific sample sizes.
Binge Drinking is ≥5 standard drinks per drinking occasion at least once during the last month.
Alcohol consumption frequency over the past 12 months.
Alcohol consumption amount over the past seven days.
N | 2012 | 1021 |
|---|---|---|
Alcohol consumption frequency (% ever) | 86.2 (84.4; 88.0) * | 77.6 (74.0; 81.1) * |
Alcohol consumption frequency (times per week) | 1.2 (1.1; 1.3) | 1.2 (1.0; 1.3) |
Alcohol consumption amount (standard drinks per week) | 2.5 (2.1; 2.9) | |
Binge Drinking (%) | 39.1 (36.5; 41.8) | 37.1 (33.1; 41.1) |
* indicates statistically significant difference (p< 0.05) between survey years within a country or region.
Grey cells indicate values not collected and/or not valid for comparison.
N refers to the number of participants in that survey year in that country or region. See
Appendix 6 for variable-specific sample sizes.
Binge Drinking is ≥5 standard drinks per drinking occasion at least once during the last month.
Alcohol consumption frequency over the past 12 months.
Alcohol consumption amount over the past seven days.
Grey cells indicate values not collected and/or not valid for comparison.
N refers to the number of participants in that survey year in that country or region. See
Appendix 6 for variable-specific sample sizes.
Binge Drinking is ≥5 standard drinks per drinking occasion at least once during the last month.
Alcohol consumption frequency over the past 12 months.
Alcohol consumption amount over the past seven days.
N | 8595 | 5054 |
|---|---|---|
Alcohol consumption frequency (% ever) | 89.3 (88.3; 90.2) * | 84.1 (82.7; 85.5) * |
Alcohol consumption frequency (times per week) | 1.6 (1.6; 1.7) * | 1.5 (1.4; 1.6) * |
Alcohol consumption amount (standard drinks per week) | 3.6 (3.4; 3.9) | |
Binge Drinking (%) | 44.5 (43.0; 46.0) * | 38.6 (36.8; 40.5) |
* indicates statistically significant difference (p< 0.05) between survey years within a country or region.
Grey cells indicate values not collected and/or not valid for comparison.
N refers to the number of participants in that survey year in that country or region. See
Appendix 6 for variable-specific sample sizes.
Binge Drinking is ≥5 standard drinks per drinking occasion at least once during the last month.
Alcohol consumption frequency over the past 12 months.
Alcohol consumption amount over the past seven days.
All countries contributed equally to the Nordic average.
Demographic Differences
Gender
Across the Nordic countries, both the frequency of alcoholic beverage consumption and the proportion of people reporting binge drinking were higher among men than women (1.9 vs 1.1 times per week and 49.1% vs 27.4%, respectively). This gender difference in drinking behaviour was observed in all countries, although it was not statistically significant in Iceland.
The mean alcohol consumption was also about twice as high in men as in women (4.8 vs 2.4 standard drinks per week). In Denmark and Finland, the gap was even larger, with men consuming up to three more standard drinks per week than women.
N | 482 | 522 |
|---|---|---|
Alcohol consumption frequency (% ever) | 91.7 (88.3; 95.1) * | 83.9 (79.7; 88.0) * |
Alcohol consumption frequency (times per week) | 2.9 (2.4; 3.5) * | 1.6 (1.4; 1.8) * |
Alcohol consumption amount (standard drinks per week) | 7.0 (5.7; 8.3) * | 3.3 (2.8; 3.8) * |
Binge Drinking (%) | 58.0 (52.4; 63.6) * | 32.6 (27.6; 37.5) * |
* indicates statistically significant difference (p < 0.05) between genders within a country or region.
N refers to the number of participants with that gender in that country or region. See Appendix 6 for variable-specific sample sizes.
Binge Drinking is ≥5 standard drinks per drinking occasion at least once during the last month.
Alcohol consumption frequency over the past 12 months.
Alcohol consumption amount over the past seven days.
N | 499 | 511 |
|---|---|---|
Alcohol consumption frequency (% ever) | 89.1 (84.9; 93.2) | 83.4 (78.7; 88.2) |
Alcohol consumption frequency (times per week) | 1.7 (1.5; 2.0) * | 1.1 (1.0; 1.3) * |
Alcohol consumption amount (standard drinks per week) | 4.8 (3.8; 5.7) * | 2.5 (1.9; 3.0) * |
Binge Drinking (%) | 47.6 (41.7; 53.5) * | 25.1 (20.0; 30.2) * |
* indicates statistically significant difference (p < 0.05) between genders within a country or region.
N refers to the number of participants with that gender in that country or region. See Appendix 6 for variable-specific sample sizes.
Binge Drinking is ≥5 standard drinks per drinking occasion at least once during the last month.
Alcohol consumption frequency over the past 12 months.
Alcohol consumption amount over the past seven days.
N refers to the number of participants with that gender in that country or region. See Appendix 6 for variable-specific sample sizes.
Binge Drinking is ≥5 standard drinks per drinking occasion at least once during the last month.
Alcohol consumption frequency over the past 12 months.
Alcohol consumption amount over the past seven days.
N | 463 | 536 |
|---|---|---|
Alcohol consumption frequency (% ever) | 85.4 (80.9; 89.9) | 79.3 (74.5; 84.2) |
Alcohol consumption frequency (times per week) | 1.7 (1.5; 2.0) * | 1.2 (1.0; 1.3) * |
Alcohol consumption amount (standard drinks per week) | 4.2 (3.3; 5.2) * | 2.3 (1.7; 2.8) * |
Binge Drinking (%) | 42.5 (36.4; 48.5) * | 22.2 (17.4; 26.9) * |
* indicates statistically significant difference (p < 0.05) between genders within a country or region.
N refers to the number of participants with that gender in that country or region. See Appendix 6 for variable-specific sample sizes.
Binge Drinking is ≥5 standard drinks per drinking occasion at least once during the last month.
Alcohol consumption frequency over the past 12 months.
Alcohol consumption amount over the past seven days.
N refers to the number of participants with that gender in that country or region. See Appendix 6 for variable-specific sample sizes.
Binge Drinking is ≥5 standard drinks per drinking occasion at least once during the last month.
Alcohol consumption frequency over the past 12 months.
Alcohol consumption amount over the past seven days.
N | 480 | 540 |
|---|---|---|
Alcohol consumption frequency (% ever) | 88.6 (84.9; 92.3) | 83.5 (79.4; 87.6) |
Alcohol consumption frequency (times per week) | 1.7 (1.5; 1.9) * | 0.7 (0.6; 0.8) * |
Alcohol consumption amount (standard drinks per week) | 5.2 (4.3; 6.0) * | 1.7 (1.3; 2.1) * |
Binge Drinking (%) | 55.4 (49.3; 61.6) * | 24.5 (19.3; 29.7) * |
* indicates statistically significant difference (p < 0.05) between genders within a country or region.
N refers to the number of participants with that gender in that country or region. See Appendix 6 for variable-specific sample sizes.
Binge Drinking is ≥5 standard drinks per drinking occasion at least once during the last month.
Alcohol consumption frequency over the past 12 months.
Alcohol consumption amount over the past seven days.
N refers to the number of participants with that gender in that country or region. See Appendix 6 for variable-specific sample sizes.
Binge Drinking is ≥5 standard drinks per drinking occasion at least once during the last month.
Alcohol consumption frequency over the past 12 months.
Alcohol consumption amount over the past seven days.
N | 439 | 582 |
|---|---|---|
Alcohol consumption frequency (% ever) | 73.7 (68.1; 79.2) * | 81.8 (77.5; 86.1) * |
Alcohol consumption frequency (times per week) | 1.3 (1.1; 1.5) | 1.0 (0.8; 1.2) |
Alcohol consumption amount (standard drinks per week) | 2.9 (2.3; 3.4) * | 2.1 (1.6; 2.6) * |
Binge Drinking (%) | 41.3 (35.4; 47.2) * | 32.6 (27.2; 37.9) * |
* indicates statistically significant difference (p < 0.05) between genders within a country or region.
N refers to the number of participants with that gender in that country or region. See Appendix 6 for variable-specific sample sizes.
Binge Drinking is ≥5 standard drinks per drinking occasion at least once during the last month.
Alcohol consumption frequency over the past 12 months.
Alcohol consumption amount over the past seven days.
N refers to the number of participants with that gender in that country or region. See Appendix 6 for variable-specific sample sizes.
Binge Drinking is ≥5 standard drinks per drinking occasion at least once during the last month.
Alcohol consumption frequency over the past 12 months.
Alcohol consumption amount over the past seven days.
N | 2363 | 2691 |
|---|---|---|
Alcohol consumption frequency (% ever) | 85.7 (83.7; 87.6) * | 82.4 (80.4; 84.4) * |
Alcohol consumption frequency (times per week) | 1.9 (1.7; 2.0) * | 1.1 (1.1; 1.2) * |
Alcohol consumption amount (standard drinks per week) | 4.8 (4.4; 5.2) * | 2.4 (2.2; 2.6) * |
Binge Drinking (%) | 49.1 (46.4; 51.8) * | 27.4 (25.1; 29.7) * |
* indicates statistically significant difference (p < 0.05) between genders within a country or region.
N refers to the number of participants with that gender in that country or region. See Appendix 6 for variable-specific sample sizes.
Binge Drinking is ≥5 standard drinks per drinking occasion at least once during the last month.
Alcohol consumption frequency over the past 12 months.
Alcohol consumption amount over the past seven days.
All countries contributed equally to the Nordic average.
Age
When comparing Nordic averages across age groups, adults aged 45–65 years reported a higher frequency of alcohol consumption than those aged 18–29 or 30–44 years, while the proportion of people reporting binge drinking decreased steadily with age—from 53.8% in the youngest group to 30.9% in the oldest. The 18–29-year-olds reported the highest mean alcohol intake at 4.4 standard drinks per week, whereas the 30–44-year-olds reported the lowest at 3.1.
In Iceland, Norway, and Sweden, there were no statistically significant differences between age groups in either consumption frequency or average number of standard drinks per week. In contrast, in Denmark and Finland, adults aged 30–44 years reported a lower drinking frequency than those aged 45–65 years, and they also reported the fewest standard drinks per week (3.5 in Denmark and 2.5 in Finland).
The proportion of people reporting binge drinking declined with age in all countries. The highest prevalence was found among 18–29-year-olds in Denmark (65.2%), and the lowest among 45–65-year-olds in Sweden (24.1%).
N | 115 | 248 | 641 |
|---|---|---|---|
Alcohol consumption frequency (% ever) | 93.8 (89.2; 98.5) [a] | 84.2 (78.7; 89.7) [b] | 86.8 (82.9; 90.7) [ab] |
Alcohol consumption frequency (times per week) | 2.0 (1.6; 2.3) [b] | 1.6 (1.3; 1.9) [b] | 2.9 (2.3; 3.5) [a] |
Alcohol consumption amount (standard drinks per week) | 7.2 (5.1; 9.2) [a] | 3.5 (2.5; 4.4) [b] | 5.2 (4.3; 6.1) [a] |
Binge Drinking (%) | 65.2 (56.1; 74.3) [b] | 42.1 (35.5; 48.8) [a] | 36.2 (31.3; 41.0) [a] |
Different letters (a, b, c) indicate statistically significant difference (p < 0.05) between age groups within a country or region after a statistically significant global test (p < 0.05).
No Letters (a, b, c) indicate no statistically significant difference (p >= 0.05) between age groups within a country or region and/or no statistically significant global test (p >= 0.05).
N refers to the number of participants with the education level in that country or region. See Appendix 6 for variable-specific sample sizes.
Binge Drinking is ≥5 standard drinks per drinking occasion at least once during the last month.
Alcohol consumption frequency over the past 12 months.
Alcohol consumption amount over the past seven days.
N | 121 | 245 | 644 |
|---|---|---|---|
Alcohol consumption frequency (% ever) | 83.5 (74.9; 92.2) | 88.4 (83.4; 93.4) | 86.2 (81.9; 90.5) |
Alcohol consumption frequency (times per week) | 1.2 (0.9; 1.4) | 1.4 (1.2; 1.7) | 1.6 (1.3; 1.8) |
Alcohol consumption amount (standard drinks per week) | 5.0 (2.8; 7.1) | 3.5 (2.5; 4.4) | 3.2 (2.7; 3.6) |
Binge Drinking (%) | 56.4 (46.1; 66.7) [b] | 37.0 (30.0; 44.0) [a] | 28.0 (22.7; 33.4) [a] |
Different letters (a, b, c) indicate statistically significant difference (p < 0.05) between age groups within a country or region after a statistically significant global test (p < 0.05).
No Letters (a, b, c) indicate no statistically significant difference (p >= 0.05) between age groups within a country or region and/or no statistically significant global test (p >= 0.05).
N refers to the number of participants with the education level in that country or region. See Appendix 6 for variable-specific sample sizes.
Binge Drinking is ≥5 standard drinks per drinking occasion at least once during the last month.
Alcohol consumption frequency over the past 12 months.
Alcohol consumption amount over the past seven days.
No Letters (a, b, c) indicate no statistically significant difference (p >= 0.05) between age groups within a country or region and/or no statistically significant global test (p >= 0.05).
N refers to the number of participants with the education level in that country or region. See Appendix 6 for variable-specific sample sizes.
Binge Drinking is ≥5 standard drinks per drinking occasion at least once during the last month.
Alcohol consumption frequency over the past 12 months.
Alcohol consumption amount over the past seven days.
N | 78 | 335 | 586 |
|---|---|---|---|
Alcohol consumption frequency (% ever) | 80.3 (71.1; 89.5) | 86.6 (81.9; 91.3) | 80.2 (75.6; 84.9) |
Alcohol consumption frequency (times per week) | 1.4 (1.0; 1.8) | 1.4 (1.2; 1.7) | 1.5 (1.3; 1.7) |
Alcohol consumption amount (standard drinks per week) | 4.2 (2.3; 6.1) | 2.9 (2.3; 3.6) | 3.0 (2.4; 3.7) |
Binge Drinking (%) | 48.2 (36.6; 59.9) [b] | 32.1 (26.7; 37.5) [a] | 24.1 (19.2; 28.9) [a] |
Different letters (a, b, c) indicate statistically significant difference (p < 0.05) between age groups within a country or region after a statistically significant global test (p < 0.05).
No Letters (a, b, c) indicate no statistically significant difference (p >= 0.05) between age groups within a country or region and/or no statistically significant global test (p >= 0.05).
N refers to the number of participants with the education level in that country or region. See Appendix 6 for variable-specific sample sizes.
Binge Drinking is ≥5 standard drinks per drinking occasion at least once during the last month.
Alcohol consumption frequency over the past 12 months.
Alcohol consumption amount over the past seven days.
No Letters (a, b, c) indicate no statistically significant difference (p >= 0.05) between age groups within a country or region and/or no statistically significant global test (p >= 0.05).
N refers to the number of participants with the education level in that country or region. See Appendix 6 for variable-specific sample sizes.
Binge Drinking is ≥5 standard drinks per drinking occasion at least once during the last month.
Alcohol consumption frequency over the past 12 months.
Alcohol consumption amount over the past seven days.
N | 71 | 248 | 701 |
|---|---|---|---|
Alcohol consumption frequency (% ever) | 90.6 (84.0; 97.3) | 84.7 (80.2; 89.2) | 85.4 (81.5; 89.4) |
Alcohol consumption frequency (times per week) | 1.1 (0.8; 1.4) [b] | 0.8 (0.7; 1.0) [b] | 1.7 (1.4; 2.0) [a] |
Alcohol consumption amount (standard drinks per week) | 4.0 (2.7; 5.2) [ab] | 2.5 (2.0; 3.1) [b] | 4.4 (3.4; 5.3) [a] |
Binge Drinking (%) | 54.7 (42.8; 66.6) [b] | 38.4 (32.2; 44.5) [a] | 37.1 (31.0; 43.2) [a] |
Different letters (a, b, c) indicate statistically significant difference (p < 0.05) between age groups within a country or region after a statistically significant global test (p < 0.05).
No Letters (a, b, c) indicate no statistically significant difference (p >= 0.05) between age groups within a country or region and/or no statistically significant global test (p >= 0.05).
N refers to the number of participants with the education level in that country or region. See Appendix 6 for variable-specific sample sizes.
Binge Drinking is ≥5 standard drinks per drinking occasion at least once during the last month.
Alcohol consumption frequency over the past 12 months.
Alcohol consumption amount over the past seven days.
No Letters (a, b, c) indicate no statistically significant difference (p >= 0.05) between age groups within a country or region and/or no statistically significant global test (p >= 0.05).
N refers to the number of participants with the education level in that country or region. See Appendix 6 for variable-specific sample sizes.
Binge Drinking is ≥5 standard drinks per drinking occasion at least once during the last month.
Alcohol consumption frequency over the past 12 months.
Alcohol consumption amount over the past seven days.
N | 86 | 307 | 628 |
|---|---|---|---|
Alcohol consumption frequency (% ever) | 73.2 (63.4; 83.1) | 78.0 (72.9; 83.2) | 80.1 (75.8; 84.3) |
Alcohol consumption frequency (times per week) | 1.2 (0.8; 1.6) | 1.1 (0.9; 1.2) | 1.3 (1.1; 1.4) |
Alcohol consumption amount (standard drinks per week) | 2.0 (1.2; 2.7) | 3.1 (2.4; 3.7) | 2.3 (1.8; 2.9) |
Binge Drinking (%) | 44.5 (33.6; 55.3) [b] | 39.9 (34.0; 45.8) [b] | 29.5 (24.7; 34.2) [a] |
Different letters (a, b, c) indicate statistically significant difference (p < 0.05) between age groups within a country or region after a statistically significant global test (p < 0.05).
No Letters (a, b, c) indicate no statistically significant difference (p >= 0.05) between age groups within a country or region and/or no statistically significant global test (p >= 0.05).
N refers to the number of participants with the education level in that country or region. See Appendix 6 for variable-specific sample sizes.
Binge Drinking is ≥5 standard drinks per drinking occasion at least once during the last month.
Alcohol consumption frequency over the past 12 months.
Alcohol consumption amount over the past seven days.
No Letters (a, b, c) indicate no statistically significant difference (p >= 0.05) between age groups within a country or region and/or no statistically significant global test (p >= 0.05).
N refers to the number of participants with the education level in that country or region. See Appendix 6 for variable-specific sample sizes.
Binge Drinking is ≥5 standard drinks per drinking occasion at least once during the last month.
Alcohol consumption frequency over the past 12 months.
Alcohol consumption amount over the past seven days.
N | 471 | 1383 | 3200 |
|---|---|---|---|
Alcohol consumption frequency (% ever) | 84.2 (80.4; 87.9) | 84.2 (82.0; 86.5) | 83.9 (82.0; 85.8) |
Alcohol consumption frequency (times per week) | 1.4 (1.2; 1.5) [b] | 1.2 (1.1; 1.3) [b] | 1.8 (1.6; 2.0) [a] |
Alcohol consumption amount (standard drinks per week) | 4.4 (3.7; 5.2) [a] | 3.1 (2.7; 3.4) [b] | 3.6 (3.3; 4.0) [a] |
Binge Drinking (%) | 53.8 (48.9; 58.7) [b] | 37.9 (35.1; 40.6) [c] | 30.9 (28.6; 33.3) [a] |
Different letters (a, b, c) indicate statistically significant difference (p < 0.05) between age groups within a country or region after a statistically significant global test (p < 0.05).
No Letters (a, b, c) indicate no statistically significant difference (p >= 0.05) between age groups within a country or region and/or no statistically significant global test (p >= 0.05).
N refers to the number of participants with the education level in that country or region. See Appendix 6 for variable-specific sample sizes.
Binge Drinking is ≥5 standard drinks per drinking occasion at least once during the last month.
Alcohol consumption frequency over the past 12 months.
Alcohol consumption amount over the past seven days.
No Letters (a, b, c) indicate no statistically significant difference (p >= 0.05) between age groups within a country or region and/or no statistically significant global test (p >= 0.05).
N refers to the number of participants with the education level in that country or region. See Appendix 6 for variable-specific sample sizes.
Binge Drinking is ≥5 standard drinks per drinking occasion at least once during the last month.
Alcohol consumption frequency over the past 12 months.
Alcohol consumption amount over the past seven days.
Education
When comparing the frequency of alcoholic beverage consumption across education levels, only small differences were observed. The only statistically significant difference was found in Finland, where adults with lower levels of education reported more frequent alcohol consumption than those with higher levels of education.
In Sweden, a higher proportion of adults with higher levels of education reported drinking alcohol compared with those with lower levels of education—a pattern that was also reflected in the Nordic Region overall.
N | 55 | 367 | 578 |
|---|---|---|---|
Alcohol consumption frequency (% ever) | 78.6 (67.7; 89.4) | 89.8 (86.5; 93.1) | 90.3 (87.5; 93.0) |
Alcohol consumption frequency (times per week) | 2.9 (1.5; 4.4) | 2.2 (1.9; 2.5) | 2.1 (1.9; 2.3) |
Alcohol consumption amount (standard drinks per week) | 6.4 (4.0; 8.9) | 5.5 (4.2; 6.8) | 4.4 (3.9; 5.0) |
Binge Drinking (%) | 51.0 (37.3; 64.6) | 47.1 (41.4; 52.8) | 42.6 (37.9; 47.3) |
Different letters (a, b, c) indicate statistically significant difference (p < 0.05) between education levels within a country or region after a statistically significant global test (p < 0.05).
No Letters (a, b, c) indicate no statistically significant difference (p ≥ 0.05) between education levels within a country or region and/or no statistically significant global test (p ≥ 0.05).
N refers to the number of participants with the education level in that country or region. See Appendix 6 for variable-specific sample sizes.
Binge Drinking is ≥5 standard drinks per drinking occasion at least once during the last month.
Alcohol consumption frequency over the past 12 months.
Alcohol consumption amount over the past seven days.
N | 31 | 338 | 637 |
|---|---|---|---|
Alcohol consumption frequency (% ever) | 80.2 (66.0; 94.4) | 86.5 (82.6; 90.4) | 89.0 (86.2; 91.7) |
Alcohol consumption frequency (times per week) | 1.2 (0.7; 1.7) | 1.4 (1.2; 1.7) | 1.6 (1.4; 1.7) |
Alcohol consumption amount (standard drinks per week) | 4.6 (1.6; 7.6) | 3.4 (2.8; 3.9) | 3.6 (3.1; 4.1) |
Binge Drinking (%) | 34.3 (17.1; 51.5) | 38.7 (33.1; 44.4) | 36.1 (31.8; 40.5) |
Different letters (a, b, c) indicate statistically significant difference (p < 0.05) between education levels within a country or region after a statistically significant global test (p < 0.05).
No Letters (a, b, c) indicate no statistically significant difference (p ≥ 0.05) between education levels within a country or region and/or no statistically significant global test (p ≥ 0.05).
N refers to the number of participants with the education level in that country or region. See Appendix 6 for variable-specific sample sizes.
Binge Drinking is ≥5 standard drinks per drinking occasion at least once during the last month.
Alcohol consumption frequency over the past 12 months.
Alcohol consumption amount over the past seven days.
No Letters (a, b, c) indicate no statistically significant difference (p ≥ 0.05) between education levels within a country or region and/or no statistically significant global test (p ≥ 0.05).
N refers to the number of participants with the education level in that country or region. See Appendix 6 for variable-specific sample sizes.
Binge Drinking is ≥5 standard drinks per drinking occasion at least once during the last month.
Alcohol consumption frequency over the past 12 months.
Alcohol consumption amount over the past seven days.
N | 32 | 377 | 585 |
|---|---|---|---|
Alcohol consumption frequency (% ever) | 76.2 (61.6; 90.8) [ab] | 79.9 (75.0; 84.8) [b] | 88.9 (86.0; 91.9) [a] |
Alcohol consumption frequency (times per week) | 1.1 (0.6; 1.7) | 1.4 (1.2; 1.6) | 1.7 (1.5; 1.9) |
Alcohol consumption amount (standard drinks per week) | 3.7 (0.8; 6.6) | 3.0 (2.3; 3.8) | 3.5 (2.8; 4.1) |
Binge Drinking (%) | 39.1 (21.0; 57.1) | 33.3 (27.4; 39.1) | 31.3 (26.5; 36.1) |
Different letters (a, b, c) indicate statistically significant difference (p < 0.05) between education levels within a country or region after a statistically significant global test (p < 0.05).
No Letters (a, b, c) indicate no statistically significant difference (p ≥ 0.05) between education levels within a country or region and/or no statistically significant global test (p ≥ 0.05).
N refers to the number of participants with the education level in that country or region. See Appendix 6 for variable-specific sample sizes.
Binge Drinking is ≥5 standard drinks per drinking occasion at least once during the last month.
Alcohol consumption frequency over the past 12 months.
Alcohol consumption amount over the past seven days.
No Letters (a, b, c) indicate no statistically significant difference (p ≥ 0.05) between education levels within a country or region and/or no statistically significant global test (p ≥ 0.05).
N refers to the number of participants with the education level in that country or region. See Appendix 6 for variable-specific sample sizes.
Binge Drinking is ≥5 standard drinks per drinking occasion at least once during the last month.
Alcohol consumption frequency over the past 12 months.
Alcohol consumption amount over the past seven days.
N | 34 | 434 | 550 |
|---|---|---|---|
Alcohol consumption frequency (% ever) | 91.7 (82.6; 100.7) | 83.5 (79.5; 87.6) | 87.2 (83.4; 91.1) |
Alcohol consumption frequency (times per week) | 2.3 (1.5; 3.0) [b] | 1.1 (0.9; 1.2) [a] | 1.1 (0.9; 1.2) [a] |
Alcohol consumption amount (standard drinks per week) | 5.4 (3.0; 7.8) [a] | 3.7 (3.0; 4.4) [a] | 2.8 (2.3; 3.4) [a] |
Binge Drinking (%) | 43.4 (26.2; 60.6) [ab] | 46.4 (40.5; 52.3) [b] | 34.3 (28.7; 39.9) [a] |
Different letters (a, b, c) indicate statistically significant difference (p < 0.05) between education levels within a country or region after a statistically significant global test (p < 0.05).
No Letters (a, b, c) indicate no statistically significant difference (p ≥ 0.05) between education levels within a country or region and/or no statistically significant global test (p ≥ 0.05).
N refers to the number of participants with the education level in that country or region. See Appendix 6 for variable-specific sample sizes.
Binge Drinking is ≥5 standard drinks per drinking occasion at least once during the last month.
Alcohol consumption frequency over the past 12 months.
Alcohol consumption amount over the past seven days.
No Letters (a, b, c) indicate no statistically significant difference (p ≥ 0.05) between education levels within a country or region and/or no statistically significant global test (p ≥ 0.05).
N refers to the number of participants with the education level in that country or region. See Appendix 6 for variable-specific sample sizes.
Binge Drinking is ≥5 standard drinks per drinking occasion at least once during the last month.
Alcohol consumption frequency over the past 12 months.
Alcohol consumption amount over the past seven days.
N | 118 | 313 | 585 |
|---|---|---|---|
Alcohol consumption frequency (% ever) | 68.4 (59.2; 77.7) [b] | 78.8 (73.5; 84.2) [ab] | 82.3 (78.0; 86.6) [a] |
Alcohol consumption frequency (times per week) | 0.9 (0.6; 1.1) [a] | 1.4 (1.1; 1.6) [b] | 1.1 (1.0; 1.3) [ab] |
Alcohol consumption amount (standard drinks per week) | 1.9 (1.0; 2.8) | 2.6 (2.0; 3.3) | 2.9 (2.4; 3.3) |
Binge Drinking (%) | 29.1 (20.1; 38.1) | 39.3 (32.9; 45.7) | 39.4 (33.7; 45.1) |
Different letters (a, b, c) indicate statistically significant difference (p < 0.05) between education levels within a country or region after a statistically significant global test (p < 0.05).
No Letters (a, b, c) indicate no statistically significant difference (p ≥ 0.05) between education levels within a country or region and/or no statistically significant global test (p ≥ 0.05).
N refers to the number of participants with the education level in that country or region. See Appendix 6 for variable-specific sample sizes.
Binge Drinking is ≥5 standard drinks per drinking occasion at least once during the last month.
Alcohol consumption frequency over the past 12 months.
Alcohol consumption amount over the past seven days.
No Letters (a, b, c) indicate no statistically significant difference (p ≥ 0.05) between education levels within a country or region and/or no statistically significant global test (p ≥ 0.05).
N refers to the number of participants with the education level in that country or region. See Appendix 6 for variable-specific sample sizes.
Binge Drinking is ≥5 standard drinks per drinking occasion at least once during the last month.
Alcohol consumption frequency over the past 12 months.
Alcohol consumption amount over the past seven days.
N | 270 | 1829 | 2935 |
|---|---|---|---|
Alcohol consumption frequency (% ever) | 77.7 (72.5; 82.9) [b] | 83.8 (81.8; 85.7) [b] | 87.7 (86.2; 89.2) [a] |
Alcohol consumption frequency (times per week) | 1.6 (1.3; 2.0) | 1.5 (1.4; 1.6) | 1.5 (1.4; 1.6) |
Alcohol consumption amount (standard drinks per week) | 4.2 (3.2; 5.2) | 3.7 (3.3; 4.1) | 3.5 (3.2; 3.7) |
Binge Drinking (%) | 38.3 (31.9; 44.7) [ab] | 41.2 (38.5; 43.8) [b] | 36.6 (34.4; 38.8) [a] |
Different letters (a, b, c) indicate statistically significant difference (p < 0.05) between education levels within a country or region after a statistically significant global test (p < 0.05).
No Letters (a, b, c) indicate no statistically significant difference (p ≥ 0.05) between education levels within a country or region and/or no statistically significant global test (p ≥ 0.05).
N refers to the number of participants with the education level in that country or region. See Appendix 6 for variable-specific sample sizes.
Binge Drinking is ≥5 standard drinks per drinking occasion at least once during the last month.
Alcohol consumption frequency over the past 12 months.
Alcohol consumption amount over the past seven days.
No Letters (a, b, c) indicate no statistically significant difference (p ≥ 0.05) between education levels within a country or region and/or no statistically significant global test (p ≥ 0.05).
N refers to the number of participants with the education level in that country or region. See Appendix 6 for variable-specific sample sizes.
Binge Drinking is ≥5 standard drinks per drinking occasion at least once during the last month.
Alcohol consumption frequency over the past 12 months.
Alcohol consumption amount over the past seven days.
Discussion
Summary of results
In 2024, alcoholic beverages were consumed on average 1.5 times per week, and 39% of adults in the Nordic countries reported binge drinking at least once during the past month. The mean number of standard drinks consumed per week was 3.6.
Alcohol consumption was higher in Denmark than in the other countries, especially in terms of amount (standard drinks per week). Iceland had the fewest adults who drink alcohol, with 78% reporting alcohol use — about ten percentage points less than in the other countries.
The highest alcohol consumption was observed among men and 45–65-year-olds, identifying these groups as particularly relevant targets for public health initiatives.
The frequency of drinking has declined since 2014 in Finland (from 1.5 to 1.2 times per week). In the other countries, no significant differences were observed.
The highest proportion of people reporting binge drinking was found in Denmark, and binge drinking was more prevalent among men and 18–29-year-olds.
Interpretation
The consistently higher alcohol consumption in Denmark may be partly explained by structural differences in alcohol policy. Denmark is the only Nordic country without a state-owned retail alcohol monopoly, a system that has been shown to reduce alcohol consumption and harm. WHO/Europe highlights such Nordic alcohol monopolies as a comprehensive model for limiting alcohol-related harm (WHO 2025).
In addition, Denmark has the lowest legal age for purchasing alcohol in retail settings and the lowest taxation and prices, which likely contribute to higher consumption levels compared with its Nordic neighbors (Hallberg and Österberg 2014).
The timing of data collection may also play a small role. In 2024, Finland’s data were collected in autumn, as in all countries in 2014, while other countries collected data in spring–summer. Since alcohol consumption and binge drinking tend to rise during summer months (Knudsen & Skogen, 2015; Leifman & Gustafsson, 2004), seasonal differences could affect results slightly. However, as questions on frequency covered the past 12 months, the risk of bias is considered small.
The question on binge drinking, referring to the past month, could be more seasonally sensitive. However, since the proportion of people reporting binge drinking decreased significantly in Norway and Sweden and remained unchanged in the other countries, we cannot say that seasonality materially affected the findings.
Comparison to other results
The results in NORMO are consistent with several other surveys.
According to WHO (2025), per-capita alcohol sales measured in litres of pure alcohol per person per year have decreased in Finland, while remaining stable or showing small increases in the other Nordic countries.
The Finnish Drinking Habits Survey (THL 2023) similarly reports a decline in regular (at least weekly) alcohol consumption among both men and women between 2016 and 2023.
Findings from the Norwegian Survey of Alcohol, Tobacco and Drugs (FHI 2024) also support the NORMO results, showing that overall alcohol consumption has remained essentially unchanged in Norway since 2014.
In Sweden, the national public health survey (FoHM 2024) indicates that the proportion of people who ever consume alcohol has decreased since 2014, again aligning with the downward regional trend observed in NORMO.
Data from the Icelandic Directorate of Health (2025) show a similar overall trend to that observed in NORMO, although the NORMO figures for 2024 are slightly lower than the Icelandic estimates.
Strengths and limitations
A key strength of this survey's alcohol assessment portion is the ability to compare alcohol consumption patterns across all Nordic countries using harmonized indicators, providing a coherent regional overview of both current status and trends from 2014 to 2024. This comparability allows for identification of consistent regional patterns as well as meaningful national differences.
However, the analyses were descriptive and did not include statistical adjustments for potential confounding by age or gender, which may influence some observed differences between countries or subgroups. As such, results should be interpreted as population-level patterns rather than causal relationships.
References
Directorate of Health Iceland. (2025). The Public Health Watch. https://island.is/en/lydheilsuvaktin
Finnish Institute for Health and Welfare (THL). (2023). Finnish drinking habits 2023. https://thl.fi/en/statistics-and-data/statistics-by-topic/alcohol-drugs-and-addiction/finnish-drinking-habits
Hallberg, J., & Österberg, E. (2014). Information on the Nordic alcohol market 2014. Alko Inc. & National Institute for Health and Welfare (THL).
Knudsen, A. K., & Skogen, J. C. (2015). Monthly variations in self-report of time-specified and typical alcohol use: The Nord-Trøndelag Health Study (HUNT3). BMC Public Health, 15, 172. https://doi.org/10.1186/s12889-015-1526-6
Leifman, H., & Gustafsson, N. K. (2004). Drickandets temporala struktur: Analyser av alkoholkonsumtionens och berusningsdrickandets månatliga variationer i Sverige. Nordic Studies on Alcohol and Drugs, 21(1), 5–30.
Norwegian Institute of Public Health (NIPH). (2024). Norwegian Survey of Alcohol, Tobacco and Drugs. https://www.fhi.no/en/nc/Indicators-for-NCD/alcohol/alkoholforbruk-per-innbygger-indikator-3/
Public Health Agency of Sweden (FoHM). (2024). The national public health survey [in Swedish]. https://www.folkhalsomyndigheten.se/livsvillkor-levnadsvanor/andts/andts-anvandning-och-ohalsa/anvandning-och-omfattning-av-andts-i-befolkningen/alkoholkonsumtion/alkoholkonsumtion-bland-vuxna/
World Health Organization. (2025a). WHO/Europe highlights Nordic alcohol monopolies as a comprehensive model for reducing alcohol consumption and harm. https://www.who.int/europe/news-room/03-02-2025-who-europe-highlights-nordic-alcohol-monopolies-as-a-comprehensive-model-for-reducing-alcohol-consumption-and-harm
World Health Organization. (2025b). The Global Health Observatory: Alcohol, recorded per capita (15+) consumption.https://www.who.int/data/gho/data/indicators/indicator-details/GHO/alcohol-recorded-per-capita-(15-)-consumption-(in-litres-of-pure-alcohol)