Physical Activity and Sedentary Behaviour
Background
Physical activity plays a crucial role in preventing non-communicable diseases (NCDs) such as cardiovascular diseases, obesity, type 2 diabetes, and certain cancers, and it significantly reduces the risk of all-cause mortality. Despite this, physical inactivity remains one of the leading global risk factors for NCDs and premature death. Recent estimates suggest that over 30% of adults worldwide are insufficiently active, and this figure is projected to rise unless effective interventions are implemented (WHO 2024; Strain et al. 2024).
Sedentary behaviour has emerged as an independent risk factor for adverse health outcomes, separate from physical inactivity. Excessive sitting—particularly recreational screen time—is associated with increased risks of cardiovascular disease, type 2 diabetes, weight gain, and premature mortality in adults, as well as poorer fitness and cardiometabolic health in children and adolescents (Thorp et al. 2011; Stamatakis et al. 2011; Dunstan et al. 2012; Carson et al. 2016; Physical Activity Guidelines Advisory Committee 2018; Okely et al. 2019).
Increased physical activity reduces risk of chronic disease while potentially decreasing transport’s contribution to global CO₂ emissions (Bjørnarå et al. 2017). Active transportation—walking and cycling—represents both a carbon-friendly mode of transport and an opportunity for daily physical activity. Physical activity conducted locally can favour sustainability through reduced fossil fuel use and less need for motorized transport.
Background Analytical notes Key findings Results – Adults Results – Children Discussion References |
Background
Physical activity plays a crucial role in preventing non-communicable diseases (NCDs) such as cardiovascular diseases, obesity, type 2 diabetes, and certain cancers, and it significantly reduces the risk of all-cause mortality. Despite this, physical inactivity remains one of the leading global risk factors for NCDs and premature death. Recent estimates suggest that over 30% of adults worldwide are insufficiently active, and this figure is projected to rise unless effective interventions are implemented (WHO 2024; Strain et al. 2024).
Sedentary behaviour has emerged as an independent risk factor for adverse health outcomes, separate from physical inactivity. Excessive sitting—particularly recreational screen time—is associated with increased risks of cardiovascular disease, type 2 diabetes, weight gain, and premature mortality in adults, as well as poorer fitness and cardiometabolic health in children and adolescents (Thorp et al. 2011; Stamatakis et al. 2011; Dunstan et al. 2012; Carson et al. 2016; Physical Activity Guidelines Advisory Committee 2018; Okely et al. 2019).
Increased physical activity reduces risk of chronic disease while potentially decreasing transport’s contribution to global CO₂ emissions (Bjørnarå et al. 2017). Active transportation—walking and cycling—represents both a carbon-friendly mode of transport and an opportunity for daily physical activity. Physical activity conducted locally can favour sustainability through reduced fossil fuel use and less need for motorized transport.
Analytical Notes
Population levels of physical activity and sedentary behaviour in the Nordic countries are presented in this chapter, along with trends from 2014 to 2024 for Finland. Since data collection occurred in different seasons in 2014 and 2024, no direct comparison between years can be made for other countries, as seasonality may influence physical activity levels.
High leisure screen time is defined as more than four hours per day of sedentary TV and/or computer time during leisure. Physical inactivity is defined as not meeting the recommended levels of physical activity (WHO 2020).
Unless otherwise noted, all differences between specific groups (country, age, gender, education level) mentioned in the text and tables are statistically significant (p < 0.05), while comparisons to the Nordic average are qualitative.
Because of differences in timing of data collection, Finnish results are presented separately from the other Nordic countries and no Nordic averages are presented.
Exact p-values can be found in the Appendix 5. For each analysis, all available observations with non-missing values for the specific variable being analyzed and the relevant grouping variable(s) were included. For variable-specific sample sizes, see Appendix 6. Exact values used in the figures are available in Appendix 7.
Key findings
Status 2024
- About one in four to one in three adults were physically inactive across the Nordic countries, with little difference between adult men and women.
- Walking or cycling time varied substantially—among adults from about 2 hours per week in Iceland to 5 hours in Sweden, and among children from 2 hours in Denmark to 5 hours in Finland.
- On average, adults spent around 3.5–4 hours per day on recreational screen use; roughly one in four reported high screen time (> 4 h/day).
- Physical inactivity affected roughly one in three children in Iceland and Finland and about half in other Nordic countries.
- Children spent between 2.75 and 3.5 hours per day on recreational screen time, and 12–16 % exceeded four hours daily.
Trends 2014–2024 (only Finland)
- Finnish adults showed stable activity levels from 2014 to 2024.
- In Finnish children, moderate to vigorous physical activity increased slightly from 2014 to 2024, while physical inactivity decreased (not statistically significant).
Demographic patterns
Age
- Younger adults (18–24 y) were more active but also reported higher recreational screen time than older adults.
Education
- Higher education in adults was linked to lower inactivity in all countries except Finland.
- In Denmark, adults with high levels of education also spent more time walking or cycling. Children of parents with high levels of education were more active and spent more time walking or cycling—only in Denmark.
Gender
- There was a general trend of boys spending more time on moderate to vigorous physical activity than girls (significantly in Denmark, Finland, and Iceland), and girls having higher rates of inactivity (significantly in Norway and Iceland).
- Boys also had a significantly higher prevalence of high screen time than girls in Denmark and Norway
Results – Adults
Status 2024
In 2024, adults across all Nordic countries reported spending an average of 5 to 5.6 hours per week on MVPA during leisure time. Weekly time spent in moderate-to-vigorous physical activity was highest in Denmark and Norway (5.6 hours) and lowest in Sweden, Finland and Iceland (5.0 hours).
The proportion of adults not meeting the physical activity recommendations ranged from 24.0% in Denmark to 30.5% in Sweden, with Finland (25.0%), Norway (29.8%) and Iceland (28.6%) in between.
Adults also spent nearly four hours per day on recreational screen time, which is close to the threshold for high sedentary behaviour. The proportion with high screen time (defined as more than four hours per day) ranged from 23% in Iceland to 29% in Norway.
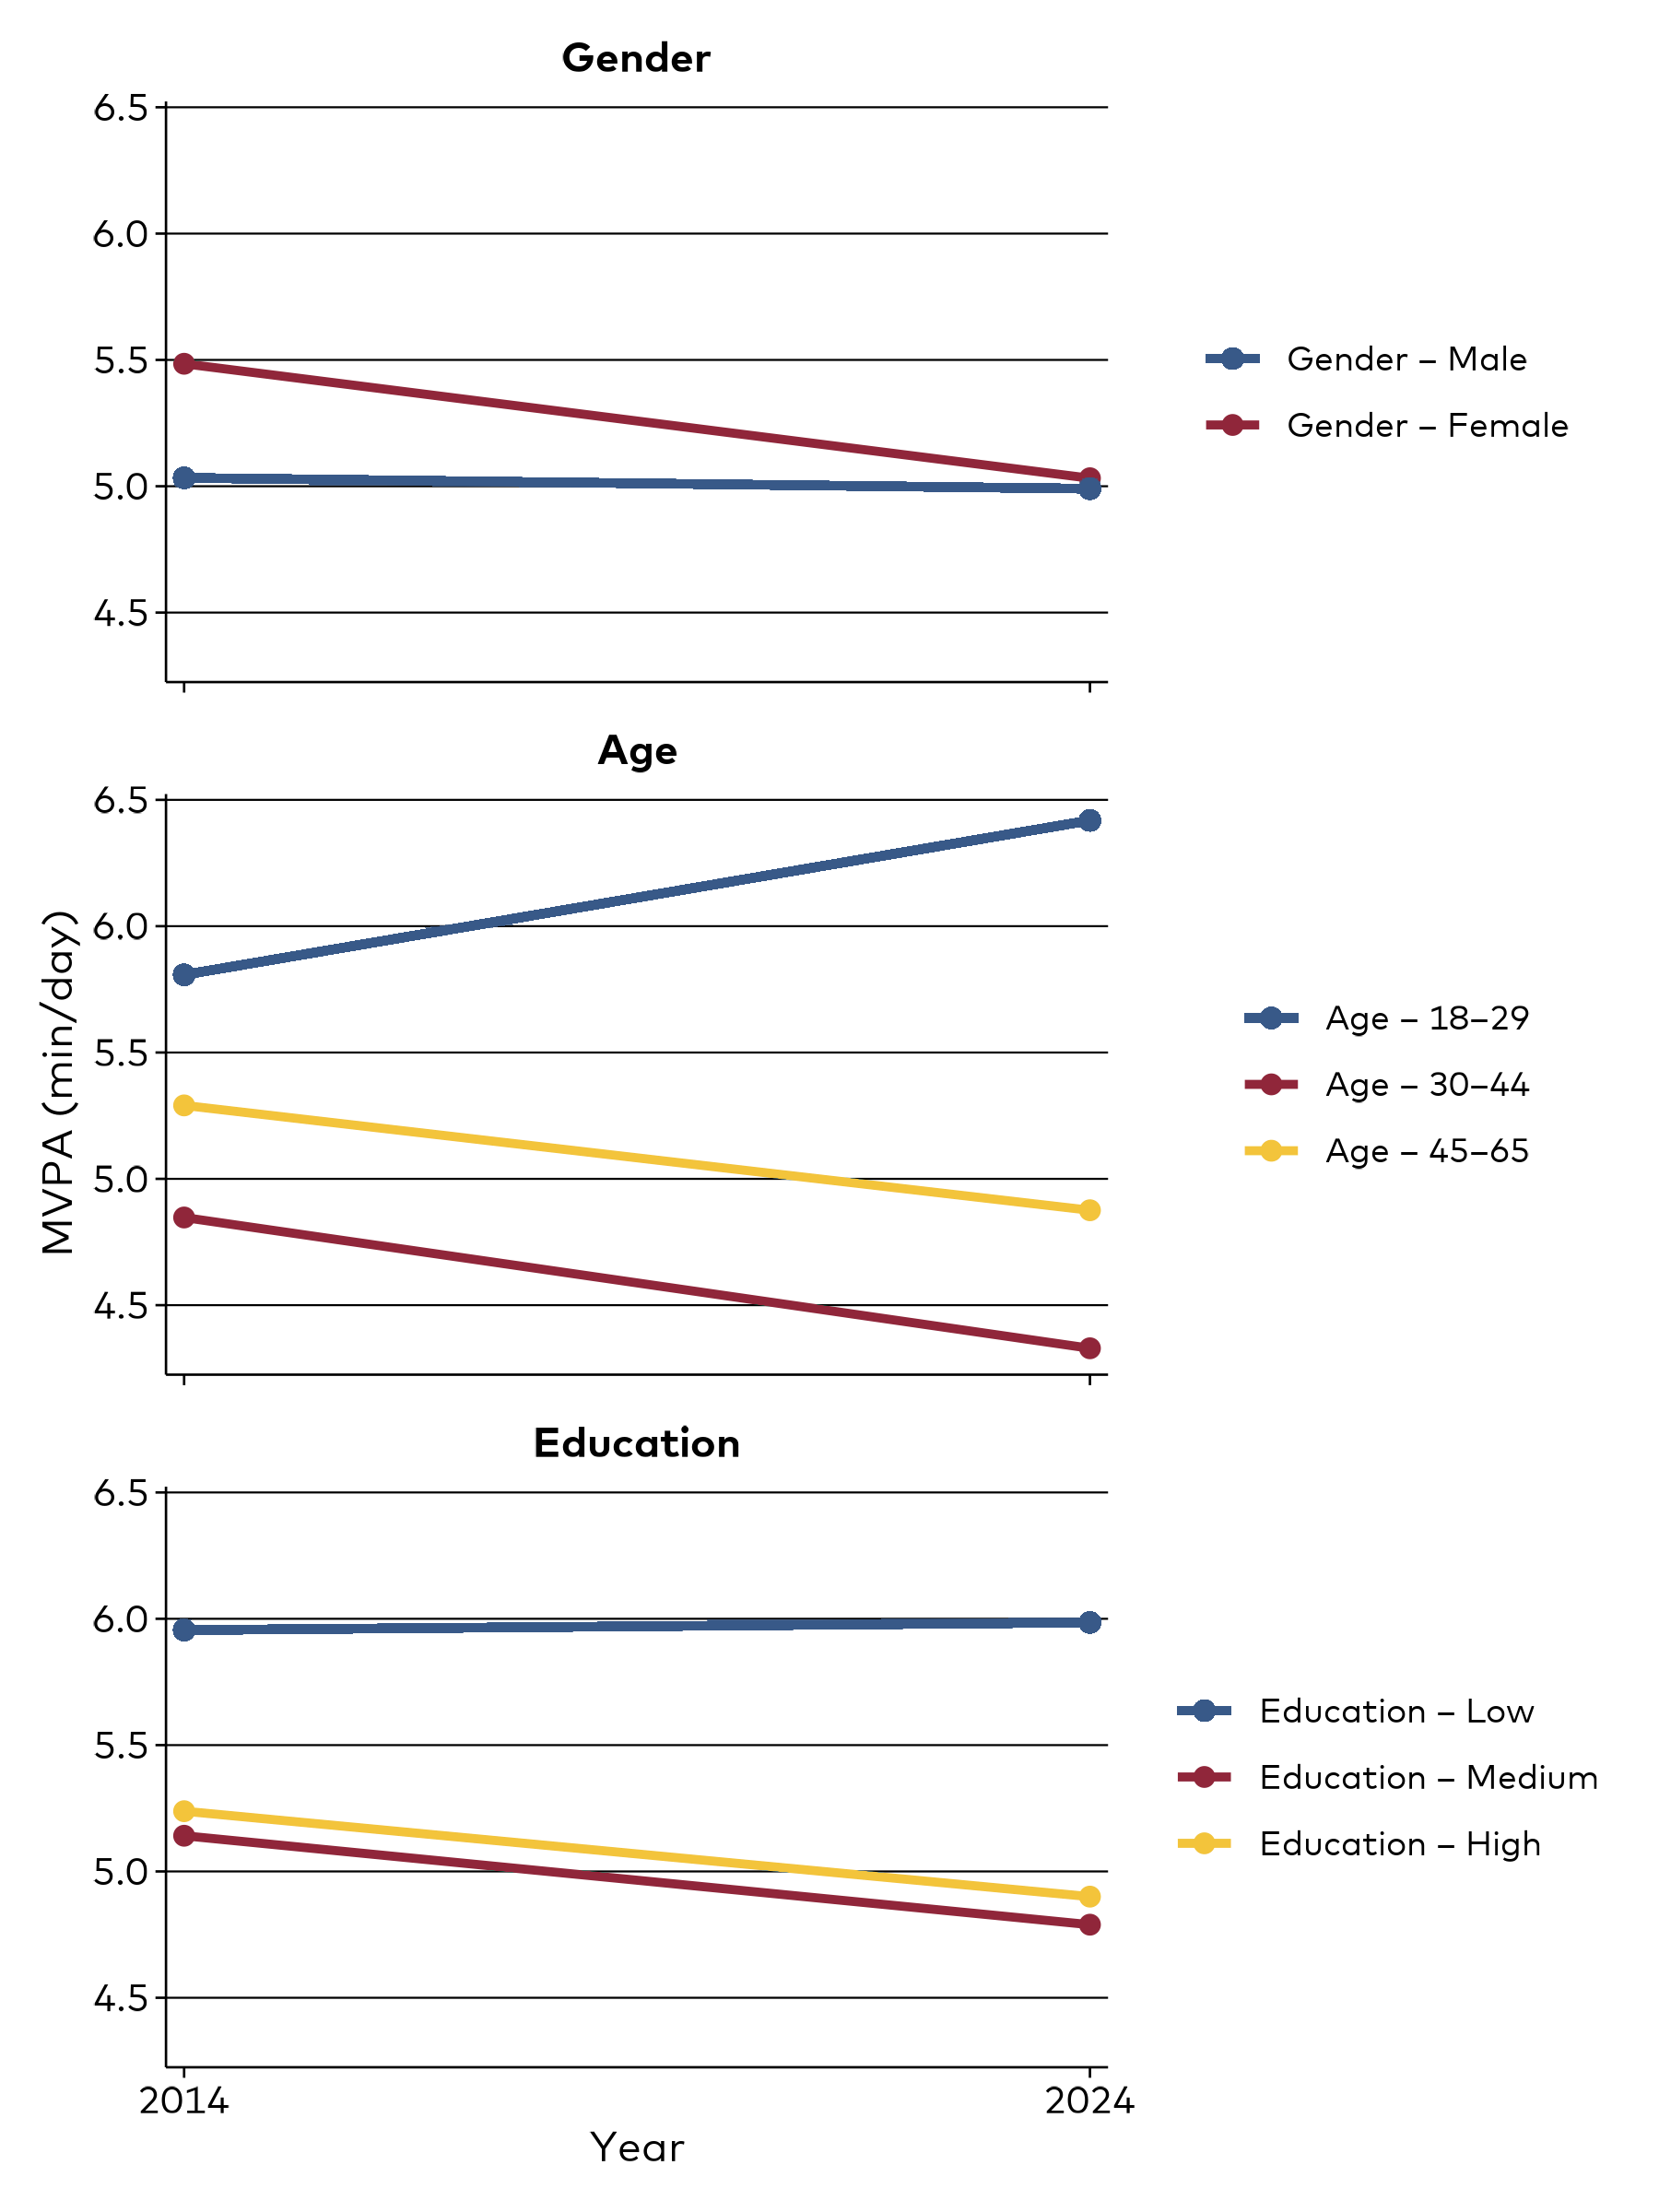
Trends 2014–2024 (Finland)
Overall, no statistically significant changes in MVPA or physical inactivity rates were seen in Finland from 2014 to 2024.

Results – Adults
Status 2024
In 2024, adults across all Nordic countries reported spending an average of 5 to 5.6 hours per week on MVPA during leisure time. Weekly time spent in moderate-to-vigorous physical activity was highest in Denmark and Norway (5.6 hours) and lowest in Sweden, Finland and Iceland (5.0 hours).
The proportion of adults not meeting the physical activity recommendations ranged from 24.0% in Denmark to 30.5% in Sweden, with Finland (25.0%), Norway (29.8%) and Iceland (28.6%) in between.
Adults also spent nearly four hours per day on recreational screen time, which is close to the threshold for high sedentary behaviour. The proportion with high screen time (defined as more than four hours per day) ranged from 23% in Iceland to 29% in Norway.
Trends 2014–2024 (Finland)
Overall, no statistically significant changes in MVPA or physical inactivity rates were seen in Finland from 2014 to 2024.
N | 1717 | 1020 |
|---|---|---|
Physical inactivity (Not meeting WHO2020 Guidelines) (%) | 24.4 (21.9; 26.8) | 25.0 (21.3; 28.7) |
High screen time (> 4 hours per day) (%) | 26.1 (22.1; 30.2) | |
Moderate-Vigorous Physical Activity (hours per week) | 5.3 (5.0; 5.5) | 5.0 (4.6; 5.4) |
Time spent in front of a screen per leisure (hours per day) | 3.6 (3.4; 3.8) | |
Time spent walking or cycling (hours per week) | 3.5 (3.2; 3.9) |
No statistically significant differences (p < 0.05) were found.
Grey cells indicate values not collected and/or not valid for comparison.
N refers to the number of participants in that survey year in Finland. See Appendix 6 for variable-specific sample sizes.
Grey cells indicate values not collected and/or not valid for comparison.
N refers to the number of participants in that survey year in Finland. See Appendix 6 for variable-specific sample sizes.
N | 1004 | 1010 | 999 | 1021 |
|---|---|---|---|---|
Physical inactivity (Not meeting WHO2020 Guidelines) (%) | 24.0 (20.5; 27.5) | 29.8 (25.5; 34.1) | 30.5 (26.5; 34.5) | 28.6 (24.9; 32.4) |
High screen time (> 4 hours per day) (%) | 25.4 (21.8; 29.1) | 29.0 (24.8; 33.2) | 23.5 (19.9; 27.0) | 23.2 (19.5; 26.9) |
Moderate-Vigorous Physical Activity (hours per week) | 5.6 (5.2; 6.0) | 5.6 (5.1; 6.1) | 5.0 (4.6; 5.4) | 5.0 (4.6; 5.3) |
Time spent in front of a screen per leisure (hours per day) | 3.6 (3.4; 3.8) | 3.7 (3.5; 4.0) | 3.6 (3.4; 3.8) | 3.6 (3.4; 3.8) |
Time spent walking or cycling (hours per week) | 3.4 (3.1; 3.8) | 2.5 (2.1; 2.9) | 5.0 (4.5; 5.6) | 1.9 (1.6; 2.1) |
N refers to the number of participants in that country. See Appendix 6 for variable-specific sample sizes.
Demographic Differences
Gender
There were no statistically significant gender differences in any of the Nordic countries. However, the prevalence of physical inactivity tended to be higher among men in all countries except Norway.
Among men, inactivity ranged from 25.4% in Denmark to 34.1% in Sweden, while among women it ranged from 22.5% in Denmark to 29.8% in Norway.
The average time spent on moderate-to-vigorous physical activity (MVPA) ranged from 5 hours in Finland to 6 hours in Norway among men, and from 4.8 hours in Iceland to 5.5 hours in Denmark among women.
N | 480 | 540 |
|---|---|---|
Physical inactivity (Not meeting WHO2020 Guidelines) (%) | 26.5 (21.3; 31.8) | 23.0 (18.0; 28.0) |
High screen time (> 4 hours per day) (%) | 25.0 (19.5; 30.4) | 27.6 (21.6; 33.5) |
Moderate-Vigorous Physical Activity (hours per week) | 5.0 (4.4; 5.6) | 5.0 (4.5; 5.5) |
Time spent in front of a screen per leisure (hours per day) | 3.6 (3.3; 3.8) | 3.6 (3.3; 3.9) |
Time spent walking or cycling (hours per week) | 3.3 (2.8; 3.9) | 3.8 (3.4; 4.2) |
No statistically significant differences (p < 0.05) were found.
N refers to the number of participants in that survey year in Finland. See Appendix 6 for variable-specific sample sizes.
N refers to the number of participants in that survey year in Finland. See Appendix 6 for variable-specific sample sizes.
N | 482 | 522 |
|---|---|---|
Physical inactivity (Not meeting WHO2020 Guidelines) (%) | 25.4 (20.2; 30.6) | 22.5 (18.0; 27.0) |
High screen time (> 4 hours per day) (%) | 28.1 (22.6; 33.5) | 22.7 (17.9; 27.4) |
Moderate-Vigorous Physical Activity (hours per week) | 5.7 (5.1; 6.4) | 5.5 (5.0; 6.0) |
Time spent in front of a screen per leisure (hours per day) | 3.7 (3.4; 4.0) | 3.5 (3.3; 3.8) |
Time spent walking or cycling (hours per week) | 3.4 (2.8; 4.0) | 3.5 (3.0; 3.9) |
No statistically significant differences (p < 0.05) were found.
N refers to the number of participants with that gender in that country. See Appendix 6 for variable-specific sample sizes.
N refers to the number of participants with that gender in that country. See Appendix 6 for variable-specific sample sizes.
N | 499 | 511 |
|---|---|---|
Physical inactivity (Not meeting WHO2020 Guidelines) (%) | 29.8 (23.9; 35.8) | 29.8 (23.7; 35.9) |
High screen time (> 4 hours per day) (%) | 25.3 (19.7; 30.9) | 33.0 (26.7; 39.2) |
Moderate-Vigorous Physical Activity (hours per week) | 6.0 (5.2; 6.8) | 5.1 (4.5; 5.6) |
Time spent in front of a screen per leisure (hours per day) | 3.6 (3.3; 3.9) | 3.9 (3.5; 4.3) |
Time spent walking or cycling (hours per week) | 2.1 (1.7; 2.5) | 2.9 (2.1; 3.7) |
No statistically significant differences (p < 0.05) were found.
N refers to the number of participants with that gender in that country. See Appendix 6 for variable-specific sample sizes.
N refers to the number of participants with that gender in that country. See Appendix 6 for variable-specific sample sizes.
N | 463 | 536 |
|---|---|---|
Physical inactivity (Not meeting WHO2020 Guidelines) (%) | 34.1 (28.1; 40.1) | 26.6 (21.5; 31.6) |
High screen time (> 4 hours per day) (%) | 26.5 (21.2; 31.7) | 20.3 (15.5; 25.2) |
Moderate-Vigorous Physical Activity (hours per week) | 5.2 (4.5; 5.8) | 4.9 (4.4; 5.4) |
Time spent in front of a screen per leisure (hours per day) | 3.7 (3.4; 4.0) | 3.4 (3.1; 3.7) |
Time spent walking or cycling (hours per week) | 5.1 (4.2; 6.0) | 5.0 (4.3; 5.7) |
No statistically significant differences (p < 0.05) were found.
N refers to the number of participants with that gender in that country. See Appendix 6 for variable-specific sample sizes.
N refers to the number of participants with that gender in that country. See Appendix 6 for variable-specific sample sizes.
N | 439 | 582 |
|---|---|---|
Physical inactivity (Not meeting WHO2020 Guidelines) (%) | 30.3 (24.9; 35.8) | 26.8 (21.7; 31.9) |
High screen time (> 4 hours per day) (%) | 21.8 (16.6; 27.1) | 24.7 (19.6; 29.8) |
Moderate-Vigorous Physical Activity (hours per week) | 5.1 (4.6; 5.7) | 4.8 (4.4; 5.3) |
Time spent in front of a screen per leisure (hours per day) | 3.4 (3.1; 3.7) | 3.8 (3.4; 4.1) |
Time spent walking or cycling (hours per week) | 1.8 (1.4; 2.2) | 1.9 (1.6; 2.3) |
No statistically significant differences (p < 0.05) were found.
N refers to the number of participants with that gender in that country. See Appendix 6 for variable-specific sample sizes.
N refers to the number of participants with that gender in that country. See Appendix 6 for variable-specific sample sizes.
Age
Statistically significant age-related differences were observed primarily for sedentary behaviour. The youngest adults (18–24 years) spent more time on recreational screen use than older adults (45-65 years) across all Nordic countries.
Among the 18–24 year olds, screen time ranged from 4.1 hours per day in Denmark to 4.9 hours per day in Norway, compared with 3.2 hours per day in Iceland to 3.4 hours per day in Norway, Denmark, and Finland among the 45-65 year olds.
The proportion reporting high recreational screen time (> 4 hours/day) was also highest among 18–24 year olds compared to 45-65 year olds - 48.2% vs. 23% in Norway and 36.1% vs. 17.4% in Sweden.
N | 71 | 248 | 701 |
|---|---|---|---|
Physical inactivity (Not meeting WHO2020 Guidelines) (%) | 17.5 (8.4; 26.6) | 24.8 (19.3; 30.3) | 29.0 (23.4; 34.6) |
High screen time (> 4 hours per day) (%) | 37.3 (25.6; 49.0) | 22.0 (16.7; 27.3) | 23.9 (18.1; 29.6) |
Moderate-Vigorous Physical Activity (hours per week) | 6.4 (5.1; 7.7) [a] | 4.3 (3.9; 4.8) [b] | 4.9 (4.3; 5.4) [ab] |
Time spent in front of a screen per leisure (hours per day) | 4.3 (3.8; 4.8) [b] | 3.4 (3.1; 3.7) [a] | 3.4 (3.0; 3.7) [a] |
Time spent walking or cycling (hours per week) | 3.6 (2.5; 4.7) | 3.3 (2.9; 3.8) | 3.7 (3.2; 4.2) |
Different letters (a, b, c) indicate statistically significant difference (p < 0.05) between age groups within a country after a statistically significant global test (p < 0.05).
No letters (a, b, c) indicate no statistically significant difference (p ≥ 0.05) between age groups within a country and/or no statistically significant global test (p ≥ 0.05).
N refers to the number of participants in that age group in that country. See Appendix 6 for variable-specific sample sizes.
N | 115 | 248 | 641 |
|---|---|---|---|
Physical inactivity (Not meeting WHO2020 Guidelines) (%) | 21.8 (13.6; 30.0) | 23.0 (16.9; 29.1) | 26.0 (21.5; 30.6) |
High screen time (> 4 hours per day) (%) | 31.4 (22.2; 40.5) | 22.5 (16.3; 28.7) | 24.1 (19.4; 28.8) |
Moderate-Vigorous Physical Activity (hours per week) | 6.3 (5.3; 7.3) | 5.1 (4.4; 5.8) | 5.6 (5.1; 6.2) |
Time spent in front of a screen per leisure (hours per day) | 4.1 (3.7; 4.6) [b] | 3.4 (3.0; 3.8) [a] | 3.4 (3.2; 3.6) [a] |
Time spent walking or cycling (hours per week) | 3.7 (2.7; 4.6) | 3.0 (2.5; 3.4) | 3.6 (3.1; 4.2) |
Different letters (a, b, c) indicate statistically significant difference (p < 0.05) between age groups within a country after a statistically significant global test (p < 0.05).
No letters (a, b, c) indicate no statistically significant difference (p ≥ 0.05) between age groups within a country and/or no statistically significant global test (p ≥ 0.05).
N refers to the number of participants in that age group in that country. See Appendix 6 for variable-specific sample sizes.
N | 121 | 245 | 644 |
|---|---|---|---|
Physical inactivity (Not meeting WHO2020 Guidelines) (%) | 24.4 (13.7; 35.1) | 36.3 (29.2; 43.4) | 28.1 (22.0; 34.2) |
High screen time (> 4 hours per day) (%) | 48.2 (37.7; 58.7) [b] | 25.4 (18.3; 32.5) [a] | 23.0 (17.5; 28.6) [a] |
Moderate-Vigorous Physical Activity (hours per week) | 7.0 (5.6; 8.4) [a] | 4.9 (4.0; 5.8) [b] | 5.3 (4.7; 6.0) [ab] |
Time spent in front of a screen per leisure (hours per day) | 4.9 (4.1; 5.7) [b] | 3.4 (3.1; 3.8) [a] | 3.4 (3.1; 3.7) [a] |
Time spent walking or cycling (hours per week) | 2.9 (2.1; 3.6) | 2.1 (1.5; 2.6) | 2.6 (1.9; 3.3) |
Different letters (a, b, c) indicate statistically significant difference (p < 0.05) between age groups within a country after a statistically significant global test (p < 0.05).
No letters (a, b, c) indicate no statistically significant difference (p ≥ 0.05) between age groups within a country and/or no statistically significant global test (p ≥ 0.05).
N refers to the number of participants in that age group in that country. See Appendix 6 for variable-specific sample sizes.
No letters (a, b, c) indicate no statistically significant difference (p ≥ 0.05) between age groups within a country and/or no statistically significant global test (p ≥ 0.05).
N refers to the number of participants in that age group in that country. See Appendix 6 for variable-specific sample sizes.
N | 78 | 335 | 586 |
|---|---|---|---|
Physical inactivity (Not meeting WHO2020 Guidelines) (%) | 24.0 (13.1; 34.9) | 30.9 (25.0; 36.8) | 33.6 (28.0; 39.1) |
High screen time (> 4 hours per day) (%) | 36.1 (25.1; 47.1) [b] | 22.5 (17.6; 27.4) [ab] | 17.4 (13.3; 21.5) [a] |
Moderate-Vigorous Physical Activity (hours per week) | 5.5 (4.3; 6.7) | 4.9 (4.4; 5.5) | 4.8 (4.3; 5.3) |
Time spent in front of a screen per leisure (hours per day) | 4.2 (3.6; 4.7) [b] | 3.6 (3.2; 3.9) [ab] | 3.3 (3.0; 3.6) [a] |
Time spent walking or cycling (hours per week) | 4.7 (3.3; 6.2) | 5.1 (4.3; 5.9) | 5.1 (4.3; 6.0) |
Different letters (a, b, c) indicate statistically significant difference (p < 0.05) between age groups within a country after a statistically significant global test (p < 0.05).
No letters (a, b, c) indicate no statistically significant difference (p ≥ 0.05) between age groups within a country and/or no statistically significant global test (p ≥ 0.05).
N refers to the number of participants in that age group in that country. See Appendix 6 for variable-specific sample sizes.
No letters (a, b, c) indicate no statistically significant difference (p ≥ 0.05) between age groups within a country and/or no statistically significant global test (p ≥ 0.05).
N refers to the number of participants in that age group in that country. See Appendix 6 for variable-specific sample sizes.
N | 86 | 307 | 628 |
|---|---|---|---|
Physical inactivity (Not meeting WHO2020 Guidelines) (%) | 20.3 (11.5; 29.1) [b] | 26.4 (20.8; 32.0) [b] | 36.3 (31.0; 41.6) [a] |
High screen time (> 4 hours per day) (%) | 30.5 (20.2; 40.8) [a] | 24.2 (18.7; 29.7) [a] | 17.5 (13.4; 21.7) [a] |
Moderate-Vigorous Physical Activity (hours per week) | 5.7 (4.8; 6.7) [b] | 5.1 (4.6; 5.6) [ab] | 4.4 (4.0; 4.8) [a] |
Time spent in front of a screen per leisure (hours per day) | 4.2 (3.5; 4.8) [b] | 3.5 (3.2; 3.9) [ab] | 3.2 (3.0; 3.5) [a] |
Time spent walking or cycling (hours per week) | 1.8 (1.2; 2.4) | 1.8 (1.4; 2.1) | 2.0 (1.6; 2.4) |
Different letters (a, b, c) indicate statistically significant difference (p < 0.05) between age groups within a country after a statistically significant global test (p < 0.05).
No letters (a, b, c) indicate no statistically significant difference (p ≥ 0.05) between age groups within a country and/or no statistically significant global test (p ≥ 0.05).
N refers to the number of participants in that age group in that country. See Appendix 6 for variable-specific sample sizes.
No letters (a, b, c) indicate no statistically significant difference (p ≥ 0.05) between age groups within a country and/or no statistically significant global test (p ≥ 0.05).
N refers to the number of participants in that age group in that country. See Appendix 6 for variable-specific sample sizes.
Education
Educational differences were evident in both physical activity and sedentary behaviour. The prevalence of physical inactivity was consistently higher among adults with low levels of education compared to those with high levels of education—38.0% vs. 18.8% in Iceland, 54.0% vs. 19.0% in Norway, and 61.1% vs. 23.3% in Sweden.
Similarly, high recreational screen time (> 4 hours/day) was more common among adults in the low education group than among the adults in the high education group, with 41.2% vs. 20.5% in Denmark, 45.8 % vs. 20.9 % in Norway, and 30.2% vs. 18.0% in Iceland.
N | 34 | 434 | 550 |
|---|---|---|---|
Physical inactivity (Not meeting WHO2020 Guidelines) (%) | 21.1 (7.0; 35.3) | 28.5 (23.2; 33.8) | 21.9 (17.2; 26.5) |
High screen time (> 4 hours per day) (%) | 33.0 (16.8; 49.3) | 29.1 (23.4; 34.8) | 20.7 (15.8; 25.6) |
Moderate-Vigorous Physical Activity (hours per week) | 6.0 (4.0; 8.0) | 4.8 (4.3; 5.3) | 4.9 (4.4; 5.4) |
Time spent in front of a screen per leisure (hours per day) | 3.7 (2.8; 4.5) | 3.7 (3.5; 4.0) | 3.4 (3.1; 3.7) |
Time spent walking or cycling (hours per week) | 3.0 (2.0; 3.9) | 3.5 (2.9; 4.0) | 3.6 (3.2; 4.1) |
Different letters (a, b, c) indicate statistically significant difference (p < 0.05) between education levels within a country after a statistically significant global test (p < 0.05).
No letters (a, b, c) indicate no statistically significant difference (p ≥ 0.05) between education levels within a country and/or no statistically significant global test (p ≥ 0.05).
N refers to the number of participants in that education level in that country. See Appendix 6 for variable-specific sample sizes.
N | 55 | 367 | 578 |
|---|---|---|---|
Physical inactivity (Not meeting WHO2020 Guidelines) (%) | 28.8 (15.3; 42.2) [ab] | 28.0 (22.8; 33.3) [b] | 17.8 (14.3; 21.3) [a] |
High screen time (> 4 hours per day) (%) | 41.2 (27.8; 54.7) [b] | 24.0 (18.9; 29.1) [a] | 20.5 (16.6; 24.4) [a] |
Moderate-Vigorous Physical Activity (hours per week) | 5.9 (4.2; 7.5) | 5.4 (4.8; 6.0) | 5.7 (5.3; 6.1) |
Time spent in front of a screen per leisure (hours per day) | 4.0 (3.5; 4.6) | 3.6 (3.3; 3.9) | 3.4 (3.2; 3.7) |
Time spent walking or cycling (hours per week) | 4.0 (2.7; 5.4) [ab] | 2.9 (2.4; 3.3) [b] | 3.8 (3.3; 4.3) [a] |
Different letters (a, b, c) indicate statistically significant difference (p < 0.05) between education levels within a country after a statistically significant global test (p < 0.05).
No letters (a, b, c) indicate no statistically significant difference (p ≥ 0.05) between education levels within a country and/or no statistically significant global test (p ≥ 0.05).
N refers to the number of participants in that education level in that country. See Appendix 6 for variable-specific sample sizes.
N | 31 | 338 | 637 |
|---|---|---|---|
Physical inactivity (Not meeting WHO2020 Guidelines) (%) | 54.0 (34.8; 73.3) [b] | 31.6 (26.2; 37.0) [b] | 19.0 (15.6; 22.5) [a] |
High screen time (> 4 hours per day) (%) | 45.8 (27.5; 64.0) [b] | 30.1 (24.8; 35.5) [b] | 20.9 (17.1; 24.7) [a] |
Moderate-Vigorous Physical Activity (hours per week) | 5.1 (2.5; 7.6) | 5.7 (5.1; 6.3) | 5.7 (5.3; 6.1) |
Time spent in front of a screen per leisure (hours per day) | 4.9 (3.7; 6.2) [b] | 3.7 (3.4; 4.0) [ab] | 3.3 (3.1; 3.5) [a] |
Time spent walking or cycling (hours per week) | 2.1 (-0.3; 4.5) | 2.4 (1.9; 2.8) | 2.7 (2.4; 3.1) |
Different letters (a, b, c) indicate statistically significant difference (p < 0.05) between education levels within a country after a statistically significant global test (p < 0.05).
No letters (a, b, c) indicate no statistically significant difference (p ≥ 0.05) between education levels within a country and/or no statistically significant global test (p ≥ 0.05).
N refers to the number of participants in that education level in that country. See Appendix 6 for variable-specific sample sizes.
No letters (a, b, c) indicate no statistically significant difference (p ≥ 0.05) between education levels within a country and/or no statistically significant global test (p ≥ 0.05).
N refers to the number of participants in that education level in that country. See Appendix 6 for variable-specific sample sizes.
N | 32 | 377 | 585 |
|---|---|---|---|
Physical inactivity (Not meeting WHO2020 Guidelines) (%) | 61.1 (43.4; 78.9) [b] | 29.1 (23.8; 34.4) [a] | 23.3 (19.2; 27.3) [a] |
High screen time (> 4 hours per day) (%) | 21.4 (6.0; 36.7) | 26.2 (20.7; 31.7) | 22.5 (18.0; 27.0) |
Moderate-Vigorous Physical Activity (hours per week) | 3.4 (1.9; 4.9) | 5.4 (4.7; 6.0) | 5.2 (4.7; 5.6) |
Time spent in front of a screen per leisure (hours per day) | 3.7 (2.7; 4.8) | 3.7 (3.4; 4.0) | 3.5 (3.2; 3.8) |
Time spent walking or cycling (hours per week) | 5.4 (2.6; 8.2) | 5.4 (4.6; 6.3) | 4.4 (3.9; 5.0) |
Different letters (a, b, c) indicate statistically significant difference (p < 0.05) between education levels within a country after a statistically significant global test (p < 0.05).
No letters (a, b, c) indicate no statistically significant difference (p ≥ 0.05) between education levels within a country and/or no statistically significant global test (p ≥ 0.05).
N refers to the number of participants in that education level in that country. See Appendix 6 for variable-specific sample sizes.
No letters (a, b, c) indicate no statistically significant difference (p ≥ 0.05) between education levels within a country and/or no statistically significant global test (p ≥ 0.05).
N refers to the number of participants in that education level in that country. See Appendix 6 for variable-specific sample sizes.
N | 118 | 313 | 585 |
|---|---|---|---|
Physical inactivity (Not meeting WHO2020 Guidelines) (%) | 38.0 (28.4; 47.5) [b] | 32.2 (26.2; 38.1) [b] | 18.8 (14.1; 23.5) [a] |
High screen time (> 4 hours per day) (%) | 30.2 (20.9; 39.5) [a] | 23.8 (17.8; 29.7) [a] | 18.0 (13.5; 22.5) [a] |
Moderate-Vigorous Physical Activity (hours per week) | 3.5 (2.9; 4.1) [b] | 5.3 (4.6; 6.0) [a] | 5.6 (5.2; 6.1) [a] |
Time spent in front of a screen per leisure (hours per day) | 4.0 (3.4; 4.5) [a] | 3.6 (3.3; 4.0) [a] | 3.3 (3.0; 3.5) [a] |
Time spent walking or cycling (hours per week) | 1.7 (1.0; 2.3) | 2.1 (1.6; 2.6) | 1.7 (1.5; 2.0) |
Different letters (a, b, c) indicate statistically significant difference (p < 0.05) between education levels within a country after a statistically significant global test (p < 0.05).
No letters (a, b, c) indicate no statistically significant difference (p ≥ 0.05) between education levels within a country and/or no statistically significant global test (p ≥ 0.05).
N refers to the number of participants in that education level in that country. See Appendix 6 for variable-specific sample sizes.
No letters (a, b, c) indicate no statistically significant difference (p ≥ 0.05) between education levels within a country and/or no statistically significant global test (p ≥ 0.05).
N refers to the number of participants in that education level in that country. See Appendix 6 for variable-specific sample sizes.
Results – Children
Status 2024
In 2024, children across the Nordic countries spent between 6.6 hours per week in Denmark and 9.6 hours per week in Iceland on moderate-to-vigorous physical activity (MVPA) during leisure time.
Despite these activity levels, physical inactivity remained common. The proportion of children not meeting physical activity guidelines was highest in Denmark (57.9%), followed by Sweden (53.2%), Norway (50.5%), Finland (37%) and lowest in Iceland (34.7%).
Children also spent between 2.7 and 3.4 hours per day on recreational screen time, ranging from 2.7 hours in Denmark to 3.4 hours in Norway. Across the region, more than one in eight children exceeded four hours per day of recreational screen time.
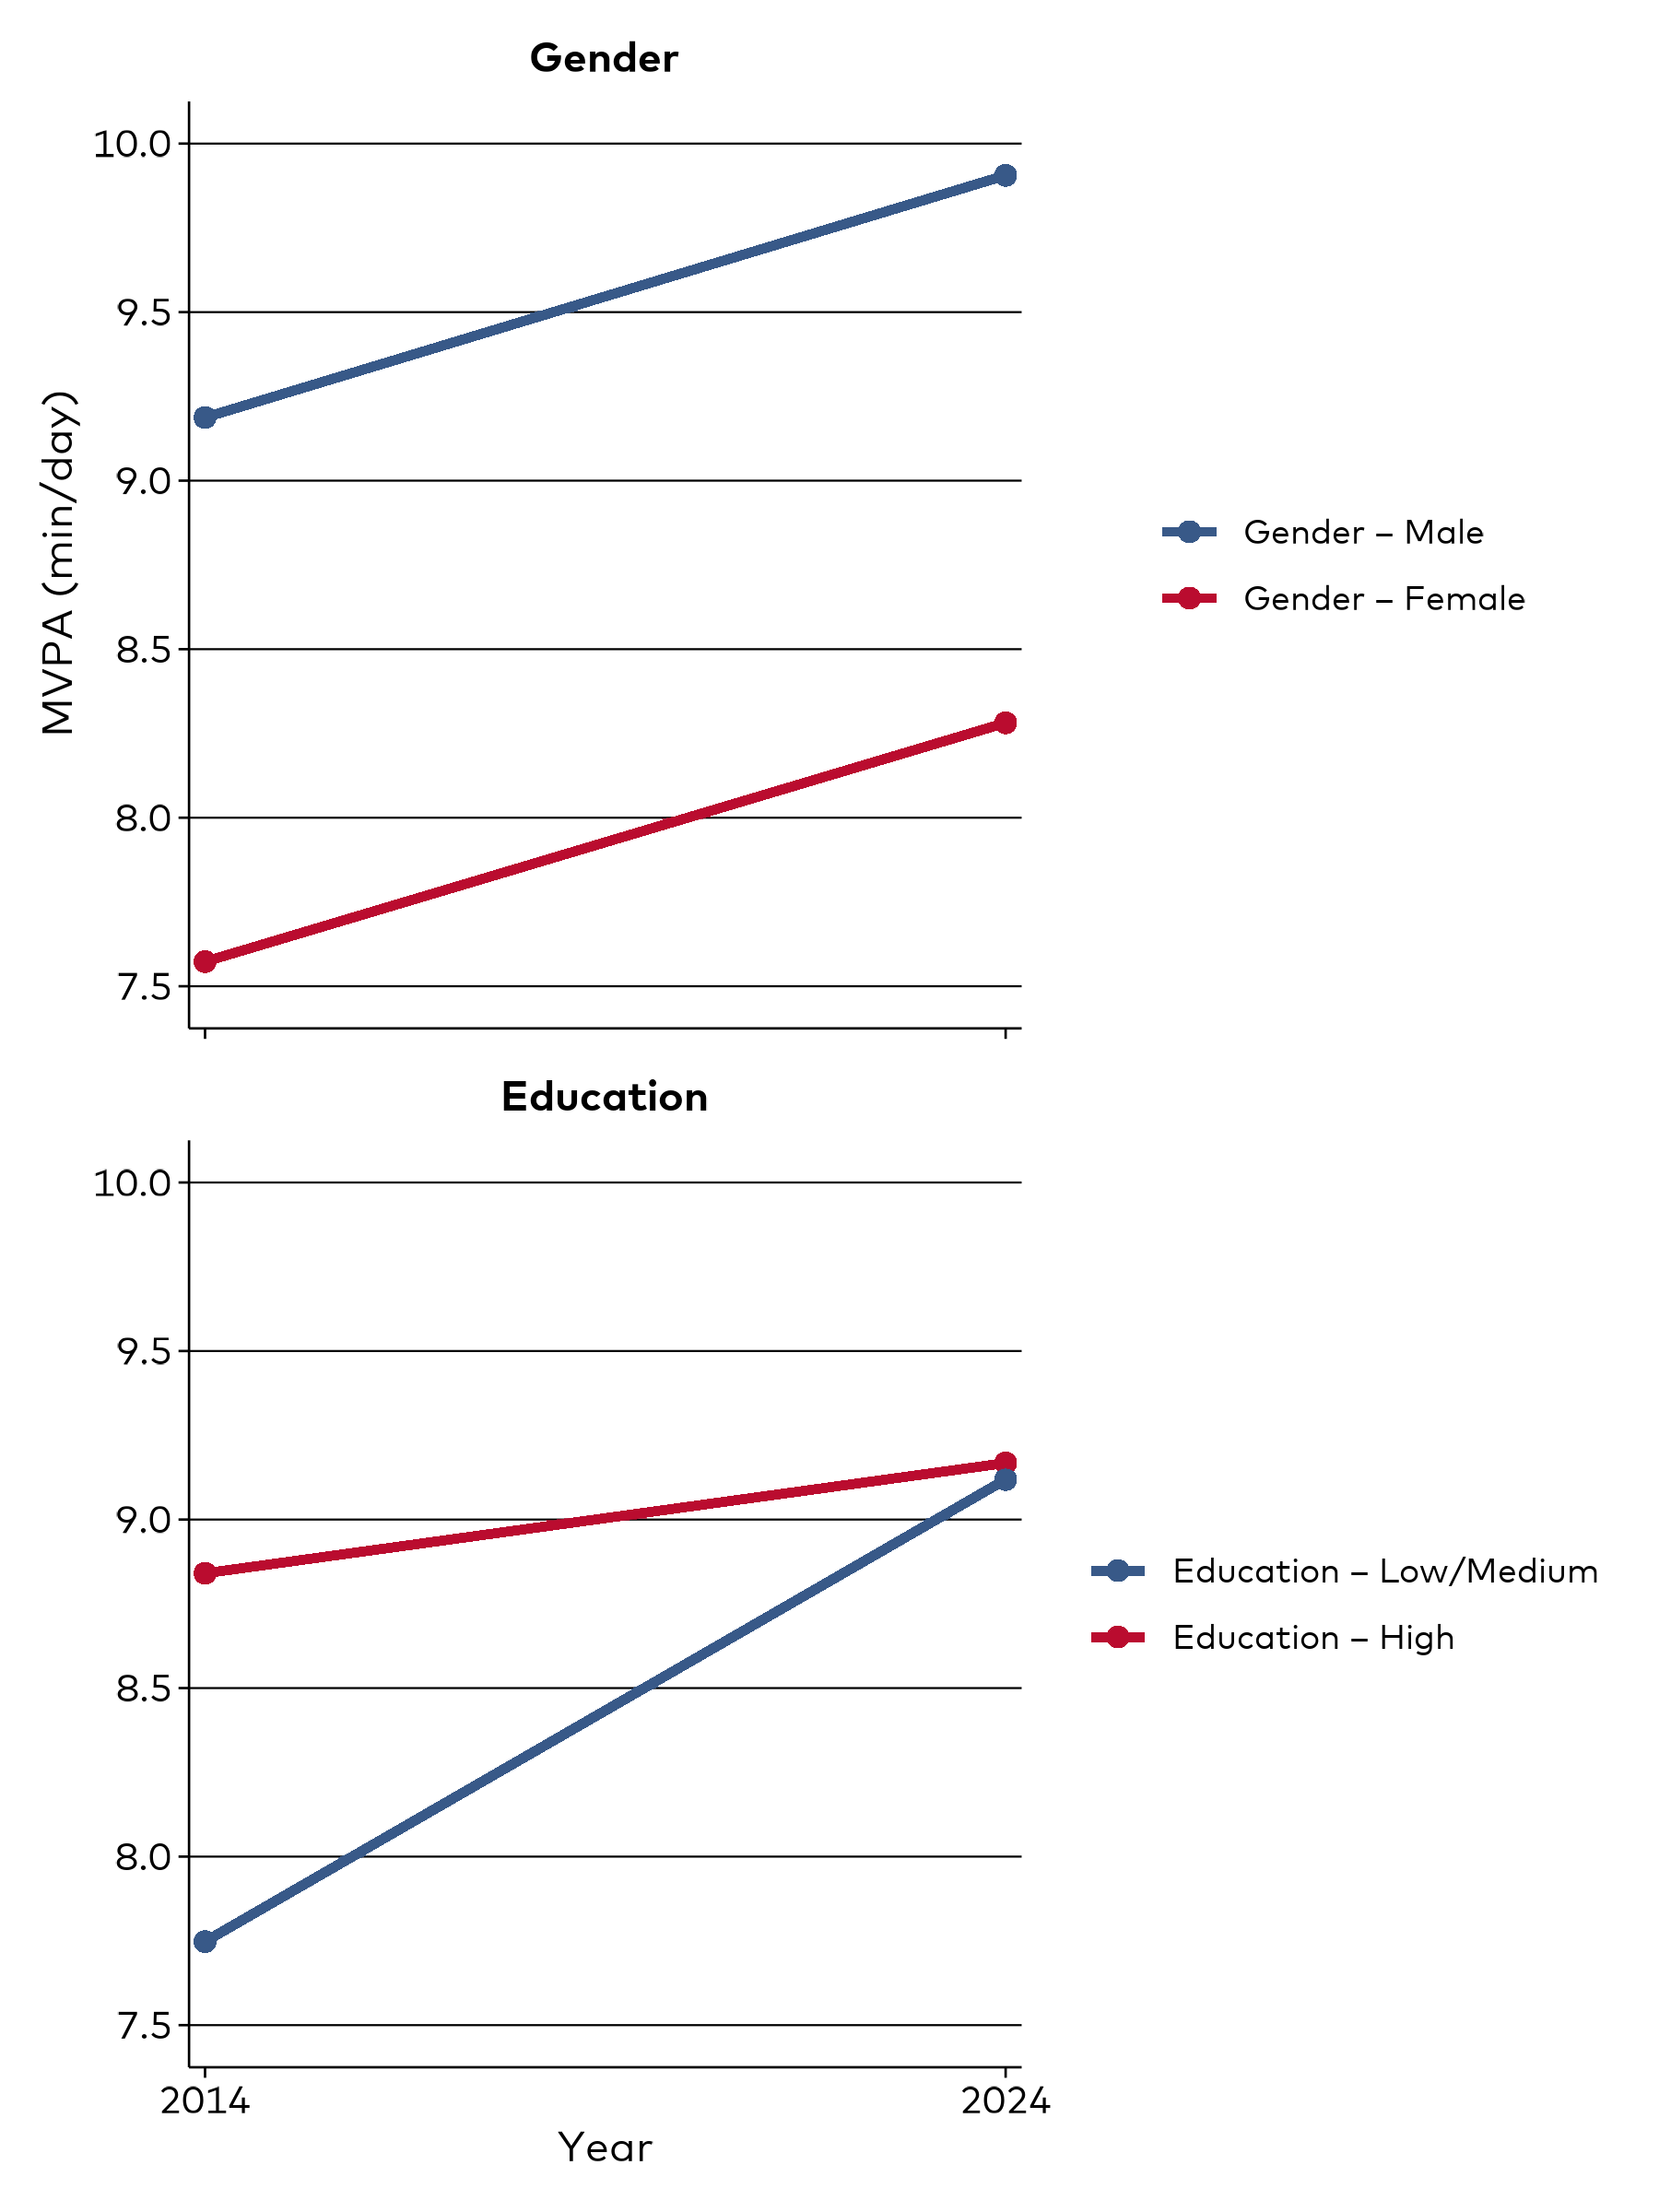
Trends 2014–2024 (Finland)
An increase in moderate-to-vigorous physical activity (MVPA) was seen in Finland from 2014 to 2024. A non-statistically significant decrease in the rate of physical inactivity was seen as well.
Results – Children
Status 2024
In 2024, children across the Nordic countries spent between 6.6 hours per week in Denmark and 9.6 hours per week in Iceland on moderate-to-vigorous physical activity (MVPA) during leisure time.
Despite these activity levels, physical inactivity remained common. The proportion of children not meeting physical activity guidelines was highest in Denmark (57.9%), followed by Sweden (53.2%), Norway (50.5%), Finland (37%) and lowest in Iceland (34.7%).
Children also spent between 2.7 and 3.4 hours per day on recreational screen time, ranging from 2.7 hours in Denmark to 3.4 hours in Norway. Across the region, more than one in eight children exceeded four hours per day of recreational screen time.
Trends 2014–2024 (Finland)
An increase in moderate-to-vigorous physical activity (MVPA) was seen in Finland from 2014 to 2024. A non-statistically significant decrease in the rate of physical inactivity was seen as well.

N | 500 | 503 |
|---|---|---|
Physical inactivity (Not meeting guidelines) (%) | 41.4 (36.4; 46.4) | 37.0 (32.6; 41.3) |
High screen time (> 4 hours per day) (%) | 13.5 (10.3; 16.6) | |
Moderate-Vigorous Physical Activity (hours per week) | 8.4 (7.9; 8.9) * | 9.1 (8.7; 9.6) * |
Time spent in front of a screen per leisure (hours per day) | 3.2 (2.9; 3.5) | |
Time spent walking or cycling (hours per week) | 5.0 (4.5; 5.5) |
* indicates statistically significant difference (p < 0.05) between categories.
N refers to the number of participants in that education level in that survey year. See Appendix 6 for variable-specific sample sizes.
N refers to the number of participants in that education level in that survey year. See Appendix 6 for variable-specific sample sizes.
N | 508 | 510 | 505 | 508 |
|---|---|---|---|---|
Physical inactivity (Not meeting guidelines) (%) | 57.9 (52.8; 62.9) | 50.5 (45.8; 55.1) | 53.2 (48.4; 58.1) | 34.7 (30.5; 39.0) |
High screen time (> 4 hours per day) (%) | 12.4 (8.9; 15.8) | 16.2 (12.8; 19.7) | 15.1 (11.6; 18.6) | 12.0 (9.1; 14.9) |
Moderate-Vigorous Physical Activity (hours per week) | 6.6 (6.1; 7.0) | 7.9 (7.4; 8.4) | 7.0 (6.5; 7.5) | 9.6 (9.1; 10.1) |
Time spent in front of a screen per leisure (hours per day) | 2.7 (2.5; 2.9) | 3.4 (3.1; 3.7) | 3.3 (3.0; 3.6) | 3.0 (2.7; 3.2) |
Time spent walking or cycling (hours per week) | 2.0 (1.7; 2.2) | 3.0 (2.6; 3.3) | 3.4 (3.0; 3.9) | 2.3 (2.1; 2.6) |
N refers to the number of participants in that country. See Appendix 6 for variable-specific sample sizes.
Demographic Differences
Gender
Significant gender differences in physical inactivity were observed in Norway and Iceland. In Norway, 45.5% of boys and 55.6% of girls did not meet physical activity guidelines, while in Iceland, the proportions were 29.9% for boys and 40.3% for girls.
In Denmark and Iceland, boys engaged in significantly more moderate-to-vigorous physical activity than girls. Danish boys reported 7.1 hours/week, compared to 5.9 hours/week for girls. In Iceland, the difference was even greater: 10.2 hours/week for boys and 8.8 hours/week for girls. In Finland boys reported significantly more physical activity than girls. On average, boys engaged in 9.9 hours per week of moderate-to-vigorous physical activity, compared to 8.3 hours per week for girls.
In Denmark and Norway, boys reported significantly higher levels of high screen time compared to girls. In Denmark, 15.8% of boys versus 8.5% of girls exceeded the 4-hour threshold. In Norway, the difference was even more pronounced, with 21.9% of boys and 10.2% of girls reporting high screen time.
In both Denmark and Norway, boys spent significantly more time in front of screens during leisure time than girls. Danish boys reported 3.0 hours/day, while girls reported 2.3 hours/day. In Norway, boys spent 3.8 hours/day, compared to 3.0 hours/day for girls.
N | 272 | 231 |
|---|---|---|
Physical inactivity (Not meeting guidelines) (%) | 34.0 (28.2; 39.8) | 40.4 (33.8; 46.9) |
High screen time (> 4 hours per day) (%) | 11.8 (7.8; 15.8) | 15.3 (10.4; 20.3) |
Moderate-Vigorous Physical Activity (hours per week) | 9.9 (9.2; 10.6) * | 8.3 (7.6; 8.9) * |
Time spent in front of a screen per leisure (hours per day) | 3.2 (2.8; 3.5) | 3.3 (2.8; 3.7) |
Time spent walking or cycling (hours per week) | 5.1 (4.4; 5.8) | 5.0 (4.2; 5.7) |
* indicates statistically significant difference (p < 0.05) between genders
N refers to the number of participants with that gender in that country. See Appendix 6 for variable specific sample sizes.
N | 276 | 232 |
|---|---|---|
Physical inactivity (Not meeting guidelines) (%) | 54.9 (48.0; 61.8) | 61.3 (53.9; 68.6) |
High screen time (> 4 hours per day) (%) | 15.8 (10.4; 21.2) * | 8.5 (4.5; 12.5) * |
Moderate-Vigorous Physical Activity (hours per week) | 7.1 (6.4; 7.8) * | 5.9 (5.3; 6.6) * |
Time spent in front of a screen per leisure (hours per day) | 3.0 (2.7; 3.3) * | 2.3 (2.1; 2.5) * |
Time spent walking or cycling (hours per week) | 1.9 (1.4; 2.3) | 2.1 (1.7; 2.4) |
* indicates statistically significant difference (p < 0.05) between genders
N refers to the number of participants with that gender in that country. See Appendix 6 for variable-specific sample sizes.
N refers to the number of participants with that gender in that country. See Appendix 6 for variable-specific sample sizes.
N | 262 | 248 |
|---|---|---|
Physical inactivity (Not meeting guidelines) (%) | 45.5 (39.1; 51.9) * | 55.6 (49.0; 62.2) * |
High screen time (> 4 hours per day) (%) | 21.9 (16.6; 27.3) * | 10.2 (6.1; 14.3) * |
Moderate-Vigorous Physical Activity (hours per week) | 8.3 (7.6; 9.1) | 7.5 (6.8; 8.2) |
Time spent in front of a screen per leisure (hours per day) | 3.8 (3.4; 4.2) * | 3.0 (2.6; 3.3) * |
Time spent walking or cycling (hours per week) | 2.8 (2.3; 3.3) | 3.1 (2.6; 3.7) |
* indicates statistically significant difference (p < 0.05) between genders
N refers to the number of participants with that gender in that country. See Appendix 6 for variable-specific sample sizes.
N refers to the number of participants with that gender in that country. See Appendix 6 for variable-specific sample sizes.
N | 263 | 242 |
|---|---|---|
Physical inactivity (Not meeting guidelines) (%) | 50.3 (43.6; 57.1) | 56.6 (49.6; 63.5) |
High screen time (> 4 hours per day) (%) | 17.7 (12.5; 22.9) | 12.2 (7.6; 16.7) |
Moderate-Vigorous Physical Activity (hours per week) | 7.2 (6.5; 7.9) | 6.8 (6.1; 7.5) |
Time spent in front of a screen per leisure (hours per day) | 3.5 (3.1; 3.9) | 3.1 (2.7; 3.5) |
Time spent walking or cycling (hours per week) | 3.8 (3.1; 4.5) | 3.0 (2.5; 3.5) |
* indicates statistically significant difference (p < 0.05) between genders
N refers to the number of participants with that gender in that country. See Appendix 6 for variable-specific sample sizes.
N refers to the number of participants with that gender in that country. See Appendix 6 for variable-specific sample sizes.
N | 271 | 237 |
|---|---|---|
Physical inactivity (Not meeting guidelines) (%) | 29.9 (24.4; 35.5) * | 40.3 (33.9; 46.7) * |
High screen time (> 4 hours per day) (%) | 11.6 (7.7; 15.5) | 12.4 (8.1; 16.8) |
Moderate-Vigorous Physical Activity (hours per week) | 10.2 (9.5; 10.9) * | 8.8 (8.1; 9.5) * |
Time spent in front of a screen per leisure (hours per day) | 3.0 (2.7; 3.3) | 2.9 (2.5; 3.4) |
Time spent walking or cycling (hours per week) | 2.4 (2.1; 2.8) | 2.2 (1.9; 2.6) |
* indicates statistically significant difference (p < 0.05) between genders
N refers to the number of participants with that gender in that country. See Appendix 6 for variable-specific sample sizes.
N refers to the number of participants with that gender in that country. See Appendix 6 for variable-specific sample sizes.
Parental Education
Few statistically significant differences were observed by parental education. The only clear pattern was seen in Denmark, where children of parents in the high education group spent more time on moderate-to-vigorous physical activity (MVPA) than those of parents in the low/medium education group (7.1 vs. 5.9 hours per week).
N | 160 | 343 |
|---|---|---|
Physical inactivity (Not meeting guidelines) (%) | 38.8 (31.2; 46.3) | 35.6 (30.5; 40.6) |
High screen time (> 4 hours per day) (%) | 15.7 (10.1; 21.4) | 11.7 (8.3; 15.1) |
Moderate-Vigorous Physical Activity (hours per week) | 9.1 (8.3; 10.0) | 9.2 (8.6; 9.7) |
Time spent in front of a screen per leisure (hours per day) | 3.3 (2.8; 3.7) | 3.2 (2.8; 3.5) |
Time spent walking or cycling (hours per week) | 5.3 (4.4; 6.3) | 4.8 (4.2; 5.3) |
* indicates statistically significant difference (p < 0.05) between parental education levels in that country.
N refers to the number of participants with that parental education level in that country. See Appendix 6 for variable specific sample sizes.
N | 99 | 409 |
|---|---|---|
Physical inactivity (Not meeting guidelines) (%) | 61.6 (52.0; 71.2) | 54.9 (50.1; 59.7) |
High screen time (> 4 hours per day) (%) | 13.4 (6.6; 20.2) | 11.6 (8.5; 14.7) |
Moderate-Vigorous Physical Activity (hours per week) | 5.9 (5.1; 6.8) * | 7.1 (6.6; 7.6) * |
Time spent in front of a screen per leisure (hours per day) | 2.6 (2.3; 3.0) | 2.7 (2.5; 3.0) |
Time spent walking or cycling (hours per week) | 1.5 (1.0; 2.0) * | 2.3 (2.0; 2.6) * |
* indicates statistically significant difference (p < 0.05) between parental education levels in that country.
N refers to the number of participants with that parental education level in that country. See Appendix 6 for variable-specific sample sizes.
N refers to the number of participants with that parental education level in that country. See Appendix 6 for variable-specific sample sizes.
N | 146 | 364 |
|---|---|---|
Physical inactivity (Not meeting guidelines) (%) | 50.0 (41.9; 58.1) | 50.8 (45.7; 56.0) |
High screen time (> 4 hours per day) (%) | 16.6 (10.5; 22.6) | 15.9 (12.1; 19.7) |
Moderate-Vigorous Physical Activity (hours per week) | 7.7 (6.8; 8.7) | 8.1 (7.5; 8.6) |
Time spent in front of a screen per leisure (hours per day) | 3.4 (2.9; 3.8) | 3.4 (3.1; 3.7) |
Time spent walking or cycling (hours per week) | 2.8 (2.2; 3.5) | 3.1 (2.7; 3.4) |
* indicates statistically significant difference (p < 0.05) between parental education levels in that country.
N refers to the number of participants with that parental education level in that country. See Appendix 6 for variable-specific sample sizes.
N refers to the number of participants with that parental education level in that country. See Appendix 6 for variable-specific sample sizes.
N | 109 | 394 |
|---|---|---|
Physical inactivity (Not meeting guidelines) (%) | 55.6 (46.2; 64.9) | 51.7 (46.7; 56.6) |
High screen time (> 4 hours per day) (%) | 15.9 (9.0; 22.8) | 14.8 (11.3; 18.3) |
Moderate-Vigorous Physical Activity (hours per week) | 7.0 (6.0; 8.0) | 7.0 (6.6; 7.5) |
Time spent in front of a screen per leisure (hours per day) | 3.5 (2.9; 4.1) | 3.2 (2.9; 3.5) |
Time spent walking or cycling (hours per week) | 3.5 (2.7; 4.4) | 3.4 (2.9; 3.9) |
* indicates statistically significant difference (p < 0.05) between parental education levels in that country.
N refers to the number of participants with that parental education level in that country. See Appendix 6 for variable-specific sample sizes.
N refers to the number of participants with that parental education level in that country. See Appendix 6 for variable-specific sample sizes.
N | 170 | 335 |
|---|---|---|
Physical inactivity (Not meeting guidelines) (%) | 39.1 (31.7; 46.4) | 32.0 (27.0; 37.0) |
High screen time (> 4 hours per day) (%) | 12.0 (7.0; 16.9) | 11.7 (8.2; 15.1) |
Moderate-Vigorous Physical Activity (hours per week) | 9.4 (8.5; 10.2) | 9.6 (9.0; 10.2) |
Time spent in front of a screen per leisure (hours per day) | 3.1 (2.6; 3.6) | 2.9 (2.6; 3.2) |
Time spent walking or cycling (hours per week) | 2.3 (1.9; 2.7) | 2.4 (2.1; 2.6) |
* indicates statistically significant difference (p < 0.05) between parental education levels in that country.
N refers to the number of participants with that parental education level in that country. See Appendix 6 for variable-specific sample sizes.
N refers to the number of participants with that parental education level in that country. See Appendix 6 for variable-specific sample sizes.
Discussion
Summary of results
The high proportions of inactive ie. not meeting the recommended levels of physical activity (WHO 2020), and with sedentary behaviour (high recreational screen time) among adults are of concern.
Among adults, the proportion of physical inactivity ranged from 24% in Denmark to 31% in Sweden, while among children it ranged from 33% in Iceland and Finland to about 50% in the other Nordic countries.
Adults in the Nordic countries spent on average almost four hours per day in front of a screen during leisure time—close to the threshold for high recreational screen time. Among children, daily screen time ranged from 2.5 to 3.5 hours, exceeding screen time recommendations given for example in Denmark and Sweden. Danish Health Authority’s recommendation of a maximum of 2 hours per day for children and adolescents aged 5–17, and 3 hours for adults (Sundhedsstyrelsen, 2025). Sweden also provides age-specific screen time guidelines: no screen time for children under 2, a maximum of one hour for ages 2–5, two hours for ages 6–12, and three hours for ages 13–18 (Folkhälsomyndigheten 2024). In Finland, national digital recommendations for children are currently being finalized. These focus on leisure-time use of digital devices and content for children aged 0–13, including limits of one hour per day in short sessions for ages 6–10, and two hours for ages 11–13 (Finnish Institute for Health and Welfare, 2025). These comparisons highlight that actual screen time among children often exceeds national recommendations, underscoring the need for continued public health efforts and parental support.
Gender differences were observed, with boys reporting higher recreational screen time than girls in all Nordic countries except Sweden.
Education level remained a strong determinant of activity level: the lowest physical inactivity was observed among adults with higher education, except in Finland where no educational differences were found.
Active commuting (cycling or walking for transport) varied substantially, from about 2 hours per week in Iceland to 5 hours in Sweden among adults, and from 2 hours in Denmark to 5 hours in Finland among children.
Interpretation
The findings suggest that a substantial proportion of both adults and children in the Nordic Region fail to meet the WHO physical activity recommendations.
The results also show that recreational screen time is high across all countries, exceeding national recommendations for both adults and children.
The substantial variation in active commuting between countries suggests differences in infrastructure, urban design, and cultural norms influencing daily activity. Promoting walking and cycling still holds significant potential from both a public health and sustainability perspective.
Comparison to other results
The results of NORMO are partly supported by other national data sources.
In Iceland, the Directorate of Health reported that 27% of men and 30% of women did not meet physical activity recommendations in 2024, closely matching NORMO’s findings.
Similarly, data from the objective physical activity measurements from Norwegian Institute of Public Health (NIPH 2023) showed that 27% of women and 24% of men did not meet physical activity recommendations in 2022—again in line with NORMO estimates.
However, Finnish data do not support the NORMO findings: the self-reported Healthy Finland Survey (2023) reported much higher inactivity levels (54% of men and 62% of women not meeting guidelines). This was also the case in Denmark, where self-reported data from 2021 show that 58% of adults (55% of men and 61% of women aged 16+) did not meet the physical activity recommendations (Sundhedsstyrelsen 2022). Data from the Public Health Agency of Sweden (2024) also show broadly consistent trends: the proportion of adults achieving at least 150–300 minutes of physical activity per week remained stable between 2016 and 2024, while sedentary behaviour increased from 20.4% to 24.1%.
For children, the LIITU Study (2022) in Finland found that 67% of 7–15-year-olds did not meet physical activity recommendations, compared with only 37% in NORMO. The estimate for physical inactivity among Norwegian adolescents in the NORMO data is 50.5%. This is notably higher than the age-specific figures reported in 2018 (NIPH 2021), where 15% of 9-year-old boys, 32% of 9-year-old girls, 44% of 15-year-old boys, and 58% of 15-year-old girls did not meet physical activity recommendations. It is, however, important to note that in both of those national studies, objective measures (activity tracker/accelerometers) of physical activity were used, whereas NORMO is based on self-reported data. Objective measures, such as accelerometers, provide more reliable and often lower estimates compared to survey-based methods.
Strengths and limitations
One of the strengths of the survey's physical activity and sedentary behavior findings is its ability to accurately describe current patterns across the Nordic countries.
A key limitation of the present results is that comparisons over time and between countries are constrained by differences in data collection periods. The 2014 and 2024 surveys were conducted in different seasons, except in Finland where both were carried out in autumn, limiting the ability to assess temporal change.
As a result, it is not possible to evaluate progress toward the WHO Global Action Plan on Physical Activity 2018–2030 goals (10% reduction in inactivity by 2025 and 15% by 2030) using these data.
The reliance on self-reported physical activity may also lead to underestimation of inactivity, especially when compared with objectively measured national data.
However, the harmonized design across all Nordic countries remains a major strength, providing a consistent regional overview of activity and sedentary patterns.
References
Bjørnarå, H. B., et al. (2017). Sustainable physical activity and transport: Health and environmental benefits. Scandinavian Journal of Public Health, 45(8), 837–845.
Carson, V., Hunter, S., Kuzik, N., et al. (2016). Systematic review of sedentary behaviour and health indicators in school-aged children and youth. International Journal of Behavioural Nutrition and Physical Activity, 13(1), 65.
Directorate of Health. (2025). Public Health Watch – Monitoring selected health determinants. https://www.landlaeknir.is/
Dunstan, D. W., Howard, B., Healy, G. N., & Owen, N. (2012). Too much sitting – A health hazard. Diabetes Research and Clinical Practice, 97(3), 368–376.
Finnish Institute for Health and Welfare. (2022–). Healthy Finland survey. https://thl.fi/en/research-and-development/research-and-projects/healthy-finland-survey
Finnish Institute for Health and Welfare (THL). (2025). New digital recommendations for children's leisure time are being finalized – public consultation and parental feedback opened [in Finnish]. https://thl.fi/-/uudet-digisuositukset-lapsille-vapaa-aikaan-ovat-valmistumassa-lausuntokierros-ja-vanhempien-kommentointi-avattu
Folkhälsomyndigheten. (2024). Recommendations for children's and young people's use of digital media [in Swedish]. https://www.folkhalsomyndigheten.se/contentassets/201463a976054dde8ad7aa8a47861c0a/rekommendationer-digitala-medier-barns-ungas-medieanvandning.pdf
Kokko, S., & Hämylä, R. (Eds.). (2025). Lasten ja nuorten liikuntakäyttäytyminen Suomessa: LIITU-tutkimuksen tuloksia 2024 (Valtion liikuntaneuvoston julkaisuja 2025:1). Valtion liikuntaneuvosto. https://www.liikuntaneuvosto.fi/wp-content/uploads/2025/05/LIITU-2024-raportti.pdf
Norwegian Institute of Public Health. (2021). Physical inactivity in adolescents (Indicator 6). https://www.fhi.no/en/nc/Indicators-for-NCD/physical-inactivity/fysisk-inaktivitet---ungdom-indikator-6/
Norwegian Institute of Public Health. (2023). Physical inactivity in adults (Indicator 7). https://www.fhi.no/en/nc/Indicators-for-NCD/physical-inactivity/physical-activity-adults/
Okely, A. D., Ghersi, D., Hesketh, K. D., et al. (2019). A collaborative approach to adopting/adapting guidelines – The Australian 24-Hour Movement Guidelines for Children and Young People (5–17 years): An integration of physical activity, sedentary behaviour, and sleep. International Journal of Behavioural Nutrition and Physical Activity, 16(1), 77.
Physical Activity Guidelines Advisory Committee. (2018). Physical Activity Guidelines Advisory Committee Scientific Report. U.S. Department of Health and Human Services.
Public Health Agency of Sweden. (2024). Statistics on physical activity and sedentary behaviour. https://www.folkhalsomyndigheten.se/livsvillkor-levnadsvanor/mat-fysisk-aktivitet-overvikt-och-obesitas/fysisk-aktivitet-och-stillasittande/statistik-om-fysisk-aktivitet-och-stillasittande/
Stamatakis, E., Hamer, M., & Dunstan, D. W. (2011). Screen-based entertainment time, all-cause mortality, and cardiovascular events: Population-based study with ongoing mortality and hospital events follow-up. Journal of the American College of Cardiology, 57(3), 292–299.
Strain, T., Flaxman, S., Guthold, R., et al. (2024). National, regional, and global trends in insufficient physical activity among adults from 2000 to 2022: A pooled analysis of 507 population-based surveys with 5.7 million participants. The Lancet Global Health. https://doi.org/10.1016/S2214-109X(24)00150-5
Sundhedsstyrelsen. (2022). Danskernes sundhed: Den Nationale Sundhedsprofil 2021 – centrale udfordringer. Sundhedsstyrelsen. https://sundhedsstyrelsen.dk/-/media/Udgivelser/2022/Sundhedsprofil/Sundhedsprofilen-kort.ashx
Sundhedsstyrelsen. (2025). Recommendations on screen use for children, adolescents and adults. Danish Health Authority. https://sundhedsstyrelsen.dk/-/media/English/Publications/2025/SCREENS_SST_RECOMMENDATIONS.ashx
Thorp, A. A., Owen, N., Neuhaus, M., & Dunstan, D. W. (2011). Sedentary behaviours and subsequent health outcomes in adults: A systematic review of longitudinal studies, 1996–2011. American Journal of Preventive Medicine, 41(2), 207–215.
World Health Organization. (2020). WHO guidelines on physical activity and sedentary behaviour. World Health Organization. https://www.who.int/publications/i/item/9789240015128
World Health Organization. (2024). Physical activity fact sheet. https://www.who.int