Diet
Background
One main objective of the NORMO study is to monitor diet quality and frequency of food consumption, both as trends over time and as current status in Denmark, Finland, Iceland, Norway and Sweden among children aged 7–12 years and adults aged 18–65 years. The aim is to provide knowledge supporting the Vision 2030 of the Nordic Council of Ministers to make the Nordic Region the most sustainable and integrated in the world by 2030.
In the Nordic Nutrition Recommendations 2023 (NNR2023), a predominantly plant-based diet is recommended (Blomhoff et al., 2023). This recommendation is based on health evidence and, where compatible with health outcomes, on environmental sustainability and climate impact. The plant-rich diet is defined as “rich in vegetables, fruits, berries, pulses, potatoes and whole grains, ample amounts of fish and nuts, moderate intake of low-fat dairy products, limited intake of red meat and poultry, and minimal intake of processed meat, alcohol, and processed foods containing high amounts of added fats, salt and sugar” (Blomhoff et al., 2023).
Background Analytical notes Key findings Results – Adults Results – Children Discussion References |
Background
One main objective of the NORMO study is to monitor diet quality and frequency of food consumption, both as trends over time and as current status in Denmark, Finland, Iceland, Norway and Sweden among children aged 7–12 years and adults aged 18–65 years. The aim is to provide knowledge supporting the Vision 2030 of the Nordic Council of Ministers to make the Nordic Region the most sustainable and integrated in the world by 2030.
In the Nordic Nutrition Recommendations 2023 (NNR2023), a predominantly plant-based diet is recommended (Blomhoff et al., 2023). This recommendation is based on health evidence and, where compatible with health outcomes, on environmental sustainability and climate impact. The plant-rich diet is defined as “rich in vegetables, fruits, berries, pulses, potatoes and whole grains, ample amounts of fish and nuts, moderate intake of low-fat dairy products, limited intake of red meat and poultry, and minimal intake of processed meat, alcohol, and processed foods containing high amounts of added fats, salt and sugar” (Blomhoff et al., 2023).
NNR2023 recommends increasing intake of whole grains, vegetables, fruits, berries, potatoes, pulses (legumes), nuts and seeds, and fish from sustainably managed stocks. It recommends reducing red and processed meat consumption and limiting sweets, sugar-sweetened beverages and juice, while maintaining or reducing white meat.
Analytical Notes
This chapter reports the frequency of consumption of foods related to health and environmental sustainability for adults and children in the Nordic countries. Intakes in 2024 are compared with intakes in 2014, where possible, and presented by gender, age, and education level.
Consumption or intake refers to the mean frequency, times per day or per week, except for bread where slices per day are presented. Based on NNR2023, higher intakes of vegetables, fruits, pulses, whole-grain bread, and fish are considered favorable for health and environmental sustainability, while lower intakes of meat and discretionary foods or beverages are considered favorable.
Unless otherwise noted, all differences between survey year 2014 and 2024 and between specific groups (country, age, gender, education level) noted in the text and tables are statistically significant (p < 0.001), while comparisons to the Nordic average are qualitative.
Exact p-values can be found in the Appendix 5. For each analysis, all available observations with non-missing values for the specific variable being analyzed and the relevant grouping variable(s) were included. For variable-specific sample sizes, see Appendix 6. Exact values used in the figures are available in Appendix 7.
Key findings
Status 2024
Countries differed, but in general not being in line with NNR 2023 recommendations:
- Total fruits and vegetables were low in all countries, but higher in Finland than all other countries (adults), and higher in Finland/Sweden (children). Pulses were very low and similar across all countries for adults and children, whole-grain bread was highest in Norway; lowest in Sweden and Iceland (children) and in Iceland (adults) compared to the other countries. Fish levels were generally low, tended to be higher in Norway/Iceland (adults and children) than the other countries;
- Total meat was higher in Denmark/Finland partly explained by a higher intake of other meat like chicken, pork, and venison, and lower in Norway/Sweden/Iceland; dairy was higher in Finland and lower in Denmark; discretionary foods was higher in Denmark/Iceland (adults and children) than the other countries, total discretionary drinks was high; highest in Iceland/Denmark/Norway (adults and children).
Trends 2014–2024
- Total fruits and vegetables: The Nordic Average decreased among adults and children; decreases mainly driven by fruit.
- Whole-grain bread: Decreased in all countries for both adults and children.
- Fish: seems unchanged for both adults and children, but uncertain due to questionnaire changes.
- Discretionary items: Discretionary drinks increased in adults and children; discretionary foods increased in children and were broadly unchanged in adults.
Demographic patterns
Gender
- Women reported higher fruits and vegetables intake; men reported higher meat intake and more whole-grain bread; women reported more discretionary foods.
Age
- Younger adults consumed more meat and discretionary drinks (including energy drinks) and less whole-grain bread and fish.
Education
- Among adults, higher levels of education aligned with a more health- and sustainability-oriented pattern: more fruits and vegetables, pulses, fish; less meat and sugary beverages.
- Among children, higher parental education was associated with more fruits and vegetables, and pulses, and less discretionary drinks, including light and sugar-free.
Results – Adults
Status in each country 2024
In Denmark, a favorable result was that intake of whole-grain bread was above the Nordic average. Total fruits and vegetables intake and fish intake were close to average. However, meat and discretionary foods and drinks were above the Nordic average, while dairy intake was below.
In Norway, favorable results included intake of whole-grain bread and fish that was much higher than the Nordic average, and intake of meat and discretionary foods was lower. Intake of total fruits and vegetables was close to the Nordic average, whereas discretionary drinks and dairy were above average.
In Sweden, favorable results were seen for meat and discretionary foods and drinks, which were all below the Nordic average, with the largest difference observed for drinks. Intake of total fruits and vegetables and dairy was close to average, while whole-grain bread and fish intake were below the Nordic average.
In Finland, favorable results included higher intake of total fruits and vegetables and whole-grain bread compared with the Nordic average, and lower intake of discretionary foods and drinks—the largest difference being for drinks. However, fish intake was below the Nordic average, while meat and dairy intake were above.
In Iceland, favorable results included lower intake of meat and higher intake of fish compared with the Nordic average. However, total fruits and vegetables and whole-grain bread intake were below average, and discretionary foods and drinks were above. Dairy intake was close to the Nordic average.
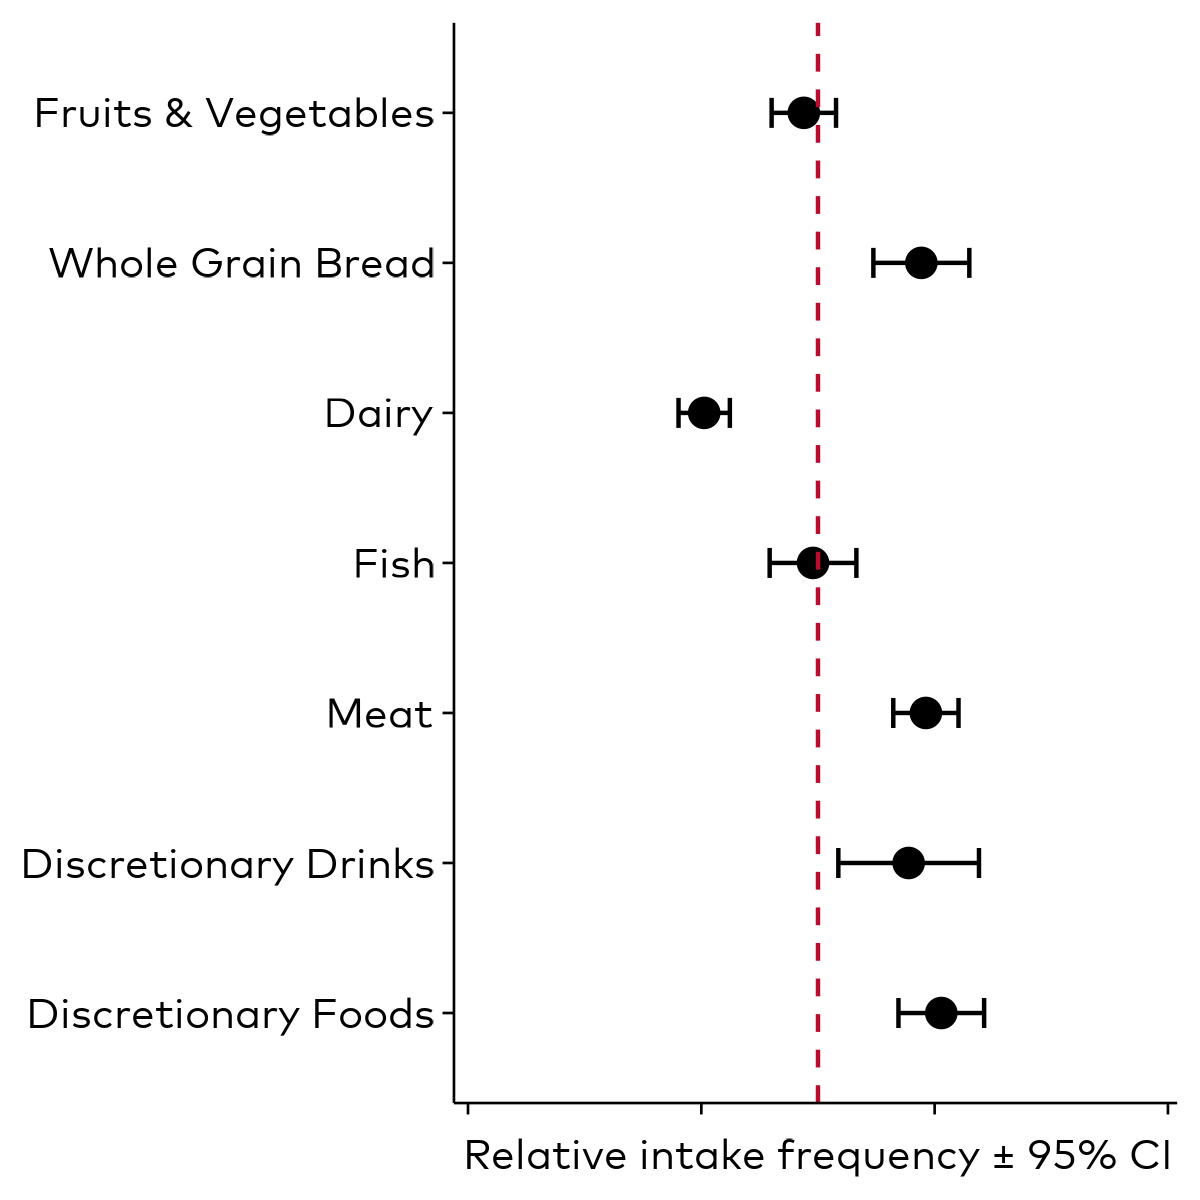
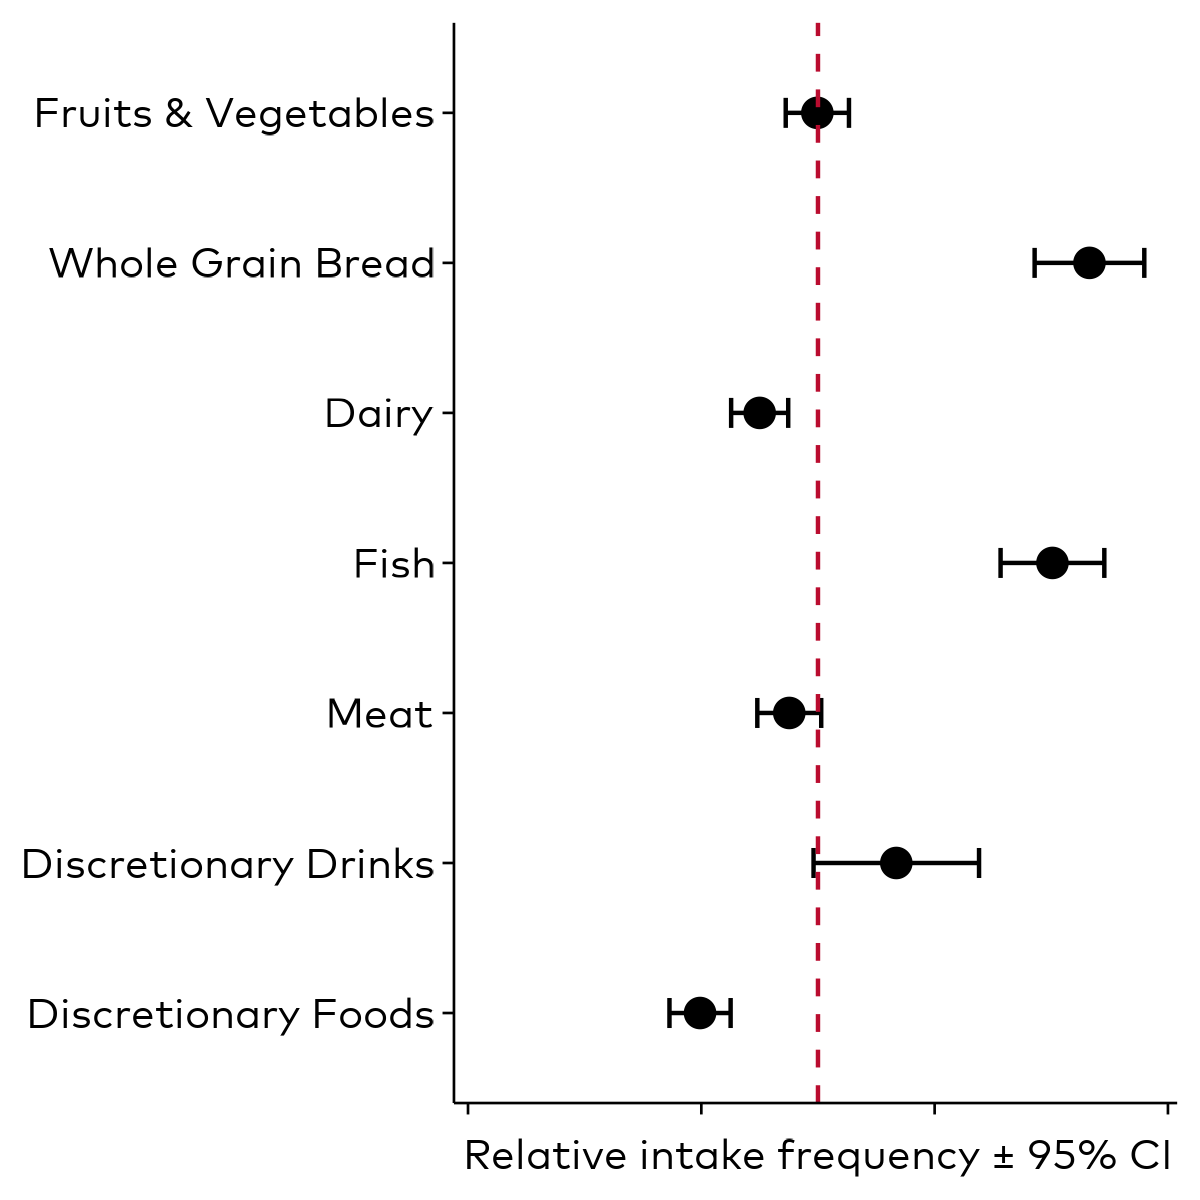
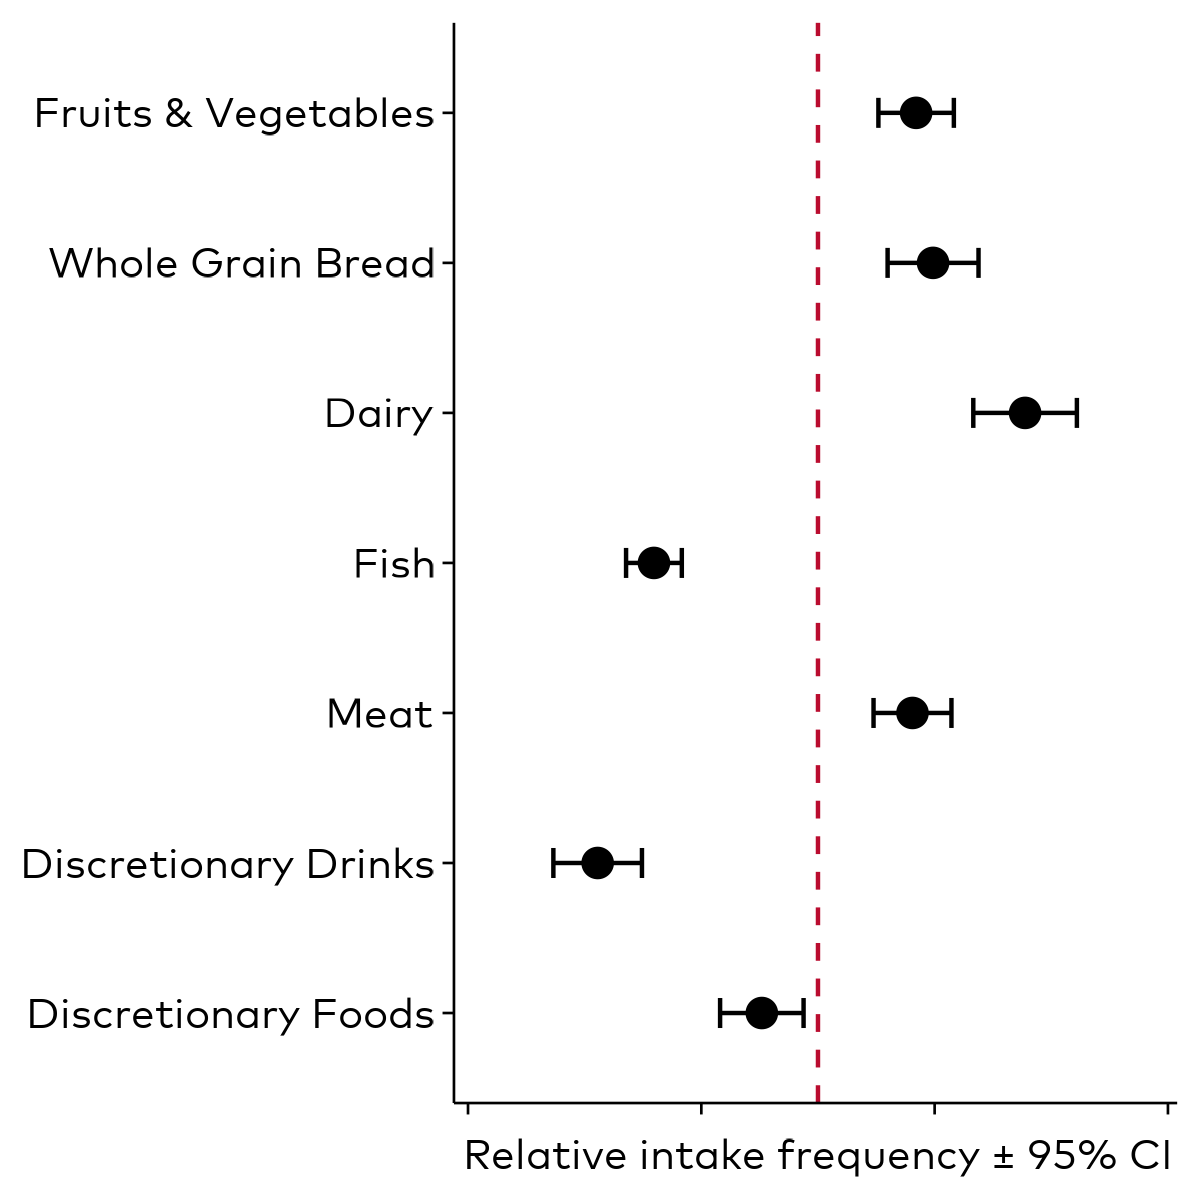
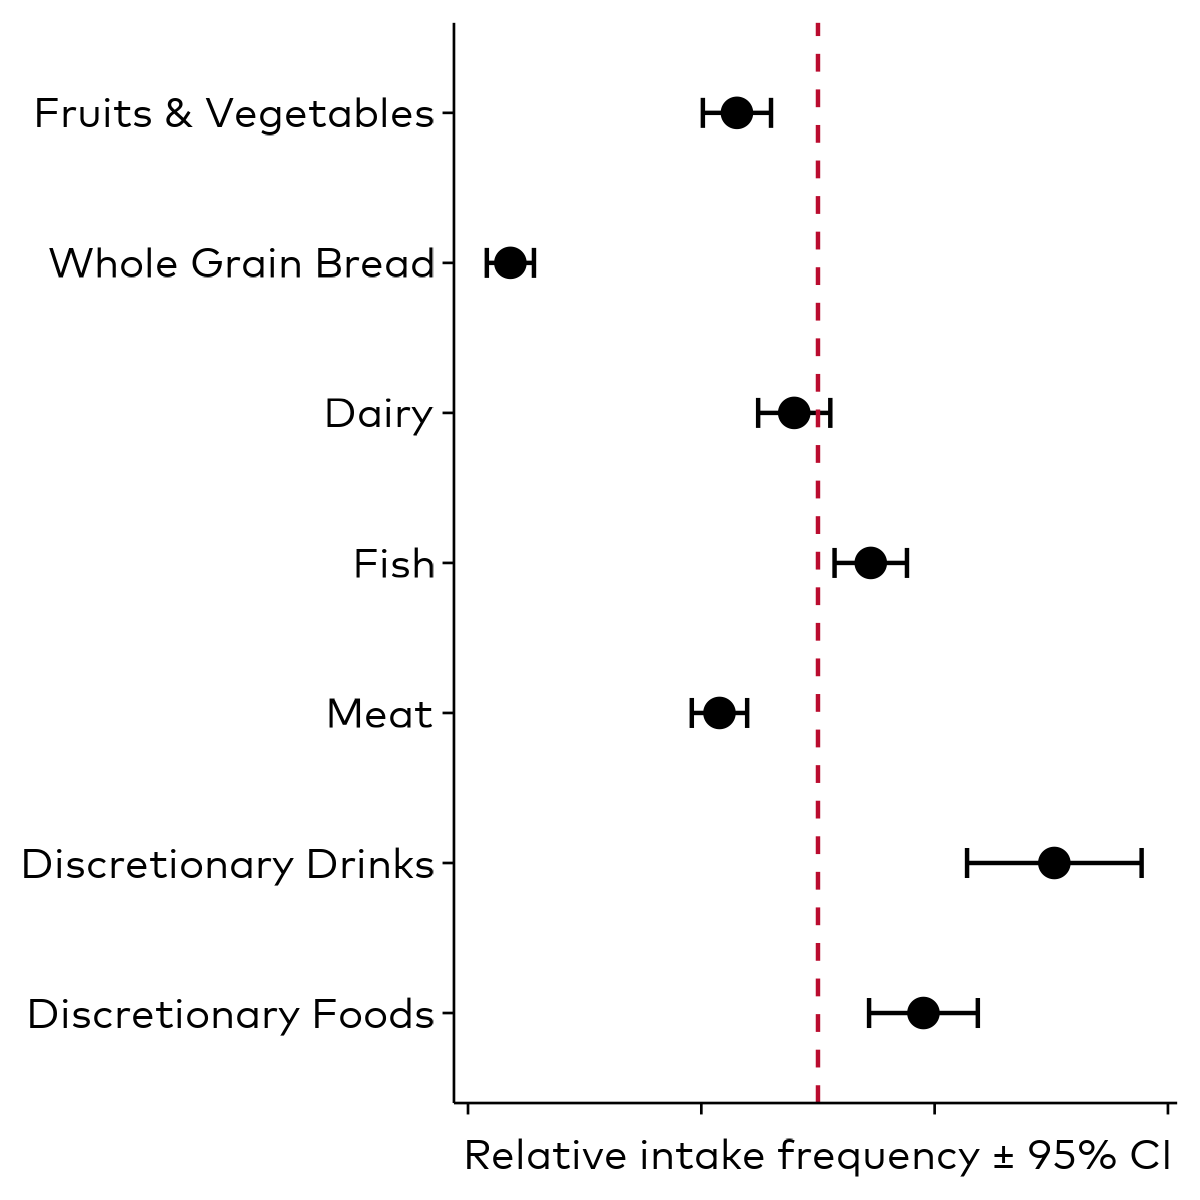
The frequency values from the main food categories among adults from each specific country compared to the Nordic Average for adults (red line). Values to the left of the red line indicate less frequent intake than the Nordic Average. Each country contributes equally to the Nordic average.
Trend 2014–2024, status 2024, differences and similarities between countries
Food groups that should increase
Overall, across the Nordic Region, total fruits and vegetables intake decreased between 2014 and 2024, from 2.4 to 2.2 times per day. By country, a decline was observed in Denmark (–0.5 times per day), Sweden (–0.6), and Iceland (–0.2), while intake remained unchanged in Norway and Finland. In 2024, intake levels were low in all countries, ranging from 1.9 times per day in Iceland to 2.5 times per day in Finland. Finland’s intake was significantly higher than in all other countries.
The observed decreases were mainly driven by lower fruit consumption. For example, fruit intake declined from 1.4 to 0.9 times per day in Denmark and from 1.2 to 0.9 in Sweden. In 2024, fruit intake was low and fairly similar across countries but remained highest in Finland (1.1 times per day) compared with Iceland and Sweden (0.9 times per day).
Vegetable intake also declined slightly at the regional level—from 1.3 to 1.2 times per day. Decreases were observed in Sweden and Iceland (not statistically significantly), while intake in Denmark, Norway, and Finland remained stable. In 2024, Iceland reported the lowest vegetable intake (1.0 times per day) compared with 1.2–1.4 times per day in the other Nordic countries.
Pulse intake was not estimated separately in 2014. In 2024, levels were very low and similar across countries (0.1–0.2 times per day), though slightly higher in Denmark and Sweden than elsewhere.
Whole-grain bread intake declined across the region, from 3.2 slices per day in 2014 to 2.3 in 2024, with decreases seen in all countries. In 2024, Norway had the highest intake (3.4 slices per day) and Iceland the lowest (1.1). Denmark and Finland reported similar levels (2.8 slices per day), both higher than Sweden (1.6).
Trends in fish intake are less certain due to changes in survey questions between 2014 and 2024. At the regional level, there was no overall change (1.6 times per week). By country, intake appeared to increase in Denmark and Norway—likely reflecting the revised question—but decreased slightly in Sweden (not statistically significantly), Finland, and Iceland. In 2024, all countries reported relatively low fish intake. Norway had the highest consumption (2.3 times per week), followed by Iceland and Denmark (1.8 and 1.6), while Sweden and Finland had the lowest (1.3 and 1.2 times per week).
Food groups that should decrease
Total meat intake was not estimated in 2014. In 2024, Denmark and Finland had the highest intake levels (7.1 and 7.0 times per week), exceeding those of the other countries, which ranged between 5.0 and 5.7 times per week. A similar pattern was seen for other meat (chicken, pork, venison), with Denmark (4.6 times per week) and Finland (4.1) reporting the highest values, followed by Norway (3.1), and lower levels in Sweden (2.5) and Iceland (2.4). In contrast, intake of veal, beef, and lamb was comparable across countries, averaging 2.7 times per week.
Across the Nordic Region, total discretionary food intake remained stable from 2014 to 2024 at around 4.0 times per week. In 2024, Denmark and Iceland reported the highest intake (4.8 and 4.7 times per week), while the other countries ranged from 3.2 to 3.6 times per week.
For total discretionary drinks, intake increased substantially between 2014 and 2024—from 3.9 to 5.6 times per week for the region overall. Consumption rose in all countries, though the increase was statistically significant only in Denmark, Norway, and Iceland. In 2024, the highest intake levels were observed in Iceland (7.9 times per week), Denmark (6.5), and Norway (6.4), nearly double those seen in Sweden and Finland.
Energy drink intake increased in all countries, most notably in Iceland, while changes in Sweden and Norway were not statistically significant. Sugary beverage intake decreased in Sweden and Finland and showed a non-statistically significant decline in Iceland and Norway but increased slightly in Denmark (not statistically significant). Light or sugar-free beverage intake rose in all countries, though not statistically significantly in Finland. Juice intake decreased everywhere, with 2024 levels ranging from 1.1 to 1.7 times per week, lowest in Iceland.
Other food groups of note
Across the Nordic Region, cheese intake increased slightly from 0.6 to 0.7 times per day between 2014 and 2024. The increase was driven by higher consumption in Finland and Iceland, while intake remained unchanged in Denmark, Norway, and Sweden. In 2024, Denmark had the lowest cheese intake (0.5 times per day) and Sweden had the second lowest (0.7 times per day), lower than all other countries.
Total dairy intake was not estimated in 2014. In 2024, Finland reported the highest intake (2.8 times per day), whereas Denmark had the lowest (1.7 times per day)—below Sweden and Iceland, but similar to Norway.
N | 2008 | 1004 |
|---|---|---|
Total Fruit & Vegetable Consumption (times per day) | 2.6 (2.5; 2.6) * | 2.1 (2.0; 2.2) * |
Fruit Consumption (times per day) | 1.4 (1.3; 1.4) * | 0.9 (0.9; 1.0) * |
Vegetable Consumption (times per day) | 1.2 (1.2; 1.2) | 1.2 (1.1; 1.2) |
Pulse Consumption (times per day) | 0.2 (0.2; 0.3) | |
Total Whole Grain Bread Consumption (slices per day) | 3.3 (3.1; 3.4) * | 2.8 (2.6; 3.0) * |
Hard Bread Consumption (slices per day) | 0.3 (0.3; 0.4) | 0.2 (0.2; 0.3) |
Rye Bread Consumption (slices per day) | 1.8 (1.7; 1.9) | 1.8 (1.7; 2.0) |
Whole Grain Bread Wheat Consumption (slices per day) | 1.1 (1.0; 1.2) * | 0.7 (0.6; 0.8) * |
Total Fish Consumption (times per week) | 1.1 (1.0; 1.2) * | 1.6 (1.5; 1.7) * |
Total Meat Consumption (times per week) | 7.1 (6.8; 7.4) | |
Veal, Beef, Lamb Consumption (times per week) | 2.6 (2.4; 2.7) | |
Other Meat (Chicken, Pork, Venison) Consumption (times per week) | 4.6 (4.3; 4.9) | |
Total Dairy Consumption (times per day) | 1.7 (1.6; 1.8) | |
Cheese Consumption (times per day) | 0.5 (0.5; 0.5) | 0.5 (0.5; 0.6) |
Milk Product Consumption (times per day) | 1.2 (1.1; 1.2) | |
Total Discretionary Food Consumption (times per week) | 4.4 (4.2; 4.7) | 4.8 (4.5; 5.1) |
Cake, biscuits, pie, etc. Consumption (times per week) | 1.5 (1.4; 1.6) | 1.6 (1.4; 1.7) |
Chocolate and Candy Consumption (times per week) | 3.0 (2.7; 3.2) | 3.3 (3.1; 3.5) |
Total Discretionary Drink Consumption (times per week) | 4.6 (4.3; 5.0) * | 6.5 (5.8; 7.2) * |
Energy Drinks (times per week) | 0.3 (0.2; 0.4) * | 0.6 (0.4; 0.8) * |
Sugary Beverages (times per week) | 1.8 (1.5; 2.0) | 2.0 (1.7; 2.4) |
Light or Sugar Free Beverages (times per week) | 2.6 (2.3; 2.9) * | 3.9 (3.4; 4.4) * |
Juice Consumption (times per week) | 1.8 (1.7; 1.9) * | 1.3 (1.1; 1.4) * |
* indicates statistically significant difference (p < 0.001) between survey years within a country or region.
Grey cells indicate values not collected and/or not valid for comparison.
N refers to the number of participants that survey year in that country or region. See Appendix 6 for variable-specific sample sizes.
Dietary variables in bold are composites of the variables below.
Pulse consumption is included in vegetable consumption.
Each country contributes equally to the Nordic average.
Whole grain bread is defined as whole grain wheat bread, rye bread and hard bread.
N | 1057 | 1010 |
|---|---|---|
Total Fruit & Vegetable Consumption (times per day) | 2.3 (2.2; 2.4) | 2.2 (2.0; 2.3) |
Fruit Consumption (times per day) | 1.1 (1.0; 1.2) | 1.0 (0.9; 1.0) |
Vegetable Consumption (times per day) | 1.2 (1.1; 1.2) | 1.2 (1.1; 1.2) |
Pulse Consumption (times per day) | 0.1 (0.1; 0.1) | |
Total Whole Grain Bread Consumption (slices per day) | 4.5 (4.3; 4.8) * | 3.4 (3.2; 3.7) * |
Hard Bread Consumption (slices per day) | 1.2 (1.1; 1.3) | 1.1 (0.9; 1.2) |
Rye Bread Consumption (slices per day) | 0.8 (0.7; 0.9) * | 0.2 (0.1; 0.2) * |
Whole Grain Bread Wheat Consumption (slices per day) | 2.5 (2.3; 2.8) | 2.2 (2.0; 2.4) |
Total Fish Consumption (times per week) | 1.8 (1.7; 2.0) * | 2.3 (2.1; 2.4) * |
Total Meat Consumption (times per week) | 5.7 (5.4; 6.0) | |
Veal, Beef, Lamb Consumption (times per week) | 2.6 (2.4; 2.9) | |
Other Meat (Chicken, Pork, Venison) Consumption (times per week) | 3.1 (2.8; 3.4) | |
Total Dairy Consumption (times per day) | 1.9 (1.8; 2.0) | |
Cheese Consumption (times per day) | 0.9 (0.8; 0.9) | 0.8 (0.7; 0.8) |
Milk Product Consumption (times per day) | 1.1 (1.0; 1.2) | |
Total Discretionary Food Consumption (times per week) | 3.5 (2.7; 4.2) | 3.2 (3.0; 3.4) |
Cake, biscuits, pie, etc. Consumption (times per week) | 1.2 (0.8; 1.6) | 0.8 (0.7; 0.8) |
Chocolate and Candy Consumption (times per week) | 2.3 (1.9; 2.7) | 2.4 (2.2; 2.6) |
Total Discretionary Drink Consumption (times per week) | 4.5 (3.7; 5.2) * | 6.4 (5.6; 7.2) * |
Energy Drinks (times per week) | 0.3 (0.2; 0.5) | 1.0 (0.6; 1.3) |
Sugary Beverages (times per week) | 1.8 (1.3; 2.3) | 1.2 (0.8; 1.6) |
Light or Sugar Free Beverages (times per week) | 2.4 (1.9; 2.9) * | 4.2 (3.6; 4.8) * |
Juice Consumption (times per week) | 2.9 (2.5; 3.2) * | 1.7 (1.5; 1.9) * |
* indicates statistically significant difference (p < 0.001) between survey years within a country or region.
Grey cells indicate values not collected and/or not valid for comparison.
N refers to the number of participants that survey year in that country or region. See Appendix 6 for variable-specific sample sizes.
Dietary variables in bold are composites of the variables below.
Pulse consumption is included in vegetable consumption.
Each country contributes equally to the Nordic average.
Whole grain bread is defined as whole grain wheat bread, rye bread and hard bread.
Grey cells indicate values not collected and/or not valid for comparison.
N refers to the number of participants that survey year in that country or region. See Appendix 6 for variable-specific sample sizes.
Dietary variables in bold are composites of the variables below.
Pulse consumption is included in vegetable consumption.
Each country contributes equally to the Nordic average.
Whole grain bread is defined as whole grain wheat bread, rye bread and hard bread.
N | 1801 | 999 |
|---|---|---|
Total Fruit & Vegetable Consumption (times per day) | 2.7 (2.6; 2.8) * | 2.1 (2.0; 2.3) * |
Fruit Consumption (times per day) | 1.2 (1.1; 1.2) * | 0.9 (0.8; 1.0) * |
Vegetable Consumption (times per day) | 1.5 (1.4; 1.5) * | 1.2 (1.2; 1.3) * |
Pulse Consumption (times per day) | 0.2 (0.2; 0.3) | |
Total Whole Grain Bread Consumption (slices per day) | 2.3 (2.2; 2.4) * | 1.6 (1.4; 1.8) * |
Hard Bread Consumption (slices per day) | 1.0 (0.9; 1.0) | 0.8 (0.7; 0.9) |
Rye Bread Consumption (slices per day) | ||
Whole Grain Bread Wheat Consumption (slices per day) | 1.4 (1.3; 1.5) * | 0.8 (0.7; 0.9) * |
Total Fish Consumption (times per week) | 1.5 (1.4; 1.5) | 1.3 (1.2; 1.4) |
Total Meat Consumption (times per week) | 5.2 (4.9; 5.5) | |
Veal, Beef, Lamb Consumption (times per week) | 2.7 (2.5; 2.9) | |
Other Meat (Chicken, Pork, Venison) Consumption (times per week) | 2.5 (2.3; 2.8) | |
Total Dairy Consumption (times per day) | 2.1 (1.9; 2.2) | |
Cheese Consumption (times per day) | 0.7 (0.7; 0.8) | 0.7 (0.6; 0.8) |
Milk Product Consumption (times per day) | 1.4 (1.3; 1.5) | |
Total Discretionary Food Consumption (times per week) | 3.4 (3.2; 3.6) | 3.6 (3.2; 4.0) |
Cake, biscuits, pie, etc. Consumption (times per week) | 1.4 (1.3; 1.6) | 1.3 (1.2; 1.4) |
Chocolate and Candy Consumption (times per week) | 1.9 (1.8; 2.1) | 2.3 (1.9; 2.7) |
Total Discretionary Drink Consumption (times per week) | 3.0 (2.2; 3.8) | 3.9 (3.1; 4.6) |
Energy Drinks (times per week) | 0.4 (0.0; 0.8) | 0.7 (0.3; 1.0) |
Sugary Beverages (times per week) | 1.6 (1.1; 2.0) * | 0.8 (0.7; 0.9) * |
Light or Sugar Free Beverages (times per week) | 1.0 (0.8; 1.2) * | 2.4 (1.9; 2.9) * |
Juice Consumption (times per week) | 2.1 (2.0; 2.3) * | 1.4 (1.1; 1.7) * |
* indicates statistically significant difference (p < 0.001) between survey years within a country or region.
Grey cells indicate values not collected and/or not valid for comparison.
N refers to the number of participants that survey year in that country or region. See Appendix 6 for variable-specific sample sizes.
Dietary variables in bold are composites of the variables below.
Pulse consumption is included in vegetable consumption.
Each country contributes equally to the Nordic average.
Whole grain bread is defined as whole grain wheat bread, rye bread and hard bread.
Grey cells indicate values not collected and/or not valid for comparison.
N refers to the number of participants that survey year in that country or region. See Appendix 6 for variable-specific sample sizes.
Dietary variables in bold are composites of the variables below.
Pulse consumption is included in vegetable consumption.
Each country contributes equally to the Nordic average.
Whole grain bread is defined as whole grain wheat bread, rye bread and hard bread.
N | 1717 | 1020 |
|---|---|---|
Total Fruit & Vegetable Consumption (times per day) | 2.6 (2.5; 2.6) | 2.5 (2.4; 2.7) |
Fruit Consumption (times per day) | 1.2 (1.1; 1.2) | 1.1 (1.0; 1.2) |
Vegetable Consumption (times per day) | 1.4 (1.3; 1.4) | 1.4 (1.3; 1.5) |
Pulse Consumption (times per day) | 0.1 (0.1; 0.2) | |
Total Whole Grain Bread Consumption (slices per day) | 3.7 (3.6; 3.9) * | 2.8 (2.6; 3.0) * |
Hard Bread Consumption (slices per day) | 0.4 (0.4; 0.5) * | 0.3 (0.2; 0.3) * |
Rye Bread Consumption (slices per day) | 2.3 (2.2; 2.4) * | 1.6 (1.5; 1.7) * |
Whole Grain Bread Wheat Consumption (slices per day) | 1.0 (0.9; 1.1) | 1.0 (0.9; 1.1) |
Total Fish Consumption (times per week) | 1.4 (1.3; 1.5) * | 1.2 (1.1; 1.3) * |
Total Meat Consumption (times per week) | 7.0 (6.6; 7.4) | |
Veal, Beef, Lamb Consumption (times per week) | 2.9 (2.6; 3.1) | |
Other Meat (Chicken, Pork, Venison) Consumption (times per week) | 4.1 (3.8; 4.5) | |
Total Dairy Consumption (times per day) | 2.8 (2.7; 3.0) | |
Cheese Consumption (times per day) | 0.6 (0.5; 0.6) * | 0.9 (0.8; 1.0) * |
Milk Product Consumption (times per day) | 2.0 (1.8; 2.1) | |
Total Discretionary Food Consumption (times per week) | 4.1 (3.9; 4.4) | 3.6 (3.3; 3.9) |
Cake, biscuits, pie, etc. Consumption (times per week) | 2.1 (2.0; 2.3) * | 1.6 (1.5; 1.8) * |
Chocolate and Candy Consumption (times per week) | 2.0 (1.9; 2.2) | 2.0 (1.8; 2.2) |
Total Discretionary Drink Consumption (times per week) | 3.2 (2.9; 3.6) | 3.5 (3.1; 3.9) |
Energy Drinks (times per week) | 0.2 (0.1; 0.2) * | 0.5 (0.4; 0.7) * |
Sugary Beverages (times per week) | 1.3 (1.1; 1.5) * | 0.9 (0.8; 1.0) * |
Light or Sugar Free Beverages (times per week) | 1.8 (1.6; 2.0) | 2.1 (1.7; 2.5) |
Juice Consumption (times per week) | 2.3 (2.1; 2.5) * | 1.7 (1.5; 2.0) * |
* indicates statistically significant difference (p < 0.001) between survey years within a country or region.
Grey cells indicate values not collected and/or not valid for comparison.
N refers to the number of participants that survey year in that country or region. See Appendix 6 for variable-specific sample sizes.
Dietary variables in bold are composites of the variables below.
Pulse consumption is included in vegetable consumption.
Each country contributes equally to the Nordic average.
Whole grain bread is defined as whole grain wheat bread, rye bread and hard bread.
Grey cells indicate values not collected and/or not valid for comparison.
N refers to the number of participants that survey year in that country or region. See Appendix 6 for variable-specific sample sizes.
Dietary variables in bold are composites of the variables below.
Pulse consumption is included in vegetable consumption.
Each country contributes equally to the Nordic average.
Whole grain bread is defined as whole grain wheat bread, rye bread and hard bread.
N | 2012 | 1021 |
|---|---|---|
Total Fruit & Vegetable Consumption (times per day) | 2.1 (2.0; 2.2) * | 1.9 (1.7; 2.0) * |
Fruit Consumption (times per day) | 1.0 (1.0; 1.1) | 0.9 (0.8; 1.0) |
Vegetable Consumption (times per day) | 1.1 (1.0; 1.1) | 1.0 (0.9; 1.0) |
Pulse Consumption (times per day) | 0.1 (0.1; 0.1) | |
Total Whole Grain Bread Consumption (slices per day) | 2.2 (2.1; 2.3) * | 1.1 (1.0; 1.2) * |
Hard Bread Consumption (slices per day) | 0.8 (0.7; 0.8) * | 0.4 (0.4; 0.5) * |
Rye Bread Consumption (slices per day) | 0.7 (0.7; 0.8) * | 0.1 (0.1; 0.1) * |
Whole Grain Bread Wheat Consumption (slices per day) | 0.7 (0.7; 0.8) | 0.6 (0.5; 0.6) |
Total Fish Consumption (times per week) | 2.0 (1.9; 2.1) * | 1.8 (1.7; 1.9) * |
Total Meat Consumption (times per week) | 5.0 (4.7; 5.3) | |
Veal, Beef, Lamb Consumption (times per week) | 2.6 (2.4; 2.8) | |
Other Meat (Chicken, Pork, Venison) Consumption (times per week) | 2.4 (2.2; 2.6) | |
Total Dairy Consumption (times per day) | 2.0 (1.9; 2.1) | |
Cheese Consumption (times per day) | 0.5 (0.5; 0.6) * | 0.7 (0.7; 0.8) * |
Milk Product Consumption (times per day) | 1.3 (1.2; 1.4) | |
Total Discretionary Food Consumption (times per week) | 4.8 (4.6; 5.0) | 4.7 (4.3; 5.1) |
Cake, biscuits, pie, etc. Consumption (times per week) | 1.9 (1.8; 2.0) | 1.6 (1.5; 1.8) |
Chocolate and Candy Consumption (times per week) | 3.0 (2.8; 3.1) | 3.1 (2.8; 3.3) |
Total Discretionary Drink Consumption (times per week) | 4.0 (3.6; 4.4) * | 7.9 (7.1; 8.8) * |
Energy Drinks (times per week) | 0.2 (0.2; 0.3) * | 2.5 (2.0; 2.9) * |
Sugary Beverages (times per week) | 2.0 (1.7; 2.3) | 1.5 (1.3; 1.8) |
Light or Sugar Free Beverages (times per week) | 1.7 (1.5; 2.0) * | 3.9 (3.4; 4.5) * |
Juice Consumption (times per week) | 2.5 (2.4; 2.7) * | 1.1 (0.9; 1.2) * |
* indicates statistically significant difference (p < 0.001) between survey years within a country or region.
Grey cells indicate values not collected and/or not valid for comparison.
N refers to the number of participants that survey year in that country or region. See Appendix 6 for variable-specific sample sizes.
Dietary variables in bold are composites of the variables below.
Pulse consumption is included in vegetable consumption.
Each country contributes equally to the Nordic average.
Whole grain bread is defined as whole grain wheat bread, rye bread and hard bread.
Grey cells indicate values not collected and/or not valid for comparison.
N refers to the number of participants that survey year in that country or region. See Appendix 6 for variable-specific sample sizes.
Dietary variables in bold are composites of the variables below.
Pulse consumption is included in vegetable consumption.
Each country contributes equally to the Nordic average.
Whole grain bread is defined as whole grain wheat bread, rye bread and hard bread.
N | 8595 | 5054 |
|---|---|---|
Total Fruit & Vegetable Consumption (times per day) | 2.4 (2.4; 2.5) * | 2.2 (2.1; 2.2) * |
Fruit Consumption (times per day) | 1.2 (1.1; 1.2) * | 1.0 (0.9; 1.0) * |
Vegetable Consumption (times per day) | 1.3 (1.2; 1.3) * | 1.2 (1.2; 1.2) * |
Pulse Consumption (times per day) | 0.2 (0.2; 0.2) | |
Total Whole Grain Bread Consumption (slices per day) | 3.2 (3.1; 3.3) * | 2.3 (2.3; 2.4) * |
Hard Bread Consumption (slices per day) | 0.7 (0.7; 0.8) * | 0.5 (0.5; 0.6) * |
Rye Bread Consumption (slices per day) | ||
Whole Grain Bread Wheat Consumption (slices per day) | 1.3 (1.3; 1.4) * | 1.1 (1.0; 1.1) * |
Total Fish Consumption (times per week) | 1.6 (1.5; 1.6) | 1.6 (1.6; 1.7) |
Total Meat Consumption (times per week) | 6.0 (5.8; 6.2) | |
Veal, Beef, Lamb Consumption (times per week) | 2.7 (2.6; 2.8) | |
Other Meat (Chicken, Pork, Venison) Consumption (times per week) | 3.3 (3.2; 3.5) | |
Total Dairy Consumption (times per day) | 2.1 (2.0; 2.2) | |
Cheese Consumption (times per day) | 0.6 (0.6; 0.7) * | 0.7 (0.7; 0.7) * |
Milk Product Consumption (times per day) | 1.4 (1.3; 1.4) | |
Total Discretionary Food Consumption (times per week) | 4.1 (3.9; 4.2) | 4.0 (3.8; 4.1) |
Cake, biscuits, pie, etc. Consumption (times per week) | 1.6 (1.5; 1.7) * | 1.4 (1.3; 1.4) * |
Chocolate and Candy Consumption (times per week) | 2.4 (2.3; 2.5) | 2.6 (2.5; 2.7) |
Total Discretionary Drink Consumption (times per week) | 3.9 (3.6; 4.1) * | 5.6 (5.3; 6.0) * |
Energy Drinks (times per week) | 0.3 (0.2; 0.4) * | 1.1 (0.9; 1.2) * |
Sugary Beverages (times per week) | 1.7 (1.5; 1.8) * | 1.3 (1.2; 1.4) * |
Light or Sugar Free Beverages (times per week) | 1.9 (1.8; 2.0) * | 3.3 (3.1; 3.5) * |
Juice Consumption (times per week) | 2.3 (2.2; 2.4) * | 1.4 (1.3; 1.5) * |
* indicates statistically significant difference (p < 0.001) between survey years within a country or region.
Grey cells indicate values not collected and/or not valid for comparison.
N refers to the number of participants that survey year in that country or region. See Appendix 6 for variable-specific sample sizes.
Dietary variables in bold are composites of the variables below.
Pulse consumption is included in vegetable consumption.
Each country contributes equally to the Nordic average.
Whole grain bread is defined as whole grain wheat bread, rye bread and hard bread.
Grey cells indicate values not collected and/or not valid for comparison.
N refers to the number of participants that survey year in that country or region. See Appendix 6 for variable-specific sample sizes.
Dietary variables in bold are composites of the variables below.
Pulse consumption is included in vegetable consumption.
Each country contributes equally to the Nordic average.
Whole grain bread is defined as whole grain wheat bread, rye bread and hard bread.
Demographic Differences
Gender
Across the Nordic Region, women reported a higher intake of total fruits and vegetables (2.5 times per day) than men (1.8 times per day). This difference was also found in all Nordic countries individually. The same pattern appeared for fruit and vegetable intake separately, although the difference in fruit intake was not statistically significant in Denmark.
In contrast, men reported a higher intake of whole-grain bread (2.6 slices per day) than women (2.1 slices per day). This pattern was also evident in Norway (4.0 vs 2.8 slices per day) and Denmark (3.1 vs 2.4 slices per day).
Men also reported higher intake of total meat, veal/beef/lamb, and other meat across the Nordic Region (6.6, 3.0 and 3.6 times per week, respectively) compared with women (5.3, 2.3 and 3.1 times per week). This gender difference was consistent across countries, although not statistically significant for other meat or, in Finland, for total or veal/beef/lamb meat. The highest total meat intake was observed among men in Denmark and Finland (7.9 and 7.5 times per week), and the lowest among women in Sweden and Iceland (4.6 and 4.4 times per week).
For beverages, men reported higher intakes of sugary beverages (1.6 vs 1.0 times per week) and juice (1.7 vs 1.2 times per week) than women. Women, on the other hand, reported higher intake of total discretionary foods (4.2 vs 3.7 times per week) and chocolate and candy (2.9 vs 2.3 times per week). The gender difference in sugary beverage intake was significant in Denmark (2.6 vs 1.5 times per week) and Sweden (1.0 vs 0.6 times per week), and for energy drinks in Denmark (0.9 vs 0.3 times per week). Only in Denmark and Finland did women consume significantly more chocolate and candy than men (3.7 vs 2.9 and 2.4 vs 1.6 times per week, respectively).
No statistically significant gender differences were observed for intake of pulses, fish, total dairy, milk, cheese, cake and biscuits, total discretionary drinks, or light/sugar-free beverages.
N | 482 | 522 |
|---|---|---|
Total Fruit & Vegetable Consumption (times per day) | 1.9 (1.7; 2.1) * | 2.3 (2.2; 2.5) * |
Fruit Consumption (times per day) | 0.8 (0.7; 0.9) | 1.0 (0.9; 1.1) |
Vegetable Consumption (times per day) | 1.0 (0.9; 1.2) * | 1.3 (1.2; 1.4) * |
Pulse Consumption (times per day) | 0.2 (0.2; 0.2) | 0.2 (0.2; 0.3) |
Total Whole Grain Bread Consumption (slices per day) | 3.1 (2.8; 3.4) * | 2.4 (2.2; 2.6) * |
Hard Bread Consumption (slices per day) | 0.1 (0.1; 0.2) | 0.3 (0.2; 0.5) |
Rye Bread Consumption (slices per day) | 2.3 (2.0; 2.5) * | 1.3 (1.2; 1.5) * |
Whole Grain Bread Wheat Consumption (slices per day) | 0.7 (0.6; 0.8) | 0.7 (0.6; 0.8) |
Total Fish Consumption (times per week) | 1.5 (1.3; 1.7) | 1.7 (1.5; 1.9) |
Total Meat Consumption (times per week) | 7.9 (7.4; 8.4) * | 6.3 (5.9; 6.7) * |
Veal, Beef, Lamb Consumption (times per week) | 2.9 (2.6; 3.2) * | 2.2 (1.9; 2.4) * |
Other Meat (Chicken, Pork, Venison) Consumption (times per week) | 5.0 (4.5; 5.5) | 4.1 (3.7; 4.5) |
Total Dairy Consumption (times per day) | 1.6 (1.4; 1.7) | 1.8 (1.7; 1.9) |
Cheese Consumption (times per day) | 0.5 (0.5; 0.6) | 0.6 (0.5; 0.6) |
Milk Product Consumption (times per day) | 1.1 (0.9; 1.2) | 1.2 (1.1; 1.4) |
Total Discretionary Food Consumption (times per week) | 4.4 (4.0; 4.8) | 5.3 (4.8; 5.7) |
Cake, biscuits, pie, etc. Consumption (times per week) | 1.5 (1.4; 1.7) | 1.6 (1.4; 1.7) |
Chocolate and Candy Consumption (times per week) | 2.9 (2.6; 3.2) * | 3.7 (3.4; 4.1) * |
Total Discretionary Drink Consumption (times per week) | 7.6 (6.5; 8.7) | 5.4 (4.6; 6.2) |
Energy Drinks (times per week) | 0.9 (0.6; 1.2) * | 0.3 (0.2; 0.5) * |
Sugary Beverages (times per week) | 2.6 (2.1; 3.1) | 1.5 (1.1; 1.9) |
Light or Sugar Free Beverages (times per week) | 4.2 (3.4; 5.0) | 3.6 (3.0; 4.3) |
Juice Consumption (times per week) | 1.4 (1.1; 1.7) | 1.1 (1.0; 1.3) |
* indicates statistically significant difference (p < 0.001) between genders within a country or region.
N refers to the number of participants with the gender in that country or region. See Appendix 6 for variable-specific sample sizes.
Dietary variables in bold are composites of the variables below.
Pulse consumption is included in vegetable consumption.
Each country contributes equally to the Nordic average.
Whole grain bread is defined as whole grain wheat bread, rye bread and hard bread.
N | 499 | 511 |
|---|---|---|
Total Fruit & Vegetable Consumption (times per day) | 1.8 (1.7; 2.0) * | 2.5 (2.3; 2.6) * |
Fruit Consumption (times per day) | 0.8 (0.7; 0.9) * | 1.1 (1.0; 1.2) * |
Vegetable Consumption (times per day) | 1.0 (0.9; 1.1) * | 1.3 (1.2; 1.4) * |
Pulse Consumption (times per day) | 0.1 (0.1; 0.1) | 0.1 (0.1; 0.1) |
Total Whole Grain Bread Consumption (slices per day) | 4.0 (3.7; 4.4) * | 2.8 (2.6; 3.1) * |
Hard Bread Consumption (slices per day) | 0.9 (0.7; 1.0) | 1.2 (1.1; 1.4) |
Rye Bread Consumption (slices per day) | 0.2 (0.1; 0.3) | 0.1 (0.1; 0.2) |
Whole Grain Bread Wheat Consumption (slices per day) | 2.9 (2.6; 3.2) * | 1.5 (1.3; 1.7) * |
Total Fish Consumption (times per week) | 2.3 (2.1; 2.5) | 2.3 (2.1; 2.5) |
Total Meat Consumption (times per week) | 6.4 (5.9; 6.9) * | 5.0 (4.6; 5.4) * |
Veal, Beef, Lamb Consumption (times per week) | 3.1 (2.7; 3.4) * | 2.2 (2.0; 2.4) * |
Other Meat (Chicken, Pork, Venison) Consumption (times per week) | 3.3 (2.9; 3.8) | 2.8 (2.4; 3.2) |
Total Dairy Consumption (times per day) | 1.9 (1.8; 2.1) | 1.8 (1.7; 2.0) |
Cheese Consumption (times per day) | 0.8 (0.7; 0.8) | 0.8 (0.7; 0.9) |
Milk Product Consumption (times per day) | 1.2 (1.1; 1.3) | 1.0 (0.9; 1.2) |
Total Discretionary Food Consumption (times per week) | 2.9 (2.7; 3.2) | 3.4 (3.1; 3.7) |
Cake, biscuits, pie, etc. Consumption (times per week) | 0.8 (0.7; 0.9) | 0.8 (0.7; 0.9) |
Chocolate and Candy Consumption (times per week) | 2.2 (2.0; 2.4) | 2.7 (2.4; 3.0) |
Total Discretionary Drink Consumption (times per week) | 6.7 (5.8; 7.7) | 6.1 (4.7; 7.4) |
Energy Drinks (times per week) | 1.0 (0.7; 1.4) | 0.9 (0.2; 1.5) |
Sugary Beverages (times per week) | 1.6 (1.0; 2.2) | 0.9 (0.4; 1.4) |
Light or Sugar Free Beverages (times per week) | 4.1 (3.4; 4.8) | 4.3 (3.4; 5.2) |
Juice Consumption (times per week) | 2.0 (1.6; 2.3) | 1.4 (1.1; 1.7) |
* indicates statistically significant difference (p < 0.001) between genders within a country or region.
N refers to the number of participants with the gender in that country or region. See Appendix 6 for variable-specific sample sizes.
Dietary variables in bold are composites of the variables below.
Pulse consumption is included in vegetable consumption.
Each country contributes equally to the Nordic average.
Whole grain bread is defined as whole grain wheat bread, rye bread and hard bread.
N refers to the number of participants with the gender in that country or region. See Appendix 6 for variable-specific sample sizes.
Dietary variables in bold are composites of the variables below.
Pulse consumption is included in vegetable consumption.
Each country contributes equally to the Nordic average.
Whole grain bread is defined as whole grain wheat bread, rye bread and hard bread.
N | 463 | 536 |
|---|---|---|
Total Fruit & Vegetable Consumption (times per day) | 1.8 (1.6; 1.9) * | 2.5 (2.4; 2.7) * |
Fruit Consumption (times per day) | 0.7 (0.6; 0.8) * | 1.1 (1.0; 1.2) * |
Vegetable Consumption (times per day) | 1.0 (0.9; 1.1) * | 1.5 (1.3; 1.6) * |
Pulse Consumption (times per day) | 0.2 (0.1; 0.2) | 0.3 (0.2; 0.3) |
Total Whole Grain Bread Consumption (slices per day) | 1.8 (1.5; 2.1) | 1.4 (1.3; 1.6) |
Hard Bread Consumption (slices per day) | 0.8 (0.6; 1.0) | 0.7 (0.6; 0.8) |
Rye Bread Consumption (slices per day) | ||
Whole Grain Bread Wheat Consumption (slices per day) | 1.0 (0.8; 1.1) | 0.7 (0.6; 0.8) |
Total Fish Consumption (times per week) | 1.2 (1.0; 1.4) | 1.4 (1.3; 1.6) |
Total Meat Consumption (times per week) | 5.8 (5.4; 6.2) * | 4.6 (4.3; 5.0) * |
Veal, Beef, Lamb Consumption (times per week) | 3.2 (2.8; 3.5) * | 2.2 (1.9; 2.5) * |
Other Meat (Chicken, Pork, Venison) Consumption (times per week) | 2.6 (2.3; 3.0) | 2.4 (2.1; 2.8) |
Total Dairy Consumption (times per day) | 2.0 (1.8; 2.3) | 2.1 (1.9; 2.2) |
Cheese Consumption (times per day) | 0.8 (0.6; 0.9) | 0.6 (0.6; 0.7) |
Milk Product Consumption (times per day) | 1.3 (1.1; 1.5) | 1.5 (1.3; 1.6) |
Total Discretionary Food Consumption (times per week) | 3.5 (2.8; 4.1) | 3.7 (3.3; 4.2) |
Cake, biscuits, pie, etc. Consumption (times per week) | 1.3 (1.1; 1.5) | 1.3 (1.2; 1.5) |
Chocolate and Candy Consumption (times per week) | 2.2 (1.6; 2.8) | 2.4 (2.1; 2.8) |
Total Discretionary Drink Consumption (times per week) | 4.6 (3.2; 5.9) | 3.1 (2.5; 3.8) |
Energy Drinks (times per week) | 1.0 (0.3; 1.6) | 0.4 (0.2; 0.6) |
Sugary Beverages (times per week) | 1.0 (0.8; 1.3) * | 0.6 (0.4; 0.7) * |
Light or Sugar Free Beverages (times per week) | 2.6 (1.7; 3.4) | 2.2 (1.7; 2.7) |
Juice Consumption (times per week) | 1.8 (1.3; 2.3) | 1.0 (0.8; 1.2) |
* indicates statistically significant difference (p < 0.001) between genders within a country or region.
Grey cells indicate values not collected and/or not valid for comparison.
N refers to the number of participants with the gender in that country or region. See Appendix 6 for variable-specific sample sizes.
Dietary variables in bold are composites of the variables below.
Pulse consumption is included in vegetable consumption.
Each country contributes equally to the Nordic average.
Whole grain bread is defined as whole grain wheat bread, rye bread and hard bread.
N | 480 | 540 |
|---|---|---|
Total Fruit & Vegetable Consumption (times per day) | 2.0 (1.8; 2.2) * | 3.1 (2.9; 3.4) * |
Fruit Consumption (times per day) | 0.8 (0.8; 0.9) * | 1.5 (1.3; 1.7) * |
Vegetable Consumption (times per day) | 1.2 (1.1; 1.3) * | 1.6 (1.5; 1.8) * |
Pulse Consumption (times per day) | 0.1 (0.1; 0.2) | 0.1 (0.1; 0.2) |
Total Whole Grain Bread Consumption (slices per day) | 3.0 (2.7; 3.2) | 2.6 (2.4; 2.9) |
Hard Bread Consumption (slices per day) | 0.2 (0.2; 0.3) | 0.3 (0.2; 0.3) |
Rye Bread Consumption (slices per day) | 1.8 (1.6; 2.0) * | 1.3 (1.2; 1.5) * |
Whole Grain Bread Wheat Consumption (slices per day) | 0.9 (0.8; 1.1) | 1.0 (0.9; 1.2) |
Total Fish Consumption (times per week) | 1.1 (1.0; 1.2) | 1.2 (1.1; 1.3) |
Total Meat Consumption (times per week) | 7.5 (6.9; 8.0) | 6.4 (5.8; 7.0) |
Veal, Beef, Lamb Consumption (times per week) | 3.0 (2.7; 3.4) | 2.6 (2.3; 3.0) |
Other Meat (Chicken, Pork, Venison) Consumption (times per week) | 4.4 (3.9; 4.9) | 3.8 (3.3; 4.2) |
Total Dairy Consumption (times per day) | 3.0 (2.7; 3.3) | 2.7 (2.4; 2.9) |
Cheese Consumption (times per day) | 0.9 (0.8; 1.1) | 0.8 (0.7; 0.9) |
Milk Product Consumption (times per day) | 2.1 (1.9; 2.3) | 1.9 (1.7; 2.1) |
Total Discretionary Food Consumption (times per week) | 3.2 (2.8; 3.7) | 4.0 (3.7; 4.4) |
Cake, biscuits, pie, etc. Consumption (times per week) | 1.7 (1.4; 1.9) | 1.6 (1.4; 1.8) |
Chocolate and Candy Consumption (times per week) | 1.6 (1.4; 1.8) * | 2.4 (2.1; 2.7) * |
Total Discretionary Drink Consumption (times per week) | 3.9 (3.3; 4.4) | 3.1 (2.4; 3.8) |
Energy Drinks (times per week) | 0.6 (0.4; 0.8) | 0.4 (0.2; 0.7) |
Sugary Beverages (times per week) | 1.1 (0.9; 1.3) | 0.7 (0.5; 0.9) |
Light or Sugar Free Beverages (times per week) | 2.2 (1.7; 2.7) | 2.0 (1.4; 2.6) |
Juice Consumption (times per week) | 2.0 (1.6; 2.4) | 1.4 (1.0; 1.7) |
* indicates statistically significant difference (p < 0.001) between genders within a country or region.
N refers to the number of participants with the gender in that country or region. See Appendix 6 for variable-specific sample sizes.
Dietary variables in bold are composites of the variables below.
Pulse consumption is included in vegetable consumption.
Each country contributes equally to the Nordic average.
Whole grain bread is defined as whole grain wheat bread, rye bread and hard bread.
N | 439 | 582 |
|---|---|---|
Total Fruit & Vegetable Consumption (times per day) | 1.6 (1.4; 1.8) * | 2.1 (1.9; 2.3) * |
Fruit Consumption (times per day) | 0.8 (0.7; 0.9) * | 1.0 (0.9; 1.1) * |
Vegetable Consumption (times per day) | 0.8 (0.8; 0.9) * | 1.1 (1.0; 1.2) * |
Pulse Consumption (times per day) | 0.1 (0.1; 0.1) | 0.1 (0.1; 0.2) |
Total Whole Grain Bread Consumption (slices per day) | 1.1 (1.0; 1.3) | 1.1 (1.0; 1.2) |
Hard Bread Consumption (slices per day) | 0.3 (0.2; 0.4) * | 0.6 (0.5; 0.7) * |
Rye Bread Consumption (slices per day) | 0.1 (0.1; 0.2) | 0.1 (0.1; 0.1) |
Whole Grain Bread Wheat Consumption (slices per day) | 0.7 (0.6; 0.8) * | 0.4 (0.4; 0.5) * |
Total Fish Consumption (times per week) | 1.8 (1.7; 2.0) | 1.7 (1.6; 1.8) |
Total Meat Consumption (times per week) | 5.6 (5.1; 6.0) * | 4.4 (4.0; 4.7) * |
Veal, Beef, Lamb Consumption (times per week) | 3.0 (2.7; 3.3) * | 2.1 (1.9; 2.3) * |
Other Meat (Chicken, Pork, Venison) Consumption (times per week) | 2.6 (2.2; 2.9) | 2.2 (2.0; 2.5) |
Total Dairy Consumption (times per day) | 2.1 (1.9; 2.3) | 2.0 (1.8; 2.1) |
Cheese Consumption (times per day) | 0.7 (0.6; 0.7) | 0.8 (0.7; 0.8) |
Milk Product Consumption (times per day) | 1.4 (1.2; 1.6) | 1.2 (1.1; 1.3) |
Total Discretionary Food Consumption (times per week) | 4.7 (4.1; 5.3) | 4.7 (4.2; 5.2) |
Cake, biscuits, pie, etc. Consumption (times per week) | 1.9 (1.6; 2.2) | 1.3 (1.2; 1.5) |
Chocolate and Candy Consumption (times per week) | 2.8 (2.4; 3.2) | 3.4 (3.0; 3.7) |
Total Discretionary Drink Consumption (times per week) | 8.2 (7.0; 9.5) | 7.6 (6.5; 8.7) |
Energy Drinks (times per week) | 2.3 (1.7; 3.0) | 2.6 (2.0; 3.2) |
Sugary Beverages (times per week) | 1.9 (1.4; 2.3) | 1.2 (0.8; 1.6) |
Light or Sugar Free Beverages (times per week) | 4.1 (3.3; 4.8) | 3.8 (3.1; 4.5) |
Juice Consumption (times per week) | 1.3 (1.0; 1.5) | 0.9 (0.7; 1.1) |
* indicates statistically significant difference (p < 0.001) between genders within a country or region.
N refers to the number of participants with the gender in that country or region. See Appendix 6 for variable-specific sample sizes.
Dietary variables in bold are composites of the variables below.
Pulse consumption is included in vegetable consumption.
Each country contributes equally to the Nordic average.
Whole grain bread is defined as whole grain wheat bread, rye bread and hard bread.
N refers to the number of participants with the gender in that country or region. See Appendix 6 for variable-specific sample sizes.
Dietary variables in bold are composites of the variables below.
Pulse consumption is included in vegetable consumption.
Each country contributes equally to the Nordic average.
Whole grain bread is defined as whole grain wheat bread, rye bread and hard bread.
N | 2363 | 2691 |
|---|---|---|
Total Fruit & Vegetable Consumption (times per day) | 1.8 (1.7; 1.9) * | 2.5 (2.4; 2.6) * |
Fruit Consumption (times per day) | 0.8 (0.8; 0.8) * | 1.1 (1.1; 1.2) * |
Vegetable Consumption (times per day) | 1.0 (1.0; 1.1) * | 1.4 (1.3; 1.4) * |
Pulse Consumption (times per day) | 0.1 (0.1; 0.2) | 0.2 (0.2; 0.2) |
Total Whole Grain Bread Consumption (slices per day) | 2.6 (2.5; 2.7) * | 2.1 (2.0; 2.2) * |
Hard Bread Consumption (slices per day) | 0.5 (0.4; 0.5) * | 0.6 (0.6; 0.7) * |
Rye Bread Consumption (slices per day) | ||
Whole Grain Bread Wheat Consumption (slices per day) | 1.2 (1.1; 1.3) * | 0.9 (0.8; 0.9) * |
Total Fish Consumption (times per week) | 1.6 (1.5; 1.7) | 1.7 (1.6; 1.8) |
Total Meat Consumption (times per week) | 6.6 (6.4; 6.8) * | 5.3 (5.1; 5.5) * |
Veal, Beef, Lamb Consumption (times per week) | 3.0 (2.9; 3.2) * | 2.3 (2.2; 2.4) * |
Other Meat (Chicken, Pork, Venison) Consumption (times per week) | 3.6 (3.4; 3.8) * | 3.1 (2.9; 3.2) * |
Total Dairy Consumption (times per day) | 2.1 (2.0; 2.2) | 2.1 (2.0; 2.1) |
Cheese Consumption (times per day) | 0.7 (0.7; 0.8) | 0.7 (0.7; 0.7) |
Milk Product Consumption (times per day) | 1.4 (1.3; 1.5) | 1.4 (1.3; 1.4) |
Total Discretionary Food Consumption (times per week) | 3.7 (3.5; 4.0) * | 4.2 (4.1; 4.4) * |
Cake, biscuits, pie, etc. Consumption (times per week) | 1.4 (1.3; 1.5) | 1.3 (1.2; 1.4) |
Chocolate and Candy Consumption (times per week) | 2.3 (2.1; 2.5) * | 2.9 (2.8; 3.1) * |
Total Discretionary Drink Consumption (times per week) | 6.2 (5.7; 6.7) | 5.1 (4.6; 5.5) |
Energy Drinks (times per week) | 1.2 (0.9; 1.4) | 0.9 (0.7; 1.1) |
Sugary Beverages (times per week) | 1.6 (1.4; 1.8) * | 1.0 (0.8; 1.1) * |
Light or Sugar Free Beverages (times per week) | 3.4 (3.1; 3.7) | 3.2 (2.9; 3.5) |
Juice Consumption (times per week) | 1.7 (1.5; 1.8) * | 1.2 (1.1; 1.3) * |
* indicates statistically significant difference (p < 0.001) between genders within a country or region.
Grey cells indicate values not collected and/or not valid for comparison.
N refers to the number of participants with the gender in that country or region. See Appendix 6 for variable-specific sample sizes.
Dietary variables in bold are composites of the variables below.
Pulse consumption is included in vegetable consumption.
Each country contributes equally to the Nordic average.
Whole grain bread is defined as whole grain wheat bread, rye bread and hard bread.
Age
Across the Nordic Region, age-related differences among adults were observed for many food groups, although the pattern was less consistent within individual countries.
Intake of total fruits and vegetables and vegetables alone was highest among adults aged 30–44 years (2.3 and 1.3 times per day, respectively). A similar pattern was observed in Finland (2.9 times per day for total fruits and vegetables and 1.3 for vegetables), and for vegetables only in Denmark, where the middle-aged group consumed more than the oldest group but not more than the youngest. In Iceland, both the youngest and middle-aged adults reported higher intake than the oldest group.
Intake of pulses was lowest among adults 45-65 years across the Nordic Region. The same trend was seen in Denmark and Iceland, where the youngest adults (18–29 years) reported the highest consumption (0.3 and 0.2 times per day, respectively).
Intake of whole-grain bread increased with age. Across the Nordic Region, the oldest adults reported the highest consumption (2.7 slices per day). Similar patterns were seen in Sweden (2.0 slices per day in the oldest group vs 1.3 in middle-aged and 1.4 in young adults), in Finland (3.4 vs 1.9 slices per day in oldest vs youngest groups), and in Iceland (1.4 slices per day in the oldest group vs 1.0 and 0.7 in the middle and youngest groups, respectively).
Fish intake also tended to increase with age. Across the Nordic Region, adults 45-65 years consumed fish 1.8 times per week, compared with 1.7 times in the youngest group. The same trend appeared in Norway (2.6 vs 1.7 times per week) and Iceland (1.7 vs 1.4 times per week).
Cheese intake increased modestly with age across the region, with similar trends in Denmark and Sweden.
In contrast, intake of total meat, veal/beef/lamb, and other meat decreased with age. Across the Nordic Region, the youngest adults (18–29 years) reported the highest consumption (6.9, 3.0 and 3.9 times per week, respectively) compared with the oldest adults (5.4, 2.5 and 3.0 times per week). The same tendency was found for total meat and other meat in Finland, for total meat in Norway, and for other meat in Iceland.
Intake of cakes, biscuits, and pies increased slightly with age (1.5 times per week in the oldest group vs 1.2 in the youngest), a trend also observed in Finland. In contrast, total discretionary drink and energy drink intake decreased with age. The youngest adults reported the highest levels (7.5 and 2.4 times per week, respectively), compared with 4.2 and 0.3 times per week in those 45-65 years. Similar age trends for total discretionary drinks were found in Sweden and Iceland, and for energy drinks in all countries (except Norway, where the difference was not significant). The youngest and middle-aged adults also consumed more light or sugar-free beverages than those 45-65 years.
No statistically significant age differences were observed for intake of fruits, total dairy, milk, total discretionary foods, chocolate and candy, sugary beverages, or juice.
N | 115 | 248 | 641 |
|---|---|---|---|
Total Fruit & Vegetable Consumption (times per day) | 2.1 (1.7; 2.4) | 2.3 (2.1; 2.5) | 2.0 (1.8; 2.1) |
Fruit Consumption (times per day) | 0.8 (0.7; 1.0) | 1.0 (0.9; 1.1) | 1.0 (0.9; 1.0) |
Vegetable Consumption (times per day) | 1.2 (1.0; 1.4) [ab] | 1.3 (1.2; 1.5) [b] | 1.0 (1.0; 1.1) [a] |
Pulse Consumption (times per day) | 0.3 (0.2; 0.4) [b] | 0.2 (0.2; 0.3) [ab] | 0.2 (0.1; 0.2) [a] |
Total Whole Grain Bread Consumption (slices per day) | 3.1 (2.5; 3.7) | 2.7 (2.4; 3.0) | 2.6 (2.4; 2.8) |
Hard Bread Consumption (slices per day) | 0.2 (0.0; 0.4) | 0.2 (0.2; 0.3) | 0.3 (0.2; 0.3) |
Rye Bread Consumption (slices per day) | 2.0 (1.6; 2.4) | 1.9 (1.6; 2.2) | 1.7 (1.6; 1.8) |
Whole Grain Bread Wheat Consumption (slices per day) | 0.8 (0.5; 1.1) | 0.6 (0.5; 0.7) | 0.7 (0.6; 0.8) |
Total Fish Consumption (times per week) | 1.5 (1.2; 1.8) | 1.5 (1.3; 1.7) | 1.8 (1.6; 2.0) |
Total Meat Consumption (times per week) | 7.3 (6.4; 8.2) | 7.4 (6.8; 8.0) | 6.8 (6.4; 7.2) |
Veal, Beef, Lamb Consumption (times per week) | 2.6 (2.2; 3.1) | 2.6 (2.3; 2.9) | 2.5 (2.2; 2.8) |
Other Meat (Chicken, Pork, Venison) Consumption (times per week) | 4.7 (3.9; 5.4) | 4.9 (4.3; 5.4) | 4.3 (3.9; 4.7) |
Total Dairy Consumption (times per day) | 1.4 (1.2; 1.6) | 1.8 (1.6; 1.9) | 1.8 (1.7; 1.9) |
Cheese Consumption (times per day) | 0.4 (0.4; 0.5) [b] | 0.5 (0.4; 0.6)[ab] | 0.6 (0.6; 0.7) [a] |
Milk Product Consumption (times per day) | 1.0 (0.8; 1.2) | 1.3 (1.1; 1.4) | 1.2 (1.0; 1.3) |
Total Discretionary Food Consumption (times per week) | 4.4 (3.8; 4.9) | 5.1 (4.5; 5.6) | 4.9 (4.5; 5.3) |
Cake, biscuits, pie, etc. Consumption (times per week) | 1.5 (1.2; 1.8) | 1.5 (1.3; 1.8) | 1.6 (1.4; 1.7) |
Chocolate and Candy Consumption (times per week) | 2.8 (2.4; 3.2) | 3.6 (3.1; 4.0) | 3.4 (3.1; 3.7) |
Total Discretionary Drink Consumption (times per week) | 7.4 (5.8; 9.0) | 7.5 (6.1; 9.0) | 5.3 (4.6; 6.1) |
Energy Drinks (times per week) | 1.2 (0.8; 1.6) [b] | 0.8 (0.4; 1.2) [ab] | 0.2 (0.1; 0.3) [a] |
Sugary Beverages (times per week) | 2.7 (1.9; 3.5) | 2.2 (1.5; 2.9) | 1.6 (1.2; 1.9) |
Light or Sugar Free Beverages (times per week) | 3.5 (2.4; 4.6) | 4.6 (3.6; 5.7) | 3.6 (2.9; 4.4) |
Juice Consumption (times per week) | 1.5 (0.9; 2.0) | 1.2 (0.9; 1.5) | 1.2 (1.0; 1.3) |
Different letters (a, b, c) indicate statistically significant difference (p < 0.001) between age groups within a country or region after a statistically significant global test (p < 0.001).
No Letters (a, b, c) indicate no statistically significant difference (p ≥ 0.001) between age groups within a country or region and/or no statistically significant global test (p ≥ 0.001).
N refers to the number of participants with the age groups in that country or region. See Appendix 6 for variable-specific sample sizes.
Dietary variables in bold are composites of the variables below.
Pulse consumption is included in vegetable consumption.
Each country contributes equally to the Nordic average.
Whole grain bread is defined as whole grain wheat bread, rye bread and hard bread.
N | 121 | 245 | 644 |
|---|---|---|---|
Total Fruit & Vegetable Consumption (times per day) | 2.2 (1.8; 2.6) | 2.2 (2.0; 2.4) | 2.1 (1.9; 2.2) |
Fruit Consumption (times per day) | 0.9 (0.8; 1.1) | 1.0 (0.9; 1.1) | 1.0 (0.9; 1.1) |
Vegetable Consumption (times per day) | 1.3 (1.1; 1.5) | 1.3 (1.1; 1.4) | 1.1 (1.0; 1.2) |
Pulse Consumption (times per day) | 0.2 (0.1; 0.2) | 0.1 (0.1; 0.2) | 0.1 (0.1; 0.1) |
Total Whole Grain Bread Consumption (slices per day) | 3.1 (2.4; 3.7) | 3.4 (3.1; 3.8) | 3.6 (3.3; 3.9) |
Hard Bread Consumption (slices per day) | 0.4 (0.2; 0.7) [b] | 1.2 (1.0; 1.4) [a] | 1.2 (1.1; 1.4) [a] |
Rye Bread Consumption (slices per day) | 0.1 (0.0; 0.2) | 0.1 (0.1; 0.2) | 0.2 (0.1; 0.3) |
Whole Grain Bread Wheat Consumption (slices per day) | 2.5 (1.9; 3.1) | 2.2 (1.8; 2.5) | 2.2 (1.9; 2.4) |
Total Fish Consumption (times per week) | 1.7 (1.4; 2.0) [b] | 2.1 (1.9; 2.3) [ab] | 2.6 (2.4; 2.8) [a] |
Total Meat Consumption (times per week) | 7.0 (6.3; 7.8) [b] | 6.0 (5.4; 6.6) [ab] | 5.0 (4.6; 5.4) [a] |
Veal, Beef, Lamb Consumption (times per week) | 3.1 (2.5; 3.7) | 2.8 (2.4; 3.1) | 2.4 (2.1; 2.7) |
Other Meat (Chicken, Pork, Venison) Consumption (times per week) | 4.0 (3.2; 4.8) | 3.2 (2.6; 3.8) | 2.6 (2.3; 3.0) |
Total Dairy Consumption (times per day) | 1.8 (1.6; 2.1) | 2.0 (1.8; 2.1) | 1.9 (1.7; 2.0) |
Cheese Consumption (times per day) | 0.6 (0.5; 0.7) [a] | 0.9 (0.8; 1.0) [a] | 0.8 (0.7; 0.9) [a] |
Milk Product Consumption (times per day) | 1.2 (1.0; 1.4) | 1.1 (0.9; 1.3) | 1.1 (0.9; 1.2) |
Total Discretionary Food Consumption (times per week) | 2.8 (2.3; 3.2) | 3.7 (3.2; 4.1) | 3.1 (2.8; 3.3) |
Cake, biscuits, pie, etc. Consumption (times per week) | 0.7 (0.5; 0.8) | 0.8 (0.6; 0.9) | 0.8 (0.7; 0.9) |
Chocolate and Candy Consumption (times per week) | 2.1 (1.7; 2.4) | 2.9 (2.5; 3.3) | 2.3 (2.1; 2.5) |
Total Discretionary Drink Consumption (times per week) | 7.8 (6.4; 9.1) | 6.9 (5.5; 8.4) | 5.5 (4.3; 6.8) |
Energy Drinks (times per week) | 2.3 (1.5; 3.2) | 0.9 (0.5; 1.2) | 0.5 (-0.2; 1.1) |
Sugary Beverages (times per week) | 1.4 (0.9; 1.9) | 0.9 (0.6; 1.2) | 1.4 (0.6; 2.1) |
Light or Sugar Free Beverages (times per week) | 4.0 (3.0; 4.9) | 5.2 (3.9; 6.5) | 3.7 (3.0; 4.4) |
Juice Consumption (times per week) | 1.7 (1.1; 2.2) | 1.8 (1.4; 2.1) | 1.7 (1.4; 1.9) |
Different letters (a, b, c) indicate statistically significant difference (p < 0.001) between age groups within a country or region after a statistically significant global test (p < 0.001).
No Letters (a, b, c) indicate no statistically significant difference (p ≥ 0.001) between age groups within a country or region and/or no statistically significant global test (p ≥ 0.001).
N refers to the number of participants with the age groups in that country or region. See Appendix 6 for variable-specific sample sizes.
Dietary variables in bold are composites of the variables below.
Pulse consumption is included in vegetable consumption.
Each country contributes equally to the Nordic average.
Whole grain bread is defined as whole grain wheat bread, rye bread and hard bread.
No Letters (a, b, c) indicate no statistically significant difference (p ≥ 0.001) between age groups within a country or region and/or no statistically significant global test (p ≥ 0.001).
N refers to the number of participants with the age groups in that country or region. See Appendix 6 for variable-specific sample sizes.
Dietary variables in bold are composites of the variables below.
Pulse consumption is included in vegetable consumption.
Each country contributes equally to the Nordic average.
Whole grain bread is defined as whole grain wheat bread, rye bread and hard bread.
N | 78 | 335 | 586 |
|---|---|---|---|
Total Fruit & Vegetable Consumption (times per day) | 2.0 (1.6; 2.3) | 2.2 (2.0; 2.4) | 2.2 (2.0; 2.3) |
Fruit Consumption (times per day) | 0.7 (0.6; 0.9) | 0.9 (0.8; 1.0) | 1.0 (0.9; 1.1) |
Vegetable Consumption (times per day) | 1.2 (1.0; 1.5) | 1.3 (1.2; 1.4) | 1.2 (1.1; 1.3) |
Pulse Consumption (times per day) | 0.2 (0.2; 0.3) | 0.3 (0.2; 0.3) | 0.2 (0.2; 0.2) |
Total Whole Grain Bread Consumption (slices per day) | 1.4 (0.7; 2.0) [ab] | 1.3 (1.1; 1.5) [b] | 2.0 (1.8; 2.2) [a] |
Hard Bread Consumption (slices per day) | 0.6 (0.3; 0.9) | 0.7 (0.5; 0.8) | 0.9 (0.8; 1.1) |
Rye Bread Consumption (slices per day) | |||
Whole Grain Bread Wheat Consumption (slices per day) | 0.7 (0.4; 1.1) [ab] | 0.6 (0.5; 0.7) [b] | 1.0 (0.9; 1.2) [a] |
Total Fish Consumption (times per week) | 1.0 (0.8; 1.2) | 1.4 (1.0; 1.7) | 1.4 (1.3; 1.5) |
Total Meat Consumption (times per week) | 5.8 (4.9; 6.7) | 5.3 (4.8; 5.7) | 4.9 (4.6; 5.1) |
Veal, Beef, Lamb Consumption (times per week) | 3.2 (2.5; 3.9) | 2.6 (2.3; 2.9) | 2.5 (2.2; 2.7) |
Other Meat (Chicken, Pork, Venison) Consumption (times per week) | 2.6 (1.9; 3.4) | 2.6 (2.3; 3.0) | 2.4 (2.1; 2.7) |
Total Dairy Consumption (times per day) | 2.2 (1.7; 2.7) | 2.0 (1.8; 2.1) | 2.1 (1.9; 2.2) |
Cheese Consumption (times per day) | 0.6 (0.4; 0.8) [ab] | 0.6 (0.6; 0.7) [b] | 0.8 (0.7; 0.9) [a] |
Milk Product Consumption (times per day) | 1.6 (1.2; 2.0) | 1.3 (1.2; 1.5) | 1.3 (1.2; 1.4) |
Total Discretionary Food Consumption (times per week) | 3.4 (2.2; 4.7) | 3.2 (2.9; 3.6) | 4.0 (3.4; 4.5) |
Cake, biscuits, pie, etc. Consumption (times per week) | 1.0 (0.8; 1.3) | 1.3 (1.1; 1.5) | 1.5 (1.3; 1.7) |
Chocolate and Candy Consumption (times per week) | 2.4 (1.2; 3.6) | 2.0 (1.8; 2.2) | 2.5 (2.0; 3.0) |
Total Discretionary Drink Consumption (times per week) | 6.5 (3.6; 9.5) [a] | 3.7 (3.0; 4.4) [a] | 2.5 (2.1; 2.9) [a] |
Energy Drinks (times per week) | 1.9 (0.5; 3.3) [a] | 0.6 (0.3; 0.8) [a] | 0.2 (0.1; 0.2) [a] |
Sugary Beverages (times per week) | 1.0 (0.6; 1.4) | 0.7 (0.5; 0.8) | 0.8 (0.6; 1.0) |
Light or Sugar Free Beverages (times per week) | 3.6 (1.8; 5.5) | 2.5 (1.9; 3.1) | 1.6 (1.3; 1.9) |
Juice Consumption (times per week) | 1.4 (0.4; 2.4) | 1.1 (0.8; 1.3) | 1.7 (1.4; 1.9) |
Different letters (a, b, c) indicate statistically significant difference (p < 0.001) between age groups within a country or region after a statistically significant global test (p < 0.001).
No Letters (a, b, c) indicate no statistically significant difference (p ≥ 0.001) between age groups within a country or region and/or no statistically significant global test (p ≥ 0.001).
Grey cells indicate values not collected and/or not valid for comparison.
N refers to the number of participants with the age groups in that country or region. See Appendix 6 for variable-specific sample sizes.
Dietary variables in bold are composites of the variables below.
Pulse consumption is included in vegetable consumption.
Each country contributes equally to the Nordic average.
Whole grain bread is defined as whole grain wheat bread, rye bread and hard bread.
N | 71 | 248 | 701 |
|---|---|---|---|
Total Fruit & Vegetable Consumption (times per day) | 2.3 (1.9; 2.7) [ab] | 2.9 (2.6; 3.1) [b] | 2.3 (2.1; 2.5) [a] |
Fruit Consumption (times per day) | 1.0 (0.8; 1.2) | 1.2 (1.1; 1.4) | 1.1 (1.0; 1.2) |
Vegetable Consumption (times per day) | 1.3 (1.1; 1.5) [ab] | 1.6 (1.5; 1.8) [b] | 1.2 (1.1; 1.3) [a] |
Pulse Consumption (times per day) | 0.2 (0.1; 0.2) | 0.2 (0.1; 0.2) | 0.1 (0.1; 0.1) |
Total Whole Grain Bread Consumption (slices per day) | 1.9 (1.5; 2.3) [b] | 2.7 (2.4; 3.0) [ab] | 3.4 (3.1; 3.6) [a] |
Hard Bread Consumption (slices per day) | 0.1 (0.0; 0.1) [b] | 0.2 (0.2; 0.3) [ab] | 0.4 (0.3; 0.4) [a] |
Rye Bread Consumption (slices per day) | 1.1 (0.9; 1.4) [b] | 1.5 (1.3; 1.7) [ab] | 1.9 (1.7; 2.2) [a] |
Whole Grain Bread Wheat Consumption (slices per day) | 0.7 (0.4; 1.0) | 1.0 (0.8; 1.1) | 1.1 (1.0; 1.3) |
Total Fish Consumption (times per week) | 0.9 (0.7; 1.1) | 1.3 (1.1; 1.4) | 1.2 (1.1; 1.3) |
Total Meat Consumption (times per week) | 9.2 (8.1; 10.4) [b] | 6.9 (6.3; 7.4) [a] | 5.9 (5.4; 6.3) [a] |
Veal, Beef, Lamb Consumption (times per week) | 3.8 (3.0; 4.5) | 2.8 (2.4; 3.1) | 2.5 (2.1; 2.8) |
Other Meat (Chicken, Pork, Venison) Consumption (times per week) | 5.5 (4.5; 6.5) [b] | 4.1 (3.6; 4.6) [ab] | 3.4 (3.0; 3.8) [a] |
Total Dairy Consumption (times per day) | 2.7 (2.1; 3.3) | 2.8 (2.6; 3.1) | 3.0 (2.7; 3.2) |
Cheese Consumption (times per day) | 0.8 (0.5; 1.0) | 0.9 (0.8; 1.0) | 0.9 (0.8; 1.0) |
Milk Product Consumption (times per day) | 1.9 (1.5; 2.3) | 1.9 (1.7; 2.1) | 2.1 (1.9; 2.2) |
Total Discretionary Food Consumption (times per week) | 2.9 (2.1; 3.7) [ab] | 3.2 (2.8; 3.6) [b] | 4.3 (3.9; 4.8) [a] |
Cake, biscuits, pie, etc. Consumption (times per week) | 1.1 (0.7; 1.5) [b] | 1.3 (1.0; 1.5) [b] | 2.2 (1.9; 2.5) [a] |
Chocolate and Candy Consumption (times per week) | 1.8 (1.3; 2.3) | 1.9 (1.6; 2.2) | 2.1 (1.8; 2.4) |
Total Discretionary Drink Consumption (times per week) | 4.0 (3.1; 5.0) | 3.9 (3.2; 4.6) | 2.9 (2.2; 3.5) |
Energy Drinks (times per week) | 1.3 (0.7; 1.9) [b] | 0.6 (0.4; 0.8) [b] | 0.1 (0.0; 0.1) [a] |
Sugary Beverages (times per week) | 0.9 (0.6; 1.2) | 0.9 (0.7; 1.2) | 0.9 (0.6; 1.1) |
Light or Sugar Free Beverages (times per week) | 1.8 (1.2; 2.5) | 2.4 (1.8; 3.0) | 2.0 (1.3; 2.6) |
Juice Consumption (times per week) | 1.3 (0.8; 1.7) | 1.7 (1.3; 2.0) | 2.0 (1.5; 2.4) |
Different letters (a, b, c) indicate statistically significant difference (p < 0.001) between age groups within a country or region after a statistically significant global test (p < 0.001).
No Letters (a, b, c) indicate no statistically significant difference (p ≥ 0.001) between age groups within a country or region and/or no statistically significant global test (p ≥ 0.001).
N refers to the number of participants with the age groups in that country or region. See Appendix 6 for variable-specific sample sizes.
Dietary variables in bold are composites of the variables below.
Pulse consumption is included in vegetable consumption.
Each country contributes equally to the Nordic average.
Whole grain bread is defined as whole grain wheat bread, rye bread and hard bread.
N | 86 | 307 | 628 |
|---|---|---|---|
Total Fruit & Vegetable Consumption (times per day) | 2.1 (1.7; 2.5) [ab] | 2.0 (1.9; 2.2) [b] | 1.5 (1.4; 1.6) [a] |
Fruit Consumption (times per day) | 1.1 (0.8; 1.3) [a] | 0.9 (0.8; 1.0) [a] | 0.7 (0.7; 0.8) [a] |
Vegetable Consumption (times per day) | 1.1 (0.8; 1.3) [ab] | 1.1 (1.0; 1.2) [b] | 0.8 (0.7; 0.8) [a] |
Pulse Consumption (times per day) | 0.2 (0.1; 0.3) [ab] | 0.1 (0.1; 0.1) [b] | 0.1 (0.0; 0.1) [a] |
Total Whole Grain Bread Consumption (slices per day) | 0.7 (0.5; 0.9) [b] | 1.0 (0.9; 1.2) [b] | 1.4 (1.3; 1.6) [a] |
Hard Bread Consumption (slices per day) | 0.2 (0.1; 0.3) [b] | 0.4 (0.3; 0.5) [ab] | 0.6 (0.5; 0.7) [a] |
Rye Bread Consumption (slices per day) | 0.1 (0.0; 0.1) [b] | 0.1 (0.1; 0.1) [b] | 0.2 (0.1; 0.2) [a] |
Whole Grain Bread Wheat Consumption (slices per day) | 0.4 (0.3; 0.6) | 0.6 (0.4; 0.7) | 0.7 (0.6; 0.8) |
Total Fish Consumption (times per week) | 1.4 (1.2; 1.7) [b] | 1.7 (1.6; 1.9) [b] | 2.1 (2.0; 2.2) [a] |
Total Meat Consumption (times per week) | 5.5 (4.7; 6.4) | 5.2 (4.8; 5.5) | 4.4 (4.2; 4.7) |
Veal, Beef, Lamb Consumption (times per week) | 2.6 (2.1; 3.1) | 2.6 (2.3; 2.8) | 2.5 (2.3; 2.8) |
Other Meat (Chicken, Pork, Venison) Consumption (times per week) | 2.9 (2.3; 3.6) [a] | 2.6 (2.3; 2.9) [a] | 1.9 (1.7; 2.1) [a] |
Total Dairy Consumption (times per day) | 1.7 (1.4; 2.0) | 2.0 (1.8; 2.2) | 2.3 (2.1; 2.5) |
Cheese Consumption (times per day) | 0.6 (0.5; 0.8) | 0.7 (0.6; 0.8) | 0.8 (0.7; 0.8) |
Milk Product Consumption (times per day) | 1.0 (0.8; 1.3) | 1.2 (1.1; 1.4) | 1.5 (1.4; 1.7) |
Total Discretionary Food Consumption (times per week) | 4.0 (3.0; 5.0) | 5.4 (4.8; 6.0) | 4.6 (4.1; 5.0) |
Cake, biscuits, pie, etc. Consumption (times per week) | 1.4 (1.0; 1.8) | 1.8 (1.5; 2.1) | 1.7 (1.5; 2.0) |
Chocolate and Candy Consumption (times per week) | 2.6 (1.9; 3.4) | 3.6 (3.2; 4.0) | 2.9 (2.6; 3.2) |
Total Discretionary Drink Consumption (times per week) | 11.1 (8.6; 13.5) [b] | 9.2 (8.0; 10.4) [b] | 4.7 (4.0; 5.3) [a] |
Energy Drinks (times per week) | 4.8 (3.5; 6.2) [b] | 2.9 (2.3; 3.6) [b] | 0.4 (0.3; 0.6) [a] |
Sugary Beverages (times per week) | 1.4 (0.9; 2.0) | 1.9 (1.4; 2.5) | 1.3 (0.9; 1.7) |
Light or Sugar Free Beverages (times per week) | 4.8 (3.3; 6.3) | 4.4 (3.7; 5.2) | 2.9 (2.4; 3.5) |
Juice Consumption (times per week) | 1.0 (0.7; 1.4) | 1.2 (0.9; 1.5) | 1.0 (0.8; 1.2) |
Different letters (a, b, c) indicate statistically significant difference (p < 0.001) between age groups within a country or region after a statistically significant global test (p < 0.001).
No Letters (a, b, c) indicate no statistically significant difference (p ≥ 0.001) between age groups within a country or region and/or no statistically significant global test (p ≥ 0.001).
N refers to the number of participants with the age groups in that country or region. See Appendix 6 for variable-specific sample sizes.
Dietary variables in bold are composites of the variables below.
Pulse consumption is included in vegetable consumption.
Each country contributes equally to the Nordic average.
Whole grain bread is defined as whole grain wheat bread, rye bread and hard bread.
No Letters (a, b, c) indicate no statistically significant difference (p ≥ 0.001) between age groups within a country or region and/or no statistically significant global test (p ≥ 0.001).
N refers to the number of participants with the age groups in that country or region. See Appendix 6 for variable-specific sample sizes.
Dietary variables in bold are composites of the variables below.
Pulse consumption is included in vegetable consumption.
Each country contributes equally to the Nordic average.
Whole grain bread is defined as whole grain wheat bread, rye bread and hard bread.
N | 471 | 1383 | 3200 |
|---|---|---|---|
Total Fruit & Vegetable Consumption (times per day) | 2.1 (2.0; 2.3) [ab] | 2.3 (2.3; 2.4) [b] | 2.0 (2.0; 2.1) [a] |
Fruit Consumption (times per day) | 0.9 (0.8; 1.0) | 1.0 (1.0; 1.1) | 1.0 (0.9; 1.0) |
Vegetable Consumption (times per day) | 1.2 (1.1; 1.3) [ab] | 1.3 (1.3; 1.4) [b] | 1.1 (1.0; 1.1) [a] |
Pulse Consumption (times per day) | 0.2 (0.2; 0.2) [b] | 0.2 (0.2; 0.2) [b] | 0.1 (0.1; 0.1) [a] |
Total Whole Grain Bread Consumption (slices per day) | 2.0 (1.8; 2.2) [b] | 2.2 (2.1; 2.3) [b] | 2.7 (2.6; 2.8) [a] |
Hard Bread Consumption (slices per day) | 0.3 (0.2; 0.4) [b] | 0.5 (0.5; 0.6) [c] | 0.7 (0.6; 0.8) [a] |
Rye Bread Consumption (slices per day) | |||
Whole Grain Bread Wheat Consumption (slices per day) | 1.0 (0.8; 1.2) [ab] | 1.0 (0.9; 1.0) [b] | 1.2 (1.1; 1.2) [a] |
Total Fish Consumption (times per week) | 1.3 (1.2; 1.4) [b] | 1.6 (1.5; 1.7) [b] | 1.8 (1.8; 1.9) [a] |
Total Meat Consumption (times per week) | 6.9 (6.5; 7.4) [b] | 6.1 (5.9; 6.3) [b] | 5.4 (5.2; 5.6) [a] |
Veal, Beef, Lamb Consumption (times per week) | 3.0 (2.8; 3.3) [b] | 2.7 (2.5; 2.8) [ab] | 2.5 (2.3; 2.6) [a] |
Other Meat (Chicken, Pork, Venison) Consumption (times per week) | 3.9 (3.5; 4.3) [b] | 3.5 (3.2; 3.7) [b] | 3.0 (2.8; 3.1) [a] |
Total Dairy Consumption (times per day) | 1.9 (1.8; 2.1) | 2.1 (2.0; 2.2) | 2.2 (2.1; 2.3) |
Cheese Consumption (times per day) | 0.6 (0.5; 0.7) [b] | 0.7 (0.7; 0.8) [ab] | 0.8 (0.7; 0.8) [a] |
Milk Product Consumption (times per day) | 1.3 (1.2; 1.5) | 1.4 (1.3; 1.5) | 1.4 (1.3; 1.5) |
Total Discretionary Food Consumption (times per week) | 3.5 (3.2; 3.9) | 4.1 (3.9; 4.3) | 4.1 (3.9; 4.3) |
Cake, biscuits, pie, etc. Consumption (times per week) | 1.2 (1.0; 1.3) [b] | 1.3 (1.2; 1.4) [ab] | 1.5 (1.4; 1.6) [a] |
Chocolate and Candy Consumption (times per week) | 2.4 (2.0; 2.7) | 2.8 (2.6; 2.9) | 2.6 (2.5; 2.8) |
Total Discretionary Drink Consumption (times per week) | 7.5 (6.5; 8.4) [b] | 6.2 (5.7; 6.7) [b] | 4.2 (3.8; 4.6) [a] |
Energy Drinks (times per week) | 2.4 (1.9; 2.8) [b] | 1.2 (1.0; 1.3) [c] | 0.3 (0.1; 0.4) [a] |
Sugary Beverages (times per week) | 1.5 (1.3; 1.8) | 1.3 (1.1; 1.5) | 1.2 (1.0; 1.4) |
Light or Sugar Free Beverages (times per week) | 3.6 (3.0; 4.2) [ab] | 3.8 (3.4; 4.1) [b] | 2.8 (2.5; 3.1) [a] |
Juice Consumption (times per week) | 1.4 (1.1; 1.6) | 1.4 (1.2; 1.5) | 1.5 (1.4; 1.6) |
Different letters (a, b, c) indicate statistically significant difference (p < 0.001) between age groups within a country or region after a statistically significant global test (p < 0.001).
No Letters (a, b, c) indicate no statistically significant difference (p ≥ 0.001) between age groups within a country or region and/or no statistically significant global test (p ≥ 0.001).
Grey cells indicate values not collected and/or not valid for comparison.
N refers to the number of participants with the age groups in that country or region. See Appendix 6 for variable-specific sample sizes.
Dietary variables in bold are composites of the variables below.
Pulse consumption is included in vegetable consumption.
Each country contributes equally to the Nordic average.
Whole grain bread is defined as whole grain wheat bread, rye bread and hard bread.
Education
Across the region, education-related differences were observed for some food groups, though the number varied by country: more in Denmark than the other countries in the region.
Across the Nordic Region, adults with higher levels of education reported higher intake of total fruits and vegetables (2.6 vs 1.6 times per day), fruits (1.1 vs 0.8), vegetables (1.5 vs 0.8), and pulses (0.2 vs 0.1) compared with those with lower levels of education. Adults with medium levels of education also reported higher intake than the low-education group for total fruits and vegetables, vegetables, and pulses. This pattern was consistent across all Nordic countries individually.
Adults with higher levels of education also reported higher fish intake (1.8 vs 1.6 and 1.5 times per week for high, medium, and low education, respectively) across the Nordic Region, though this difference was statistically significant only in Finland.
Conversely, adults with higher levels of education reported lower intake of total meat (5.7 vs 6.2 times per week) compared with those with medium levels of education, and lower intake of veal, beef, and lamb than both the low- and medium-education groups (2.3 vs 3.0 and 2.9 times per week). Similar results were seen in Denmark and Iceland for veal, beef, and lamb. In Denmark, adults with medium levels of education also reported higher intake of other meat (5.3 times per week) than both the low- and high-education groups (3.5 and 4.3 times per week, respectively).
Intake of total discretionary drinks and sugary beverages was lower among adults with higher levels of education (4.6 times per week) than among those with medium (6.1) or low levels of education (7.2). The same pattern was observed for total discretionary drinks in Norway and Sweden, and for sugary beverages in Denmark, where adults with high levels of education reported lower intake than the medium-education group but not the low-education group.
In Denmark, adults with low levels of education reported lower intake of total dairy and milk compared with both the high- and medium-education groups. In contrast, adults with high levels of education reported higher intake of total discretionary foods and chocolate and candy compared with those with low levels of education, though not compared with the medium-education group.
N | 55 | 367 | 578 |
|---|---|---|---|
Total Fruit & Vegetable Consumption (times per day) | 1.8 (1.4; 2.3) [ab] | 1.9 (1.7; 2.0) [b] | 2.5 (2.4; 2.6) [a] |
Fruit Consumption (times per day) | 0.9 (0.6; 1.1) [ab] | 0.8 (0.8; 0.9) [b] | 1.1 (1.0; 1.1) [a] |
Vegetable Consumption (times per day) | 0.9 (0.7; 1.2) [b] | 1.0 (0.9; 1.1) [b] | 1.4 (1.4; 1.5) [a] |
Pulse Consumption (times per day) | 0.1 (0.1; 0.2) [b] | 0.2 (0.1; 0.2) [b] | 0.3 (0.3; 0.3) [a] |
Total Whole Grain Bread Consumption (slices per day) | 3.0 (2.3; 3.7) [ab] | 3.1 (2.7; 3.4) [b] | 2.4 (2.2; 2.5) [a] |
Hard Bread Consumption (slices per day) | 0.3 (-0.0; 0.6) | 0.2 (0.1; 0.2) | 0.3 (0.2; 0.3) |
Rye Bread Consumption (slices per day) | 2.0 (1.5; 2.5) [ab] | 2.1 (1.9; 2.4) [b] | 1.5 (1.3; 1.6) [a] |
Whole Grain Bread Wheat Consumption (slices per day) | 0.8 (0.4; 1.1) | 0.7 (0.6; 0.8) | 0.6 (0.6; 0.7) |
Total Fish Consumption (times per week) | 1.5 (1.1; 1.9) | 1.6 (1.5; 1.8) | 1.7 (1.5; 1.8) |
Total Meat Consumption (times per week) | 6.8 (5.6; 7.9) [ab] | 8.1 (7.6; 8.6) [b] | 6.3 (5.9; 6.7) [a] |
Veal, Beef, Lamb Consumption (times per week) | 3.3 (2.5; 4.1) [ab] | 2.7 (2.5; 3.0) [b] | 2.0 (1.9; 2.2) [a] |
Other Meat (Chicken, Pork, Venison) Consumption (times per week) | 3.5 (2.5; 4.4) [a] | 5.3 (4.9; 5.8) [a] | 4.3 (3.9; 4.6) [a] |
Total Dairy Consumption (times per day) | 1.2 (1.0; 1.4) [b] | 1.7 (1.5; 1.8) [a] | 1.9 (1.8; 2.1) [a] |
Cheese Consumption (times per day) | 0.4 (0.3; 0.6) | 0.5 (0.5; 0.6) | 0.6 (0.5; 0.6) |
Milk Product Consumption (times per day) | 0.7 (0.5; 0.9) [b] | 1.1 (1.0; 1.3) [a] | 1.4 (1.3; 1.5) [a] |
Total Discretionary Food Consumption (times per week) | 3.4 (2.6; 4.2) [b] | 4.9 (4.5; 5.4) [ab] | 5.4 (5.0; 5.7) [a] |
Cake, biscuits, pie, etc. Consumption (times per week) | 1.2 (0.8; 1.5) | 1.6 (1.4; 1.8) | 1.7 (1.5; 1.8) |
Chocolate and Candy Consumption (times per week) | 2.3 (1.7; 2.8) [b] | 3.4 (3.0; 3.7) [ab] | 3.7 (3.4; 4.0) [a] |
Total Discretionary Drink Consumption (times per week) | 7.7 (5.4; 9.9) [ab] | 7.9 (6.7; 9.0) [b] | 4.6 (4.0; 5.2) [a] |
Energy Drinks (times per week) | 0.9 (0.3; 1.6) | 0.7 (0.5; 0.9) | 0.4 (0.2; 0.6) |
Sugary Beverages (times per week) | 2.3 (1.3; 3.4) [ab] | 2.8 (2.2; 3.4) [b] | 1.1 (0.9; 1.3) [a] |
Light or Sugar Free Beverages (times per week) | 4.6 (2.6; 6.6) | 4.4 (3.6; 5.2) | 3.2 (2.6; 3.7) |
Juice Consumption (times per week) | 1.6 (0.8; 2.4) | 1.2 (1.0; 1.4) | 1.2 (1.0; 1.4) |
Different letters (a, b, c) indicate statistically significant difference (p < 0.001) between education levels within a country or region after a statistically significant global test (p < 0.001).
No letters (a, b, c) indicate no statistically significant difference (p >= 0.001) between education levels within a country or region and/or no statistically significant global test (p >= 0.001).
N refers to the number of participants with the education level in that country or region. See Appendix 6 for variable-specific sample sizes.
Dietary variables in bold are composites of the variables below.
Pulse consumption is included in vegetable consumption.
Each country contributes equally to the Nordic average.
Whole grain bread is defined as whole grain wheat bread, rye bread and hard bread.
N | 31 | 338 | 637 |
|---|---|---|---|
Total Fruit & Vegetable Consumption (times per day) | 1.6 (1.2; 2.0) [b] | 2.0 (1.9; 2.2) [b] | 2.5 (2.3; 2.6) [a] |
Fruit Consumption (times per day) | 0.7 (0.5; 1.0) | 0.9 (0.8; 1.0) | 1.1 (1.0; 1.2) |
Vegetable Consumption (times per day) | 0.9 (0.6; 1.1) [b] | 1.1 (1.0; 1.2) [b] | 1.4 (1.3; 1.5) [a] |
Pulse Consumption (times per day) | 0.0 (0.0; 0.1) [b] | 0.1 (0.1; 0.1) [a] | 0.2 (0.1; 0.2) [a] |
Total Whole Grain Bread Consumption (slices per day) | 2.7 (1.8; 3.7) | 3.9 (3.6; 4.2) | 3.3 (3.1; 3.5) |
Hard Bread Consumption (slices per day) | 0.8 (0.4; 1.2) | 1.1 (0.9; 1.3) | 1.1 (1.0; 1.2) |
Rye Bread Consumption (slices per day) | 0.1 (-0.1; 0.3) | 0.2 (0.1; 0.3) | 0.1 (0.1; 0.2) |
Whole Grain Bread Wheat Consumption (slices per day) | 1.9 (1.1; 2.8) | 2.5 (2.3; 2.8) | 2.0 (1.9; 2.2) |
Total Fish Consumption (times per week) | 1.9 (1.3; 2.4) | 2.2 (2.0; 2.4) | 2.5 (2.4; 2.7) |
Total Meat Consumption (times per week) | 5.4 (3.9; 6.9) | 5.9 (5.4; 6.3) | 5.7 (5.4; 6.0) |
Veal, Beef, Lamb Consumption (times per week) | 2.5 (1.6; 3.4) | 3.0 (2.7; 3.4) | 2.4 (2.2; 2.5) |
Other Meat (Chicken, Pork, Venison) Consumption (times per week) | 2.9 (1.5; 4.4) | 2.9 (2.5; 3.2) | 3.4 (3.1; 3.6) |
Total Dairy Consumption (times per day) | 1.9 (1.5; 2.3) | 1.9 (1.7; 2.0) | 1.9 (1.8; 2.0) |
Cheese Consumption (times per day) | 0.7 (0.5; 0.9) | 0.8 (0.7; 0.8) | 0.8 (0.8; 0.9) |
Milk Product Consumption (times per day) | 1.2 (0.8; 1.5) | 1.1 (1.0; 1.2) | 1.1 (1.0; 1.2) |
Total Discretionary Food Consumption (times per week) | 2.4 (1.7; 3.1) | 3.3 (3.0; 3.7) | 3.3 (3.1; 3.6) |
Cake, biscuits, pie, etc. Consumption (times per week) | 0.6 (0.3; 0.8) | 0.8 (0.7; 0.9) | 0.8 (0.7; 0.8) |
Chocolate and Candy Consumption (times per week) | 1.9 (1.3; 2.5) | 2.5 (2.2; 2.8) | 2.6 (2.4; 2.8) |
Total Discretionary Drink Consumption (times per week) | 7.6 (3.9; 11.4) [ab] | 7.5 (6.4; 8.5) [b] | 5.2 (4.5; 5.8) [a] |
Energy Drinks (times per week) | 1.6 (-0.4; 3.7) | 1.1 (0.8; 1.5) | 0.6 (0.4; 0.8) |
Sugary Beverages (times per week) | 2.5 (0.4; 4.6) | 1.3 (0.9; 1.6) | 0.7 (0.5; 0.8) |
Light or Sugar Free Beverages (times per week) | 3.5 (1.2; 5.8) | 5.1 (4.2; 5.9) | 3.9 (3.3; 4.5) |
Juice Consumption (times per week) | 1.0 (0.4; 1.7) | 1.8 (1.4; 2.1) | 1.8 (1.6; 2.1) |
Different letters (a, b, c) indicate statistically significant difference (p < 0.001) between education levels within a country or region after a statistically significant global test (p < 0.001).
No letters (a, b, c) indicate no statistically significant difference (p >= 0.001) between education levels within a country or region and/or no statistically significant global test (p >= 0.001).
N refers to the number of participants with the education level in that country or region. See Appendix 6 for variable-specific sample sizes.
Dietary variables in bold are composites of the variables below.
Pulse consumption is included in vegetable consumption.
Each country contributes equally to the Nordic average.
Whole grain bread is defined as whole grain wheat bread, rye bread and hard bread.
No letters (a, b, c) indicate no statistically significant difference (p >= 0.001) between education levels within a country or region and/or no statistically significant global test (p >= 0.001).
N refers to the number of participants with the education level in that country or region. See Appendix 6 for variable-specific sample sizes.
Dietary variables in bold are composites of the variables below.
Pulse consumption is included in vegetable consumption.
Each country contributes equally to the Nordic average.
Whole grain bread is defined as whole grain wheat bread, rye bread and hard bread.
N | 32 | 377 | 585 |
|---|---|---|---|
Total Fruit & Vegetable Consumption (times per day) | 1.3 (1.0; 1.7) [b] | 2.1 (1.9; 2.3) [a] | 2.5 (2.3; 2.6) [a] |
Fruit Consumption (times per day) | 0.6 (0.4; 0.9) [ab] | 0.8 (0.7; 0.9) [b] | 1.0 (1.0; 1.1) [a] |
Vegetable Consumption (times per day) | 0.7 (0.5; 0.9) [b] | 1.2 (1.1; 1.4) [a] | 1.4 (1.3; 1.5) [a] |
Pulse Consumption (times per day) | 0.1 (0.1; 0.2) [b] | 0.2 (0.2; 0.3) [ab] | 0.3 (0.2; 0.3) [a] |
Total Whole Grain Bread Consumption (slices per day) | 2.4 (1.6; 3.2) | 1.5 (1.3; 1.7) | 1.4 (1.3; 1.5) |
Hard Bread Consumption (slices per day) | 1.3 (0.7; 1.9) | 0.7 (0.6; 0.8) | 0.6 (0.6; 0.7) |
Rye Bread Consumption (slices per day) | |||
Whole Grain Bread Wheat Consumption (slices per day) | 1.1 (0.6; 1.5) | 0.8 (0.7; 0.9) | 0.7 (0.7; 0.8) |
Total Fish Consumption (times per week) | 1.6 (0.6; 2.5) | 1.2 (1.0; 1.3) | 1.4 (1.3; 1.5) |
Total Meat Consumption (times per week) | 5.0 (4.4; 5.7) | 5.6 (5.1; 6.1) | 5.0 (4.6; 5.4) |
Veal, Beef, Lamb Consumption (times per week) | 3.1 (2.3; 3.8) | 2.8 (2.5; 3.2) | 2.4 (2.1; 2.8) |
Other Meat (Chicken, Pork, Venison) Consumption (times per week) | 2.0 (1.2; 2.7) | 2.8 (2.4; 3.2) | 2.5 (2.2; 2.8) |
Total Dairy Consumption (times per day) | 2.5 (1.7; 3.3) | 2.0 (1.8; 2.2) | 2.0 (1.9; 2.1) |
Cheese Consumption (times per day) | 0.9 (0.5; 1.3) | 0.7 (0.6; 0.7) | 0.7 (0.6; 0.7) |
Milk Product Consumption (times per day) | 1.6 (1.1; 2.2) | 1.3 (1.2; 1.5) | 1.3 (1.2; 1.5) |
Total Discretionary Food Consumption (times per week) | 5.3 (3.0; 7.6) | 3.3 (2.8; 3.8) | 3.4 (3.1; 3.6) |
Cake, biscuits, pie, etc. Consumption (times per week) | 1.3 (0.8; 1.8) | 1.2 (1.1; 1.4) | 1.4 (1.2; 1.5) |
Chocolate and Candy Consumption (times per week) | 4.1 (1.8; 6.5) | 2.1 (1.7; 2.5) | 2.0 (1.8; 2.2) |
Total Discretionary Drink Consumption (times per week) | 5.5 (0.5; 10.4) [ab] | 4.6 (3.7; 5.5) [b] | 2.7 (2.3; 3.2) [a] |
Energy Drinks (times per week) | 1.5 (-1.0; 4.0) | 0.8 (0.5; 1.1) | 0.4 (0.2; 0.5) |
Sugary Beverages (times per week) | 1.0 (0.5; 1.5) | 1.0 (0.7; 1.2) | 0.6 (0.5; 0.7) |
Light or Sugar Free Beverages (times per week) | 3.1 (0.2; 6.1) | 2.8 (2.2; 3.5) | 1.8 (1.4; 2.1) |
Juice Consumption (times per week) | 2.2 (0.4; 4.1) | 1.2 (1.0; 1.4) | 1.3 (1.1; 1.5) |
Different letters (a, b, c) indicate statistically significant difference (p < 0.001) between education levels within a country or region after a statistically significant global test (p < 0.001).
No letters (a, b, c) indicate no statistically significant difference (p >= 0.001) between education levels within a country or region and/or no statistically significant global test (p >= 0.001).
Grey cells indicate values not collected and/or not valid for comparison.
N refers to the number of participants with the education level in that country or region. See Appendix 6 for variable-specific sample sizes.
Dietary variables in bold are composites of the variables below.
Pulse consumption is included in vegetable consumption.
Each country contributes equally to the Nordic average.
Whole grain bread is defined as whole grain wheat bread, rye bread and hard bread.
N | 34 | 434 | 550 |
|---|---|---|---|
Total Fruit & Vegetable Consumption (times per day) | 2.1 (1.6; 2.6) [b] | 2.1 (1.9; 2.3) [b] | 3.1 (3.0; 3.3) [a] |
Fruit Consumption (times per day) | 1.0 (0.6; 1.5) [ab] | 1.0 (0.9; 1.1) [b] | 1.3 (1.2; 1.4) [a] |
Vegetable Consumption (times per day) | 1.1 (0.8; 1.3) [b] | 1.1 (1.0; 1.2) [b] | 1.8 (1.7; 1.9) [a] |
Pulse Consumption (times per day) | 0.1 (0.0; 0.1) [ab] | 0.1 (0.1; 0.1) [b] | 0.2 (0.2; 0.2) [a] |
Total Whole Grain Bread Consumption (slices per day) | 3.1 (2.5; 3.7) | 2.9 (2.6; 3.2) | 2.6 (2.3; 2.8) |
Hard Bread Consumption (slices per day) | 0.4 (0.2; 0.6) | 0.3 (0.2; 0.4) | 0.2 (0.1; 0.2) |
Rye Bread Consumption (slices per day) | 1.9 (1.4; 2.4) | 1.6 (1.4; 1.8) | 1.5 (1.3; 1.6) |
Whole Grain Bread Wheat Consumption (slices per day) | 0.8 (0.4; 1.2) | 1.0 (0.9; 1.2) | 0.9 (0.8; 1.1) |
Total Fish Consumption (times per week) | 1.0 (0.8; 1.2) [ab] | 1.0 (0.9; 1.2) [b] | 1.4 (1.3; 1.5) [a] |
Total Meat Consumption (times per week) | 6.8 (5.4; 8.3) | 7.4 (6.9; 8.0) | 6.6 (6.0; 7.1) |
Veal, Beef, Lamb Consumption (times per week) | 3.2 (2.3; 4.1) | 3.0 (2.7; 3.4) | 2.6 (2.2; 2.9) |
Other Meat (Chicken, Pork, Venison) Consumption (times per week) | 3.6 (2.5; 4.7) | 4.4 (3.9; 4.9) | 4.0 (3.5; 4.5) |
Total Dairy Consumption (times per day) | 3.6 (2.8; 4.4) | 2.8 (2.6; 3.1) | 2.5 (2.3; 2.7) |
Cheese Consumption (times per day) | 1.1 (0.8; 1.5) | 0.9 (0.8; 1.0) | 0.8 (0.7; 0.9) |
Milk Product Consumption (times per day) | 2.5 (1.9; 3.0) | 2.0 (1.8; 2.2) | 1.7 (1.6; 1.9) |
Total Discretionary Food Consumption (times per week) | 3.8 (2.5; 5.1) | 3.5 (3.1; 3.8) | 3.7 (3.3; 4.0) |
Cake, biscuits, pie, etc. Consumption (times per week) | 2.0 (1.1; 2.8) | 1.6 (1.4; 1.8) | 1.5 (1.3; 1.7) |
Chocolate and Candy Consumption (times per week) | 1.8 (1.0; 2.7) | 1.9 (1.6; 2.1) | 2.2 (1.9; 2.4) |
Total Discretionary Drink Consumption (times per week) | 4.3 (2.5; 6.1) | 3.5 (2.9; 4.1) | 3.3 (2.8; 3.8) |
Energy Drinks (times per week) | 0.4 (-0.1; 0.9) | 0.7 (0.4; 1.0) | 0.4 (0.2; 0.6) |
Sugary Beverages (times per week) | 0.7 (0.3; 1.2) | 0.9 (0.7; 1.1) | 0.9 (0.7; 1.1) |
Light or Sugar Free Beverages (times per week) | 3.2 (1.4; 5.0) | 1.9 (1.4; 2.3) | 2.0 (1.6; 2.4) |
Juice Consumption (times per week) | 1.5 (0.5; 2.6) | 1.7 (1.4; 2.1) | 1.7 (1.4; 1.9) |
Different letters (a, b, c) indicate statistically significant difference (p < 0.001) between education levels within a country or region after a statistically significant global test (p < 0.001).
No letters (a, b, c) indicate no statistically significant difference (p >= 0.001) between education levels within a country or region and/or no statistically significant global test (p >= 0.001).
N refers to the number of participants with the education level in that country or region. See Appendix 6 for variable-specific sample sizes.
Dietary variables in bold are composites of the variables below.
Pulse consumption is included in vegetable consumption.
Each country contributes equally to the Nordic average.
Whole grain bread is defined as whole grain wheat bread, rye bread and hard bread.
N | 118 | 313 | 585 |
|---|---|---|---|
Total Fruit & Vegetable Consumption (times per day) | 1.2 (1.0; 1.4) [b] | 1.8 (1.6; 2.1) [a] | 2.3 (2.1; 2.4) [a] |
Fruit Consumption (times per day) | 0.7 (0.5; 0.8) [b] | 0.9 (0.7; 1.0) [ab] | 1.0 (0.9; 1.1) [a] |
Vegetable Consumption (times per day) | 0.6 (0.5; 0.7) [b] | 1.0 (0.8; 1.1) [a] | 1.3 (1.2; 1.4) [a] |
Pulse Consumption (times per day) | 0.0 (0.0; 0.1) [b] | 0.1 (0.1; 0.1) [ab] | 0.2 (0.1; 0.2) [a] |
Total Whole Grain Bread Consumption (slices per day) | 1.1 (0.9; 1.4) | 1.1 (0.9; 1.2) | 1.1 (1.0; 1.3) |
Hard Bread Consumption (slices per day) | 0.5 (0.3; 0.6) | 0.4 (0.3; 0.5) | 0.4 (0.4; 0.5) |
Rye Bread Consumption (slices per day) | 0.1 (0.1; 0.1) | 0.1 (0.1; 0.1) | 0.1 (0.1; 0.1) |
Whole Grain Bread Wheat Consumption (slices per day) | 0.5 (0.4; 0.7) | 0.6 (0.5; 0.7) | 0.6 (0.5; 0.7) |
Total Fish Consumption (times per week) | 1.8 (1.6; 2.1) | 1.8 (1.6; 1.9) | 1.7 (1.6; 1.9) |
Total Meat Consumption (times per week) | 5.2 (4.6; 5.9) | 5.1 (4.6; 5.6) | 4.7 (4.3; 5.1) |
Veal, Beef, Lamb Consumption (times per week) | 2.9 (2.5; 3.3) [a] | 2.7 (2.4; 3.0) [a] | 2.1 (1.9; 2.3) [a] |
Other Meat (Chicken, Pork, Venison) Consumption (times per week) | 2.3 (1.9; 2.8) | 2.4 (2.0; 2.8) | 2.6 (2.3; 2.9) |
Total Dairy Consumption (times per day) | 2.2 (1.9; 2.6) | 1.9 (1.8; 2.1) | 2.0 (1.8; 2.1) |
Cheese Consumption (times per day) | 0.7 (0.6; 0.9) | 0.7 (0.6; 0.8) | 0.7 (0.7; 0.8) |
Milk Product Consumption (times per day) | 1.5 (1.2; 1.8) | 1.2 (1.1; 1.4) | 1.2 (1.1; 1.4) |
Total Discretionary Food Consumption (times per week) | 4.8 (3.9; 5.8) | 4.5 (3.9; 5.1) | 4.8 (4.4; 5.2) |
Cake, biscuits, pie, etc. Consumption (times per week) | 1.9 (1.4; 2.3) | 1.5 (1.2; 1.8) | 1.6 (1.4; 1.8) |
Chocolate and Candy Consumption (times per week) | 3.0 (2.2; 3.7) | 3.0 (2.6; 3.4) | 3.2 (3.0; 3.5) |
Total Discretionary Drink Consumption (times per week) | 9.1 (6.7; 11.5) | 7.5 (6.3; 8.7) | 7.6 (6.7; 8.5) |
Energy Drinks (times per week) | 3.1 (1.8; 4.4) | 2.1 (1.6; 2.7) | 2.4 (1.8; 2.9) |
Sugary Beverages (times per week) | 1.9 (1.1; 2.8) | 1.7 (1.2; 2.1) | 1.2 (0.9; 1.4) |
Light or Sugar Free Beverages (times per week) | 4.2 (2.8; 5.5) | 3.7 (2.9; 4.5) | 4.1 (3.4; 4.7) |
Juice Consumption (times per week) | 0.9 (0.5; 1.3) | 1.2 (0.9; 1.5) | 1.1 (0.9; 1.3) |
Different letters (a, b, c) indicate statistically significant difference (p < 0.001) between education levels within a country or region after a statistically significant global test (p < 0.001).
No letters (a, b, c) indicate no statistically significant difference (p >= 0.001) between education levels within a country or region and/or no statistically significant global test (p >= 0.001).
N refers to the number of participants with the education level in that country or region. See Appendix 6 for variable-specific sample sizes.
Dietary variables in bold are composites of the variables below.
Pulse consumption is included in vegetable consumption.
Each country contributes equally to the Nordic average.
Whole grain bread is defined as whole grain wheat bread, rye bread and hard bread.
No letters (a, b, c) indicate no statistically significant difference (p >= 0.001) between education levels within a country or region and/or no statistically significant global test (p >= 0.001).
N refers to the number of participants with the education level in that country or region. See Appendix 6 for variable-specific sample sizes.
Dietary variables in bold are composites of the variables below.
Pulse consumption is included in vegetable consumption.
Each country contributes equally to the Nordic average.
Whole grain bread is defined as whole grain wheat bread, rye bread and hard bread.
N | 270 | 1829 | 2935 |
|---|---|---|---|
Total Fruit & Vegetable Consumption (times per day) | 1.6 (1.4; 1.7) [b] | 2.0 (1.9; 2.1) [c] | 2.6 (2.5; 2.6) [a] |
Fruit Consumption (times per day) | 0.8 (0.7; 0.9) [b] | 0.9 (0.8; 0.9) [b] | 1.1 (1.1; 1.1) [a] |
Vegetable Consumption (times per day) | 0.8 (0.7; 0.9) [b] | 1.1 (1.0; 1.1) [c] | 1.5 (1.4; 1.5) [a] |
Pulse Consumption (times per day) | 0.1 (0.1; 0.1) [b] | 0.1 (0.1; 0.2) [c] | 0.2 (0.2; 0.2) [a] |
Total Whole Grain Bread Consumption (slices per day) | 2.3 (2.0; 2.6) [ab] | 2.5 (2.4; 2.6) [b] | 2.2 (2.1; 2.3) [a] |
Hard Bread Consumption (slices per day) | 0.6 (0.4; 0.7) | 0.5 (0.5; 0.6) | 0.5 (0.5; 0.6) |
Rye Bread Consumption (slices per day) | |||
Whole Grain Bread Wheat Consumption (slices per day) | 1.0 (0.7; 1.2) | 1.1 (1.0; 1.2) | 1.0 (0.9; 1.1) |
Total Fish Consumption (times per week) | 1.6 (1.4; 1.8) [ab] | 1.5 (1.5; 1.6) [b] | 1.8 (1.7; 1.8) [a] |
Total Meat Consumption (times per week) | 5.8 (5.3; 6.3) [ab] | 6.5 (6.2; 6.7) [b] | 5.7 (5.5; 5.8) [a] |
Veal, Beef, Lamb Consumption (times per week) | 3.0 (2.7; 3.3) [b] | 2.9 (2.7; 3.0) [b] | 2.3 (2.2; 2.4) [a] |
Other Meat (Chicken, Pork, Venison) Consumption (times per week) | 2.8 (2.4; 3.2) | 3.6 (3.4; 3.8) | 3.4 (3.2; 3.5) |
Total Dairy Consumption (times per day) | 2.2 (2.0; 2.5) | 2.1 (2.0; 2.2) | 2.1 (2.0; 2.1) |
Cheese Consumption (times per day) | 0.8 (0.7; 0.9) | 0.7 (0.7; 0.7) | 0.7 (0.7; 0.7) |
Milk Product Consumption (times per day) | 1.5 (1.3; 1.7) | 1.4 (1.3; 1.5) | 1.4 (1.3; 1.4) |
Total Discretionary Food Consumption (times per week) | 4.0 (3.4; 4.5) | 3.9 (3.7; 4.1) | 4.1 (3.9; 4.2) |
Cake, biscuits, pie, etc. Consumption (times per week) | 1.4 (1.2; 1.7) | 1.4 (1.3; 1.5) | 1.4 (1.3; 1.4) |
Chocolate and Candy Consumption (times per week) | 2.6 (2.1; 3.1) | 2.5 (2.4; 2.7) | 2.7 (2.6; 2.8) |
Total Discretionary Drink Consumption (times per week) | 7.2 (5.8; 8.6) [b] | 6.1 (5.6; 6.5) [b] | 4.6 (4.3; 4.9) [a] |
Energy Drinks (times per week) | 1.7 (1.0; 2.4) | 1.1 (0.9; 1.2) | 0.8 (0.6; 0.9) |
Sugary Beverages (times per week) | 1.8 (1.2; 2.3) [ab] | 1.5 (1.3; 1.7) [b] | 0.9 (0.8; 1.0) [a] |
Light or Sugar Free Beverages (times per week) | 3.8 (2.9; 4.7) | 3.5 (3.2; 3.8) | 3.0 (2.7; 3.2) |
Juice Consumption (times per week) | 1.4 (1.0; 1.8) | 1.4 (1.3; 1.5) | 1.4 (1.3; 1.5) |
Different letters (a, b, c) indicate statistically significant difference (p < 0.001) between education levels within a country or region after a statistically significant global test (p < 0.001).
No letters (a, b, c) indicate no statistically significant difference (p >= 0.001) between education levels within a country or region and/or no statistically significant global test (p >= 0.001).
Grey cells indicate values not collected and/or not valid for comparison.
N refers to the number of participants with the education level in that country or region. See Appendix 6 for variable-specific sample sizes.
Dietary variables in bold are composites of the variables below.
Pulse consumption is included in vegetable consumption.
Each country contributes equally to the Nordic average.
Whole grain bread is defined as whole grain wheat bread, rye bread and hard bread.
Results – Children
Status in each country 2024
In Norway, favorable results were observed with an intake of whole-grain bread and fish consumption above the Nordic average, combined with lower-than-average intake of meat and discretionary foods. Total fruit and vegetable intake was slightly below, but close to, the Nordic average. In contrast, discretionary drinks and dairy intake were above average.
In Finland, a similarly favorable pattern was seen. Whole-grain bread intake was above the Nordic average, and consumption of discretionary foods and drinks was below average. Total fruit and vegetable intake was close to average. However, dairy and meat intake were above the average, while fish intake was below.
In Sweden, favorable results included lower intake of discretionary drinks and foods compared with the Nordic average, as well as slightly lower intake of meat. Intake of total fruits and vegetables and dairy was close to the average, while whole-grain bread and fish intake were below.
In Denmark, the most favorable finding was higher intake of whole-grain bread compared with the Nordic average. Total fruits and vegetables intake was close to average, while meat and discretionary foods and drinks were above average and fish intake was below. Dairy intake was also below the Nordic average.
In Iceland, favorable results included higher intake of fish and lower intake of meat than the Nordic average. However, intake of total fruits and vegetables and whole-grain bread was below average, and discretionary food intake was above. Discretionary drinks and dairy intake were close to the Nordic average.
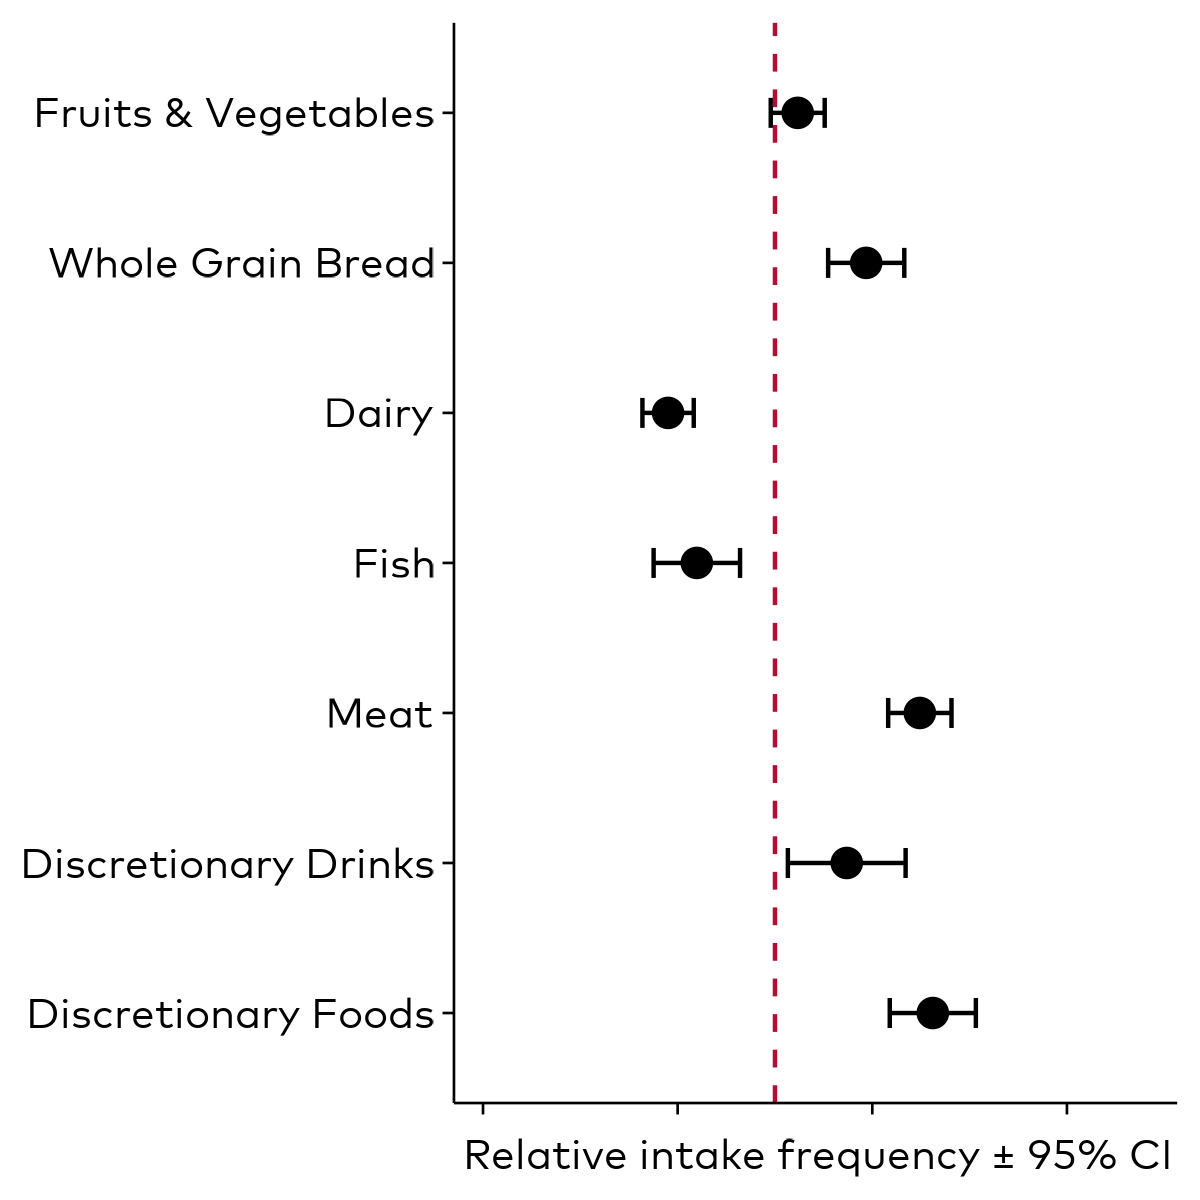
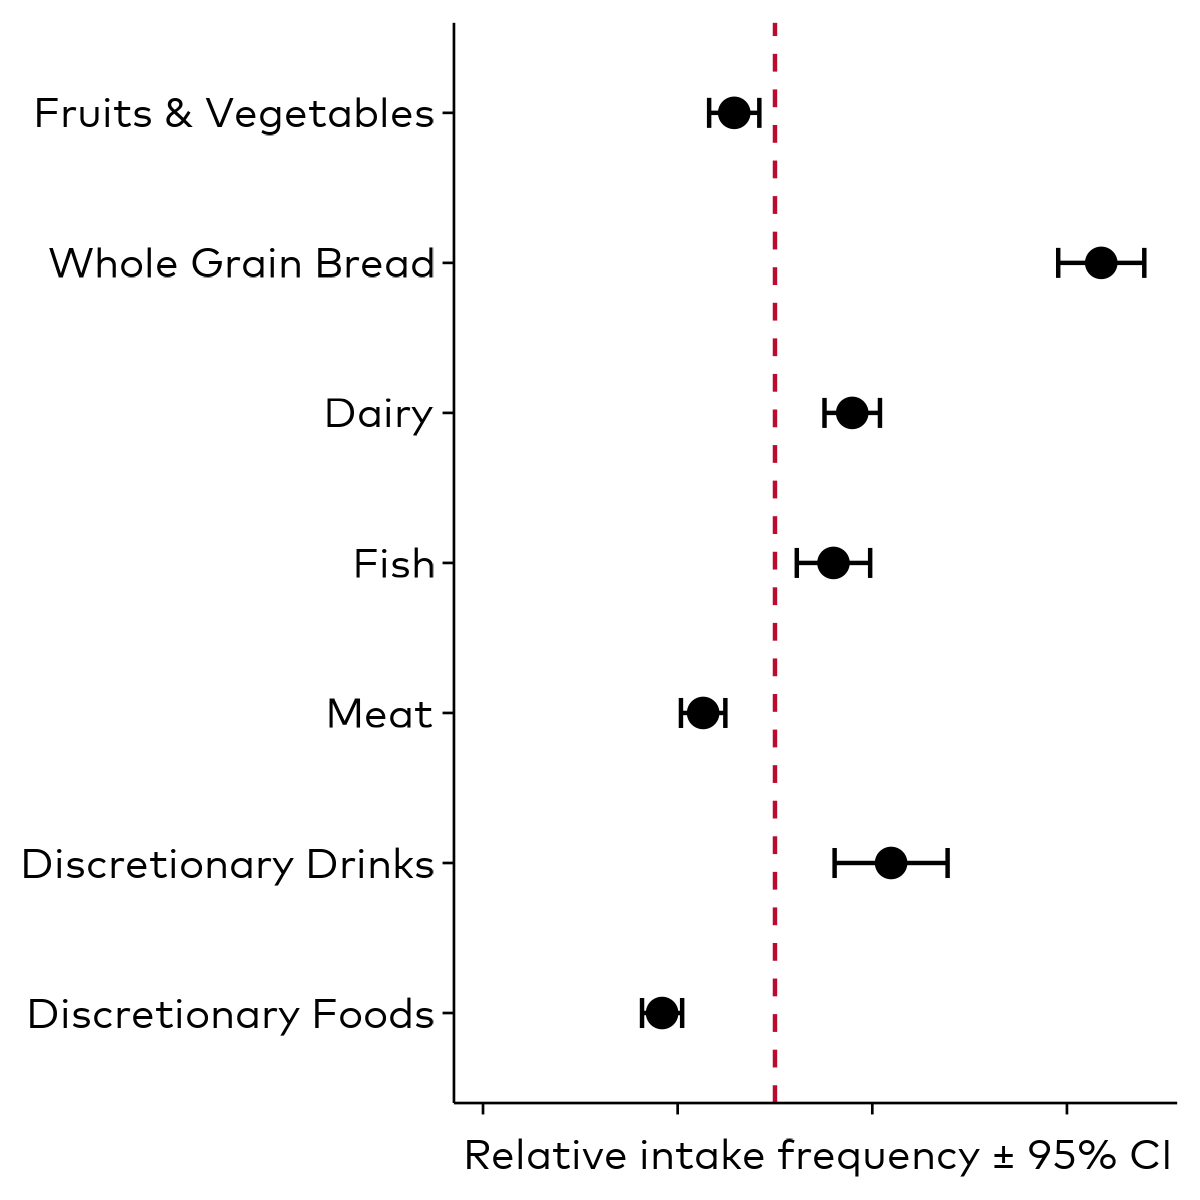
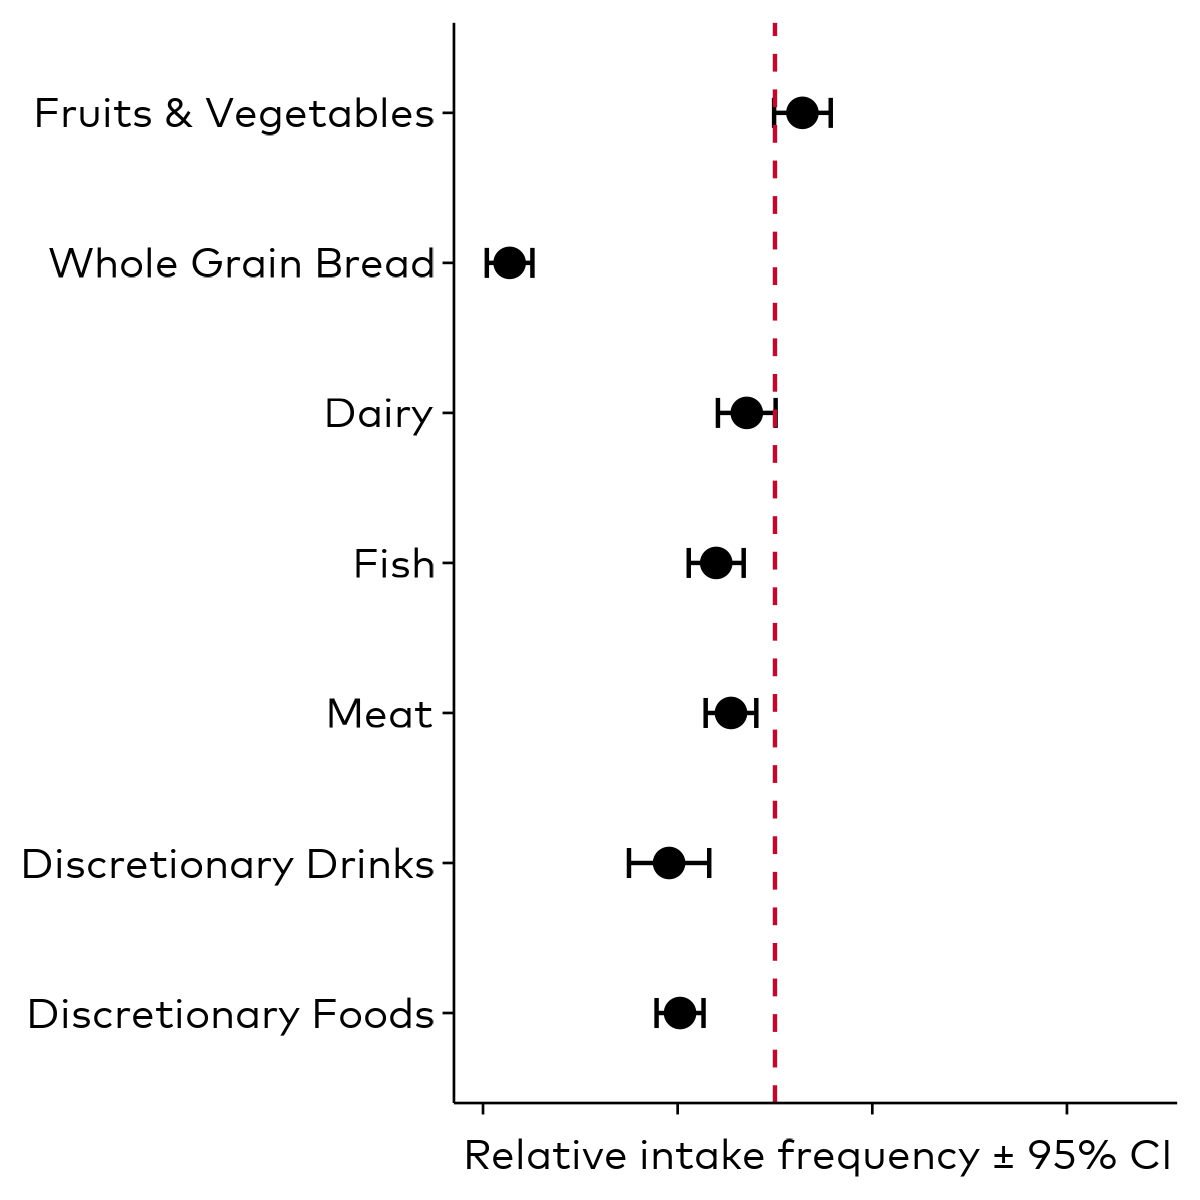
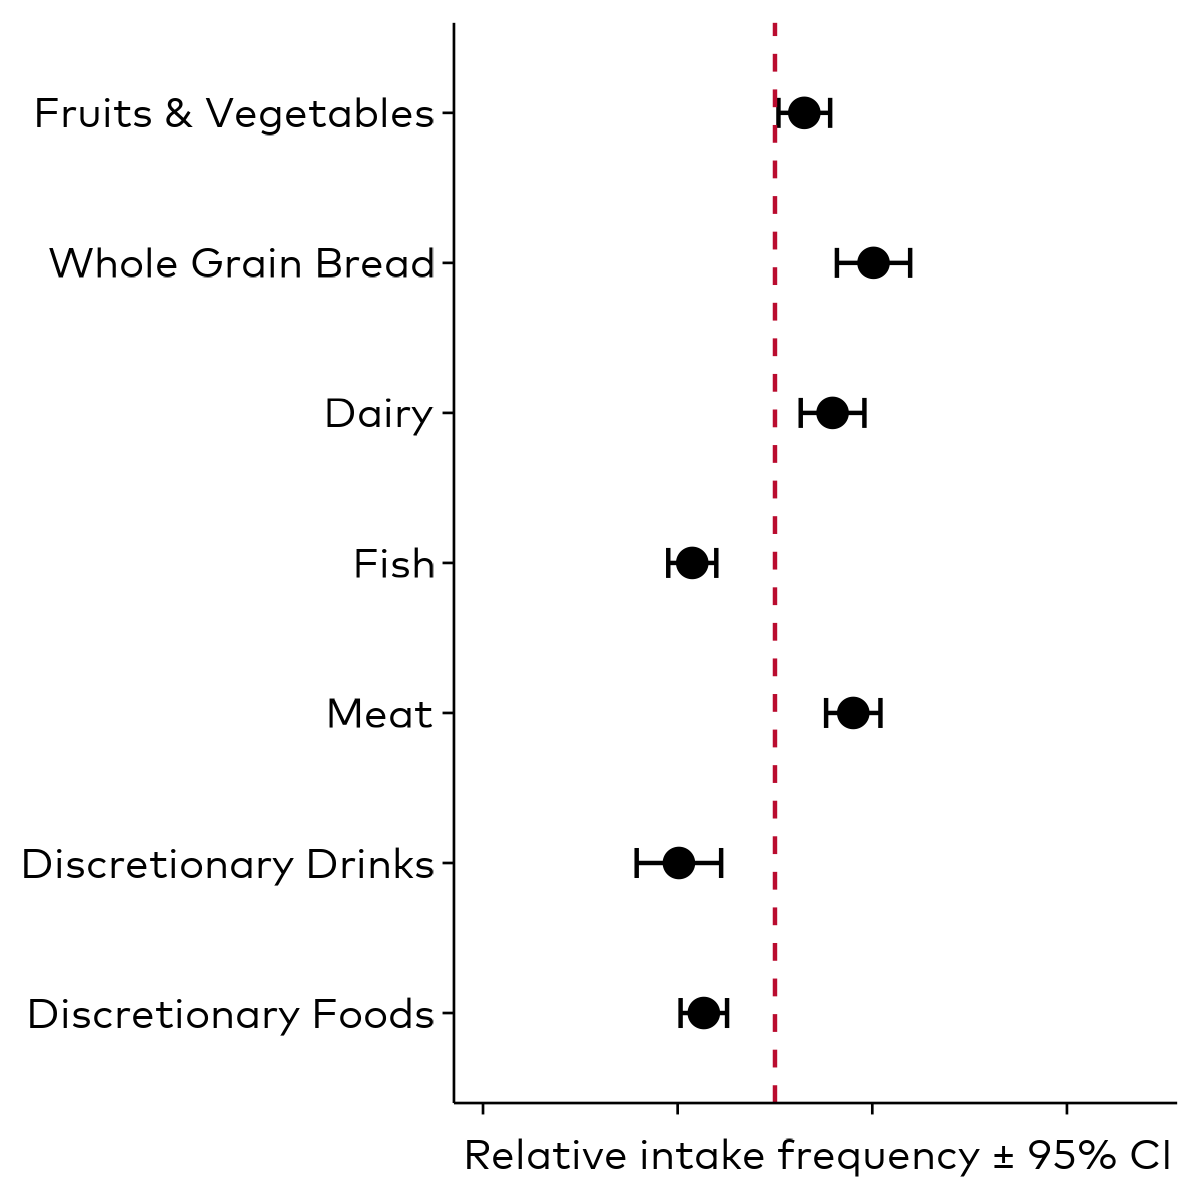
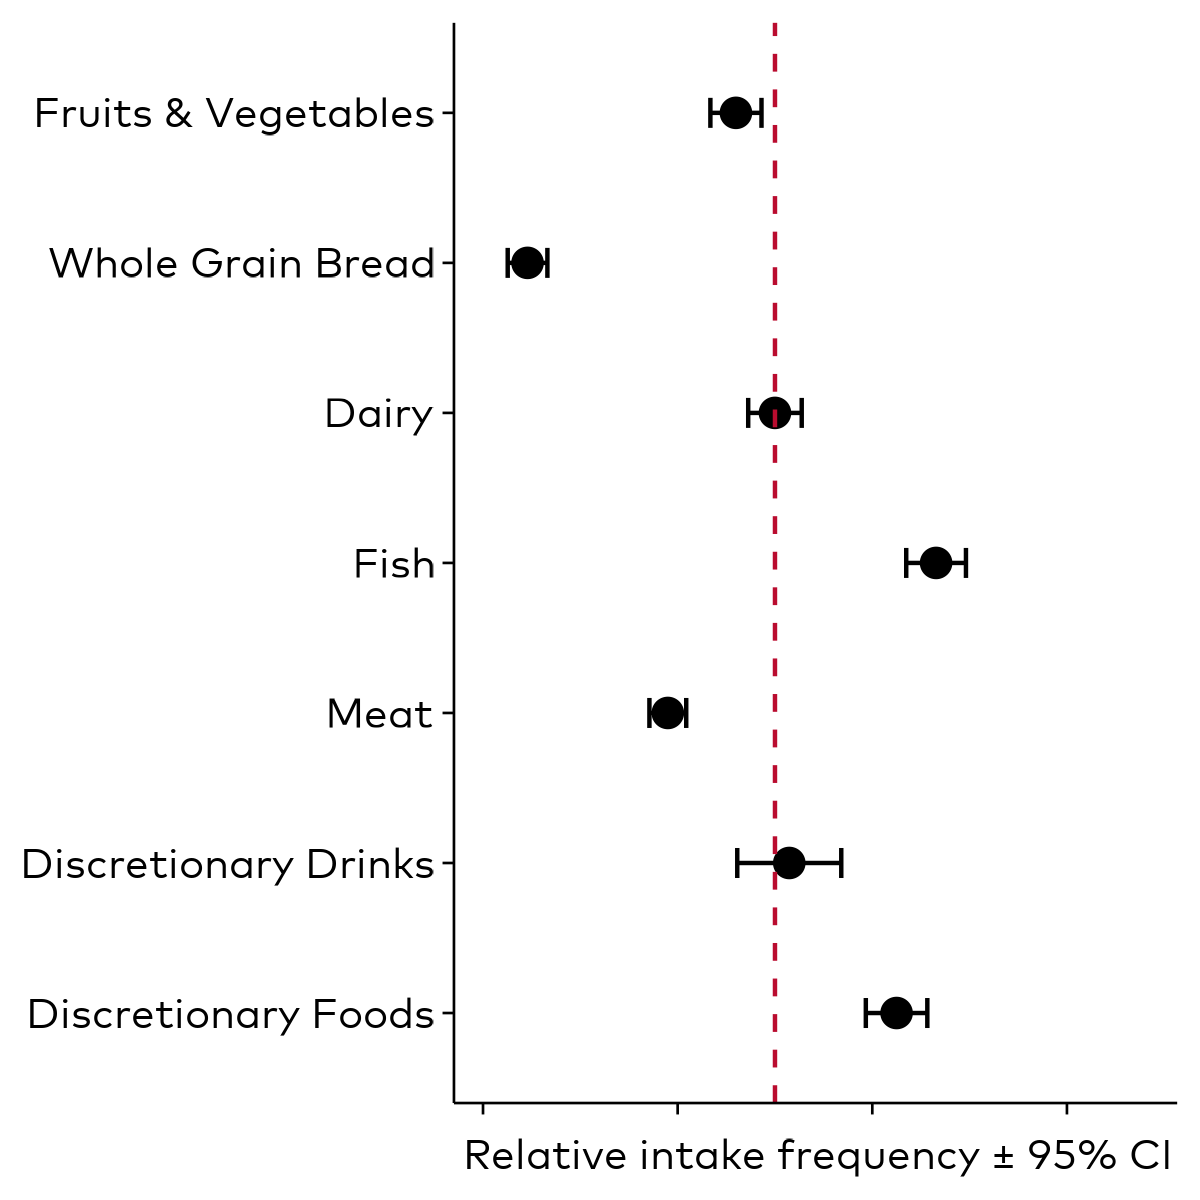
The frequency values from the main food categories among children from each specific country compared to the Nordic Average for adults (red line). Values to the left of the red line indicate less frequent intake than the Nordic Average. Each country contributes equally to the Nordic average.
Trend 2014–2024, status 2024, differences and similarities between countries
Food groups that should increase
Across the Nordic Region, total fruits and vegetables intake showed a small but statistically significant decrease between 2014 and 2024, declining from 2.8 to 2.6 times per day. By country, decreases were observed in Denmark (–0.4 times per day), Sweden (–0.2, not statistically significant), and Iceland (–0.2, not statistically significant), while intake remained stable in Norway and Finland.
In 2024, intake levels of total fruits and vegetables were low across all countries, ranging from 2.4 times per day in Norway and Iceland to 2.8 times per day in Finland and Sweden. The declines observed in several countries were mainly driven by reductions in fruit intake. In 2024, fruit consumption was similar across countries (1.2–1.3 times per day).
Vegetable intake also declined slightly at the regional level, though the change was not statistically significant. In 2024, Iceland and Norway had statistically significantly lower vegetable intake (1.1 times per day) than the other countries (1.4–1.5 times per day).
Intake of pulses was not measured in 2014. In 2024, levels were very low and consistent across countries (0.1 times per day).
For whole-grain bread, intake across the region decreased from 3.1 to 2.2 slices per day between 2014 and 2024, with declines in all countries. In 2024, Norway reported the highest consumption (3.7 slices per day), while Iceland (1.9) and Sweden (1.0) had the lowest. Denmark and Finland reported similar levels (2.6–2.7 slices per day).
Trends in fish intake were less certain due to changes in survey questions between 2014 and 2024. Regionally, no overall change was observed (1.6 times per week in both years). By country, consumption appeared to increase slightly in Denmark (+0.4 times per week, not statistically significant) and decrease in Iceland (–0.3), while remaining unchanged in Norway, Sweden, and Finland. In 2024, overall intake remained low: Iceland had the highest fish consumption (2.2 times per week), followed by Norway (1.8), while Denmark, Sweden, and Finland were at similar lower levels (1.4–1.5 times per week).
Food groups that should decrease
Total meat intake was not estimated in 2014. In 2024, Denmark and Finland had the highest intake levels (9.1 and 8.1 times per week, respectively). In the other Nordic countries, intake ranged from 5.4 to 6.3 times per week, with Iceland reporting the lowest. The high intake in Denmark and Finland was partly due to higher consumption of other meat (chicken, pork, and venison). In contrast, intake of veal, beef, and lamb was more uniform across countries, ranging from 2.7 times per week in Denmark to 3.5 in Finland.
Across the Nordic Region, total discretionary food intake increased from 3.5 to 3.9 times per week between 2014 and 2024. Consumption rose most notably in Denmark (+1.4 times per week) and to a lesser extent in Iceland (+0.5, not significant), while remaining largely unchanged in the other countries. In 2024, Denmark and Iceland had the highest intake (5.1 and 4.8 times per week), whereas the remaining countries reported similar lower levels (3.0–3.3 times per week).
For total discretionary drinks, intake increased regionally from 2.6 to 3.0 times per week between 2014 and 2024. Consumption rose in all countries except Finland, where it declined slightly (–0.7 times per week, not significant). The increase was statistically significant only in Iceland (+1.1 times per week). In 2024, the highest intake levels were observed in Norway, Denmark, and Iceland (3.8, 3.5, and 3.1 times per week, respectively), while Sweden and Finland both reported lower levels (2.4 times per week).
Energy drink intake increased in Norway, while light or sugar-free beverage consumption rose in all countries, though not statistically significantly in Finland. Juice intake declined across all countries (not statistically significantly in Denmark), with lower 2024 consumption seen in Denmark and Finland than in Iceland and Norway.
Other food groups of note
Total dairy intake was not estimated in 2014. In 2024, Finland and Norway reported the highest intake levels (2.0 times per day), while Denmark had the lowest (1.4 times per day).
Across the Nordic Region, cheese intake increased slightly from 0.5 to 0.6 times per day between 2014 and 2024. The increase was driven by higher consumption in Denmark and Iceland (each rising by 0.3 times per day), while intake remained unchanged in Norway, Sweden, and Finland.
N | 598 | 508 |
|---|---|---|
Total Fruit & Vegetable Consumption (times per day) | 3.1 (3.0; 3.2) * | 2.7 (2.6; 2.9) * |
Fruit Consumption (times per day) | 1.6 (1.5; 1.7) * | 1.3 (1.3; 1.4) * |
Vegetable Consumption (times per day) | 1.5 (1.4; 1.6) | 1.4 (1.3; 1.5) |
Pulse Consumption (times per day) | 0.1 (0.1; 0.1) | |
Total Whole Grain Bread Consumption (slices per day) | 3.6 (3.4; 3.8) * | 2.6 (2.4; 2.8) * |
Hard Bread Consumption (slices per day) | 0.3 (0.2; 0.3) | 0.2 (0.2; 0.2) |
Rye Bread Consumption (slices per day) | 1.8 (1.7; 2.0) | 1.5 (1.4; 1.7) |
Whole Grain Bread Wheat Consumption (slices per day) | 1.4 (1.3; 1.6) * | 0.9 (0.8; 1.0) * |
Total Fish Consumption (times per week) | 1.0 (0.8; 1.2) | 1.4 (1.2; 1.5) |
Total Meat Consumption (times per week) | 9.1 (8.6; 9.5) | |
Veal, Beef, Lamb Consumption (times per week) | 2.7 (2.5; 3.0) | |
Other Meat (Chicken, Pork, Venison) Consumption (times per week) | 6.4 (5.9; 6.8) | |
Total Dairy Consumption (times per day) | 1.4 (1.3; 1.5) | |
Cheese Consumption (times per day) | 0.2 (0.2; 0.3) * | 0.4 (0.4; 0.4) * |
Milk Product Consumption (times per day) | 1.0 (0.9; 1.1) | |
Total Discretionary Food Consumption (times per week) | 3.7 (3.5; 4.0) * | 5.1 (4.8; 5.5) * |
Cake, biscuits, pie, etc. Consumption (times per week) | 1.7 (1.6; 1.9) * | 2.2 (2.0; 2.4) * |
Chocolate and Candy Consumption (times per week) | 2.0 (1.9; 2.1) * | 2.9 (2.7; 3.1) * |
Total Discretionary Drink Consumption (times per week) | 2.9 (2.6; 3.3) | 3.5 (3.1; 3.8) |
Energy Drinks (times per week) | 0.0 (-0.0; 0.0) | 0.0 (0.0; 0.0) |
Sugary Beverages (times per week) | 1.4 (1.2; 1.6) | 1.0 (0.9; 1.2) |
Light or Sugar Free Beverages (times per week) | 1.5 (1.2; 1.8) * | 2.4 (2.1; 2.8) * |
Juice Consumption (times per week) | 1.8 (1.6; 2.0) | 1.3 (1.1; 1.6) |
* indicates statistically significant difference (p < 0.001) between survey years within a country or region.
Grey cells indicate values not collected and/or not valid for comparison.
N refers to the number of participants that survey year in that country or region. See Appendix 6 for variable-specific sample sizes.
Dietary variables in bold are composites of the variables below.
Pulse consumption is included in vegetable consumption.
Each country contributes equally to the Nordic average.
Whole grain bread is defined as whole grain wheat bread, rye bread and hard bread.
Grey cells indicate values not collected and/or not valid for comparison.
N refers to the number of participants that survey year in that country or region. See Appendix 6 for variable-specific sample sizes.
Dietary variables in bold are composites of the variables below.
Pulse consumption is included in vegetable consumption.
Each country contributes equally to the Nordic average.
Whole grain bread is defined as whole grain wheat bread, rye bread and hard bread.
N | 358 | 510 |
|---|---|---|
Total Fruit & Vegetable Consumption (times per day) | 2.5 (2.2; 2.7) | 2.4 (2.3; 2.5) |
Fruit Consumption (times per day) | 1.3 (1.2; 1.5) | 1.3 (1.2; 1.3) |
Vegetable Consumption (times per day) | 1.1 (1.0; 1.3) | 1.1 (1.0; 1.2) |
Pulse Consumption (times per day) | 0.1 (0.1; 0.1) | |
Total Whole Grain Bread Consumption (slices per day) | 4.3 (3.8; 4.8) | 3.7 (3.5; 3.9) |
Hard Bread Consumption (slices per day) | 0.6 (0.4; 0.7) | 0.5 (0.4; 0.6) |
Rye Bread Consumption (slices per day) | 0.9 (0.6; 1.2) * | 0.0 (0.0; 0.1) * |
Whole Grain Bread Wheat Consumption (slices per day) | 2.9 (2.4; 3.3) | 3.1 (2.9; 3.3) |
Total Fish Consumption (times per week) | 1.7 (1.6; 1.9) | 1.8 (1.7; 1.9) |
Total Meat Consumption (times per week) | 6.0 (5.6; 6.3) | |
Veal, Beef, Lamb Consumption (times per week) | 2.9 (2.6; 3.1) | |
Other Meat (Chicken, Pork, Venison) Consumption (times per week) | 3.1 (2.8; 3.4) | |
Total Dairy Consumption (times per day) | 2.0 (1.9; 2.1) | |
Cheese Consumption (times per day) | 0.7 (0.6; 0.8) | 0.7 (0.7; 0.8) |
Milk Product Consumption (times per day) | 1.3 (1.2; 1.4) | |
Total Discretionary Food Consumption (times per week) | 2.8 (2.6; 3.1) | 3.0 (2.8; 3.1) |
Cake, biscuits, pie, etc. Consumption (times per week) | 1.1 (0.9; 1.2) | 1.0 (1.0; 1.1) |
Chocolate and Candy Consumption (times per week) | 1.8 (1.6; 2.0) | 1.9 (1.8; 2.1) |
Total Discretionary Drink Consumption (times per week) | 3.0 (2.5; 3.4) | 3.8 (3.4; 4.1) |
Energy Drinks (times per week) | 0.0 (-0.0; 0.0) * | 0.1 (0.0; 0.1) * |
Sugary Beverages (times per week) | 1.3 (1.1; 1.6) | 1.1 (0.9; 1.2) |
Light or Sugar Free Beverages (times per week) | 1.6 (1.2; 2.1) * | 2.6 (2.3; 2.9) * |
Juice Consumption (times per week) | 3.6 (3.1; 4.2) * | 2.1 (1.9; 2.4) * |
* indicates statistically significant difference (p < 0.001) between survey years within a country or region.
Grey cells indicate values not collected and/or not valid for comparison.
N refers to the number of participants that survey year in that country or region. See Appendix 6 for variable-specific sample sizes.
Dietary variables in bold are composites of the variables below.
Pulse consumption is included in vegetable consumption.
Each country contributes equally to the Nordic average.
Whole grain bread is defined as whole grain wheat bread, rye bread and hard bread.
Grey cells indicate values not collected and/or not valid for comparison.
N refers to the number of participants that survey year in that country or region. See Appendix 6 for variable-specific sample sizes.
Dietary variables in bold are composites of the variables below.
Pulse consumption is included in vegetable consumption.
Each country contributes equally to the Nordic average.
Whole grain bread is defined as whole grain wheat bread, rye bread and hard bread.
N | 500 | 505 |
|---|---|---|
Total Fruit & Vegetable Consumption (times per day) | 3.0 (2.9; 3.2) | 2.8 (2.6; 2.9) |
Fruit Consumption (times per day) | 1.5 (1.4; 1.6) | 1.3 (1.2; 1.4) |
Vegetable Consumption (times per day) | 1.5 (1.5; 1.6) | 1.5 (1.4; 1.6) |
Pulse Consumption (times per day) | 0.1 (0.1; 0.2) | |
Total Whole Grain Bread Consumption (slices per day) | 1.9 (1.7; 2.1) * | 1.0 (0.9; 1.1) * |
Hard Bread Consumption (slices per day) | 0.6 (0.5; 0.7) | 0.5 (0.4; 0.6) |
Rye Bread Consumption (slices per day) | ||
Whole Grain Bread Wheat Consumption (slices per day) | 1.3 (1.2; 1.4) * | 0.5 (0.4; 0.5) * |
Total Fish Consumption (times per week) | 1.5 (1.4; 1.6) | 1.4 (1.3; 1.5) |
Total Meat Consumption (times per week) | 6.3 (6.0; 6.7) | |
Veal, Beef, Lamb Consumption (times per week) | 3.1 (2.9; 3.4) | |
Other Meat (Chicken, Pork, Venison) Consumption (times per week) | 3.3 (3.0; 3.6) | |
Total Dairy Consumption (times per day) | 1.7 (1.6; 1.8) | |
Cheese Consumption (times per day) | 0.5 (0.4; 0.6) | 0.5 (0.4; 0.5) |
Milk Product Consumption (times per day) | 1.2 (1.1; 1.3) | |
Total Discretionary Food Consumption (times per week) | 3.1 (2.7; 3.6) | 3.1 (2.9; 3.3) |
Cake, biscuits, pie, etc. Consumption (times per week) | 1.7 (1.3; 2.2) | 1.3 (1.2; 1.4) |
Chocolate and Candy Consumption (times per week) | 1.4 (1.3; 1.5) * | 1.8 (1.7; 1.9) * |
Total Discretionary Drink Consumption (times per week) | 2.0 (1.7; 2.2) | 2.4 (2.1; 2.6) |
Energy Drinks (times per week) | 0.0 (0.0; 0.0) | 0.0 (-0.0; 0.0) |
Sugary Beverages (times per week) | 1.4 (1.3; 1.6) * | 1.0 (0.8; 1.2) * |
Light or Sugar Free Beverages (times per week) | 0.5 (0.3; 0.8) * | 1.3 (1.2; 1.5) * |
Juice Consumption (times per week) | 2.3 (2.0; 2.7) * | 1.6 (1.4; 1.8) * |
* indicates statistically significant difference (p < 0.001) between survey years within a country or region.
Grey cells indicate values not collected and/or not valid for comparison.
N refers to the number of participants that survey year in that country or region. See Appendix 6 for variable-specific sample sizes.
Dietary variables in bold are composites of the variables below.
Pulse consumption is included in vegetable consumption.
Each country contributes equally to the Nordic average.
Whole grain bread is defined as whole grain wheat bread, rye bread and hard bread.
Grey cells indicate values not collected and/or not valid for comparison.
N refers to the number of participants that survey year in that country or region. See Appendix 6 for variable-specific sample sizes.
Dietary variables in bold are composites of the variables below.
Pulse consumption is included in vegetable consumption.
Each country contributes equally to the Nordic average.
Whole grain bread is defined as whole grain wheat bread, rye bread and hard bread.
N | 500 | 503 |
|---|---|---|
Total Fruit & Vegetable Consumption (times per day) | 2.8 (2.6; 2.9) | 2.8 (2.6; 2.9) |
Fruit Consumption (times per day) | 1.2 (1.1; 1.3) | 1.2 (1.2; 1.3) |
Vegetable Consumption (times per day) | 1.6 (1.5; 1.7) | 1.5 (1.4; 1.6) |
Pulse Consumption (times per day) | 0.1 (0.1; 0.1) | |
Total Whole Grain Bread Consumption (slices per day) | 3.7 (3.4; 3.9) * | 2.7 (2.5; 2.8) * |
Hard Bread Consumption (slices per day) | 0.7 (0.6; 0.8) * | 0.4 (0.4; 0.5) * |
Rye Bread Consumption (slices per day) | 1.8 (1.7; 2.0) * | 1.1 (1.0; 1.2) * |
Whole Grain Bread Wheat Consumption (slices per day) | 1.2 (1.0; 1.3) | 1.1 (1.0; 1.2) |
Total Fish Consumption (times per week) | 1.4 (1.4; 1.5) | 1.4 (1.3; 1.4) |
Total Meat Consumption (times per week) | 8.1 (7.7; 8.5) | |
Veal, Beef, Lamb Consumption (times per week) | 3.5 (3.2; 3.8) | |
Other Meat (Chicken, Pork, Venison) Consumption (times per week) | 4.7 (4.3; 5.1) | |
Total Dairy Consumption (times per day) | 2.0 (1.9; 2.1) | |
Cheese Consumption (times per day) | 0.5 (0.4; 0.6) | 0.7 (0.6; 0.7) |
Milk Product Consumption (times per day) | 1.3 (1.2; 1.4) | |
Total Discretionary Food Consumption (times per week) | 3.5 (3.3; 3.8) | 3.3 (3.1; 3.5) |
Cake, biscuits, pie, etc. Consumption (times per week) | 1.8 (1.7; 2.0) * | 1.3 (1.2; 1.4) * |
Chocolate and Candy Consumption (times per week) | 1.7 (1.6; 1.8) | 2.0 (1.9; 2.1) |
Total Discretionary Drink Consumption (times per week) | 3.1 (2.7; 3.5) | 2.4 (2.2; 2.7) |
Energy Drinks (times per week) | 0.0 (0.0; 0.0) | 0.0 (0.0; 0.0) |
Sugary Beverages (times per week) | 2.1 (1.8; 2.4) * | 1.2 (1.0; 1.4) * |
Light or Sugar Free Beverages (times per week) | 1.0 (0.8; 1.3) | 1.2 (1.0; 1.4) |
Juice Consumption (times per week) | 2.3 (2.0; 2.7) * | 1.4 (1.2; 1.6) * |
* indicates statistically significant difference (p < 0.001) between survey years within a country or region.
Grey cells indicate values not collected and/or not valid for comparison.
N refers to the number of participants that survey year in that country or region. See Appendix 6 for variable-specific sample sizes.
Dietary variables in bold are composites of the variables below.
Pulse consumption is included in vegetable consumption.
Each country contributes equally to the Nordic average.
Whole grain bread is defined as whole grain wheat bread, rye bread and hard bread.
Grey cells indicate values not collected and/or not valid for comparison.
N refers to the number of participants that survey year in that country or region. See Appendix 6 for variable-specific sample sizes.
Dietary variables in bold are composites of the variables below.
Pulse consumption is included in vegetable consumption.
Each country contributes equally to the Nordic average.
Whole grain bread is defined as whole grain wheat bread, rye bread and hard bread.
N | 514 | 508 |
|---|---|---|
Total Fruit & Vegetable Consumption (times per day) | 2.6 (2.5; 2.7) | 2.4 (2.3; 2.5) |
Fruit Consumption (times per day) | 1.4 (1.3; 1.5) | 1.3 (1.2; 1.4) |
Vegetable Consumption (times per day) | 1.2 (1.1; 1.2) | 1.1 (1.0; 1.2) |
Pulse Consumption (times per day) | 0.1 (0.0; 0.1) | |
Total Whole Grain Bread Consumption (slices per day) | 1.9 (1.8; 2.0) * | 1.1 (1.0; 1.2) * |
Hard Bread Consumption (slices per day) | 0.3 (0.2; 0.3) | 0.2 (0.2; 0.2) |
Rye Bread Consumption (slices per day) | 0.5 (0.4; 0.5) * | 0.1 (0.1; 0.1) * |
Whole Grain Bread Wheat Consumption (slices per day) | 1.2 (1.1; 1.3) * | 0.8 (0.7; 0.9) * |
Total Fish Consumption (times per week) | 2.5 (2.4; 2.6) * | 2.2 (2.1; 2.3) * |
Total Meat Consumption (times per week) | 5.4 (5.2; 5.7) | |
Veal, Beef, Lamb Consumption (times per week) | 2.9 (2.7; 3.1) | |
Other Meat (Chicken, Pork, Venison) Consumption (times per week) | 2.6 (2.4; 2.8) | |
Total Dairy Consumption (times per day) | 1.8 (1.7; 1.9) | |
Cheese Consumption (times per day) | 0.4 (0.4; 0.5) * | 0.7 (0.6; 0.7) * |
Milk Product Consumption (times per day) | 1.1 (1.0; 1.2) | |
Total Discretionary Food Consumption (times per week) | 4.3 (4.1; 4.6) | 4.8 (4.6; 5.1) |
Cake, biscuits, pie, etc. Consumption (times per week) | 2.6 (2.4; 2.8) | 2.5 (2.3; 2.7) |
Chocolate and Candy Consumption (times per week) | 1.7 (1.6; 1.8) * | 2.4 (2.2; 2.5) * |
Total Discretionary Drink Consumption (times per week) | 2.0 (1.7; 2.2) * | 3.1 (2.8; 3.4) * |
Energy Drinks (times per week) | 0.0 (0.0; 0.0) | 0.0 (0.0; 0.1) |
Sugary Beverages (times per week) | 1.1 (0.9; 1.2) | 1.0 (0.8; 1.1) |
Light or Sugar Free Beverages (times per week) | 0.9 (0.7; 1.1) * | 2.1 (1.9; 2.4) * |
Juice Consumption (times per week) | 3.1 (2.8; 3.4) * | 2.4 (2.1; 2.6) * |
* indicates statistically significant difference (p < 0.001) between survey years within a country or region.
Grey cells indicate values not collected and/or not valid for comparison.
N refers to the number of participants that survey year in that country or region. See Appendix 6 for variable-specific sample sizes.
Dietary variables in bold are composites of the variables below.
Pulse consumption is included in vegetable consumption.
Each country contributes equally to the Nordic average.
Whole grain bread is defined as whole grain wheat bread, rye bread and hard bread.
Grey cells indicate values not collected and/or not valid for comparison.
N refers to the number of participants that survey year in that country or region. See Appendix 6 for variable-specific sample sizes.
Dietary variables in bold are composites of the variables below.
Pulse consumption is included in vegetable consumption.
Each country contributes equally to the Nordic average.
Whole grain bread is defined as whole grain wheat bread, rye bread and hard bread.
N | 2470 | 2534 |
|---|---|---|
Total Fruit & Vegetable Consumption (times per day) | 2.8 (2.7; 2.9) * | 2.6 (2.5; 2.7) * |
Fruit Consumption (times per day) | 1.4 (1.4; 1.4) * | 1.3 (1.2; 1.3) * |
Vegetable Consumption (times per day) | 1.4 (1.3; 1.4) | 1.3 (1.3; 1.4) |
Pulse Consumption (times per day) | 0.1 (0.1; 0.1) | |
Total Whole Grain Bread Consumption (slices per day) | 3.1 (3.0; 3.2) * | 2.2 (2.1; 2.3) * |
Hard Bread Consumption (slices per day) | 0.5 (0.4; 0.5) * | 0.4 (0.4; 0.4) * |
Rye Bread Consumption (slices per day) | ||
Whole Grain Bread Wheat Consumption (slices per day) | 1.6 (1.5; 1.7) * | 1.3 (1.2; 1.3) * |
Total Fish Consumption (times per week) | 1.6 (1.6; 1.7) | 1.6 (1.6; 1.7) |
Total Meat Consumption (times per week) | 7.0 (6.8; 7.2) | |
Veal, Beef, Lamb Consumption (times per week) | 3.0 (2.9; 3.1) | |
Other Meat (Chicken, Pork, Venison) Consumption (times per week) | 4.0 (3.8; 4.2) | |
Total Dairy Consumption (times per day) | 1.8 (1.7; 1.8) | |
Cheese Consumption (times per day) | 0.5 (0.5; 0.5) * | 0.6 (0.6; 0.6) * |
Milk Product Consumption (times per day) | 1.2 (1.1; 1.2) | |
Total Discretionary Food Consumption (times per week) | 3.5 (3.4; 3.6) * | 3.9 (3.8; 4.0) * |
Cake, biscuits, pie, etc. Consumption (times per week) | 1.8 (1.7; 1.9) | 1.7 (1.6; 1.8) |
Chocolate and Candy Consumption (times per week) | 1.7 (1.6; 1.8) * | 2.2 (2.1; 2.3) * |
Total Discretionary Drink Consumption (times per week) | 2.6 (2.4; 2.7) * | 3.0 (2.9; 3.2) * |
Energy Drinks (times per week) | 0.0 (0.0; 0.0) * | 0.0 (0.0; 0.0) * |
Sugary Beverages (times per week) | 1.5 (1.4; 1.6) * | 1.1 (1.0; 1.1) * |
Light or Sugar Free Beverages (times per week) | 1.1 (1.0; 1.2) * | 1.9 (1.8; 2.1) * |
Juice Consumption (times per week) | 2.6 (2.4; 2.8) * | 1.8 (1.7; 1.9) * |
* indicates statistically significant difference (p < 0.001) between survey years within a country or region.
Grey cells indicate values not collected and/or not valid for comparison.
N refers to the number of participants that survey year in that country or region. See Appendix 6 for variable-specific sample sizes.
Dietary variables in bold are composites of the variables below.
Pulse consumption is included in vegetable consumption.
Each country contributes equally to the Nordic average.
Whole grain bread is defined as whole grain wheat bread, rye bread and hard bread.
Grey cells indicate values not collected and/or not valid for comparison.
N refers to the number of participants that survey year in that country or region. See Appendix 6 for variable-specific sample sizes.
Dietary variables in bold are composites of the variables below.
Pulse consumption is included in vegetable consumption.
Each country contributes equally to the Nordic average.
Whole grain bread is defined as whole grain wheat bread, rye bread and hard bread.
Demographic Differences
Gender
No statistically significant gender differences were observed for any food group, except for hard bread, where Norwegian girls reported a higher intake than Norwegian boys.
N | 276 | 232 |
|---|---|---|
Total Fruit & Vegetable Consumption (times per day) | 2.7 (2.5; 2.9) | 2.8 (2.6; 2.9) |
Fruit Consumption (times per day) | 1.3 (1.2; 1.5) | 1.4 (1.2; 1.5) |
Vegetable Consumption (times per day) | 1.4 (1.2; 1.5) | 1.4 (1.3; 1.5) |
Pulse Consumption (times per day) | 0.1 (0.1; 0.1) | 0.1 (0.1; 0.1) |
Total Whole Grain Bread Consumption (slices per day) | 2.8 (2.5; 3.0) | 2.4 (2.2; 2.6) |
Hard Bread Consumption (slices per day) | 0.2 (0.1; 0.2) | 0.2 (0.1; 0.3) |
Rye Bread Consumption (slices per day) | 1.7 (1.5; 1.9) | 1.3 (1.2; 1.5) |
Whole Grain Bread Wheat Consumption (slices per day) | 0.9 (0.7; 1.0) | 0.9 (0.7; 1.0) |
Total Fish Consumption (times per week) | 1.3 (1.1; 1.5) | 1.4 (1.2; 1.7) |
Total Meat Consumption (times per week) | 9.3 (8.7; 9.9) | 8.8 (8.1; 9.5) |
Veal, Beef, Lamb Consumption (times per week) | 2.9 (2.6; 3.2) | 2.6 (2.2; 2.9) |
Other Meat (Chicken, Pork, Venison) Consumption (times per week) | 6.4 (5.8; 7.0) | 6.3 (5.6; 7.0) |
Total Dairy Consumption (times per day) | 1.4 (1.2; 1.5) | 1.4 (1.3; 1.5) |
Cheese Consumption (times per day) | 0.4 (0.3; 0.5) | 0.4 (0.4; 0.5) |
Milk Product Consumption (times per day) | 1.0 (0.9; 1.1) | 1.0 (0.9; 1.1) |
Total Discretionary Food Consumption (times per week) | 5.2 (4.7; 5.7) | 5.1 (4.6; 5.5) |
Cake, biscuits, pie, etc. Consumption (times per week) | 2.4 (2.1; 2.7) | 2.1 (1.8; 2.3) |
Chocolate and Candy Consumption (times per week) | 2.8 (2.5; 3.1) | 3.0 (2.7; 3.3) |
Total Discretionary Drink Consumption (times per week) | 3.7 (3.2; 4.2) | 3.2 (2.7; 3.8) |
Energy Drinks (times per week) | 0.0 (0.0; 0.0) | 0.0 (-0.0; 0.0) |
Sugary Beverages (times per week) | 1.0 (0.8; 1.2) | 1.0 (0.9; 1.2) |
Light or Sugar Free Beverages (times per week) | 2.6 (2.2; 3.1) | 2.2 (1.7; 2.7) |
Juice Consumption (times per week) | 1.6 (1.2; 2.0) | 1.1 (0.8; 1.4) |
* indicates statistically significant difference (p < 0.001) between genders within a country or region.
N refers to the number of participants with the gender in that country or region. See Appendix 6 for variable-specific sample sizes.
Dietary variables in bold are composites of the variables below.
Pulse consumption is included in vegetable consumption.
Each country contributes equally to the Nordic average.
Whole grain bread is defined as whole grain wheat bread, rye bread and hard bread.
N | 262 | 248 |
|---|---|---|
Total Fruit & Vegetable Consumption (times per day) | 2.3 (2.1; 2.5) | 2.4 (2.3; 2.6) |
Fruit Consumption (times per day) | 1.3 (1.1; 1.4) | 1.3 (1.1; 1.4) |
Vegetable Consumption (times per day) | 1.1 (1.0; 1.2) | 1.2 (1.1; 1.3) |
Pulse Consumption (times per day) | 0.1 (0.0; 0.1) | 0.1 (0.1; 0.1) |
Total Whole Grain Bread Consumption (slices per day) | 3.8 (3.5; 4.1) | 3.5 (3.3; 3.8) |
Hard Bread Consumption (slices per day) | 0.4 (0.3; 0.4) * | 0.7 (0.6; 0.8) * |
Rye Bread Consumption (slices per day) | 0.0 (0.0; 0.1) | 0.1 (0.0; 0.1) |
Whole Grain Bread Wheat Consumption (slices per day) | 3.4 (3.2; 3.7) * | 2.8 (2.6; 3.0) * |
Total Fish Consumption (times per week) | 1.7 (1.5; 1.9) | 2.0 (1.8; 2.1) |
Total Meat Consumption (times per week) | 6.1 (5.7; 6.6) | 5.8 (5.3; 6.2) |
Veal, Beef, Lamb Consumption (times per week) | 3.0 (2.6; 3.3) | 2.8 (2.5; 3.1) |
Other Meat (Chicken, Pork, Venison) Consumption (times per week) | 3.2 (2.8; 3.6) | 3.0 (2.6; 3.4) |
Total Dairy Consumption (times per day) | 2.2 (2.0; 2.3) | 1.9 (1.8; 2.1) |
Cheese Consumption (times per day) | 0.8 (0.7; 0.8) | 0.7 (0.6; 0.8) |
Milk Product Consumption (times per day) | 1.4 (1.3; 1.5) | 1.3 (1.1; 1.4) |
Total Discretionary Food Consumption (times per week) | 2.9 (2.6; 3.1) | 3.1 (2.9; 3.3) |
Cake, biscuits, pie, etc. Consumption (times per week) | 1.0 (0.9; 1.1) | 1.1 (1.0; 1.2) |
Chocolate and Candy Consumption (times per week) | 1.9 (1.7; 2.1) | 2.0 (1.8; 2.1) |
Total Discretionary Drink Consumption (times per week) | 4.1 (3.6; 4.6) | 3.4 (3.0; 3.9) |
Energy Drinks (times per week) | 0.1 (0.1; 0.2) | 0.0 (0.0; 0.1) |
Sugary Beverages (times per week) | 1.3 (1.0; 1.6) | 0.9 (0.7; 1.0) |
Light or Sugar Free Beverages (times per week) | 2.7 (2.3; 3.1) | 2.5 (2.1; 3.0) |
Juice Consumption (times per week) | 2.1 (1.8; 2.4) | 2.1 (1.8; 2.5) |
* indicates statistically significant difference (p < 0.001) between genders within a country or region.
N refers to the number of participants with the gender in that country or region. See Appendix 6 for variable-specific sample sizes.
Dietary variables in bold are composites of the variables below.
Pulse consumption is included in vegetable consumption.
Each country contributes equally to the Nordic average.
Whole grain bread is defined as whole grain wheat bread, rye bread and hard bread.
N refers to the number of participants with the gender in that country or region. See Appendix 6 for variable-specific sample sizes.
Dietary variables in bold are composites of the variables below.
Pulse consumption is included in vegetable consumption.
Each country contributes equally to the Nordic average.
Whole grain bread is defined as whole grain wheat bread, rye bread and hard bread.
N | 263 | 242 |
|---|---|---|
Total Fruit & Vegetable Consumption (times per day) | 2.6 (2.4; 2.8) | 2.9 (2.7; 3.1) |
Fruit Consumption (times per day) | 1.3 (1.1; 1.4) | 1.3 (1.2; 1.5) |
Vegetable Consumption (times per day) | 1.4 (1.2; 1.5) | 1.6 (1.4; 1.7) |
Pulse Consumption (times per day) | 0.1 (0.1; 0.2) | 0.2 (0.1; 0.2) |
Total Whole Grain Bread Consumption (slices per day) | 1.0 (0.9; 1.2) | 1.0 (0.8; 1.1) |
Hard Bread Consumption (slices per day) | 0.5 (0.4; 0.6) | 0.5 (0.4; 0.6) |
Rye Bread Consumption (slices per day) | ||
Whole Grain Bread Wheat Consumption (slices per day) | 0.5 (0.4; 0.6) | 0.4 (0.3; 0.5) |
Total Fish Consumption (times per week) | 1.3 (1.2; 1.4) | 1.6 (1.4; 1.7) |
Total Meat Consumption (times per week) | 6.5 (6.0; 7.0) | 6.2 (5.7; 6.6) |
Veal, Beef, Lamb Consumption (times per week) | 3.0 (2.7; 3.4) | 3.2 (2.9; 3.6) |
Other Meat (Chicken, Pork, Venison) Consumption (times per week) | 3.6 (3.1; 4.1) | 3.0 (2.6; 3.3) |
Total Dairy Consumption (times per day) | 1.8 (1.6; 1.9) | 1.5 (1.4; 1.7) |
Cheese Consumption (times per day) | 0.5 (0.4; 0.6) | 0.5 (0.4; 0.5) |
Milk Product Consumption (times per day) | 1.3 (1.1; 1.4) | 1.1 (1.0; 1.2) |
Total Discretionary Food Consumption (times per week) | 3.1 (2.8; 3.4) | 3.1 (2.9; 3.4) |
Cake, biscuits, pie, etc. Consumption (times per week) | 1.3 (1.1; 1.4) | 1.4 (1.2; 1.5) |
Chocolate and Candy Consumption (times per week) | 1.8 (1.6; 2.0) | 1.7 (1.6; 1.9) |
Total Discretionary Drink Consumption (times per week) | 2.6 (2.2; 3.0) | 2.1 (1.8; 2.4) |
Energy Drinks (times per week) | 0.0 (-0.0; 0.1) | 0.0 (-0.0; 0.0) |
Sugary Beverages (times per week) | 1.1 (0.8; 1.4) | 0.9 (0.8; 1.1) |
Light or Sugar Free Beverages (times per week) | 1.5 (1.2; 1.8) | 1.2 (0.9; 1.4) |
Juice Consumption (times per week) | 1.5 (1.2; 1.8) | 1.7 (1.3; 2.0) |
* indicates statistically significant difference (p < 0.001) between genders within a country or region.
Grey cells indicate values not collected and/or not valid for comparison.
N refers to the number of participants with the gender in that country or region. See Appendix 6 for variable-specific sample sizes.
Dietary variables in bold are composites of the variables below.
Pulse consumption is included in vegetable consumption.
Each country contributes equally to the Nordic average.
Whole grain bread is defined as whole grain wheat bread, rye bread and hard bread.
N | 272 | 231 |
|---|---|---|
Total Fruit & Vegetable Consumption (times per day) | 2.7 (2.5; 2.9) | 2.8 (2.6; 3.0) |
Fruit Consumption (times per day) | 1.2 (1.1; 1.3) | 1.3 (1.2; 1.4) |
Vegetable Consumption (times per day) | 1.5 (1.4; 1.7) | 1.5 (1.4; 1.6) |
Pulse Consumption (times per day) | 0.1 (0.1; 0.1) | 0.1 (0.1; 0.2) |
Total Whole Grain Bread Consumption (slices per day) | 2.8 (2.5; 3.0) | 2.5 (2.3; 2.7) |
Hard Bread Consumption (slices per day) | 0.4 (0.4; 0.5) | 0.4 (0.4; 0.5) |
Rye Bread Consumption (slices per day) | 1.2 (1.0; 1.3) | 1.1 (0.9; 1.2) |
Whole Grain Bread Wheat Consumption (slices per day) | 1.1 (1.0; 1.3) | 1.0 (0.9; 1.2) |
Total Fish Consumption (times per week) | 1.3 (1.2; 1.4) | 1.4 (1.3; 1.5) |
Total Meat Consumption (times per week) | 8.7 (8.2; 9.2) | 7.4 (6.9; 8.0) |
Veal, Beef, Lamb Consumption (times per week) | 3.9 (3.5; 4.3) * | 3.0 (2.7; 3.3) * |
Other Meat (Chicken, Pork, Venison) Consumption (times per week) | 4.9 (4.4; 5.4) | 4.5 (4.0; 5.0) |
Total Dairy Consumption (times per day) | 1.9 (1.8; 2.1) | 2.0 (1.9; 2.2) |
Cheese Consumption (times per day) | 0.6 (0.5; 0.7) | 0.7 (0.6; 0.8) |
Milk Product Consumption (times per day) | 1.3 (1.2; 1.4) | 1.3 (1.2; 1.5) |
Total Discretionary Food Consumption (times per week) | 3.3 (3.1; 3.6) | 3.3 (3.0; 3.5) |
Cake, biscuits, pie, etc. Consumption (times per week) | 1.3 (1.2; 1.5) | 1.3 (1.1; 1.5) |
Chocolate and Candy Consumption (times per week) | 2.0 (1.8; 2.2) | 2.0 (1.8; 2.1) |
Total Discretionary Drink Consumption (times per week) | 2.7 (2.3; 3.1) | 2.2 (1.8; 2.5) |
Energy Drinks (times per week) | 0.0 (0.0; 0.0) | 0.0 (-0.0; 0.1) |
Sugary Beverages (times per week) | 1.3 (1.1; 1.6) | 1.0 (0.8; 1.2) |
Light or Sugar Free Beverages (times per week) | 1.3 (1.0; 1.6) | 1.1 (0.9; 1.3) |
Juice Consumption (times per week) | 1.4 (1.1; 1.7) | 1.4 (1.2; 1.7) |
* indicates statistically significant difference (p < 0.001) between genders within a country or region.
N refers to the number of participants with the gender in that country or region. See Appendix 6 for variable-specific sample sizes.
Dietary variables in bold are composites of the variables below.
Pulse consumption is included in vegetable consumption.
Each country contributes equally to the Nordic average.
Whole grain bread is defined as whole grain wheat bread, rye bread and hard bread.
N | 271 | 237 |
|---|---|---|
Total Fruit & Vegetable Consumption (times per day) | 2.2 (2.0; 2.4) | 2.6 (2.4; 2.8) |
Fruit Consumption (times per day) | 1.2 (1.1; 1.3) | 1.4 (1.3; 1.5) |
Vegetable Consumption (times per day) | 1.0 (0.9; 1.1) | 1.2 (1.1; 1.3) |
Pulse Consumption (times per day) | 0.1 (0.0; 0.1) | 0.1 (0.0; 0.1) |
Total Whole Grain Bread Consumption (slices per day) | 1.1 (1.0; 1.3) | 1.0 (0.9; 1.1) |
Hard Bread Consumption (slices per day) | 0.2 (0.1; 0.2) | 0.2 (0.2; 0.3) |
Rye Bread Consumption (slices per day) | 0.1 (0.0; 0.1) | 0.1 (0.1; 0.1) |
Whole Grain Bread Wheat Consumption (slices per day) | 0.9 (0.8; 1.0) | 0.7 (0.6; 0.8) |
Total Fish Consumption (times per week) | 2.2 (2.0; 2.3) | 2.2 (2.0; 2.3) |
Total Meat Consumption (times per week) | 5.6 (5.2; 6.0) | 5.3 (4.9; 5.6) |
Veal, Beef, Lamb Consumption (times per week) | 3.0 (2.7; 3.2) | 2.8 (2.5; 3.0) |
Other Meat (Chicken, Pork, Venison) Consumption (times per week) | 2.7 (2.4; 3.0) | 2.5 (2.2; 2.9) |
Total Dairy Consumption (times per day) | 1.8 (1.7; 2.0) | 1.7 (1.5; 1.8) |
Cheese Consumption (times per day) | 0.7 (0.6; 0.8) | 0.6 (0.6; 0.7) |
Milk Product Consumption (times per day) | 1.2 (1.0; 1.3) | 1.1 (1.0; 1.2) |
Total Discretionary Food Consumption (times per week) | 4.7 (4.4; 5.0) | 5.0 (4.6; 5.3) |
Cake, biscuits, pie, etc. Consumption (times per week) | 2.5 (2.2; 2.8) | 2.5 (2.2; 2.7) |
Chocolate and Candy Consumption (times per week) | 2.2 (2.0; 2.4) | 2.5 (2.3; 2.8) |
Total Discretionary Drink Consumption (times per week) | 3.3 (2.8; 3.7) | 2.9 (2.5; 3.4) |
Energy Drinks (times per week) | 0.1 (-0.0; 0.1) | 0.0 (-0.0; 0.0) |
Sugary Beverages (times per week) | 1.1 (0.8; 1.3) | 0.9 (0.6; 1.1) |
Light or Sugar Free Beverages (times per week) | 2.2 (1.8; 2.5) | 2.1 (1.7; 2.5) |
Juice Consumption (times per week) | 2.2 (1.9; 2.5) | 2.5 (2.2; 2.9) |
* indicates statistically significant difference (p < 0.001) between genders within a country or region.
N refers to the number of participants with the gender in that country or region. See Appendix 6 for variable-specific sample sizes.
Dietary variables in bold are composites of the variables below.
Pulse consumption is included in vegetable consumption.
Each country contributes equally to the Nordic average.
Whole grain bread is defined as whole grain wheat bread, rye bread and hard bread.
N refers to the number of participants with the gender in that country or region. See Appendix 6 for variable-specific sample sizes.
Dietary variables in bold are composites of the variables below.
Pulse consumption is included in vegetable consumption.
Each country contributes equally to the Nordic average.
Whole grain bread is defined as whole grain wheat bread, rye bread and hard bread.
N | 1344 | 1190 |
|---|---|---|
Total Fruit & Vegetable Consumption (times per day) | 2.5 (2.4; 2.6) | 2.7 (2.6; 2.8) |
Fruit Consumption (times per day) | 1.2 (1.2; 1.3) | 1.3 (1.3; 1.4) |
Vegetable Consumption (times per day) | 1.3 (1.2; 1.3) | 1.4 (1.3; 1.4) |
Pulse Consumption (times per day) | 0.1 (0.1; 0.1) | 0.1 (0.1; 0.1) |
Total Whole Grain Bread Consumption (slices per day) | 2.3 (2.2; 2.4) | 2.1 (2.0; 2.2) |
Hard Bread Consumption (slices per day) | 0.3 (0.3; 0.4) * | 0.4 (0.4; 0.5) * |
Rye Bread Consumption (slices per day) | ||
Whole Grain Bread Wheat Consumption (slices per day) | 1.3 (1.2; 1.4) | 1.2 (1.1; 1.3) |
Total Fish Consumption (times per week) | 1.6 (1.5; 1.6) | 1.7 (1.6; 1.8) |
Total Meat Consumption (times per week) | 7.3 (7.0; 7.5) | 6.7 (6.4; 6.9) |
Veal, Beef, Lamb Consumption (times per week) | 3.1 (3.0; 3.3) | 2.9 (2.7; 3.0) |
Other Meat (Chicken, Pork, Venison) Consumption (times per week) | 4.2 (3.9; 4.4) | 3.8 (3.6; 4.1) |
Total Dairy Consumption (times per day) | 1.8 (1.7; 1.9) | 1.7 (1.7; 1.8) |
Cheese Consumption (times per day) | 0.6 (0.6; 0.6) | 0.6 (0.6; 0.6) |
Milk Product Consumption (times per day) | 1.2 (1.2; 1.3) | 1.1 (1.1; 1.2) |
Total Discretionary Food Consumption (times per week) | 3.9 (3.7; 4.0) | 3.9 (3.7; 4.0) |
Cake, biscuits, pie, etc. Consumption (times per week) | 1.7 (1.6; 1.8) | 1.7 (1.6; 1.8) |
Chocolate and Candy Consumption (times per week) | 2.2 (2.1; 2.3) | 2.2 (2.1; 2.3) |
Total Discretionary Drink Consumption (times per week) | 3.3 (3.1; 3.5) * | 2.8 (2.6; 3.0) * |
Energy Drinks (times per week) | 0.0 (0.0; 0.1) | 0.0 (0.0; 0.0) |
Sugary Beverages (times per week) | 1.2 (1.0; 1.3) | 0.9 (0.9; 1.0) |
Light or Sugar Free Beverages (times per week) | 2.1 (1.9; 2.2) | 1.8 (1.6; 2.0) |
Juice Consumption (times per week) | 1.8 (1.6; 1.9) | 1.8 (1.6; 1.9) |
* indicates statistically significant difference (p < 0.001) between genders within a country or region.
Grey cells indicate values not collected and/or not valid for comparison.
N refers to the number of participants with the gender in that country or region. See Appendix 6 for variable-specific sample sizes.
Dietary variables in bold are composites of the variables below.
Pulse consumption is included in vegetable consumption.
Each country contributes equally to the Nordic average.
Whole grain bread is defined as whole grain wheat bread, rye bread and hard bread.
Parental Education
Across the Nordic Region, children of parents with low or medium levels of education reported lower intake of total fruits and vegetables compared with those whose parents had higher levels of education (2.4 vs 2.8 times per day). A similar pattern was observed for pulses. When examined by country, the difference in total fruit and vegetable intake by parental education was statistically significant only in Finland.
Children of parents with low or medium levels of education also reported higher intake of discretionary drinks than those with parents in the high-education group (3.5 vs 2.7 times per week), and the same trend was observed for light or sugar-free beverages. At the country level, the difference in discretionary drink intake by parental education was significant in Norway and Sweden only.
N | 99 | 409 |
|---|---|---|
Total Fruit & Vegetable Consumption (times per day) | 2.6 (2.3; 2.9) | 2.8 (2.7; 3.0) |
Fruit Consumption (times per day) | 1.4 (1.2; 1.6) | 1.3 (1.2; 1.4) |
Vegetable Consumption (times per day) | 1.2 (1.1; 1.4) | 1.5 (1.4; 1.6) |
Pulse Consumption (times per day) | 0.1 (0.1; 0.1) | 0.1 (0.1; 0.1) |
Total Whole Grain Bread Consumption (slices per day) | 2.6 (2.2; 2.9) | 2.6 (2.5; 2.8) |
Hard Bread Consumption (slices per day) | 0.2 (0.1; 0.2) | 0.2 (0.2; 0.3) |
Rye Bread Consumption (slices per day) | 1.6 (1.3; 1.9) | 1.5 (1.4; 1.6) |
Whole Grain Bread Wheat Consumption (slices per day) | 0.8 (0.6; 1.0) | 0.9 (0.8; 1.0) |
Total Fish Consumption (times per week) | 1.3 (1.0; 1.5) | 1.4 (1.3; 1.6) |
Total Meat Consumption (times per week) | 9.4 (8.5; 10.3) | 8.8 (8.4; 9.2) |
Veal, Beef, Lamb Consumption (times per week) | 2.8 (2.3; 3.2) | 2.7 (2.5; 2.9) |
Other Meat (Chicken, Pork, Venison) Consumption (times per week) | 6.6 (5.7; 7.5) | 6.2 (5.8; 6.6) |
Total Dairy Consumption (times per day) | 1.3 (1.1; 1.5) | 1.4 (1.3; 1.5) |
Cheese Consumption (times per day) | 0.4 (0.3; 0.5) | 0.4 (0.4; 0.5) |
Milk Product Consumption (times per day) | 0.9 (0.8; 1.1) | 1.0 (0.9; 1.1) |
Total Discretionary Food Consumption (times per week) | 4.9 (4.3; 5.6) | 5.3 (5.0; 5.6) |
Cake, biscuits, pie, etc. Consumption (times per week) | 2.2 (1.8; 2.6) | 2.3 (2.1; 2.4) |
Chocolate and Candy Consumption (times per week) | 2.7 (2.3; 3.1) | 3.0 (2.8; 3.3) |
Total Discretionary Drink Consumption (times per week) | 3.9 (3.2; 4.6) | 3.1 (2.8; 3.4) |
Energy Drinks (times per week) | 0.0 (0.0; 0.0) | 0.0 (0.0; 0.0) |
Sugary Beverages (times per week) | 0.9 (0.7; 1.1) | 1.1 (1.0; 1.3) |
Light or Sugar Free Beverages (times per week) | 3.0 (2.3; 3.7) | 2.0 (1.7; 2.3) |
Juice Consumption (times per week) | 1.4 (0.9; 2.0) | 1.3 (1.1; 1.4) |
* indicates statistically significant difference (p < 0.001) between parental education level within a country or region.
N refers to the number of participants that parental education level in that country or region. See Appendix 6 for variable-specific sample sizes.
Dietary variables in bold are composites of the variables below.
Pulse consumption is included in vegetable consumption.
Each country contributes equally to the Nordic average.
Whole grain bread is defined as whole grain wheat bread, rye bread and hard bread.
N | 146 | 364 |
|---|---|---|
Total Fruit & Vegetable Consumption (times per day) | 2.2 (2.0; 2.4) | 2.6 (2.4; 2.7) |
Fruit Consumption (times per day) | 1.2 (1.0; 1.3) | 1.3 (1.2; 1.4) |
Vegetable Consumption (times per day) | 1.0 (0.9; 1.1) | 1.2 (1.1; 1.3) |
Pulse Consumption (times per day) | 0.0 (0.0; 0.1) | 0.1 (0.1; 0.1) |
Total Whole Grain Bread Consumption (slices per day) | 3.8 (3.5; 4.2) | 3.6 (3.4; 3.8) |
Hard Bread Consumption (slices per day) | 0.5 (0.4; 0.6) | 0.6 (0.5; 0.6) |
Rye Bread Consumption (slices per day) | 0.0 (0.0; 0.1) | 0.0 (0.0; 0.1) |
Whole Grain Bread Wheat Consumption (slices per day) | 3.3 (3.0; 3.6) | 3.0 (2.8; 3.2) |
Total Fish Consumption (times per week) | 1.8 (1.6; 2.0) | 1.8 (1.7; 2.0) |
Total Meat Consumption (times per week) | 6.0 (5.5; 6.6) | 5.9 (5.5; 6.2) |
Veal, Beef, Lamb Consumption (times per week) | 3.1 (2.7; 3.5) | 2.6 (2.4; 2.9) |
Other Meat (Chicken, Pork, Venison) Consumption (times per week) | 2.9 (2.4; 3.4) | 3.2 (2.9; 3.6) |
Total Dairy Consumption (times per day) | 2.0 (1.8; 2.1) | 2.1 (2.0; 2.2) |
Cheese Consumption (times per day) | 0.7 (0.6; 0.7) | 0.8 (0.7; 0.9) |
Milk Product Consumption (times per day) | 1.3 (1.2; 1.5) | 1.3 (1.2; 1.4) |
Total Discretionary Food Consumption (times per week) | 2.8 (2.5; 3.1) | 3.1 (2.9; 3.3) |
Cake, biscuits, pie, etc. Consumption (times per week) | 1.0 (0.8; 1.1) | 1.1 (1.0; 1.2) |
Chocolate and Candy Consumption (times per week) | 1.9 (1.6; 2.1) | 2.0 (1.9; 2.1) |
Total Discretionary Drink Consumption (times per week) | 4.5 (3.8; 5.1) * | 3.2 (2.8; 3.5) * |
Energy Drinks (times per week) | 0.1 (0.0; 0.2) | 0.1 (0.0; 0.1) |
Sugary Beverages (times per week) | 1.3 (1.0; 1.6) | 0.9 (0.8; 1.0) |
Light or Sugar Free Beverages (times per week) | 3.1 (2.5; 3.6) | 2.2 (1.9; 2.5) |
Juice Consumption (times per week) | 2.1 (1.7; 2.5) | 2.1 (1.9; 2.4) |
* indicates statistically significant difference (p < 0.001) between parental education level within a country or region.
N refers to the number of participants that parental education level in that country or region. See Appendix 6 for variable-specific sample sizes.
Dietary variables in bold are composites of the variables below.
Pulse consumption is included in vegetable consumption.
Each country contributes equally to the Nordic average.
Whole grain bread is defined as whole grain wheat bread, rye bread and hard bread.
N refers to the number of participants that parental education level in that country or region. See Appendix 6 for variable-specific sample sizes.
Dietary variables in bold are composites of the variables below.
Pulse consumption is included in vegetable consumption.
Each country contributes equally to the Nordic average.
Whole grain bread is defined as whole grain wheat bread, rye bread and hard bread.
N | 109 | 394 |
|---|---|---|
Total Fruit & Vegetable Consumption (times per day) | 2.6 (2.3; 2.9) | 2.9 (2.7; 3.0) |
Fruit Consumption (times per day) | 1.2 (1.1; 1.4) | 1.3 (1.2; 1.4) |
Vegetable Consumption (times per day) | 1.3 (1.2; 1.5) | 1.5 (1.4; 1.6) |
Pulse Consumption (times per day) | 0.1 (0.1; 0.2) | 0.2 (0.1; 0.2) |
Total Whole Grain Bread Consumption (slices per day) | 1.1 (0.9; 1.3) | 1.0 (0.9; 1.0) |
Hard Bread Consumption (slices per day) | 0.6 (0.4; 0.7) | 0.5 (0.4; 0.6) |
Rye Bread Consumption (slices per day) | ||
Whole Grain Bread Wheat Consumption (slices per day) | 0.5 (0.4; 0.6) | 0.5 (0.4; 0.5) |
Total Fish Consumption (times per week) | 1.3 (1.2; 1.5) | 1.5 (1.4; 1.6) |
Total Meat Consumption (times per week) | 6.6 (5.9; 7.3) | 6.2 (5.8; 6.6) |
Veal, Beef, Lamb Consumption (times per week) | 3.2 (2.8; 3.7) | 3.1 (2.8; 3.3) |
Other Meat (Chicken, Pork, Venison) Consumption (times per week) | 3.4 (2.7; 4.1) | 3.2 (2.9; 3.5) |
Total Dairy Consumption (times per day) | 1.7 (1.5; 1.9) | 1.7 (1.6; 1.8) |
Cheese Consumption (times per day) | 0.5 (0.4; 0.5) | 0.5 (0.5; 0.6) |
Milk Product Consumption (times per day) | 1.2 (1.0; 1.4) | 1.2 (1.1; 1.2) |
Total Discretionary Food Consumption (times per week) | 3.3 (2.9; 3.6) | 3.0 (2.8; 3.2) |
Cake, biscuits, pie, etc. Consumption (times per week) | 1.3 (1.1; 1.5) | 1.3 (1.2; 1.4) |
Chocolate and Candy Consumption (times per week) | 2.0 (1.7; 2.2) | 1.7 (1.5; 1.8) |
Total Discretionary Drink Consumption (times per week) | 3.0 (2.4; 3.5) * | 2.0 (1.8; 2.2) * |
Energy Drinks (times per week) | 0.0 (-0.0; 0.1) | 0.0 (-0.0; 0.0) |
Sugary Beverages (times per week) | 1.3 (0.9; 1.7) | 0.8 (0.7; 0.9) |
Light or Sugar Free Beverages (times per week) | 1.6 (1.2; 2.0) | 1.2 (1.0; 1.4) |
Juice Consumption (times per week) | 1.7 (1.2; 2.2) | 1.5 (1.3; 1.7) |
* indicates statistically significant difference (p < 0.001) between parental education level within a country or region.
Grey cells indicate values not collected and/or not valid for comparison.
N refers to the number of participants that parental education level in that country or region. See Appendix 6 for variable-specific sample sizes.
Dietary variables in bold are composites of the variables below.
Pulse consumption is included in vegetable consumption.
Each country contributes equally to the Nordic average.
Whole grain bread is defined as whole grain wheat bread, rye bread and hard bread.
N | 160 | 343 |
|---|---|---|
Total Fruit & Vegetable Consumption (times per day) | 2.4 (2.2; 2.7) * | 3.0 (2.9; 3.2) * |
Fruit Consumption (times per day) | 1.1 (1.0; 1.2) | 1.3 (1.2; 1.4) |
Vegetable Consumption (times per day) | 1.3 (1.2; 1.5) * | 1.7 (1.6; 1.8) * |
Pulse Consumption (times per day) | 0.1 (0.1; 0.1) | 0.1 (0.1; 0.2) |
Total Whole Grain Bread Consumption (slices per day) | 2.5 (2.3; 2.8) | 2.7 (2.6; 2.9) |
Hard Bread Consumption (slices per day) | 0.4 (0.3; 0.5) | 0.5 (0.4; 0.5) |
Rye Bread Consumption (slices per day) | 1.1 (0.9; 1.3) | 1.1 (1.0; 1.3) |
Whole Grain Bread Wheat Consumption (slices per day) | 1.0 (0.8; 1.2) | 1.2 (1.0; 1.3) |
Total Fish Consumption (times per week) | 1.3 (1.1; 1.4) | 1.4 (1.3; 1.5) |
Total Meat Consumption (times per week) | 8.5 (7.8; 9.1) | 7.8 (7.4; 8.3) |
Veal, Beef, Lamb Consumption (times per week) | 3.7 (3.2; 4.1) | 3.3 (3.1; 3.6) |
Other Meat (Chicken, Pork, Venison) Consumption | 4.8 (4.2; 5.5) | 4.6 (4.2; 5.0) |
Total Dairy Consumption (times per day) | 2.0 (1.8; 2.2) | 2.0 (1.8; 2.1) |
Cheese Consumption (times per day) | 0.7 (0.6; 0.8) | 0.6 (0.5; 0.7) |
Milk Product Consumption (times per day) | 1.3 (1.1; 1.5) | 1.3 (1.2; 1.5) |
Total Discretionary Food Consumption (times per week) | 3.1 (2.7; 3.4) | 3.5 (3.3; 3.7) |
Cake, biscuits, pie, etc. Consumption (times per week) | 1.1 (1.0; 1.3) | 1.4 (1.3; 1.6) |
Chocolate and Candy Consumption (times per week) | 1.9 (1.7; 2.1) | 2.1 (1.9; 2.2) |
Total Discretionary Drink Consumption (times per week) | 2.6 (2.1; 3.1) | 2.3 (2.0; 2.6) |
Energy Drinks (times per week) | 0.0 (0.0; 0.1) | 0.0 (0.0; 0.0) |
Sugary Beverages (times per week) | 1.3 (1.0; 1.6) | 1.1 (0.9; 1.3) |
Light or Sugar Free Beverages (times per week) | 1.3 (1.0; 1.6) | 1.2 (1.0; 1.4) |
Juice Consumption (times per week) | 1.4 (1.0; 1.7) | 1.4 (1.2; 1.6) |
* indicates statistically significant difference (p < 0.001) between parental education level within a country or region.
N refers to the number of participants that parental education level in that country or region. See Appendix 6 for variable-specific sample sizes.
Dietary variables in bold are composites of the variables below.
Pulse consumption is included in vegetable consumption.
Each country contributes equally to the Nordic average.
Whole grain bread is defined as whole grain wheat bread, rye bread and hard bread.
N | 170 | 335 |
|---|---|---|
Total Fruit & Vegetable Consumption (times per day) | 2.3 (2.0; 2.5) | 2.5 (2.3; 2.7) |
Fruit Consumption (times per day) | 1.2 (1.1; 1.4) | 1.3 (1.2; 1.4) |
Vegetable Consumption (times per day) | 1.0 (0.9; 1.1) | 1.2 (1.1; 1.3) |
Pulse Consumption (times per day) | 0.0 (0.0; 0.1) | 0.1 (0.1; 0.1) |
Total Whole Grain Bread Consumption (slices per day) | 1.0 (0.9; 1.2) | 1.1 (1.0; 1.2) |
Hard Bread Consumption (slices per day) | 0.2 (0.1; 0.3) | 0.2 (0.2; 0.2) |
Rye Bread Consumption (slices per day) | 0.1 (0.0; 0.1) | 0.1 (0.1; 0.1) |
Whole Grain Bread Wheat Consumption (slices per day) | 0.8 (0.6; 0.9) | 0.8 (0.7; 0.9) |
Total Fish Consumption (times per week) | 2.1 (1.9; 2.2) | 2.2 (2.1; 2.4) |
Total Meat Consumption (times per week) | 5.5 (5.0; 5.9) | 5.4 (5.1; 5.7) |
Veal, Beef, Lamb Consumption (times per week) | 3.1 (2.8; 3.4) | 2.7 (2.5; 2.9) |
Other Meat (Chicken, Pork, Venison) Consumption (times per week) | 2.4 (2.0; 2.7) | 2.8 (2.5; 3.0) |
Total Dairy Consumption (times per day) | 1.8 (1.7; 2.0) | 1.7 (1.6; 1.8) |
Cheese Consumption (times per day) | 0.7 (0.6; 0.8) | 0.7 (0.6; 0.7) |
Milk Product Consumption (times per day) | 1.2 (1.0; 1.3) | 1.1 (1.0; 1.2) |
Total Discretionary Food Consumption (times per week) | 4.8 (4.4; 5.2) | 4.9 (4.6; 5.2) |
Cake, biscuits, pie, etc. Consumption (times per week) | 2.6 (2.3; 3.0) | 2.4 (2.2; 2.6) |
Chocolate and Candy Consumption (times per week) | 2.2 (1.9; 2.4) | 2.5 (2.3; 2.7) |
Total Discretionary Drink Consumption (times per week) | 3.5 (2.9; 4.1) | 2.9 (2.5; 3.2) |
Energy Drinks (times per week) | 0.0 (-0.0; 0.0) | 0.0 (-0.0; 0.1) |
Sugary Beverages (times per week) | 1.0 (0.7; 1.3) | 0.9 (0.8; 1.1) |
Light or Sugar Free Beverages (times per week) | 2.4 (1.9; 2.9) | 1.9 (1.6; 2.2) |
Juice Consumption (times per week) | 2.6 (2.2; 3.0) | 2.2 (1.9; 2.5) |
* indicates statistically significant difference (p < 0.001) between parental education level within a country or region.
N refers to the number of participants that parental education level in that country or region. See Appendix 6 for variable-specific sample sizes.
Dietary variables in bold are composites of the variables below.
Pulse consumption is included in vegetable consumption.
Each country contributes equally to the Nordic average.
Whole grain bread is defined as whole grain wheat bread, rye bread and hard bread.
N refers to the number of participants that parental education level in that country or region. See Appendix 6 for variable-specific sample sizes.
Dietary variables in bold are composites of the variables below.
Pulse consumption is included in vegetable consumption.
Each country contributes equally to the Nordic average.
Whole grain bread is defined as whole grain wheat bread, rye bread and hard bread.
N | 684 | 1845 |
|---|---|---|
Total Fruit & Vegetable Consumption (times per day) | 2.4 (2.3; 2.5) * | 2.8 (2.7; 2.8) * |
Fruit Consumption (times per day) | 1.2 (1.2; 1.3) | 1.3 (1.3; 1.4) |
Vegetable Consumption (times per day) | 1.2 (1.1; 1.2) * | 1.4 (1.4; 1.5) * |
Pulse Consumption (times per day) | 0.1 (0.1; 0.1) * | 0.1 (0.1; 0.1) * |
Total Whole Grain Bread Consumption (slices per day) | 2.3 (2.1; 2.4) | 2.2 (2.1; 2.3) |
Hard Bread Consumption (slices per day) | 0.4 (0.3; 0.4) | 0.4 (0.4; 0.4) |
Rye Bread Consumption (slices per day) | ||
Whole Grain Bread Wheat Consumption (slices per day) | 1.3 (1.2; 1.4) | 1.2 (1.2; 1.3) |
Total Fish Consumption (times per week) | 1.5 (1.5; 1.6) | 1.7 (1.6; 1.7) |
Total Meat Consumption (times per week) | 7.2 (6.9; 7.5) | 6.8 (6.6; 7.0) |
Veal, Beef, Lamb Consumption (times per week) | 3.2 (3.0; 3.4) | 2.9 (2.8; 3.0) |
Other Meat (Chicken, Pork, Venison) Consumption (times per week) | 4.0 (3.7; 4.3) | 4.0 (3.8; 4.2) |
Total Dairy Consumption (times per day) | 1.8 (1.7; 1.8) | 1.8 (1.7; 1.8) |
Cheese Consumption (times per day) | 0.6 (0.5; 0.6) | 0.6 (0.6; 0.6) |
Milk Product Consumption (times per day) | 1.2 (1.1; 1.3) | 1.2 (1.1; 1.2) |
Total Discretionary Food Consumption (times per week) | 3.8 (3.6; 4.0) | 4.0 (3.8; 4.1) |
Cake, biscuits, pie, etc. Consumption (times per week) | 1.6 (1.5; 1.8) | 1.7 (1.6; 1.8) |
Chocolate and Candy Consumption (times per week) | 2.1 (2.0; 2.3) | 2.3 (2.2; 2.3) |
Total Discretionary Drink Consumption (times per week) | 3.5 (3.2; 3.8) * | 2.7 (2.5; 2.8) * |
Energy Drinks (times per week) | 0.0 (0.0; 0.1) | 0.0 (0.0; 0.0) |
Sugary Beverages (times per week) | 1.2 (1.0; 1.3) | 1.0 (0.9; 1.0) |
Light or Sugar Free Beverages (times per week) | 2.3 (2.1; 2.5) * | 1.7 (1.6; 1.8) * |
Juice Consumption (times per week) | 1.8 (1.7; 2.0) | 1.7 (1.6; 1.8) |
* indicates statistically significant difference (p < 0.001) between parental education level within a country or region.
Grey cells indicate values not collected and/or not valid for comparison.
N refers to the number of participants that parental education level in that country or region. See Appendix 6 for variable-specific sample sizes.
Dietary variables in bold are composites of the variables below.
Pulse consumption is included in vegetable consumption.
Each country contributes equally to the Nordic average.
Whole grain bread is defined as whole grain wheat bread, rye bread and hard bread.
Discussion
Summary of results
In general, the results from the study conducted in 2024 show that the diet quality, both when looking at current consumption and trends in consumption over time, has changed in a more unhealthy direction since 2014.
Comparing dietary consumption data from the study in 2024 with data from 2014 showed several unfavorable trends among both adults and children. Plant based foods should increase for both health and impact on the environment (NNR2023). On average for the Nordic Region a decrease in consumption of whole grain bread and total fruits and vegetables was found. Moreover, an increase in consumption of discretionary foods was observed among children and discretionary drinks among both adults and children. The sizes of decreases and increases in consumption of the above-mentioned food groups differed between countries. When it comes to consumption of fish, no changes were observed in the Nordic Region for the period 2014 to 2024. However, rewording the questions on fish in 2024 has compromised comparability with the 2014 data.
Interpretation
Comparison to NNR
Below we compare the reported current average frequency (times per day or per week, or slices per day) intake in 2024, with the science advice on food group intake from the Nordic Nutrition Recommendations 2023 (NNR2023). This is of course complicated by the fact that these recommendations are quantified in grams/ml, while NORMO only assesses frequency.
Data from 2024 showed low consumption levels of total fruits and vegetables among adults and children in all Nordic countries. NNR2023 recommends an intake of 500–800 g of fruits and vegetables per day. This may be equivalent to 5–8 portions per day, and the reported intake was clearly below this level in all countries. Also, the consumption of pulses was very low among both adults and children, which is supported by the national dietary surveys in Denmark and Norway (Myhre et al, 2024, Fagt, 2025). The NNR2023 recommends increasing consumption of pulses and using it as an alternative for red meat.
NNR2023 recommends that adults eat at least 90 grams of whole grains per day. This may be equivalent to about 4–5 slices of whole-grain bread per day. In the present study we have only asked about intake of whole-grain bread, but whole grains can also be eaten as e.g. whole-grain rice, whole grain pasta, whole-grain breakfast cereals or oat porridge which is not captured in the present study. Among adults, consumption of whole grain bread was higher in Norway and lower in Iceland than in the other Nordic countries. Among children consumption was highest in Norway and lowest in Sweden. The consumption of whole-grain bread seems to be somewhat low in all Nordic countries according to the NNR2023; however, due to the dietary assessment method used in NORMO with a limited and closed list of food items it is difficult to conclude. The consumption of whole-grain bread is highest in Norway, but the national dietary survey among Norwegian adults (Myhre et al, 2024) using a more detailed dietary assessment method (2 × 24-hr recalls) shows an average intake of whole grain below the recommended intake of 90 g, supporting our conclusion.
NNR2023 recommends consuming 300–450 g fish per week, which may be equivalent to 2–3 portions for dinner each week or 2 times a week for dinner and several times on open sandwiches for lunch. Data collection in 2024 indicate that several of the countries have a consumption below this level. Norway and Iceland were closest to the recommended intake among adults, and a similar pattern was observed in children (with Icelandic children highest and Norwegian children also relatively high). It is difficult to translate frequency of consumption into amounts. From the questionnaire used in 2024 for fish consumption from both dinner and lunch, the amount of fish consumed for lunch may differ from amounts used in a fish meal for dinner. It is not possible from the registration to assess which kind of fish was consumed and to relate to sustainability. Fish from sustainably managed stocks is not known from the registration, but for health an increase would have been positive.
NNR2023 recommends consuming no more than 350 grams of red meat per week for health reasons, while the consumption of processed red and white meat should be as low as possible. To minimize environmental impact, consumption of red meat should be considerably lower than 350 g per week, and white meat should not be increased from current levels and may be lower. Among adults and children the Nordic average reflects frequent intake of total meat, with Finland and Denmark above this average and the other countries below. Red meat includes meat from 4-legs animals such as beef, veal, lamb and pork and venison, while white meat includes meat from poultry, mainly chicken and hens. The food group “beef, veal and lamb” consists of only red meat, while “other meat” is a mix of red and white meat. The consumption of “veal, beef, lamb” is a large contributor to climate impact of the diets and was at the same level for all countries. However, total red meat was not measured, since it also includes pork and game, which was registered together with chicken. Moreover, we can’t split into processed meat.
NNR2023 recommends an intake of between 350 to 500 ml low fat milk and dairy products, including cheese in milk equivalents, per day. This equals about 2–4 portions per day of dairy products (incl. cheese). Among adults and children the Nordic average of dairy products suggests an intake within or at the lower end of the recommended scale. Consumption among children in Norway and Finland was above the average; Denmark below the average and for Sweden and Iceland the consumption was on average level. Among adults Norway was below the Nordic average, Finland had the highest intake, Denmark the lowest (but not statistically significantly lower than Norway). Since the NORMO study only asked for frequency consumption of dairy and cheese, the evaluation of intake from the present study towards the NNR2023 is challenged, and depending on the portion size consumed each time, the current intake of dairy and cheese seems to be within recommended level or in the lower end of the recommended scale.
NNR2023 recommends limiting intake of discretionary foods and drinks (e.g. sweets, cakes, sugary beverages). The Nordic average consumption of discretionary foods among adults and children was frequent. Consumption in Denmark and Iceland was above the average, while it was below in Norway, Finland, and Sweden. The Nordic average for consumption of discretionary drinks among adults and children far exceeds the amount recommended by the Danish Dietary Guidelines 2021. The consumption was above the Nordic average for Iceland, Denmark and Norway; and below average for Finland and Sweden. The high consumption of discretionary foods and drinks in several countries may contribute to high intake of saturated fat, added sugar and salt. Based on national dietary surveys from the Nordic countries it is well known that high intake of saturated fat and salt is an important nutritional challenge (Myhre et al, 2024, Fagt, 2025, Gunnarsdottir et al, 2022).
Demographic differences
Looking at data according to differences between gender, not much was observed for children.
Among adults, on the positive side women reported higher consumption of total fruits and vegetables in the Nordic Region and the countries separately, while men on average in the Nordic Region reported higher consumption of whole-grain bread than women, which was also found in Norway and Denmark.
On the negative side, men in the Nordic Region reported a higher intake than women of total meat, “veal, beef and lamb”, and other meat, which was also found in all the countries separately, although not significantly in all cases. Men in the Nordic Region also reported a higher intake than women of sugary beverages and juice, while women reported a higher intake than men of total discretionary food and of chocolate and candy. The intake of sugary beverages was only significantly higher among men than women in Denmark and Sweden, and of energy drinks in Denmark, while only women in Denmark and Finland reported a higher intake than men of chocolate and candy. Gender differences in dietary intake among adults and even older children are known from other national dietary data, when it comes to fruit and vegetables and meat intake (Myhre et al, 2024, Fagt, 2025, Gunnarsdottir et al, 2022).
Analysis of age-related differences among the adults showed significant differences in the Nordic Region for several food groups, while there was not sufficient power in the data to find similar significant differences in all the countries, separately. Consumption of fruits and vegetables seems to be highest in the medium age group (30–44 years). Consumption of pulses was lowest in the group highest of age (+45 years), while this age group reported the highest intake of whole grain bread. Also, fish intake seems to increase with age. The highest consumption of meat was found in the youngest age group (18–29 years), and this group also reported the highest intake of total discretionary drink and of energy drink, and the youngest and the medium age group reported a higher intake of light or sugar free beverages than the group +45 years of age. The intake of “cake, biscuits, pie etc.” seems to increase with age. The national dietary survey in Norway found similar results with regard to higher meat and discretionary drink intake among younger adults than older; and among men a higher intake of cakes was observed in older adults compared to younger men (Myhre et al, 2024).
Looking at differences according to education level, adults and children of parents with higher levels of education reported higher intake of total fruits & vegetables and pulses compared to those having lower levels of education. Among adults the same was found for fruits, vegetables and fish. Additionally, looking at the Nordic Region, adults with high level of education compared to medium level (but not to adults with low level) reported lower intake of total meat, while adults with high level of education compared to both low and medium levels reported lower consumption of “veal, beef and lamb”. Total discretionary drink and sugary beverages were lower in the group with high level of education. As for adults, children of parents with low/medium education reported higher intake of discretionary drink than children having parents with high level of education, and the same pattern was observed for light/sugar free beverages.
Comparison to other results
The time trends observed for the different countries seem to overall align with results from other national dietary surveys in the respective countries conducted in almost the same time period (Myhre et al, 2024, Fagt et al, 2025, Gunnarsdottir et al, 2022).
The results of the data collection in 2024 are generally consistent with findings from other national dietary surveys in the Nordic countries. The Norwegian national dietary survey among adults (Myhre et al, 2024), supported the NORMO conclusion that whole-grain consumption remains insufficient. Similarly, national data confirm high discretionary food and drink intake, low pulse consumption, and stable or low fish intake relative to recommendations.
The observed country-specific differences—such as higher whole-grain intake in Norway, lower in Iceland, and higher discretionary consumption in Denmark and Iceland—correspond well with findings from national surveillance systems. Overall, NORMO provides a coherent regional perspective that complements and reinforces national results.
Strengths and limitations
A strength of the dietary assessment in 2024 is that it provides harmonized and comparable data across all five Nordic countries, allowing for consistent monitoring of dietary trends and demographic differences. The study’s design enables identification of both regional averages and country-specific deviations.
However, the frequency-based dietary assessment limits direct comparability to NNR2023 recommendations, which are expressed in grams or milliliters. Furthermore, the questions in the data collection in 2024 do not include the same food products as the food groups in NNR2023. For example, the survey captures whole-grain bread intake but not other sources of whole grains such as rice, pasta, or porridge. Similarly, the fish question was reworded in 2024, compromising comparability with 2014 data. Quantitative estimates are also affected by the lack of portion size information, and the limited and closed list of food items restricts detailed evaluation (e.g., processed vs. unprocessed meat, or sustainable vs. non-sustainable fish sources).
References
Blomhoff, R., Andersen, R., Arnesen, E.K., Christensen, J.J., Eneroth, H., Erkkola, M., Gudanaviciene, I., Halldorsson, T.I., Høyer-Lund, A., Lemming, E.W., Meltzer, H.M., Pitsi, T., Schwab, U., Siksna, I., Thorsdottir, I. and Trolle, E. Nordic Nutrition Recommendations 2023. Copenhagen: Nordic Council of Ministers, 2023.
Danish Veterinary and Food Administration. (2021). The official Danish dietary guidelines: Good for health and climate. Ministry of Food, Agriculture and Fisheries of Denmark. https://altomkost.dk/english/
Fagt, S. (2025). Unpublished results from the Danish National Survey of Diet and Physical Activity 2021–2024. National Food Institute, Technical University of Denmark.
Gunnarsdottir, S., Gudmannsdottir, R., Thorgeirsdottir, H., et al. (2022). The diet of Icelanders: National dietary survey 2019–2021 – Main findings and a comparison with a survey from 2010–2011. Directorate of Health & Unit for Nutrition Research, University of Iceland.
Myhre, J. B., Brodin, M. M. A., & Andersen, L. F. (2024). Norkost 4 [Nettdokument]. Helsedirektoratet. https://www.helsedirektoratet.no/rapporter/norkost-4