Overweight and Obesity
Background
Overweight and obesity are major public health concerns worldwide because of their association with non-communicable diseases such as cardiovascular diseases, type 2 diabetes and several cancers, as well as higher all-cause mortality (WHO 2000; Global BMI Mortality Collaboration 2016; NNR2023).
Analytical Notes
The prevalence and development of overweight or obesity (OW/OB) and obesity (OB) from 2014 to 2024 in the Nordic countries are presented for both adults and children. Adults were classified as having overweight if BMI was 25–30, and having obesity if BMI >30. Children were classified using age-specific cutoffs (Cole & Lobstein 2012).
Unless otherwise noted, all differences between specific groups (country, age, gender, education level) are statistically significant (p < 0.05), while comparisons to the Nordic average are qualitative.
Exact p-values can be found in the Appendix 5. For each analysis, all available observations with non-missing values for the specific variable being analyzed and the relevant grouping variable(s) were included. For variable-specific sample sizes, see Appendix 6. Exact values used in the figures are available in Appendix 7.
Background Analytical notes Key findings Results – Adults Results – Children Discussion References |
Background
Overweight and obesity are major public health concerns worldwide because of their association with non-communicable diseases such as cardiovascular diseases, type 2 diabetes and several cancers, as well as higher all-cause mortality (WHO 2000; Global BMI Mortality Collaboration 2016; NNR2023).
Analytical Notes
The prevalence and development of overweight or obesity (OW/OB) and obesity (OB) from 2014 to 2024 in the Nordic countries are presented for both adults and children. Adults were classified as having overweight if BMI was 25–30, and having obesity if BMI >30. Children were classified using age-specific cutoffs (Cole & Lobstein 2012).
Unless otherwise noted, all differences between specific groups (country, age, gender, education level) are statistically significant (p < 0.05), while comparisons to the Nordic average are qualitative.
Exact p-values can be found in the Appendix 5. For each analysis, all available observations with non-missing values for the specific variable being analyzed and the relevant grouping variable(s) were included. For variable-specific sample sizes, see Appendix 6. Exact values used in the figures are available in Appendix 7.
Key findings
Status 2024, adults
- In 2024, over half of adults in the Nordic Region had OW/OB, and one in five had OB.
- Iceland had the highest prevalence of adults having OW/OB (70%), while Denmark (47%) and Sweden (51%) reported the lowest levels.
- Mean BMI was above the overweight threshold for adults (≈26.5 kg/m²).
Status 2024, children
- In 2024, nearly one in five children had OW/OB, and about 4 % had OB.
- Iceland had the highest prevalence of children with OW/OB (26%), while Sweden (15%) and Norway (16%) reported the lowest levels.
- Mean BMI was above the overweight threshold ≈17.7 kg/m² for children.
Trends 2014–2024, adults
- Across the Nordic Region, OW/OB increased among adults (from 49 to 56%) between 2014 and 2024. The rise was most pronounced in Iceland (from 60 to 70%), Finland (from 48% to 61%), and Sweden (from 45 to 51%).
- OB rates increased in Sweden (from 10 to 15%), Finland (from 14 to 24%), and in Iceland from 21 to 28%)
- In the Nordic Region mean BMI increased from 25.6 to 26.5 kg/m².
- In the Nordic Region the proportion of OB rose from ≈15 % to ≈20 %.
Trends 2014–2024, children
- Across the Nordic Region, OW/OB increased among children (from 16 to 19%) between 2014 and 2024. The rise was most pronounced in Denmark (from 11 to 20%) Iceland (from 19 to 26%)
- OB rates increased only in Iceland (from 3 to 6%)
- BMI increased from 17.1 to 17.7 kg/m² in the Nordic Region.
Demographic patterns, adults
Gender
- In the Nordic Region OW/OB were more common among men (62%) than women (49%).
- The biggest difference between men and women was in Sweden (61/40%), whereas smallest difference was in Iceland (73/66%)
- OB prevalence alone did not differ by gender in the Nordic Region.
Age
- The prevalence of adults with OW/OB in the Nordic region increased with age, with 45-65 year olds showing the highest rates compared to younger age groups (18–29 and 30–44) in the Nordic Region (65% vs 41 and 56%) and in all the countries.
Education
- Marked social disparities persisted. Adults with lowest levels of education had substantially higher rates of OW/OB than those in the high education group in the Nordic Region (66%/48%).
- The proportion of individuals with OW/OB was highest among Icelanders with low levels of education (84%), whereas among those with high levels of education, the proportion was 57%.
- In Denmark, the proportion of individuals with OW/OB with low levels of education was the lowest (51%)
Demographic patterns, children
Gender
- In the Nordic Region OW/OB were more common among boys (22%) than girls (17%).
- Among boys and girls there was a gender difference only in Iceland (30/21%)
- OB prevalence alone did not differ by gender in the Nordic Region.
Parental education
- Children of parents with low/medium levels of education had substantially higher rates of OW/OB than those in the high education group in the Nordic Region (24/16%).
- In Denmark, the difference in OW/OB between children of parents with high levels of education (13%) and low/medium levels of education (29%) was the most pronounced.
Results – Adults
Status 2024
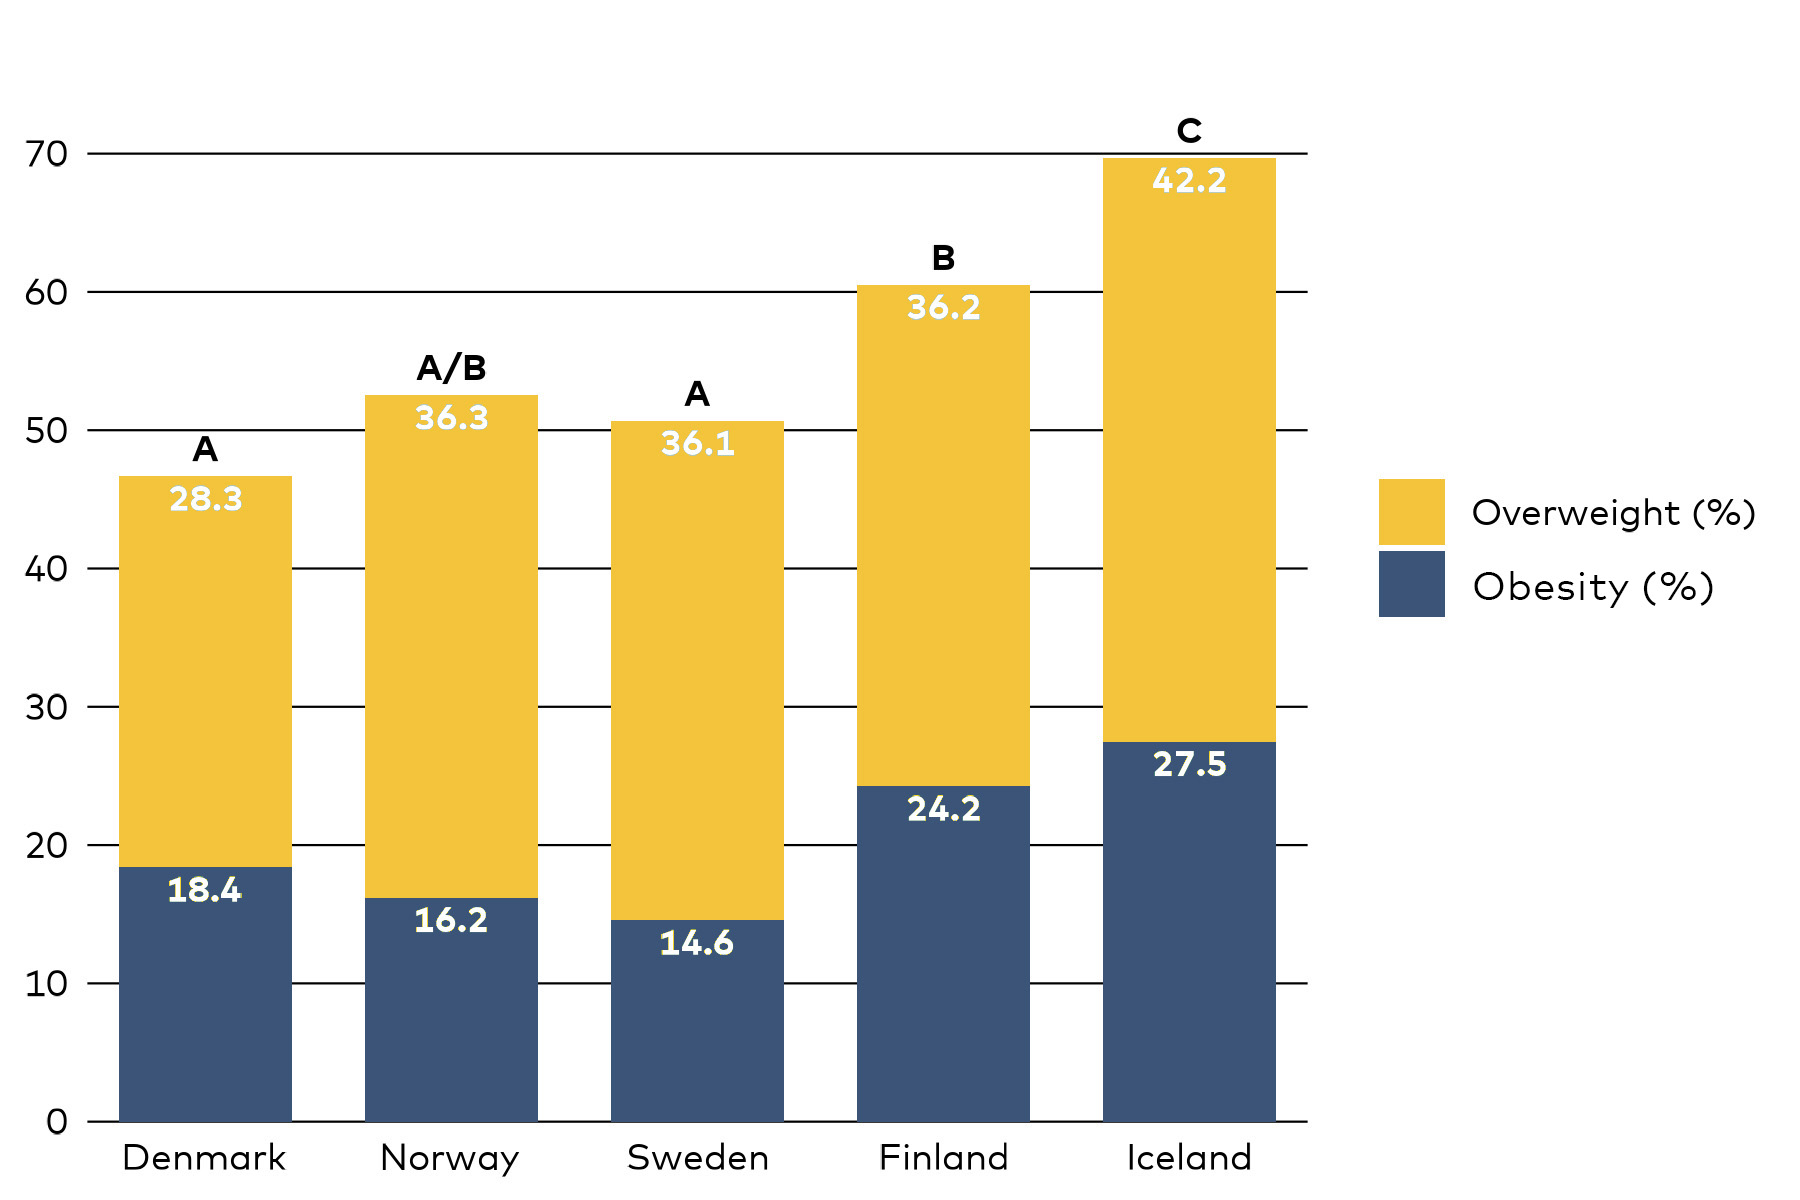
In 2024, the mean BMI among adults in the Nordic Region was 26.5 kg/m², which is above the cut-off point for overweight. Overall, 56% of adults were classified as having overweight or obesity, and one in five had obesity.
The prevalence of OW/OB was highest in Iceland (69.7%) compared with 46.7 – 60.5% in the other Nordic countries. The prevalence of OB alone was also higher in Iceland (27.5%) than in Norway (16.2%), Denmark (18.4%), and Sweden (14.6%).
Trends 2014–2024
In Sweden, Finland, Iceland, and in the Nordic Region, the prevalence of OW/OB increased significantly between 2014 and 2024. For example, in Iceland, the rate rose from 59.6% to 69.7%, and in Finland from 48.1% to 60.5%. In the Nordic Region the prevalence increased from 49.4% to 56.0%.
OB prevalence also showed significant increases in the same countries and Nordic Region. In Sweden, obesity rose from 10.1% to 14.6%; in Finland, from 14.0% to 24.2%; and in Iceland, from 21.0% to 27.5%. Across the Nordic Region, obesity increased from 14.7% to 20.2%.
Mean BMI values increased significantly in Denmark, Sweden, Finland, Iceland, and at the Nordic level. For instance, in Denmark, BMI rose from 25.5 kg/m² to 26.1 kg/m², and in Iceland from 26.7 kg/m² to 27.8 kg/m². Regionally, the average BMI increased from 25.6 kg/m² to 26.5 kg/m².

Results – Adults
Status 2024
In 2024, the mean BMI among adults in the Nordic Region was 26.5 kg/m², which is above the cut-off point for overweight. Overall, 56% of adults were classified as having overweight or obesity, and one in five had obesity.
The prevalence of OW/OB was highest in Iceland (69.7%) compared with 46.7 – 60.5% in the other Nordic countries. The prevalence of OB alone was also higher in Iceland (27.5%) than in Norway (16.2%), Denmark (18.4%), and Sweden (14.6%).
Trends 2014–2024
In Sweden, Finland, Iceland, and in the Nordic Region, the prevalence of OW/OB increased significantly between 2014 and 2024. For example, in Iceland, the rate rose from 59.6% to 69.7%, and in Finland from 48.1% to 60.5%. In the Nordic Region the prevalence increased from 49.4% to 56.0%.
OB prevalence also showed significant increases in the same countries and Nordic Region. In Sweden, obesity rose from 10.1% to 14.6%; in Finland, from 14.0% to 24.2%; and in Iceland, from 21.0% to 27.5%. Across the Nordic Region, obesity increased from 14.7% to 20.2%.
Mean BMI values increased significantly in Denmark, Sweden, Finland, Iceland, and at the Nordic level. For instance, in Denmark, BMI rose from 25.5 kg/m² to 26.1 kg/m², and in Iceland from 26.7 kg/m² to 27.8 kg/m². Regionally, the average BMI increased from 25.6 kg/m² to 26.5 kg/m².
N | 2008 | 1004 |
|---|---|---|
Overweight or obesity (BMI ≥ 25) (%) | 47.3 (44.6; 50.0) | 46.7 (42.8; 50.6) |
Obesity (BMI > 30) (%) | 14.8 (12.8; 16.9) | 18.4 (15.2; 21.6) |
Body Mass Index (kg/m2) | 25.5 (25.2; 25.7) * | 26.1 (25.6; 26.6) * |
* indicates statistically significant difference (p < 0.05) between survey years within a country or region.
N refers to the number of participants in that survey year in that country or region. See for
variable-specific sample sizes.
N | 1057 | 1010 |
|---|---|---|
Overweight or Obesity (BMI ≥ 25) (%) | 47.5 (42.7; 52.3) | 52.5 (48.3; 56.8) |
Obesity (BMI > 30) (%) | 13.3 (10.1; 16.6) | 16.2 (12.6; 19.7) |
Body Mass Index (kg/m2) | 25.5 (25.0; 26.0) | 25.8 (25.4; 26.2) |
* indicates statistically significant difference (p < 0.05) between survey years within a country or region.
N refers to the number of participants in that survey year in that country or region. See Appendix 6 for variable-specific sample sizes.
N refers to the number of participants in that survey year in that country or region. See Appendix 6 for variable-specific sample sizes.
N | 1801 | 999 |
|---|---|---|
Overweight or Obesity (BMI ≥ 25) (%) | 44.8 (41.7; 47.8) * | 50.7 (46.5; 54.8) * |
Obesity (BMI > 30) (%) | 10.1 (8.3; 11.8) * | 14.6 (11.6; 17.5) * |
Body Mass Index (kg/m2) | 24.9 (24.7; 25.2) * | 25.8 (25.3; 26.2) * |
* indicates statistically significant difference (p < 0.05) between survey years within a country or region.
N refers to the number of participants in that survey year in that country or region. See Appendix 6 for variable-specific sample sizes.
N refers to the number of participants in that survey year in that country or region. See Appendix 6 for variable-specific sample sizes.
N | 1717 | 1020 |
|---|---|---|
Overweight or Obesity (BMI ≥ 25) (%) | 48.1 (45.3; 50.9) * | 60.5 (56.1; 64.8) * |
Obesity (BMI > 30) (%) | 14.0 (12.1; 15.9) * | 24.2 (20.4; 28.1) * |
Body Mass Index (kg/m2) | 25.5 (25.3; 25.8) * | 27.0 (26.6; 27.5) * |
* indicates statistically significant difference (p < 0.05) between survey years within a country or region.
N refers to the number of participants in that survey year in that country or region. See Appendix 6 for variable-specific sample sizes.
N refers to the number of participants in that survey year in that country or region. See Appendix 6 for variable-specific sample sizes.
N | 2012 | 1021 |
|---|---|---|
Overweight or Obesity (BMI ≥ 25) (%) | 59.6 (56.9; 62.3) * | 69.7 (65.8; 73.5) * |
Obesity (BMI > 30) (%) | 21.0 (18.9; 23.2) * | 27.5 (23.7; 31.3) * |
Body Mass Index (kg/m2) | 26.7 (26.4; 27.0) * | 27.8 (27.3; 28.2) * |
* indicates statistically significant difference (p < 0.05) between survey years within a country or region.
N refers to the number of participants in that survey year in that country or region. See Appendix 6 for variable-specific sample sizes.
N refers to the number of participants in that survey year in that country or region. See Appendix 6 for variable-specific sample sizes.
N | 8595 | 5054 |
|---|---|---|
Overweight or Obesity (BMI ≥ 25) (%) | 49.4 (48.0; 50.9) * | 56.0 (54.1; 57.9) * |
Obesity (BMI > 30) (%) | 14.7 (13.6; 15.7) * | 20.2 (18.6; 21.7) * |
Body Mass Index (kg/m2) | 25.6 (25.5; 25.8) * | 26.5 (26.3; 26.7) * |
* indicates statistically significant difference (p < 0.05) between survey years within a country or region.
N refers to the number of participants in that survey year in that country or region. See Appendix 6 for variable-specific sample sizes.
N refers to the number of participants in that survey year in that country or region. See Appendix 6 for variable-specific sample sizes.
Demographic Differences
Gender
Across all five Nordic countries and the region as a whole, men had a significantly higher prevalence of OW/OB compared to women. In Denmark, 52.3% of men had OW/OB, compared to 40.8% of women (Table 9.4.3). In Norway, the figures were 60.2% for men and 44.4% for women. In Sweden, 60.6% of men OW/OB, while the rate among women was 39.8%. In Finland, the prevalence was 64.8% for men and 55.1% for women. In Iceland, the difference was again notable, with 73.3% of men and 65.6% of women affected. At the Nordic regional level, the pattern was consistent: 62.3% of men had OW/OB, compared to 48.9% of women.
Mean BMI values also showed significant gender differences in several countries and at the regional level. In Denmark, Norway, and Sweden, men had significantly higher BMI than women. Regionally, the average BMI was 27.0 kg/m² for men and 25.9 kg/m² for women.
N | 482 | 522 |
|---|---|---|
Overweight or Obesity (BMI ≥ 25) (%) | 52.3 (46.5; 58.1) * | 40.8 (35.6; 46.0) * |
Obesity (BMI > 30) (%) | 20.1 (15.3; 24.9) | 16.6 (12.4; 20.8) |
Body Mass Index (kg/m2) | 26.7 (25.9; 27.5) * | 25.5 (24.9; 26.1) * |
* indicates statistically significant difference (p < 0.05) between genders within a country or region.
N refers to the number of participants with that gender in that country or region. See Appendix 6 for variable-specific sample sizes.
N refers to the number of participants with that gender in that country or region. See Appendix 6 for variable-specific sample sizes.
N | 499 | 511 |
|---|---|---|
Overweight or Obesity (BMI ≥ 25) (%) | 60.2 (54.4; 66.0) * | 44.4 (38.3; 50.6) * |
Obesity (BMI > 30) (%) | 17.1 (12.2; 22.1) | 15.2 (10.1; 20.3) |
Body Mass Index (kg/m2) | 26.5 (26.0; 27.0) * | 25.0 (24.4; 25.7) * |
* indicates statistically significant difference (p < 0.05) between genders within a country or region.
N refers to the number of participants with that gender in that country or region. See Appendix 6 for variable-specific sample sizes.
N refers to the number of participants with that gender in that country or region. See Appendix 6 for variable-specific sample sizes.
N | 463 | 536 |
|---|---|---|
Overweight or Obesity (BMI ≥ 25) (%) | 60.6 (54.6; 66.6) * | 39.8 (34.3; 45.3) * |
Obesity (BMI > 30) (%) | 16.0 (11.6; 20.5) | 12.9 (9.2; 16.7) |
Body Mass Index (kg/m2) | 26.6 (26.0; 27.3) * | 24.9 (24.3; 25.4) * |
* indicates statistically significant difference (p < 0.05) between genders within a country or region.
N refers to the number of participants with that gender in that country or region. See Appendix 6 for variable-specific sample sizes.
N refers to the number of participants with that gender in that country or region. See Appendix 6 for variable-specific sample sizes.
N | 480 | 540 |
|---|---|---|
Overweight or Obesity (BMI ≥ 25) (%) | 64.8 (58.7; 70.8) * | 55.1 (48.9; 61.2) * |
Obesity (BMI > 30) (%) | 23.9 (18.5; 29.3) | 24.7 (19.3; 30.1) |
Body Mass Index (kg/m2) | 27.3 (26.7; 27.9) | 26.7 (26.0; 27.4) |
* indicates statistically significant difference (p < 0.05) between genders within a country or region.
N refers to the number of participants with that gender in that country or region. See Appendix 6 for variable-specific sample sizes.
N refers to the number of participants with that gender in that country or region. See Appendix 6 for variable-specific sample sizes.
N | 439 | 582 |
|---|---|---|
Overweight or Obesity (BMI ≥ 25) (%) | 73.3 (67.9; 78.6) * | 65.6 (60.2; 71.0) * |
Obesity (BMI > 30) (%) | 25.8 (20.6; 31.0) | 29.4 (24.0; 34.9) |
Body Mass Index (kg/m2) | 27.8 (27.2; 28.4) | 27.7 (27.1; 28.3) |
* indicates statistically significant difference (p < 0.05) between genders within a country or region.
N refers to the number of participants with that gender in that country or region. See Appendix 6 for variable-specific sample sizes.
N refers to the number of participants with that gender in that country or region. See Appendix 6 for variable-specific sample sizes.
N | 2363 | 2691 |
|---|---|---|
Overweight or Obesity (BMI ≥ 25) (%) | 62.3 (59.7; 65.0) * | 48.9 (46.3; 51.5) * |
Obesity (BMI > 30) (%) | 20.7 (18.4; 22.9) | 19.6 (17.4; 21.8) |
Body Mass Index (kg/m2) | 27.0 (26.7; 27.3) * | 25.9 (25.7; 26.2) * |
* indicates statistically significant difference (p < 0.05) between genders within a country or region.
N refers to the number of participants with that gender in that country or region. See Appendix 6 for variable-specific sample sizes.
N refers to the number of participants with that gender in that country or region. See Appendix 6 for variable-specific sample sizes.
Age
Differences in OW/OB, OB, and BMI were observed across age groups in all Nordic countries and at the regional level. These differences consistently showed that older adults had higher prevalence rates and higher average BMI values compared to younger adults.
In Denmark, the prevalence of OW/OB was significantly lower among adults aged 18–29 years (27.8%) compared to those aged 30–44 years (48.0%) and 45-65 years (56.5%). Similar patterns were observed in Norway, Sweden, Finland, and Iceland. For example, in Iceland, 55.7% of adults aged 18–29 years had OW/OB, compared to 71.9% in the 30–44 age group and 77.1% among those aged 45-65 years. At the Nordic regional level, the prevalence increased from 40.7% in the youngest age group to 55.7% in the middle group and 64.5% in the oldest group.
OB prevalence followed a similar trend. In Denmark, 11.3% of adults aged 18–29 years had obesity, compared to 20.3% in the 30–44 age group and 21.2% among those aged 45-65 years. In Finland, OB increased from 14.7% in the 18–29 year olds to 24.0% in the 45-65 year olds.
Mean BMI values also increased significantly with age. In Denmark, the average BMI rose from 24.1 kg/m² among adults aged 18–29 years to 26.9 kg/m² in the 30–44 age group and 26.8 kg/m² among those aged 45-65 years. Similar increases were observed in other countries, except Sweden and Iceland. At the Nordic level, BMI increased from 25.2 kg/m² in the youngest age group to 26.5 kg/m² in the 30–44 age group and 27.3 kg/m² among those aged 45-65 years.
N | 115 | 248 | 641 |
|---|---|---|---|
Overweight or Obesity (BMI ≥ 25) (%) | 27.8 (19.2; 36.4) [b] | 48.0 (41.1; 54.9) [a] | 56.5 (51.6; 61.4) [a] |
Obesity (BMI > 30) (%) | 11.3 (4.7; 17.8) [b] | 20.3 (14.3; 26.2) [ab] | 21.2 (16.6; 25.7) [a] |
Body Mass Index (kg/m2) | 24.1 (23.1; 25.0) [b] | 26.9 (25.6; 28.1) [a] | 26.8 (26.3; 27.3) [a] |
Different letters (a, b, c) indicate statistically significant difference (p < 0.05) between age groups within a country or region after a statistically significant global test (p < 0.05).
No Letters (a, b, c) indicate no statistically significant difference (p >= 0.05) between age groups within a country or region and/or no statistically significant global test (p >= 0.05).
N refers to the number of participants with the age group in that country or region. See Appendix 6 for variable-specific sample sizes.
N | 121 | 245 | 644 |
|---|---|---|---|
Overweight or Obesity (BMI ≥ 25) (%) | 38.9 (28.5; 49.4) [b] | 45.8 (38.8; 52.8) [b] | 61.9 (56.3; 67.6) [a] |
Obesity (BMI > 30) (%) | 13.7 (5.0; 22.4) [ab] | 11.4 (7.3; 15.5) [b] | 20.0 (14.5; 25.5) [a] |
Body Mass Index (kg/m2) | 24.9 (23.9; 25.9) [b] | 25.2 (24.6; 25.7) [b] | 26.5 (26.0; 27.1) [a] |
Different letters (a, b, c) indicate statistically significant difference (p < 0.05) between age groups within a country or region after a statistically significant global test (p < 0.05).
No Letters (a, b, c) indicate no statistically significant difference (p >= 0.05) between age groups within a country or region and/or no statistically significant global test (p >= 0.05).
N refers to the number of participants with the age group in that country or region. See Appendix 6 for variable-specific sample sizes.
No Letters (a, b, c) indicate no statistically significant difference (p >= 0.05) between age groups within a country or region and/or no statistically significant global test (p >= 0.05).
N refers to the number of participants with the age group in that country or region. See Appendix 6 for variable-specific sample sizes.
N | 78 | 335 | 586 |
|---|---|---|---|
Overweight or Obesity (BMI ≥ 25) (%) | 37.7 (26.5; 48.9) [b] | 47.2 (41.3; 53.1) [b] | 60.8 (55.6; 66.0) [a] |
Obesity (BMI > 30) (%) | 11.1 (4.2; 18.0) | 12.6 (8.5; 16.7) | 18.1 (13.4; 22.8) |
Body Mass Index (kg/m2) | 24.7 (23.4; 26.1) [b] | 25.3 (24.8; 25.8) [b] | 26.8 (26.2; 27.3) [a] |
Different letters (a, b, c) indicate statistically significant difference (p < 0.05) between age groups within a country or region after a statistically significant global test (p < 0.05).
No Letters (a, b, c) indicate no statistically significant difference (p >= 0.05) between age groups within a country or region and/or no statistically significant global test (p >= 0.05).
N refers to the number of participants with the age group in that country or region. See Appendix 6 for variable-specific sample sizes.
No Letters (a, b, c) indicate no statistically significant difference (p >= 0.05) between age groups within a country or region and/or no statistically significant global test (p >= 0.05).
N refers to the number of participants with the age group in that country or region. See Appendix 6 for variable-specific sample sizes.
N | 71 | 248 | 701 |
|---|---|---|---|
Overweight or Obesity (BMI ≥ 25) (%) | 42.7 (30.6; 54.9) [b] | 62.1 (55.9; 68.2) [a] | 68.2 (62.3; 74.0) [a] |
Obesity (BMI > 30) (%) | 12.7 (4.9; 20.5) [b] | 19.9 (14.7; 25.0) [b] | 34.1 (27.7; 40.4) [a] |
Body Mass Index (kg/m2) | 25.5 (24.3; 26.7) [b] | 26.7 (26.1; 27.3) [b] | 28.2 (27.5; 28.8) [a] |
Different letters (a, b, c) indicate statistically significant difference (p < 0.05) between age groups within a country or region after a statistically significant global test (p < 0.05).
No Letters (a, b, c) indicate no statistically significant difference (p >= 0.05) between age groups within a country or region and/or no statistically significant global test (p >= 0.05).
N refers to the number of participants with the age group in that country or region. See Appendix 6 for variable-specific sample sizes.
No Letters (a, b, c) indicate no statistically significant difference (p >= 0.05) between age groups within a country or region and/or no statistically significant global test (p >= 0.05).
N refers to the number of participants with the age group in that country or region. See Appendix 6 for variable-specific sample sizes.
N | 86 | 307 | 628 |
|---|---|---|---|
Overweight or Obesity (BMI ≥ 25) (%) | 55.7 (44.7; 66.7) [b] | 71.9 (66.7; 77.1) [a] | 77.1 (73.0; 81.2) [a] |
Obesity (BMI > 30) (%) | 23.9 (14.0; 33.9) | 29.3 (23.6; 35.0) | 28.2 (23.3; 33.1) |
Body Mass Index (kg/m2) | 26.6 (25.4; 27.7) [b] | 28.1 (27.4; 28.7) [ab] | 28.3 (27.8; 28.8) [a] |
Different letters (a, b, c) indicate statistically significant difference (p < 0.05) between age groups within a country or region after a statistically significant global test (p < 0.05).
No Letters (a, b, c) indicate no statistically significant difference (p >= 0.05) between age groups within a country or region and/or no statistically significant global test (p >= 0.05).
N refers to the number of participants with the age group in that country or region. See Appendix 6 for variable-specific sample sizes.
No Letters (a, b, c) indicate no statistically significant difference (p >= 0.05) between age groups within a country or region and/or no statistically significant global test (p >= 0.05).
N refers to the number of participants with the age group in that country or region. See Appendix 6 for variable-specific sample sizes.
N | 471 | 1383 | 3200 |
|---|---|---|---|
Overweight or Obesity (BMI ≥ 25) (%) | 40.7 (35.8; 45.6) [b] | 55.7 (52.8; 58.6) [c] | 64.5 (62.1; 66.8) [a] |
Obesity (BMI > 30) (%) | 14.7 (11.0; 18.4) [b] | 19.0 (16.6; 21.3) [b] | 24.0 (21.6; 26.4) [a] |
Body Mass Index (kg/m2) | 25.2 (24.7; 25.7) [b] | 26.5 (26.1; 26.8) [c] | 27.3 (27.0; 27.5) [a] |
Different letters (a, b, c) indicate statistically significant difference (p < 0.05) between age groups within a country or region after a statistically significant global test (p < 0.05).
No Letters (a, b, c) indicate no statistically significant difference (p >= 0.05) between age groups within a country or region and/or no statistically significant global test (p >= 0.05).
N refers to the number of participants with the age group in that country or region. See Appendix 6 for variable-specific sample sizes.
No Letters (a, b, c) indicate no statistically significant difference (p >= 0.05) between age groups within a country or region and/or no statistically significant global test (p >= 0.05).
N refers to the number of participants with the age group in that country or region. See Appendix 6 for variable-specific sample sizes.
Education
Differences in OW/OB, OB, and BMI were observed across education levels in all Nordic countries and at the regional level. These differences consistently showed that individuals with lower levels of education had higher prevalence rates of OW/OB, as well as higher average BMI values, compared to those with higher education.
In Denmark, Norway, and Iceland, all indicators—OW/OB prevalence, OB prevalence, and mean BMI—were significantly higher among adults with low education compared to those with high education. For example, in Iceland, 84.0% of adults with low education had OW/OB, compared to 57.0% among those with high education. OB prevalence was 38.4% versus 14.3%, and mean BMI was 29.2 kg/m² versus 26.2 kg/m².
At the Nordic regional level, the pattern was consistent and statistically significant: 66.3% of adults with low education had OW/OB, compared to 48.2% among those with high education. OB prevalence was 32.9% versus 12.2%, and mean BMI was 27.9 kg/m² versus 25.5 kg/m².
No education-related differences were observed for OW/OB in Finland or for obesity in Sweden (Table 9.4.5).
N | 55 | 367 | 578 |
|---|---|---|---|
Overweight or Obesity (BMI ≥ 25) (%) | 50.7 (36.6; 64.7) [ab] | 51.8 (46.0; 57.5) [b] | 41.0 (36.5; 45.6) [a] |
Obesity (BMI > 30) (%) | 32.8 (19.7; 45.8) [b] | 19.6 (15.1; 24.0) [b] | 11.5 (8.8; 14.3) [a] |
Body Mass Index (kg/m2) | 28.4 (26.1; 30.7) [b] | 26.3 (25.7; 26.9) [b] | 25.1 (24.7; 25.6) [a] |
Different letters (a, b, c) indicate statistically significant difference (p < 0.05) between education levels within a country or region after a statistically significant global test (p < 0.05).
No Letters (a, b, c) indicate no statistically significant difference (p >= 0.05) between education levels within a country or region and/or no statistically significant global test (p >= 0.05).
N refers to the number of participants with the education level in that country or region. See Appendix 6 for variable-specific sample sizes.
N | 31 | 338 | 637 |
|---|---|---|---|
Overweight or Obesity (BMI ≥ 25) (%) | 58.6 (40.8; 76.4) [ab] | 57.9 (52.2; 63.5) [b] | 44.5 (40.1; 48.9) [a] |
Obesity (BMI > 30) (%) | 26.7 (10.8; 42.5) [ab] | 17.2 (12.9; 21.4) [b] | 9.8 (7.2; 12.3) [a] |
Body Mass Index (kg/m2) | 26.3 (24.6; 28.1) [ab] | 26.2 (25.7; 26.7) [b] | 25.1 (24.8; 25.5) [a] |
Different letters (a, b, c) indicate statistically significant difference (p < 0.05) between education levels within a country or region after a statistically significant global test (p < 0.05).
No Letters (a, b, c) indicate no statistically significant difference (p >= 0.05) between education levels within a country or region and/or no statistically significant global test (p >= 0.05).
N refers to the number of participants with the education level in that country or region. See Appendix 6 for variable-specific sample sizes.
No Letters (a, b, c) indicate no statistically significant difference (p >= 0.05) between education levels within a country or region and/or no statistically significant global test (p >= 0.05).
N refers to the number of participants with the education level in that country or region. See Appendix 6 for variable-specific sample sizes.
N | 32 | 377 | 585 |
|---|---|---|---|
Overweight or Obesity (BMI ≥ 25) (%) | 63.1 (45.1; 81.1) [ab] | 54.9 (48.8; 61.0) [b] | 44.2 (39.3; 49.1) [a] |
Obesity (BMI > 30) (%) | 21.5 (7.1; 35.9) | 16.3 (12.1; 20.5) | 11.5 (8.2; 14.8) |
Body Mass Index (kg/m2) | 26.7 (24.7; 28.7) [ab] | 26.3 (25.6; 27.0) [b] | 25.1 (24.6; 25.5) [a] |
Different letters (a, b, c) indicate statistically significant difference (p < 0.05) between education levels within a country or region after a statistically significant global test (p < 0.05).
No Letters (a, b, c) indicate no statistically significant difference (p >= 0.05) between education levels within a country or region and/or no statistically significant global test (p >= 0.05).
N refers to the number of participants with the education level in that country or region. See Appendix 6 for variable-specific sample sizes.
No Letters (a, b, c) indicate no statistically significant difference (p >= 0.05) between education levels within a country or region and/or no statistically significant global test (p >= 0.05).
N refers to the number of participants with the education level in that country or region. See Appendix 6 for variable-specific sample sizes.
N | 34 | 434 | 550 |
|---|---|---|---|
Overweight or Obesity (BMI ≥ 25) (%) | 65.3 (48.5; 82.0) | 63.2 (57.3; 69.1) | 55.8 (49.9; 61.7) |
Obesity (BMI > 30) (%) | 39.9 (23.2; 56.7) [b] | 27.1 (22.1; 32.2) [b] | 14.4 (10.4; 18.4) [a] |
Body Mass Index (kg/m2) | 28.1 (26.5; 29.7) [b] | 27.6 (26.9; 28.3) [b] | 26.0 (25.5; 26.5) [a] |
Different letters (a, b, c) indicate statistically significant difference (p < 0.05) between education levels within a country or region after a statistically significant global test (p < 0.05).
No Letters (a, b, c) indicate no statistically significant difference (p >= 0.05) between education levels within a country or region and/or no statistically significant global test (p >= 0.05).
N refers to the number of participants with the education level in that country or region. See Appendix 6 for variable-specific sample sizes.
No Letters (a, b, c) indicate no statistically significant difference (p >= 0.05) between education levels within a country or region and/or no statistically significant global test (p >= 0.05).
N refers to the number of participants with the education level in that country or region. See Appendix 6 for variable-specific sample sizes.
N | 118 | 313 | 585 |
|---|---|---|---|
Overweight or Obesity (BMI ≥ 25) (%) | 84.0 (76.0; 91.9) [b] | 72.1 (66.0; 78.1) [b] | 57.0 (51.2; 62.7) [a] |
Obesity (BMI > 30) (%) | 38.4 (28.5; 48.3) [b] | 32.6 (26.6; 38.7) [b] | 14.3 (10.8; 17.9) [a] |
Body Mass Index (kg/m2) | 29.2 (28.1; 30.2) [b] | 28.4 (27.6; 29.1) [b] | 26.2 (25.8; 26.7) [a] |
Different letters (a, b, c) indicate statistically significant difference (p < 0.05) between education levels within a country or region after a statistically significant global test (p < 0.05).
No Letters (a, b, c) indicate no statistically significant difference (p >= 0.05) between education levels within a country or region and/or no statistically significant global test (p >= 0.05).
N refers to the number of participants with the education level in that country or region. See Appendix 6 for variable-specific sample sizes.
No Letters (a, b, c) indicate no statistically significant difference (p >= 0.05) between education levels within a country or region and/or no statistically significant global test (p >= 0.05).
N refers to the number of participants with the education level in that country or region. See Appendix 6 for variable-specific sample sizes.
N | 270 | 1829 | 2935 |
|---|---|---|---|
Overweight or Obesity (BMI ≥ 25) (%) | 66.3 (59.8; 72.8) [b] | 59.8 (57.1; 62.5) [b] | 48.2 (45.9; 50.4) [a] |
Obesity (BMI > 30) (%) | 32.9 (26.8; 39.0) [b] | 22.5 (20.3; 24.7) [c] | 12.2 (10.7; 13.7) [a] |
Body Mass Index (kg/m2) | 27.9 (27.2; 28.7) [b] | 26.9 (26.6; 27.2) [c] | 25.5 (25.3; 25.7) [a] |
Different letters (a, b, c) indicate statistically significant difference (p < 0.05) between education levels within a country or region after a statistically significant global test (p < 0.05).
No Letters (a, b, c) indicate no statistically significant difference (p >= 0.05) between education levels within a country or region and/or no statistically significant global test (p >= 0.05).
N refers to the number of participants with the education level in that country or region. See Appendix 6 for variable-specific sample sizes.
No Letters (a, b, c) indicate no statistically significant difference (p >= 0.05) between education levels within a country or region and/or no statistically significant global test (p >= 0.05).
N refers to the number of participants with the education level in that country or region. See Appendix 6 for variable-specific sample sizes.
Results – Children
Status 2024
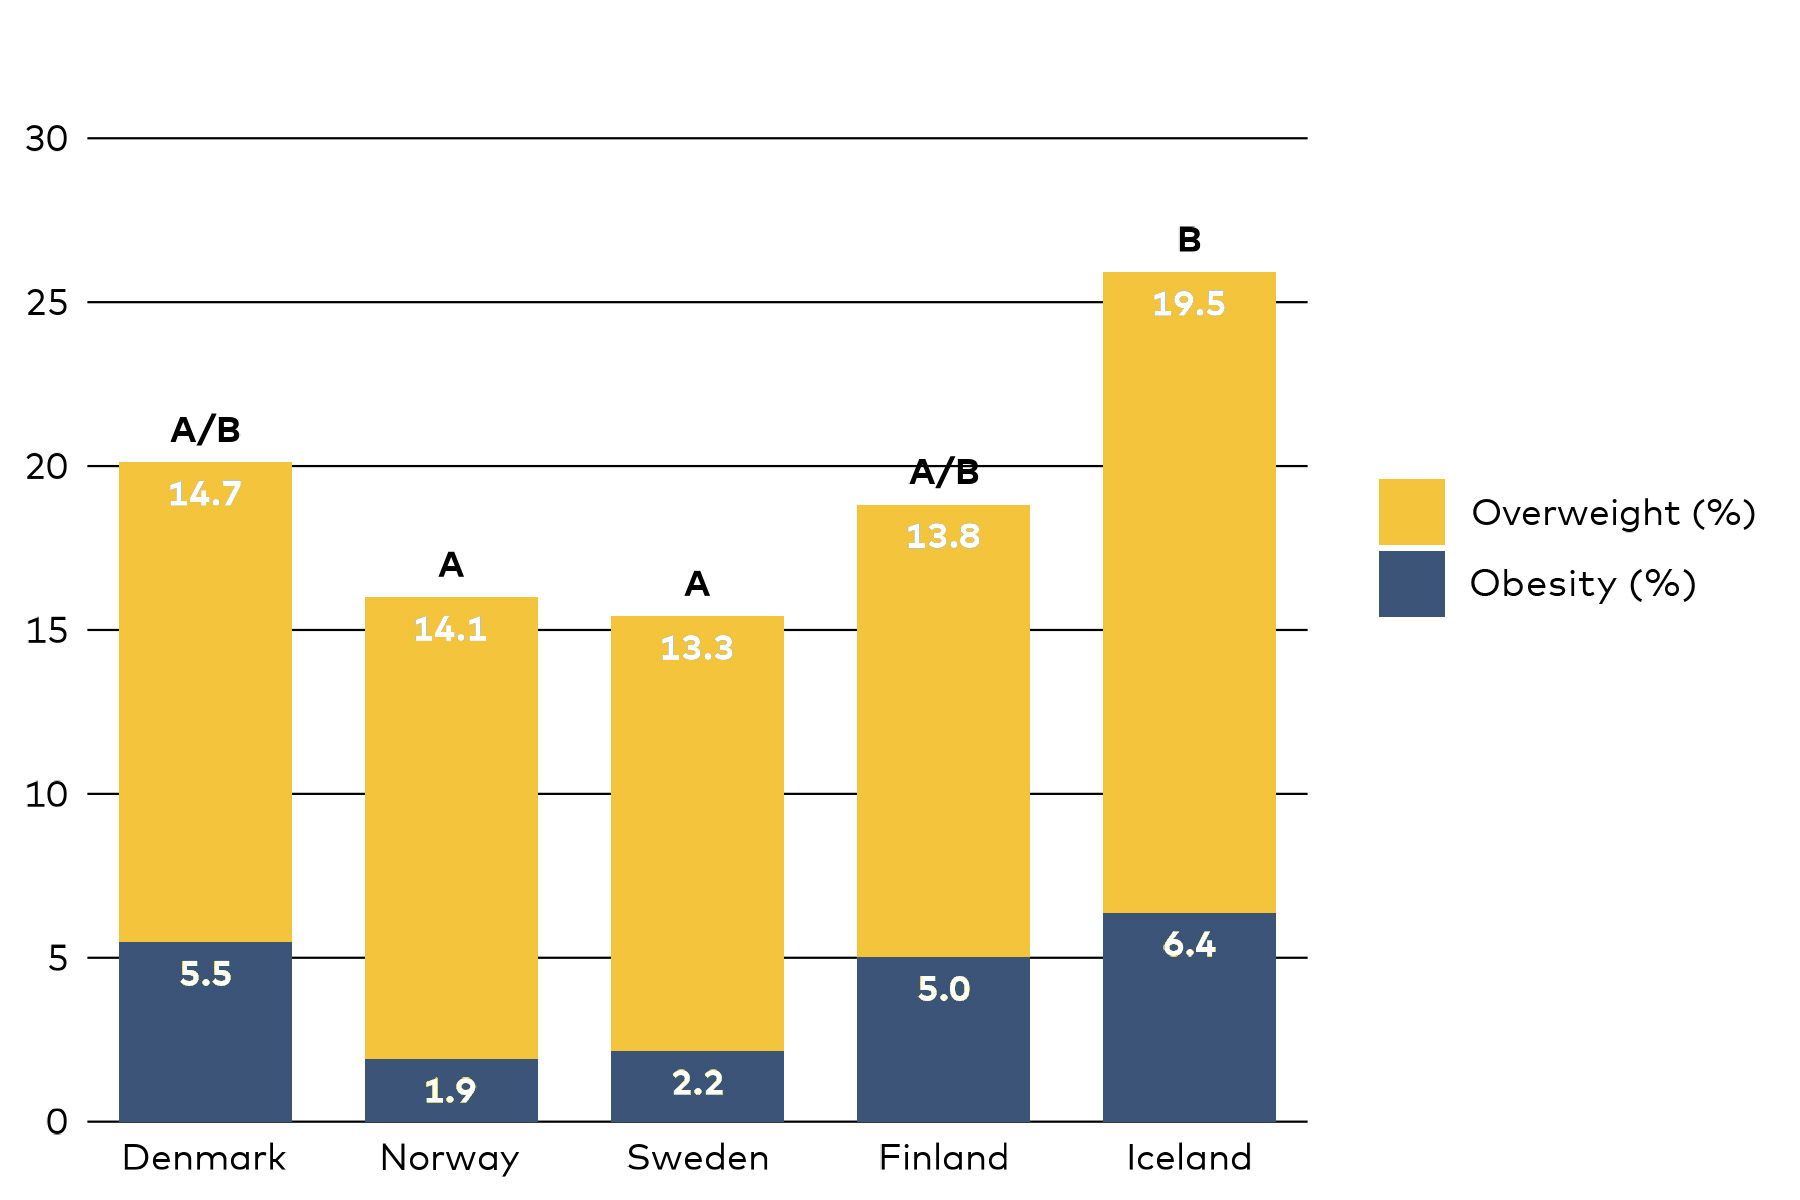
In 2024, the mean BMI among children in the Nordic Region was 17.7 kg/m². Overall, nearly one in five children had OW/OB, and 4.2% had OB.
The prevalence of OW/OB was highest in Iceland (25.9%) compared with Norway (16.0%) and Sweden (15.4%). Similarly, the prevalence of OB was higher in Iceland (6.4%) than in Norway (1.9%).
Trends 2014–2024
Between 2014 and 2024, both mean BMI and the prevalence of OW/OB increased among children in the Nordic Region, rising from 17.1 to 17.7 kg/m² and from 15.5% to 19.3%, respectively. The prevalence of OB also increased—from 3.0% to 4.2%—although this change was not statistically significant.
At the country level, mean BMI increased in Denmark (from 16.9 to 17.5 kg/m²), Finland (from 17.2 to 17.8 kg/m²), and Iceland (from 17.4 to 18.2 kg/m²). The prevalence of OW/OB also rose in Denmark (from 11.4% to 20.1%) and Iceland (from 19.0% to 25.9%). In addition, the prevalence of OB increased in Finland (from 2.3% to 5.0%) and Iceland (from 2.9% to 6.4%).
Results – Children
Status 2024
In 2024, the mean BMI among children in the Nordic Region was 17.7 kg/m². Overall, nearly one in five children had OW/OB, and 4.2% had OB.
The prevalence of OW/OB was highest in Iceland (25.9%) compared with Norway (16.0%) and Sweden (15.4%). Similarly, the prevalence of OB was higher in Iceland (6.4%) than in Norway (1.9%).
Trends 2014–2024
Between 2014 and 2024, both mean BMI and the prevalence of OW/OB increased among children in the Nordic Region, rising from 17.1 to 17.7 kg/m² and from 15.5% to 19.3%, respectively. The prevalence of OB also increased—from 3.0% to 4.2%—although this change was not statistically significant.
At the country level, mean BMI increased in Denmark (from 16.9 to 17.5 kg/m²), Finland (from 17.2 to 17.8 kg/m²), and Iceland (from 17.4 to 18.2 kg/m²). The prevalence of OW/OB also rose in Denmark (from 11.4% to 20.1%) and Iceland (from 19.0% to 25.9%). In addition, the prevalence of OB increased in Finland (from 2.3% to 5.0%) and Iceland (from 2.9% to 6.4%).

N | 598 | 508 |
|---|---|---|
Overweight or Obesity (age-specific BMI cut-offs) (%) | 11.4 (8.0; 14.8) * | 20.1 (15.2; 25.1) * |
Obesity (age-specific BMI cut-offs) (%) | 3.9 (1.4; 6.3) | 5.5 (2.3; 8.7) |
Body Mass Index (kg/m2) | 16.9 (16.5; 17.3) * | 17.5 (17.1; 17.9) * |
* indicates statistically significant difference (p < 0.05) between survey years within a country or region.
N refers to the number of participants in that survey year in that country or region. See Appendix 6 for variable-specific sample sizes.
N refers to the number of participants in that survey year in that country or region. See Appendix 6 for variable-specific sample sizes.
N | 358 | 510 |
|---|---|---|
Overweight or Obesity | 16.0 (9.5; 22.5) | 16.0 (12.0; 20.0) |
Obesity (age-specific BMI cut-offs) (%) | 2.4 (0.4; 4.5) | 1.9 (0.4; 3.4) |
Body Mass Index (kg/m2) | 17.1 (16.5; 17.6) | 17.6 (17.3; 17.9) |
* indicates statistically significant difference (p < 0.05) between survey years within a country or region.
N refers to the number of participants in that survey year in that country or region. See Appendix 6 for variable-specific sample sizes.
N refers to the number of participants in that survey year in that country or region. See Appendix 6 for variable-specific sample sizes.
N | 500 | 505 |
|---|---|---|
Overweight or Obesity (age-specific BMI cut-offs) (%) | 16.2 (11.8; 20.6) | 15.4 (11.4; 19.4) |
Obesity (age-specific BMI cut-offs) (%) | 3.5 (1.0; 5.9) | 2.2 (0.3; 4.0) |
Body Mass Index (kg/m2) | 17.3 (16.9; 17.6) | 17.4 (17.1; 17.7) |
* indicates statistically significant difference (p < 0.05) between survey years within a country or region.
N refers to the number of participants in that survey year in that country or region. See Appendix 6 for variable-specific sample sizes.
N refers to the number of participants in that survey year in that country or region. See Appendix 6 for variable-specific sample sizes.
N | 500 | 503 |
|---|---|---|
Overweight or Obesity (age-specific BMI cut-offs) (%) | 15.6 (11.9; 19.3) * | 18.8 (14.9; 22.7) * |
Obesity (age-specific BMI cut-offs) (%) | 2.3 (0.8; 3.8) | 5.0 (2.8; 7.3) |
Body Mass Index (kg/m2) | 17.2 (16.9; 17.4) * | 17.8 (17.5; 18.1) * |
* indicates statistically significant difference (p < 0.05) between survey years within a country or region.
N refers to the number of participants in that survey year in that country or region. See Appendix 6 for variable-specific sample sizes.
N refers to the number of participants in that survey year in that country or region. See Appendix 6 for variable-specific sample sizes.
N | 514 | 508 |
|---|---|---|
Overweight or Obesity (age-specific BMI cut-offs) (%) | 19.0 (14.8; 23.2) * | 25.9 (21.6; 30.2) * |
Obesity (age-specific BMI cut-offs) (%) | 2.9 (1.0; 4.8) * | 6.4 (3.9; 8.8) * |
Body Mass Index (kg/m2) | 17.4 (17.1; 17.7) * | 18.2 (17.8; 18.5) * |
* indicates statistically significant difference (p < 0.05) between survey years within a country or region.
N refers to the number of participants in that survey year in that country or region. See Appendix 6 for variable-specific sample sizes.
N refers to the number of participants in that survey year in that country or region. See Appendix 6 for variable-specific sample sizes.
N | 2470 | 2534 |
|---|---|---|
Overweight or Obesity (age-specific BMI cut-offs) (%) | 15.5 (13.5; 17.6) * | 19.3 (17.4; 21.2) * |
Obesity (age-specific BMI cut-offs) (%) | 3.0 (2.1; 4.0) | 4.2 (3.2; 5.3) |
Body Mass Index (kg/m2) | 17.1 (17.0; 17.3) * | 17.7 (17.5; 17.9) * |
* indicates statistically significant difference (p < 0.05) between survey years within a country or region.
N refers to the number of participants in that survey year in that country or region. See Appendix 6 for variable-specific sample sizes.
N refers to the number of participants in that survey year in that country or region. See Appendix 6 for variable-specific sample sizes.
Demographic Differences
Gender
Differences in OW/OB prevalence between boys and girls were observed in Iceland and across the Nordic Region as a whole. In Iceland, the prevalence of OW/OB was significantly higher among boys compared to girls. Specifically, 30.1% of boys had OW/OB, while the corresponding figure for girls was 21.1%. This gender difference was also evident at the regional level: across the Nordic Region, 21.5% of boys had OW/OB, compared to 16.8% of girls.
N | 276 | 232 |
|---|---|---|
Overweight or Obesity (age-specific BMI cut-offs) (%) | 22.3 (15.0; 29.6) | 17.7 (11.4; 24.1) |
Obesity (age-specific BMI cut-offs) (%) | 4.5 (0.5; 8.6) | 6.5 (1.6; 11.5) |
Body Mass Index (kg/m2) | 17.8 (17.2; 18.4) | 17.2 (16.6; 17.8) |
* indicates statistically significant difference (p < 0.05) between genders within a country or region.
N refers to the number of participants with that gender in that country or region. See Appendix 6 for variable-specific sample sizes.
N refers to the number of participants with that gender in that country or region. See Appendix 6 for variable-specific sample sizes.
N | 262 | 248 |
|---|---|---|
Overweight or Obesity (age-specific BMI cut-offs) (%) | 18.8 (12.8; 24.8) | 12.9 (7.7; 18.2) |
Obesity (age-specific BMI cut-offs) (%) | 2.0 (-0.1; 4.1) | 1.8 (-0.4; 3.9) |
Body Mass Index (kg/m2) | 17.6 (17.1; 18.0) | 17.6 (17.2; 18.1) |
* indicates statistically significant difference (p < 0.05) between genders within a country or region.
N refers to the number of participants with that gender in that country or region. See Appendix 6 for variable-specific sample sizes.
N refers to the number of participants with that gender in that country or region. See Appendix 6 for variable-specific sample sizes.
N | 263 | 242 |
|---|---|---|
Overweight or Obesity (age-specific BMI cut-offs) (%) | 17.4 (11.5; 23.3) | 13.1 (7.8; 18.4) |
Obesity (age-specific BMI cut-offs) (%) | 2.5 (-0.3; 5.3) | 1.7 (-0.4; 3.9) |
Body Mass Index (kg/m2) | 17.6 (17.1; 18.0) | 17.3 (16.8; 17.7) |
* indicates statistically significant difference (p < 0.05) between genders within a country or region.
N refers to the number of participants with that gender in that country or region. See Appendix 6 for variable-specific sample sizes.
N refers to the number of participants with that gender in that country or region. See Appendix 6 for variable-specific sample sizes.
N | 272 | 231 |
|---|---|---|
Overweight or Obesity (age-specific BMI cut-offs) (%) | 19.0 (13.8; 24.3) | 18.6 (12.8; 24.4) |
Obesity (age-specific BMI cut-offs) (%) | 3.0 (0.7; 5.2) | 7.4 (3.3; 11.5) |
Body Mass Index (kg/m2) | 17.7 (17.3; 18.1) | 17.8 (17.4; 18.3) |
* indicates statistically significant difference (p < 0.05) between genders within a country or region.
N refers to the number of participants with that gender in that country or region. See Appendix 6 for variable-specific sample sizes.
N refers to the number of participants with that gender in that country or region. See Appendix 6 for variable-specific sample sizes.
N | 271 | 237 |
|---|---|---|
Overweight or Obesity (age-specific BMI cut-offs) (%) | 30.1 (23.9; 36.3) * | 21.1 (15.3; 26.9) * |
Obesity (age-specific BMI cut-offs) (%) | 6.7 (3.3; 10.1) | 6.0 (2.5; 9.5) |
Body Mass Index (kg/m2) | 18.4 (17.9; 18.9) | 17.9 (17.4; 18.4) |
* indicates statistically significant difference (p < 0.05) between genders within a country or region.
N refers to the number of participants with that gender in that country or region. See Appendix 6 for variable-specific sample sizes.
N refers to the number of participants with that gender in that country or region. See Appendix 6 for variable-specific sample sizes.
N | 1344 | 1190 |
|---|---|---|
Overweight or Obesity (age-specific BMI cut-offs) (%) | 21.5 (18.8; 24.3) * | 16.8 (14.2; 19.3) * |
Obesity (age-specific BMI cut-offs) (%) | 3.8 (2.4; 5.1) | 4.8 (3.1; 6.4) |
Body Mass Index (kg/m2) | 17.8 (17.6; 18.0) | 17.6 (17.3; 17.8) |
* indicates statistically significant difference (p < 0.05) between genders within a country or region.
N refers to the number of participants with that gender in that country or region. See Appendix 6 for variable-specific sample sizes.
N refers to the number of participants with that gender in that country or region. See Appendix 6 for variable-specific sample sizes.
Parental Education
Statistically significant differences in OW/OB, OB, and BMI were observed between children from households with low or medium education levels compared to those from high education households in several Nordic countries and in the region overall.
In Denmark, the prevalence of OW/OB among children from low/medium education households was 29.1%, significantly higher than the 13.2% observed among children from high education households. Similarly, in Sweden, the corresponding figures were 21.3% and 11.6%, and in Finland, 24.3% and 14.7%, respectively. At the regional level, the Nordic average showed a significant difference as well, with 24.4% of children from low/medium education households having OW/OB, compared to 15.7% from high education households.
OB followed the same pattern. In Denmark, 11.4% of children from low/medium education households had OB, compared to only 0.9% among those from high education households. In Finland, the figures were 8.1% versus 2.7%, and across the Nordic Region, 7.2% versus 2.1%, indicating a consistent and significant disparity.
Mean BMI values also differed significantly by household education level. In Denmark, children from low/medium education households had a mean BMI of 18.2 kg/m², compared to 17.0 kg/m² among those from high education households. In Sweden, the difference was 18.3 kg/m² versus 16.8 kg/m², and in Finland, 18.3 kg/m² versus 17.4 kg/m². At the regional level, the average BMI was 18.2 kg/m² for children from low/medium education households, compared to 17.3 kg/m² for those from high education households.
N | 99 | 409 |
|---|---|---|
Overweight or Obesity (age-specific BMI cut-offs) (%) | 29.1 (19.1; 39.1) * | 13.2 (9.5; 16.8) * |
Obesity (age-specific BMI cut-offs) (%) | 11.4 (4.4; 18.4) * | 0.9 (-0.1; 1.9) * |
Body Mass Index (kg/m2) | 18.2 (17.3; 19.0) * | 17.0 (16.8; 17.3) * |
* indicates statistically significant difference (p < 0.05) between levels of parental education within a country or region.
N refers to the number of participants with those levels of parental education in that country or region. SeeAppendix 6 for variable-specific sample sizes.
N refers to the number of participants with those levels of parental education in that country or region. SeeAppendix 6 for variable-specific sample sizes.
N | 146 | 364 |
|---|---|---|
Overweight or Obesity (age-specific BMI cut-offs) (%) | 16.8 (9.5; 24.1) | 15.4 (11.0; 19.7) |
Obesity (age-specific BMI cut-offs) (%) | 2.0 (-0.7; 4.7) | 1.9 (0.2; 3.5) |
Body Mass Index (kg/m2) | 17.7 (17.1; 18.3) | 17.5 (17.2; 17.9) |
* indicates statistically significant difference (p < 0.05) between levels of parental education within a country or region.
N refers to the number of participants with those levels of parental education in that country or region. SeeAppendix 6 for variable-specific sample sizes.
N refers to the number of participants with those levels of parental education in that country or region. SeeAppendix 6 for variable-specific sample sizes.
N | 109 | 394 |
|---|---|---|
Overweight or Obesity (age-specific BMI cut-offs) (%) | 21.3 (12.8; 29.9) * | 11.6 (8.2; 15.0) * |
Obesity (age-specific BMI cut-offs) (%) | 4.5 (0.2; 8.8) | 0.6 (-0.2; 1.4) |
Body Mass Index (kg/m2) | 18.3 (17.7; 19.0) * | 16.8 (16.5; 17.1) * |
* indicates statistically significant difference (p < 0.05) between levels of parental education within a country or region.
N refers to the number of participants with those levels of parental education in that country or region. SeeAppendix 6 for variable-specific sample sizes.
N refers to the number of participants with those levels of parental education in that country or region. SeeAppendix 6 for variable-specific sample sizes.
N | 160 | 343 |
|---|---|---|
Overweight or Obesity (age-specific BMI cut-offs) (%) | 24.3 (17.1; 31.5) * | 14.7 (10.7; 18.7) * |
Obesity (age-specific BMI cut-offs) (%) | 8.1 (3.5; 12.7) * | 2.7 (0.8; 4.5) * |
Body Mass Index (kg/m2) | 18.3 (17.7; 18.8) * | 17.4 (17.1; 17.7) * |
* indicates statistically significant difference (p < 0.05) between levels of parental education within a country or region.
N refers to the number of participants with those levels of parental education in that country or region. SeeAppendix 6 for variable-specific sample sizes.
N refers to the number of participants with those levels of parental education in that country or region. SeeAppendix 6 for variable-specific sample sizes.
N | 170 | 335 |
|---|---|---|
Overweight or Obesity (age-specific BMI cut-offs) (%) | 30.2 (22.3; 38.2) | 23.3 (18.4; 28.1) |
Obesity (age-specific BMI cut-offs) (%) | 9.3 (4.3; 14.3) | 4.5 (2.1; 6.9) |
Body Mass Index (kg/m2) | 18.6 (17.9; 19.3) | 17.9 (17.6; 18.3) |
* indicates statistically significant difference (p < 0.05) between levels of parental education within a country or region.
N refers to the number of participants with those levels of parental education in that country or region. SeeAppendix 6 for variable-specific sample sizes.
N refers to the number of participants with those levels of parental education in that country or region. SeeAppendix 6 for variable-specific sample sizes.
N | 684 | 1845 |
|---|---|---|
Overweight or Obesity (age-specific BMI cut-offs) (%) | 24.4 (20.7; 28.2) * | 15.7 (13.8; 17.5) * |
Obesity (age-specific BMI cut-offs) (%) | 7.2 (4.9; 9.4) * | 2.1 (1.4; 2.9) * |
Body Mass Index (kg/m2) | 18.2 (17.9; 18.5) * | 17.3 (17.2; 17.5) * |
* indicates statistically significant difference (p < 0.05) between levels of parental education within a country or region.
N refers to the number of participants with those levels of parental education in that country or region. See Appendix 6 for variable-specific sample sizes.
N refers to the number of participants with those levels of parental education in that country or region. See Appendix 6 for variable-specific sample sizes.
Discussion
Summary of results
Adults
The increase in OW/OB prevalence among adults is a growing concern. In 2024, 56% of adults in the Nordic Region had OW/OB, and one in five had obesity. Iceland had the highest adult OW/OB prevalence (70%), while Denmark (47%) and Sweden (51%) had the lowest rates.
OW/OB prevalence was higher among men than women in all countries, ranging from 52% in Danish men to 70% in Icelandic men, and from 40% in Swedish women to 66% in Icelandic women.
Education remained strongly associated with body weight: 66% of adults with low education levels had OW/OB compared with 48% of those with high education levels. Obesity rates were 33% vs. 12%, respectively.
Over the past decade, OW/OB prevalence among adults rose from 49% in 2014 to 56% in 2024, with the most pronounced increases in Iceland, Finland, and Sweden. Adult OB increased in Sweden from 10% to 15%, in Finland from 14% to 24% and in Iceland from 21% to 28%.
Parallel increases in mean BMI in the Nordic Region were observed: adult BMI rose from 25.6 to 26.5 kg/m², reflecting a broad upward shift across the population.
Children
OW/OB prevalence among children is also rising. In 2024, 19% of children in the Nordic Region had OW/OB, up from 16% in 2014. Iceland had the highest child OW/OB prevalence (26%), while Sweden (15%) and Norway (16%) had the lowest.
As with adults, OW/OB was more common among boys than girls in all countries. The education level of the household showed similar patterns: 24% of children from low/medium education households were OW/OB compared to 16% from high education households. Obesity rates were 7% vs. 2%, respectively.
Childhood obesity statistically significantly in Iceland: from 3% to 6%.
Mean BMI among children rose from 17.1 to 17.7 kg/m², indicating a general upward trend in body weight among younger age groups.
Interpretation
The results underscore a growing public health challenge in the Nordic Region. While all countries are affected with increasing OW/OB rates, Iceland and Finland appear to be experiencing the most rapid increases. The rises among children, especially in Denmark and Iceland, are particularly worrisome given the potential for early onset of risk factors for chronic diseases.
The persistence of strong educational gradients in OW/OB highlights underlying social inequalities in health behaviours, resulting in different dietary habits and physical activity, which remain hard to change. These disparities suggest that preventive measures may not be reaching—or not adequately engaging—lower socioeconomic groups.
Overall, the findings indicate that population-level shifts in diet, physical activity, and energy balance are driving a gradual increase in body weight across the Nordic Region. The parallel rise in adult and child BMI suggests shared environmental and lifestyle determinants, including food environment, sedentary patterns, and family-level behaviours.
Comparison to other results
The increase in OW/OB and OB prevalence observed in NORMO aligns with WHO monitoring systems (WHO 2024, WHO 2025) data. According to NORMO, adult obesity increased in Sweden from 10% to 15%, in Finland from 14% to 24%, and in Iceland from 21% to 28% between 2014 and 2024. WHO data for nearly the same period (2014–2022) confirm the upward trend but show slightly lower levels: in Finland from 19.7% to 21.5%, in Iceland from 19.2% to 21.2%, and in Sweden from 14.7% to 15.3%. The direction of change is consistent, but WHO estimates are more conservative, likely due to differences in methodology and population coverage. Despite these differences, both NORMO and WHO datasets confirm that obesity is rising across the Nordic Region, with Finland and Iceland showing the most pronounced increases.
For children, NORMO data show a clear increase in Iceland only, whereas WHO data reveal broader regional increases. WHO surveillance for children aged 7–9 years (2018–2020 compared with 2022–2024) found obesity prevalence increased among both boys and girls in Finland (by 0.3 and 1.4 percentage points) and Sweden (by 1.8 and 1.6 percentage points), while Denmark showed a slight decrease. By 2022–2024, obesity had reached 6% of boys and 5% of girls in Denmark, 13% and 12% in Finland, and 15% and 11% in Sweden.
The discrepancy between NORMO and WHO findings may reflect differences in age groups, measurement periods, or definitions, as well as the fact that WHO data include sex-specific reporting. Nonetheless, all sources converge in showing that obesity is increasing among Nordic children, particularly in Finland, Sweden, and Iceland.
Strengths and limitations
A strength of the data collection in 2024 obesity and overweight results is the harmonized data collection across the five Nordic countries, enabling consistent regional comparisons and trend assessment.
However, differences in methodology between NORMO and other international datasets, such as WHO, complicate direct comparisons. Self-reported height and weight may also underestimate true obesity prevalence, particularly among adults.
Although data from 2014 and 2024 are comparable in design, variation in sampling or response patterns may influence trend interpretation. For children, the absence of sex-specific estimates across survey years in the current analysis limits comparability with WHO data.
Although data from 2014 and 2024 are comparable in design, variation in sampling or response patterns may influence trend interpretation. For children, the absence of sex-specific estimates across survey years in the current analysis limits comparability with WHO data.
References
Cole, T. J., & Lobstein, T. (2012). Extended international (IOTF) body mass index cut-offs for thinness, overweight and obesity. Pediatric Obesity, 7(4), 284–294.
Global BMI Mortality Collaboration. (2016). Body-mass index and all-cause mortality: Individual-participant-data meta-analysis of 239 prospective studies in four continents. The Lancet, 388(10046), 776–786.
Nordic Nutrition Recommendations 2023. (2023). Integrating environmental aspects (Nord 2023:003). Nordic Council of Ministers.
World Health Organization. (2000). Obesity: Preventing and managing the global epidemic. Report of a WHO consultation (Technical Report Series No. 894). World Health Organization.
World Health Organization. Regional Office for Europe. (2024). Brief review of results from round 6 of COSI (WHO European Childhood Obesity Surveillance Initiative) 2022–2024. WHO Regional Office for Europe. https://www.who.int/europe/publications/brief-review-of-results-from-round-6-of-cosi-2022-2024
World Health Organization. (2025). Age-standardized prevalence of obesity among adults (18+ years) [Indicator]. https://data.who.int/indicators/i/C6262EC/BEFA58B