8. Coastal and marine tourism in the Nordics
Coastal and marine tourism constitutes a large fraction of the Nordic Ocean economy and is particularly important as a source of employment. Both coastal communities and natural features in the marine environment offer a thriving array of attractions which are used for leisure activities by domestic and international visitors. The COVID-19 pandemic profoundly disrupted the tourism industry in 2020–2021, but the recovery has shown the sector’s resilience and points towards future growth.
8.1 Coastal tourism in the Nordic countries
Much of international marine tourism statistics are often reduced to the cruise industry because economic reporting is more tractable and attributable to marine habitats. Even though coastal tourism is a key contributor to the ocean economy (EU Blue Economy Observatory, 2025), reporting on coastal and marine tourism (e.g. infrastructure, visitor numbers, and economic contributions) differs between countries (see Section 2.3.). The development of comparable data is a priority of the Nordic Tourism Plan (Nordic Council of Ministers, 2025) to improve the competitiveness of this sector.
8.1.1 Attractiveness of coastal and marine tourism relative to other tourism
Figure 8-1 shows the estimated proportion of infrastructure that should be counted as coastal and marine (A), and the relative attractiveness of coastal attractions (B) on the NUTS 3 regional level,
NUTS 3 (Nomenclature of territorial units for statistics) is the EU classification of small regions.

Figure 8-1 Estimate of (A) the proportion of marine and coastal tourism infrastructure and (B) the relative attractivity of marine attractions reported on OpenStreetMap with a Wikipedia page in a region (NUTS 3)
Åland, the Faroe Islands, Nordland country in Norway, and Southwestern Finland are among the areas where the largest proportion of infrastructure (A) is assigned as a part of the coastal and marine tourism industry. From the perspective of marine interest (B), other regions rank highest – for example, Bornholm, Funen, East Jutland and North Jutland in Denmark; Ostrobothnia and Kymenlaakso (Kymmenedalen) in Finland; Kalmar (including Öland) and Södermanland in Sweden, and Akershus and Finnmark in Norway. The latter metric for ‘marine interest’ probably underrepresents qualities in the marine environment that would not necessarily be considered a specific attraction easily listed on the map, such as activities at sea, like recreational fishing or whale watching.
For Figure 8-1, part A, the number of places of accommodation is used as a proxy for tourism infrastructure. We estimate from OpenStreetMap the proportion of seafront hotels and other accommodation (within 100 metres of the shoreline) relative to the total number of accommodations in a NUTS 3 region to estimate the coastal and marine tourism contribution to employment, infrastructure use, and expenditures. For Figure 8-1, part B, we define marine and coastal tourist attractions as those within 250 metres of the shoreline, based on user-reported attractions in OpenStreetMap, and use this to quantify the proportion of marine and coastal tourism in tourism overall. We then retrieve all those attractions with a Wikipedia page and estimate the number of views per page over the past 10 years, with the potential caveat of downplaying more recently popularized destinations. From the sum of views, we estimate the attractiveness of marine destinations compared to all destinations in a region, where the attractiveness coefficient is 1 if the proportion of the views attributable to marine destinations is equal to the proportion of marine tourist attraction Wikipedia pages. Hence, the ‘marine interest’ score can be above 1 if the associated Wikipedia entries are visited more often than the sites for non-marine tourist attractions.
The thresholds used to qualify marine attractions and infrastructure do not affect the between-region variability observed in the data. They are selected to conservatively denote marine attractions and infrastructure across both urban and rural landscapes. They probably underrepresent the number of marine attractions and infrastructure in a region. For instance, the registration of accommodation does not consider privately owned summer houses, which are commonly found in coastal areas in all Nordic countries.
8.1.2 COVID-19 impact and tourism sector recovery
The tourism sector was heavily affected by COVID-19 but has generally bounced back to or above previous levels. We use reported overnight stays, occupancy rates, and employment to shed light on future developments.
Overnight stays: Figure 8-2 shows overnight stays in the tourism sector since 1995 on a logarithmic scale, with the impact of COVID-19 evident in all countries. Tourism flows have resumed post-pandemic, but growth patterns differ to those seen pre-COVID (see Figure 8-3). Countries ranked by overnight stays follow population for most countries, but Denmark and Norway report more overnight stays than Finland, reflecting that their tourism sectors are slightly smaller on a per capita basis. Note that accommodation offered via collaborative economy platforms (e.g., Airbnb) is not included here, though statistics on short-stay accommodation booked via online platforms are available as ‘experimental statistics’ in EUROSTAT (2025f).

Figure 8-2 Total annual overnight stays (note the y-axis is on a log scale) 1995–2024
Source ÅSUB (2025); Statistics Denmark (2025); Statistics Faroe Islands (2025); Statistics Finland (2025); Statistics Greenland (2025); Statistics Iceland (2025); Statistics Norway (2025); Statistics Sweden (2025)

Figure 8-3 Comparison of the tourism sector before (2016–2019) and after (2022–2024) COVID-19: (A) compares annual growth rates, and (B) compares proportion of overnight stays by domestic tourists
Source ÅSUB (2025); Statistics Denmark (2025); Statistics Faroe Islands (2025); Statistics Finland (2025); Statistics Greenland (2025); Statistics Iceland (2025); Statistics Norway (2025); Statistics Sweden (2025)
Figure 8-3 compares the growth rate (A) and share of international tourists (B) in the tourism sector before (2016–2019) and after (2022–2024) COVID-19. Only Greenland and Åland see more tourists post-COVID than we would expect if COVID-19 had not happened. Tourism growth was 12% annually in Iceland before COVID-19 but is now closer to 5%, on a par with several other Nordic countries. The share of international tourists has not changed much in any of the countries (Figure 8-3, B).
Occupancy rates: Overall, occupancy rate has recovered post-COVID for all countries and continues to reflect the high degree of seasonality in the tourism industry. Occupancy rates peak during summer and wane during winter, with down to 20% utilization in low season. Figure 8-4 shows the development in occupancy rates for selected Nordic countries but does not account for bookings through collaborative economy platforms.
Employment: Jobs in the tourism sector were particularly hard hit by COVID-19, but the recovery reveals certain shifts. Figure 8-5 shows tourism employment as a share of total employment, revealing that the level of employment has largely bounced back but does not show the same growth as earlier, in line with Figure 8-3. Some service professions may also have reduced staff permanently, with the scaling of automated hotel check-ins and self-ordering in restaurants a potential factor. Such a trend would have the biggest effect on employment of women, who constitute a bigger share of the accommodation and food services workforce than men.

Figure 8-4 Seasonality in occupancy rates in selected Nordic countries, 2000-2024
Source Statistics Denmark (2025); Statistics Iceland (2025); Statistics Norway (2025); Statistics Sweden (2025)

Figure 8-5 Share of total employment for three tourism subsectors reported in national statistics, with pre-COVID annual averages (2017–2019) and post-COVID annual averages (2022–2024)
Source ÅSUB (2025); Statistics Denmark (2025); Statistics Faroe Islands (2025); Statistics Finland (2025); Statistics Greenland (2025); Statistics Iceland (2025); Statistics Norway (2025); Statistics Sweden (2025)
8.1.3 Coastal and marine tourism’s impact and dependency on nature
As shown in Section 3.1, tourism and marine ecosystems are closely interconnected through the provisioning of cultural services. At the same time, many coastal and marine tourism activities threaten to cause degradation of the ecosystems they depend on (Mancini et al., 2020; Lusseau and Mancini, 2018). Globally, human disturbances caused by tourism and recreational activities are a conservation threat for more than 1100 marine species (IUCN, 2025). In addition, there are around 1,600 marine species threatened by tourism infrastructure globally, primarily due to the habitat modification it causes (IUCN, 2025).
Figure 8-6 shows that 68 marine and coastal species are red-listed due to tourism-related habitat modification, and 36 red-listed due to recreational activities. 16 species are red-listed due to both. Among these 88 species, some are sensitive to both threats, including endangered species like angelsharks, and species currently listed as ‘of least concern’, such as ringed seals. Some of these species (e.g. dolphins, whales, and seabirds) are critical assets for nature-based tourism which attracts visitors to destinations. There is potential for negative feedback from biodiversity deterioration to economic contributions from tourism.

Figure 8-6 IUCN (International Union for Conservation of Nature) Red List species living in the Nordics that have been assessed and found to be threatened by tourism activities
Source IUCN, 2025
8.2 Cruise tourism in the Nordic region
Cruise tourism in the Nordics can be roughly divided into two geographical markets, Non-Mediterranean Europe and the emerging ‘exploration cruise’ regions (CLIA, 2025). Non-Mediterranean routes largely intersect with traffic in the North and Baltic Seas, covering destinations such as the UK, Germany and, until 2020, Russia, besides Nordic cities like Copenhagen, Gothenburg, Helsinki, Oslo, and Stockholm. The exploration cruise category, with itineraries covering Greenland, Iceland, and Northern Norway, has recently grown much faster, with a 20% increase in the number of passengers since 2023 (CLIA, 2025).
The Nordics are a relatively small cruise region, with less than 10% global market share in terms of passenger counts (CLIA, 2025). In terms of passenger arrivals, Norway leads the Nordic cruise industry with about 5.8 million arrivals in 2024, having rebounded from COVID-19 (Norwegian Coastal Administration, 2025). Germans are the biggest nationality among cruise tourists in Norway, and this used to be the case for Greenland too. However, after the COVID-19 pandemic, US visitors have skyrocketed and constituted 50% of passengers in 2024 (Statistics Greenland, 2025a). Figure 8-7 shows annual cruise passenger arrivals for all Nordic countries, except Åland, on a logarithmic scale. Despite lacking data for Åland in Figure 8-7, note that passenger ferries are crucial for Åland’s tourism industry, as they carry most visitors to the archipelago.
Greenland: After the recovery of this sector in 2022, the flow of cruise passengers to Greenland ports continues to grow at a similar rate to before COVID-19. The biggest destinations are Qaqortoq and Nanortalik in the south, and the capital Nuuk on the western coast, with passenger numbers rising fastest for Nanortalik and Nuuk (see Figure 8-8 and 8-9). Due to cold winters with icy waters, the season is limited to summer and early autumn (four to six months depending on the region). It is unclear how much cruise tourism benefits the national economy of Greenland, and how much cruise’s use of Greenland’s ecological assets leaks economically outside the nation.
Norway: In Norway, cruises rebounded from COVID-19 with 45% growth in passenger numbers between 2022 and 2023. The top five ports over the period 2015–2024 were Bergen, Stavanger, Oslo, Ålesund, and Flåm (see Figure 8-8 and 8-10). The years since the pandemic has seen some movement in the top five, with Ålesund exceeding Bergen in terms of arrivals after the pandemic. In 2024, Stavanger also caught up with Bergen in terms of arrivals. Stricter environmental regulations are also impacting the selection of ports, with Flåm and Geiranger, both within the World Heritage Fjords, experiencing a 33% reduction in port calls between 2019 and 2022, also adjusting for the COVID-19 impact. The post-COVID period has also seen a shift in seasonality, with more arrivals in autumn compared with before the pandemic. Ports like Oslo and Tromsø are generally less impacted by seasonality than Bergen, Ålesund, and Stavanger.
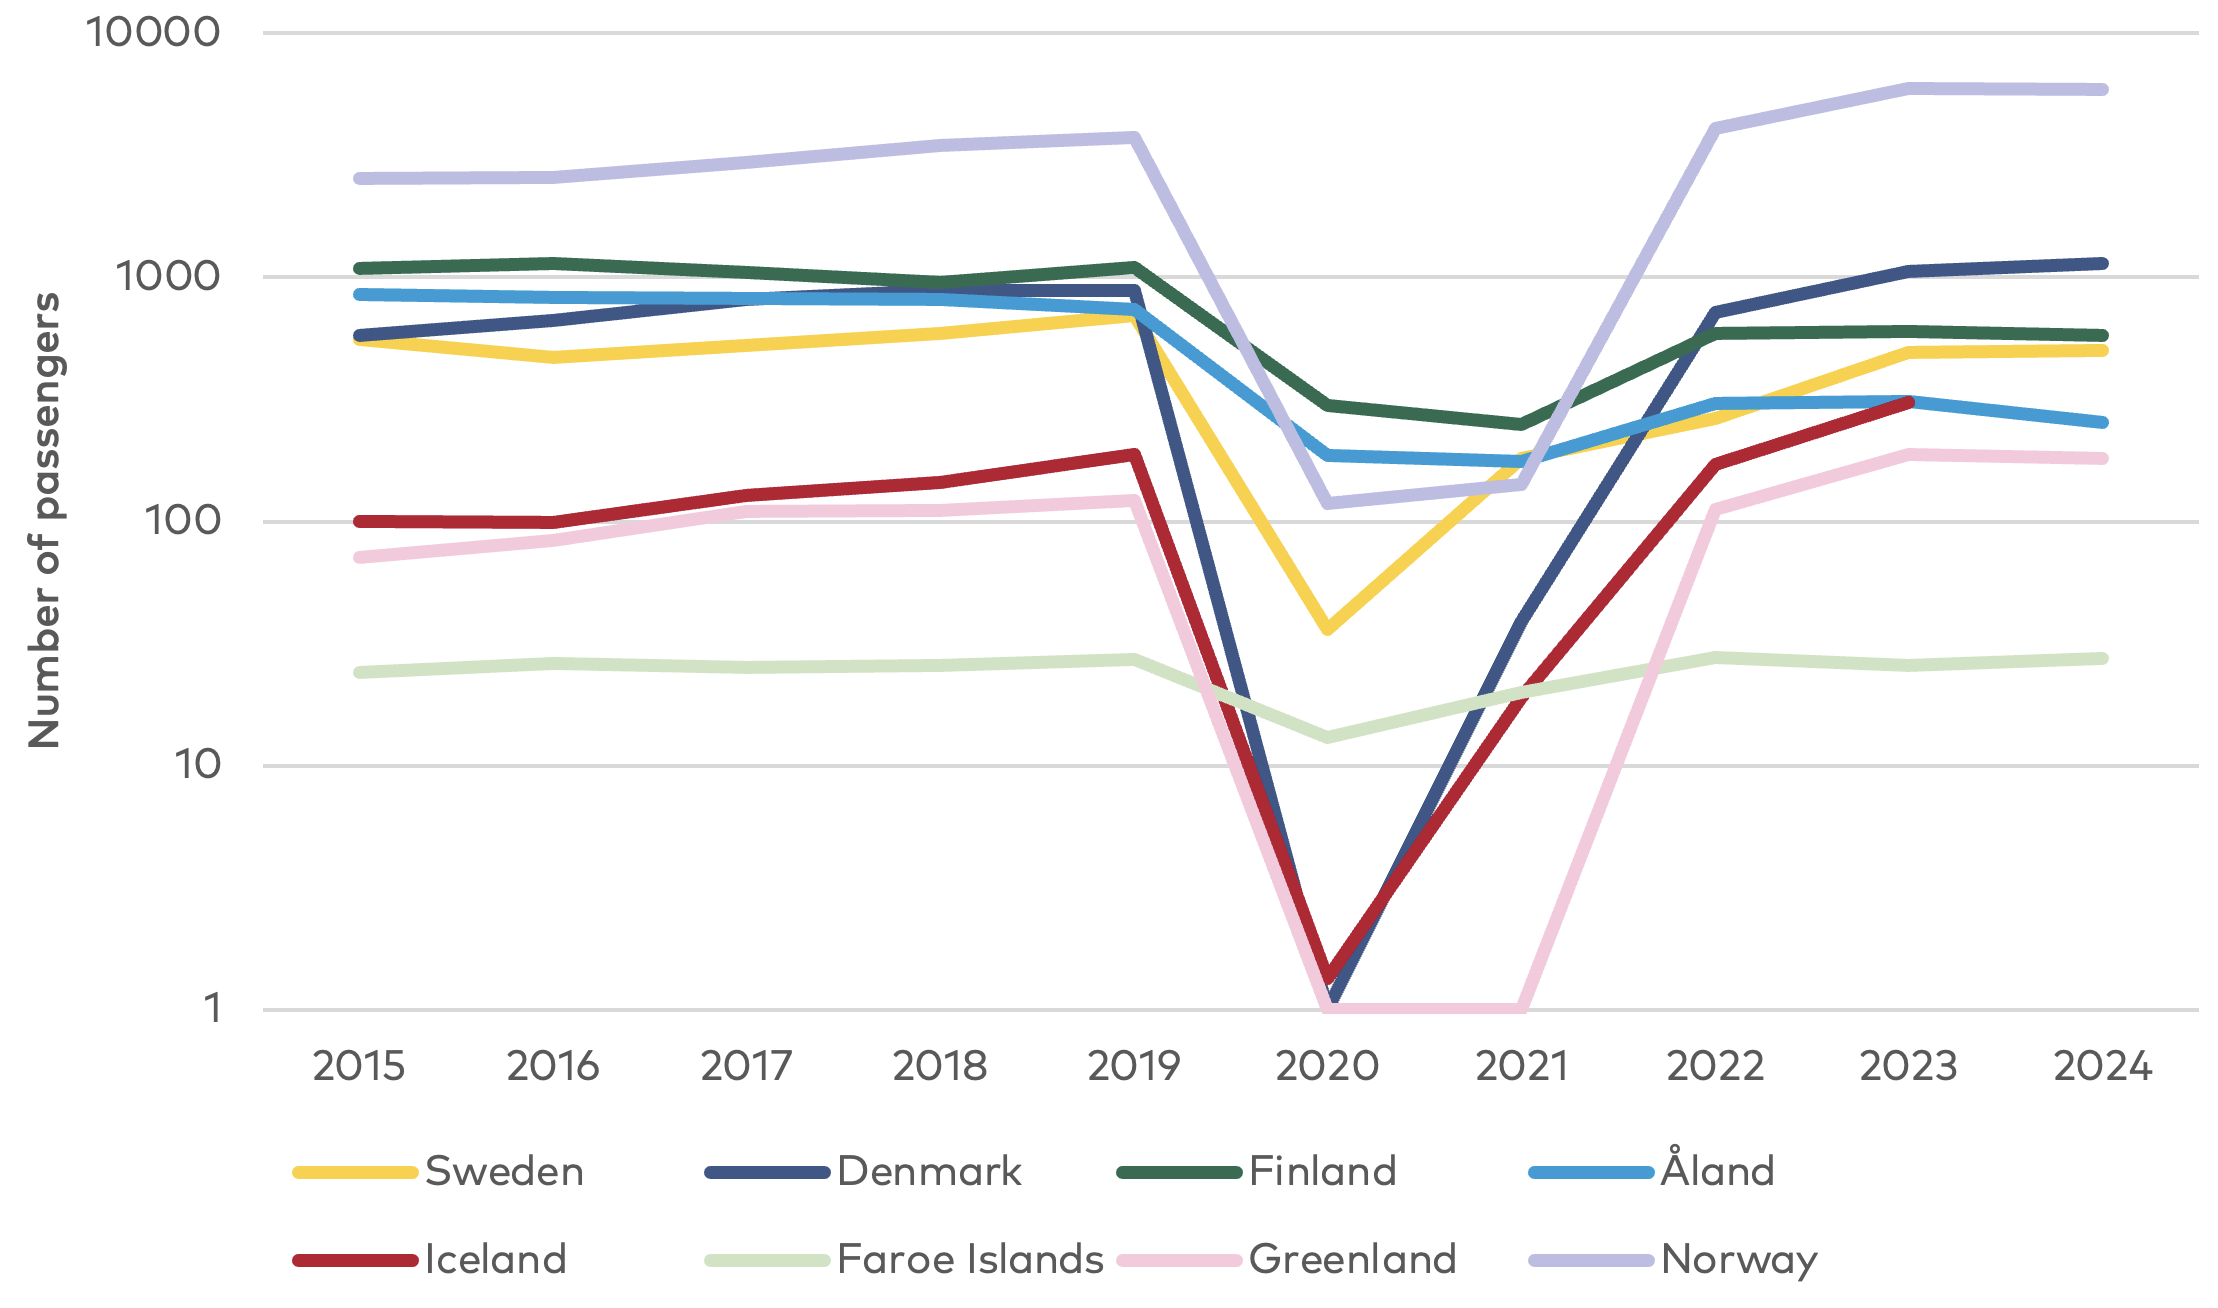
Figure 8-7 Annual cruise arrivals by country, 2015–2024
Source Norwegian Coastal Administration (2025); Statistics Denmark (2025b); Statistics Faroe Islands (2025a); Statistics Finland (2025); Statistics Greenland (2025b); Statistics Iceland (2025d); Transport Analysis (2025)


Figure 8-8 Main cruise ports in Greenland (A) and Norway (B) are shown with circles sized proportional to 2024 passenger counts and colour indicating the growth multiplier relative to 2015 (> 1 = growth, < 1 = decline); port labels with greater than 5,000 and 150,000 passengers are included for Greenland and Norway, respectively
Sources Statistics Greenland (2025b); Norwegian Coastal Administration (2025)
Figure 8-9 Cruise passengers in Greenlandic ports by month, 2015–2024
Source Statistics Greenland, 2025b
Figure 8-10 Cruise passengers in Norwegian ports by month, 2015–2024
Source Norwegian Coastal Administration, 2025
8.3 Opportunities and barriers for coastal and marine tourism
8.3.1 Opportunities for growth in tourism
Infrastructure flexibility: Occupancy remains at rates that leave space for growth and highlights that infrastructure capacity is not a constraint for tourism growth (see Figure 8-4). With collaborative economy platforms adding flexibility, the tourism sector adds substantial reserve capacity, reducing the need for development of new tourism infrastructure to meet growing demand (e.g. from ‘coolcations’). It is necessary to understand potential impacts of these hybrid accommodations on the social capital of local communities (e.g. housing prices), given the backlash against tourism observed in some countries.
Advance zero-emission marine tourism: In 2026, the Norwegian Government will introduce a zero-emissions requirement for tourist ships and ferries under 10,000 GT in the World Heritage Fjords, and for larger vessels in 2032 (Norwegian Maritime Authority, 2025). The goal is to promote sustainable tourism by keeping the fjords clean and driving technological development for emission reductions, while creating opportunities to advance new business models for zero-emission and silent boats for excursions.
8.3.2 Barriers to growth in tourism
The need to curb carbon emissions: Tourism globally contributes 8% to 9% of global greenhouse gas emissions. With air transport responsible for around 50% of the tourism emissions (Sun et al., 2024), growing Nordic tourism sustainability hinges on development of low-carbon aviation or a shift to tourists that can access Nordic destinations through other modes of transportation. This limits the pool of tourists to Europe, which, contrasting with much of Asia, is unlikely to grow tourism demand (DNV, 2021).
Biodiversity impacts: Environmental degradation from tourism and other human activity (see Chapter 3) reduces both the cultural services offered by ecosystems, potentially reducing the attractiveness of visited sites. On the other side of this trade-off, stricter regulations to mitigate biodiversity degradation may hinder tourism development.
Cannibalization of local tourism industry: Cruise can both compete with and supplement coastal tourism. In mature areas, cruises compete with local offerings due to its all-in-one package including travel, accommodation, and entertainment reducing local value creation and employment in coastal communities. In areas with sparse infrastructure, cruises greatly improve the availability of destinations, with Greenland and other ‘exploration cruise’ destinations offering prime examples.
8.4 Scenarios for coastal and marine tourism in the Nordics
Nature First | Tourism management has a strong focus on value creation based on low-impact use of natural habitats and biodiversity assets. Focus on attracting domestic tourists and those from neighbouring countries, over those that rely on air transport. Countries such as Iceland relying on air transportation of international visitors' struggle. Visitor numbers consequently decline. Decreased biodiversity footprint from tourism activities, through strictly advancing sustainable practices and low-impact technologies like zero-emission silent tourist boats and pleasure craft. Overall increase in cultural ecosystem services generated, and an increase in the share of skilled labour in employment. |
Constant Compromise | Economic contributions and employment continue to grow, but at a slowing pace. The sector might struggle to compete with other economic sectors to retain workforce, as working-age populations stagnate with rural, coastal communities hard hit by this trend. The biodiversity and carbon footprint of tourism continues to increase with this growth, but efforts to reduce harm to cultural ecosystem services are prioritized at the policy level. Recent summer growth continues to accelerate as climate conditions in traditional European summer destinations worsen. |
Regional Rivalry | Slowdown of international arrivals and disruption of current visitor flows. Countries such as Sweden and Norway that rely more on domestic visitors are more sheltered from these disruptions and can continue to grow tourism with a dichotomous focus on mass tourism and high-end luxury tourism. Decrease in employment in the sector, driven by lower arrivals and much lower access to personnel due to stagnant working-age populations in rural, coastal areas. Continued increase in biodiversity footprint and overall decrease in cultural ecosystem services generated, also due to security priorities generally taking precedence over environmental considerations. |
Growth First | Demand increases as traditional European summer destinations are less popular or even less accessible due to climate disruptions. Large influx of tourists also from other regions, such as East Asia and the Middle East. Tourism is optimized for profit, leading to divergence in the Nordics between regions specializing in luxury exclusive tourism (‘coolcations’ turning into ‘climate refuge’ service) for international flying visitors (e.g. Iceland) and regions focusing on mass tourism. A large increase in the popularity of exploration cruise destinations, such as Greenland and Svalbard, as Arctic infrastructure develops. Impact on cultural ecosystem services generation is not clear as new species and new areas become available to tourism. |