Graphics
Icons
There are icons for communicating Our vision 2030 and the 12 focus areas.
RULES:
- You can use the icon with or without the focus area number.
- Icons are always places on a plain light background.
- You may not change the colors or add elements to the icons.
There are also more general icons that can be used in other contexts.
You can save the icons from the Powerpoint presentation. Please contact pub@norden.org if you need help.


Illustrations
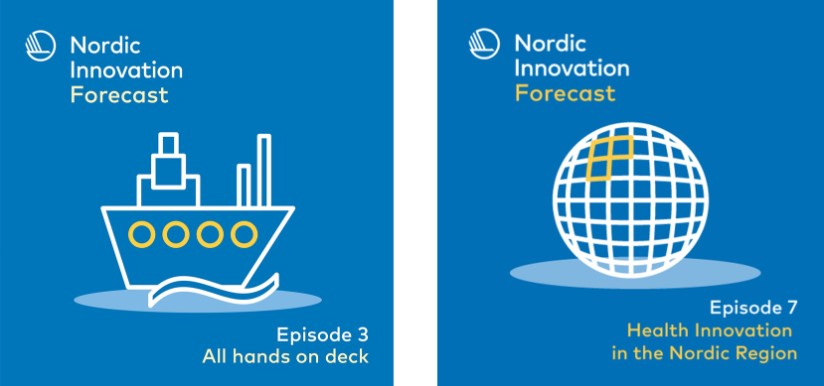
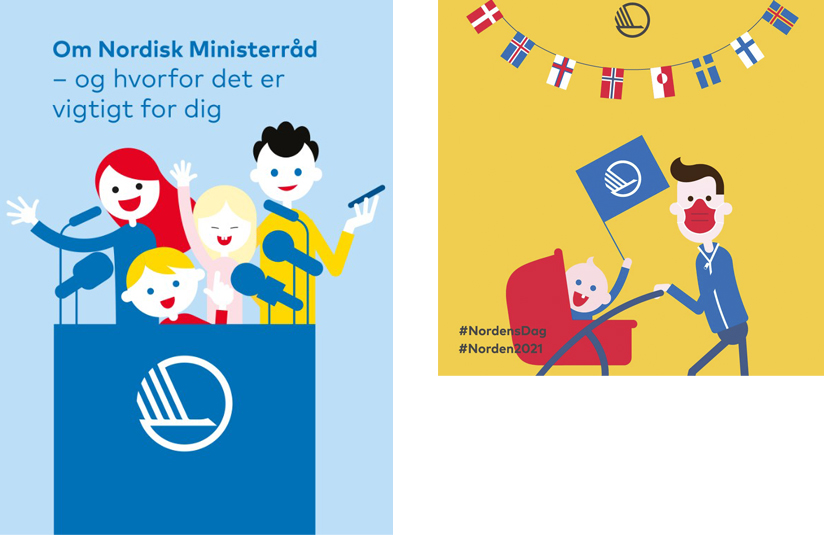
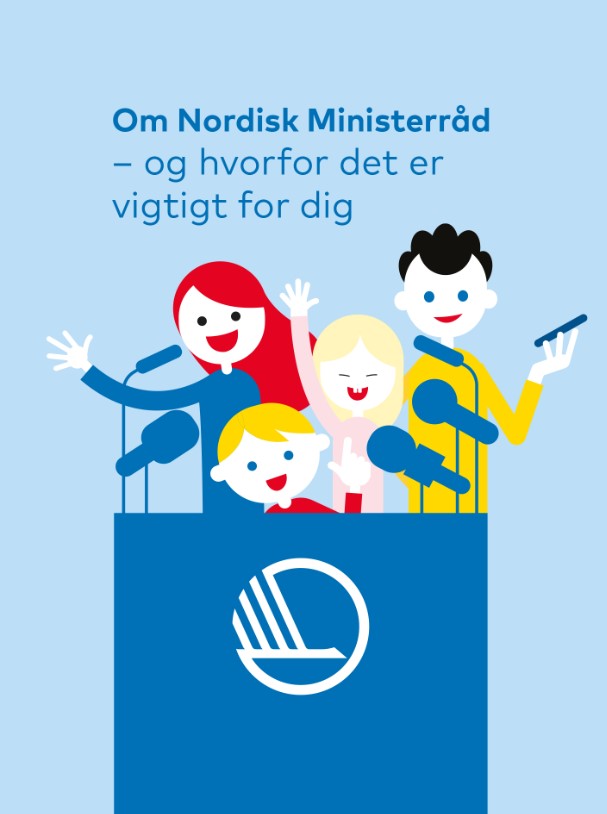
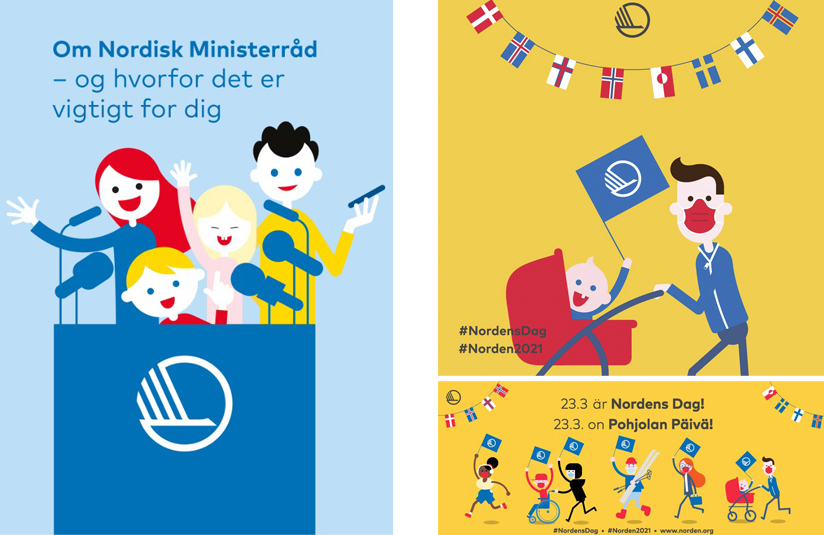
See exemples of illustration styles that have been used in publications and social media.


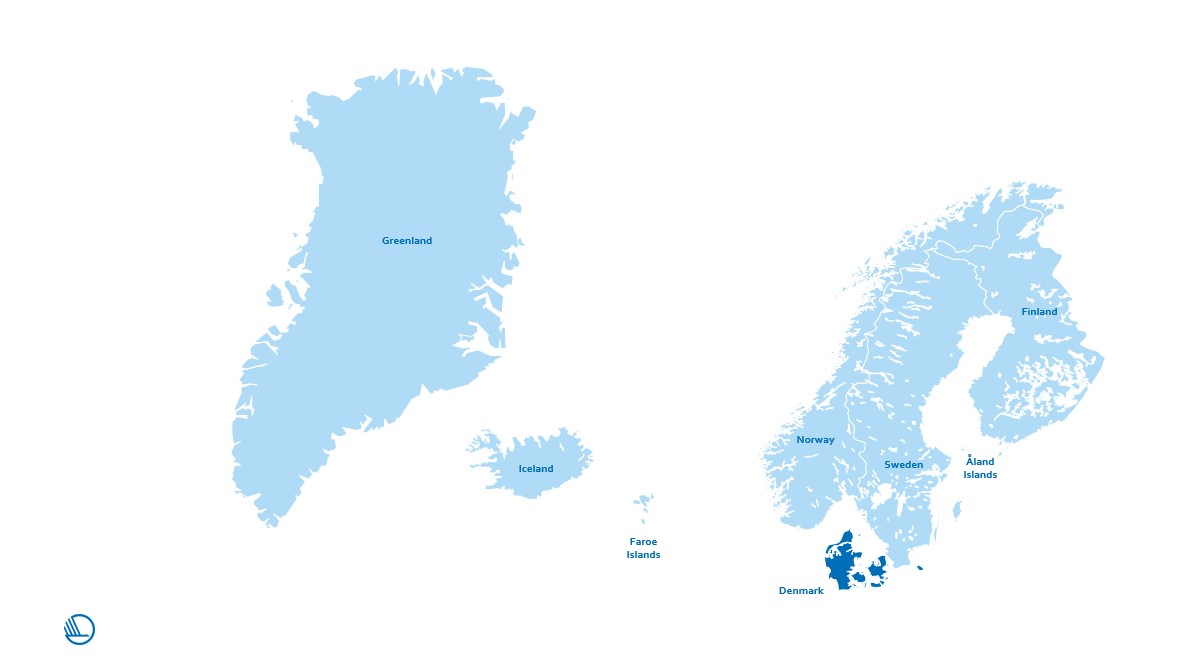
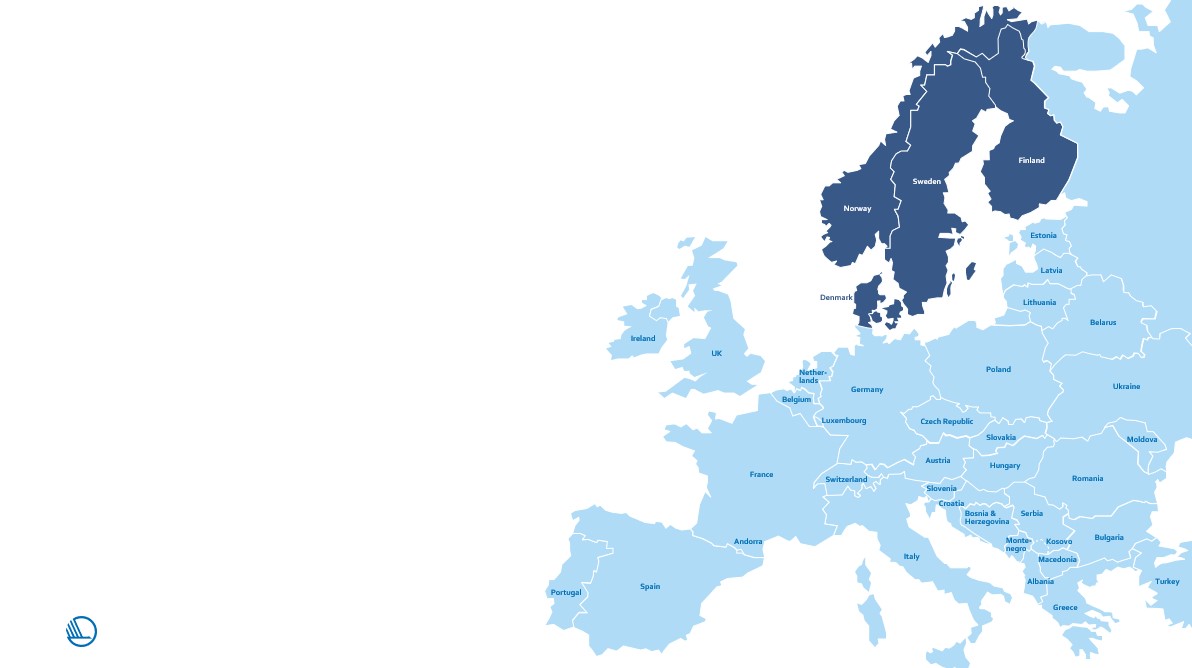
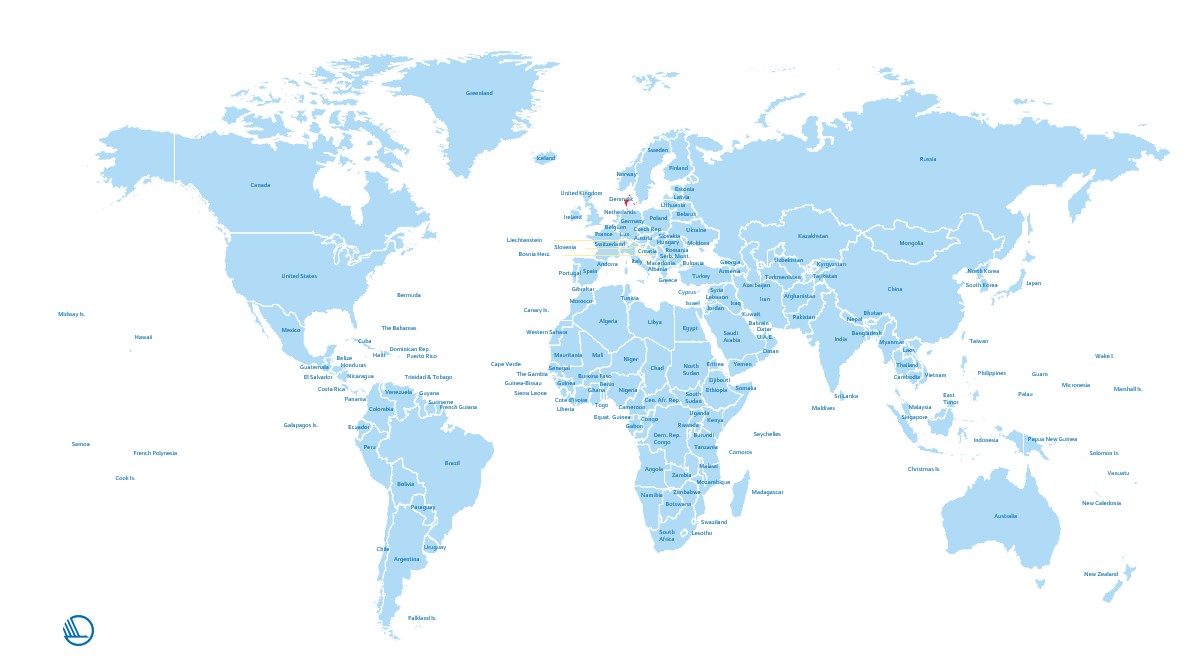
Maps
Maps as vector graphic with clickable fields to highlight the different countries are available in four variants for download:
- the Nordic Region and Greenland
- the Nordic Region without Greenland
- the Nordic Region in Europe
- the Nordic Region in the world.
→ Download maps (PPT)


Infographics
You can use infographics to make hard facts appealing and easy to interpret. Use icons and colours to separate specific pieces of information. Of course infographics is also possible to animate. You can use multiple colours - e.g. to emphasize important numbers or words. For a simpler look, use a single primary colour with a secondary colour and possibly grey. The examples shown here are from the publication "Nordic Gender Equality in Figures 2021".
See the whole publication and the animated infographics at:

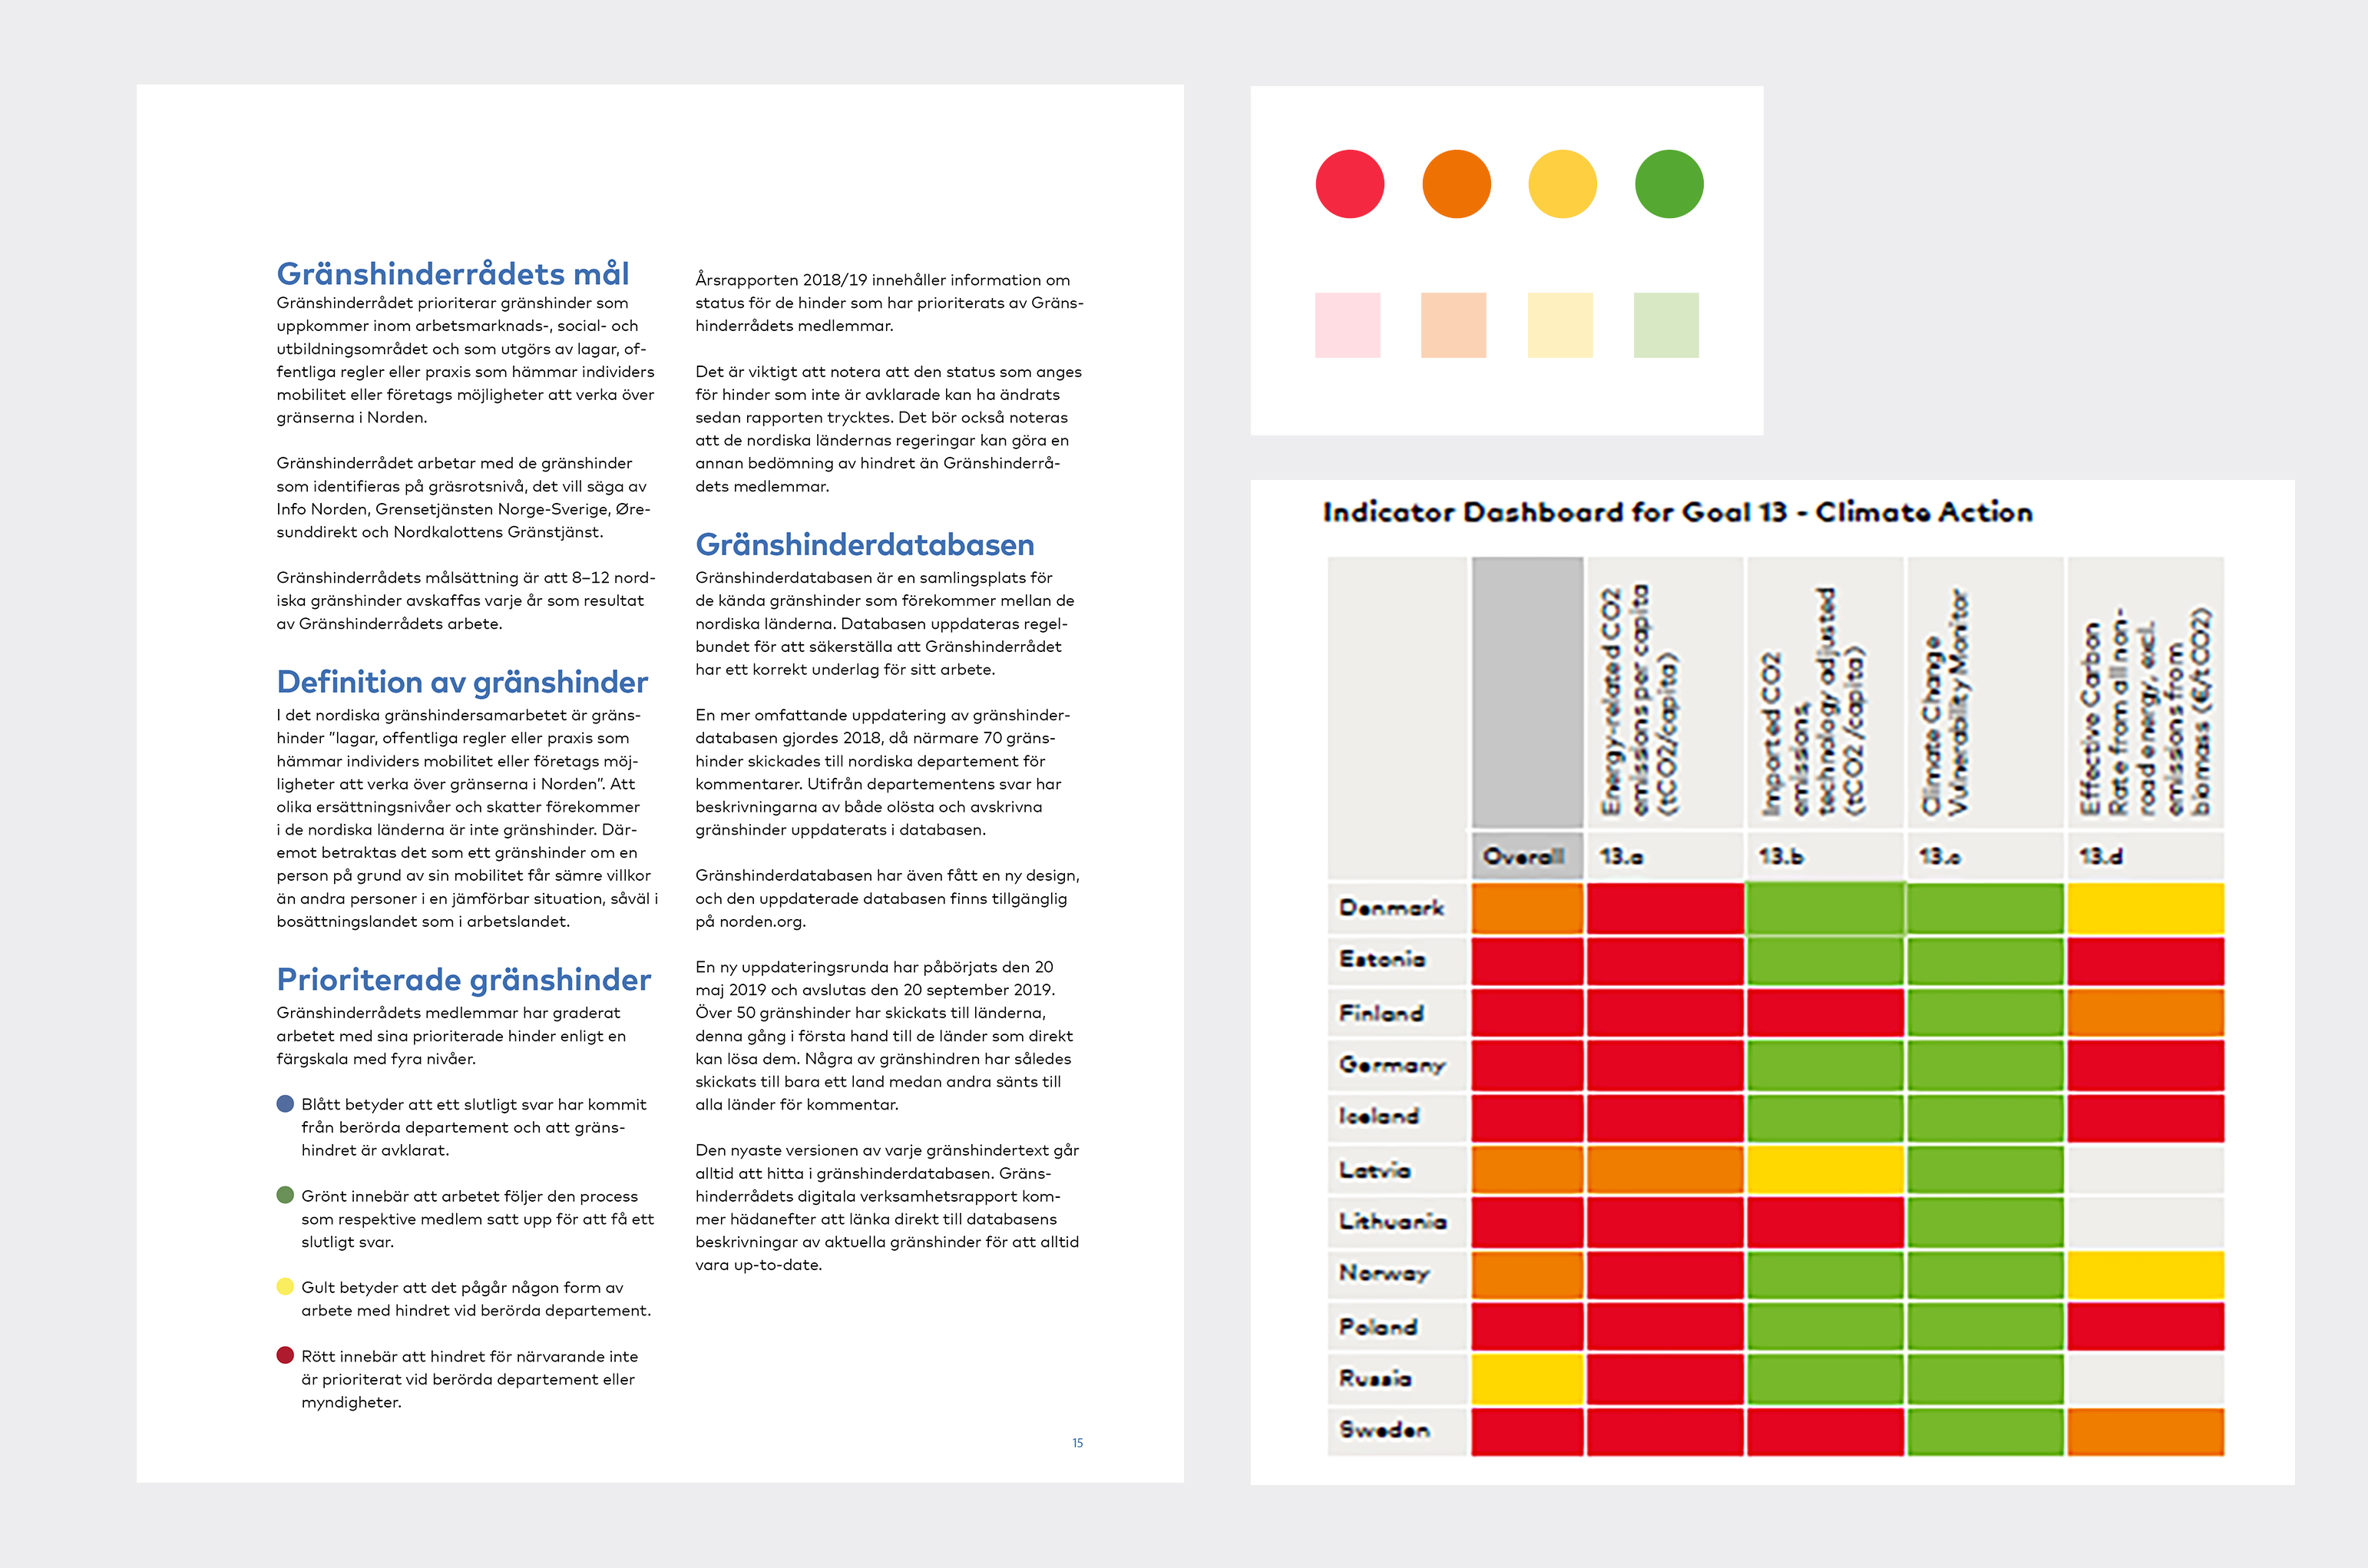
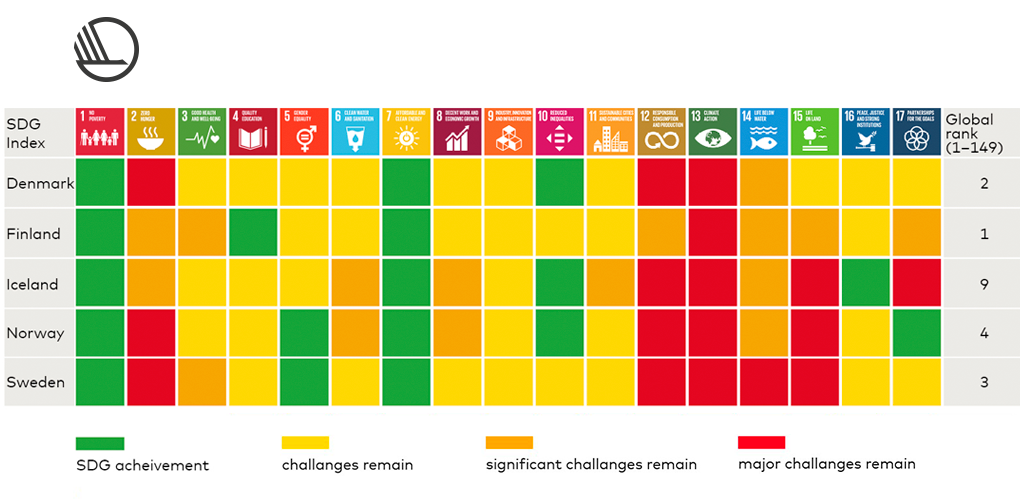
The use of “traffic lights” as colour markers
Red, yellow, green and even orange may be used for “traffic lights” or small colour markings on forms. They should only be used in moderation and only for marking, for example, to show how far a project has progressed, the status of a specific area, etc. The example on the right shows how the Freedom of Movement Council used blue, green, yellow and red in a publication, while red, orange, yellow and green were used on the form. Whenever colour markings are used, the meaning must always be explained.
The dark red and dark yellow in the design manual are used along with dark green and possibly also dark orange. The light red and light yellow in the design manual are used along with light green and possibly light orange. See the colour codes for green and orange below.

Green

HEX: #266d51
RGB: 38-109-81
CMYK: 85–35–70–25
Yellow

HEX: #fdcf41
RGB: 253-207-65
CMYK: 0–13–100–0
Orange

HEX: #ee7203
RGB: 238-114-3
CMYK: 0–65–99–0
Red

HEX: #ba0c2f
RGB: 186-12-47
CMYK: 0–100–75–20
Light green

HEX: #e2fae1
RGB: 226-250-225
CMYK: 15–0–20–0
Light yellow

HEX: #fff0be
RGB: 255-240-190
CMYK: 0–2–35–0
Light orange

HEX: #fad2b4
RGB: 250-210-180
CMYK: 1–22–31–0
Light red

HEX: #fbdce7
RGB: 251-220-231
CMYK: 0–20–3–0