Photo: Nordic Sustainable Construction
4. Development of carbon limit values for buildings
4.1 Introduction
Nordic countries currently exhibit different approaches to limit values. Harmonising methods is crucial for fair competition to mobilise the market to develop the most efficient low-carbon solutions. There is a great need for identifying harmonisation potential of limit value methods from Nordic countries and to influence upcoming common exchange standards resulted from various European initiatives.
This report section is a contribution towards harmonising the approach to national building carbon limits (’carbon´ is here used in line with common terminology and refers to GHG emissions) for creating a supportive environment for the large-scale decarbonisation of building stocks. The aim is to improve the understanding of the differences and synergies, harmonisation potential, as well as the expected changes, which different limit values scenarios are expected to cause or require, in terms of building design, other environmental impacts, society and economy.
The section provides the following insights:
- Overview of the current state of building carbon declarations and limit values in the Nordic countries
This includes an overview of the differences and synergies in the methodological background of limit values and carbon declarations to evaluate the harmonisation potential.
- The influence of most relevant variables on carbon limits
It provides an instrument for differentiating variables, which need to reflect regional differences on the one hand and others, which can and should be harmonised.
- The further impact of introducing limit values
It explores the unintended consequences of gradually tightened carbon limits. The assessment considers the carbon limit level and pace of implementation using the quantitative case study and literature.
4.2 Nordic LCA definitions
- Building reference area as functional unit uses different definitions in the Nordics and Estonia. The expected mandatory usable floor area (UFA) mandated in the EPBD may offer an opportunity for harmonisation.
- Upfront carbon from modules A1-5 is both significant in magnitude of emissions, but also include the largest carbon mitigation potential with an immediate effect. Various strategies for promoting upfront carbon mitigation are observed: An initial focus exclusively on A1-A5 (Sweden), or a dynamic accounting of emissions over time, where today’s emissions weigh higher than future ones (France), or dynamic emission factors for future process scenarios (in parts applied in Denmark). Alternatively, a dual approach with separate carbon limits for upfront modules and the whole life cycle can support immediate carbon reductions and keep future emissions on an acceptable level.
- Currently the Nordics and Estonia employ different definitions of Global Warming Potential, where biogenic carbon is only included where end-of-life stage forms part of the scope. Harmonisation is expected to be achieved in the mid-term as compliance with EPBD requires expanding to full life cycle scope, however, a module-by-module comparison will still not be feasible if not introducing a separate biogenic carbon declaration. While the latter is only a suggestion in EPBD, at least the reporting of GWP-biogenic, and to the extent possible of the capability of products to temporarily store carbon are essential requirements according to the CPR recast.
- Main differences in current definitions of included building parts root in earlier considerations about the life cycle scopes. The material inventory has a major influence on the comparability on results and has a good harmonisation potential.
- The allocation of impacts and benefits from exported onsite energy production is expected to have two options according to the EN 15978 revision. The Nordics and Estonia can achieve harmonisation by choosing a common option.
- Most Nordic countries and Estonia apply or prepare future decarbonisation scenarios for the energy supply in operational energy use (module B6). The choice of scenario can greatly influence assessment results. Since no decarbonisation scenarios are applied to other use-stage modules or end-of-life yet, harmonisation can be achieved by following a common approach.
- Conservative standard values for building systems, and generic values for construction products, can facilitate assessments and fill data gaps. Not all countries propose standard values for building service systems. All Nordic countries have developed conservative generic values for common products, but they use different approaches for developing conservative emission levels. In future revisions, harmonisation in data sampling and definitions may be pursued.
- Different component service life approaches are used in the Nordics, applying varying approaches regarding standard tables or differentiation after exposure, quality, or location in the building. There is the possibility of a potential EU harmonisation.
This chapter provides a brief overview of current differences in Nordic and Estonian LCA methodology including definitions (Table 13), as well as the choice and availability of environmental data and scenarios (Table 14). This overview constitutes an updated summary of a detailed state-of-the-art mapping provided in the report “Harmonised Carbon Limit Values for Buildings in Nordic Countries” (Balouktsi, Francart, & Kanafani, 2024).
Building reference area: While Denmark, Norway and Sweden consider the gross floor area (GFA) as the reference area unit for carbon declarations, with differences in including shared and external spaces, Finland and Estonia are applying the heated floor area (HFA). Current EU policy, represented by Level(s) and EPBD though define the reference unit as useful floor area (UFA) per year. The Delegated Act, which is expected to be adopted by the European Commission by 2025, will clarify how the UFA will be defined and what flexibility the members states may have. In a scenario where the EU definition provides room for national differences, a harmonised Nordic UFA approach could be a vehicle for making assessments more comparable.
Life cycle system boundary: At the moment, Nordic countries use varying approaches for the life cycle system boundary. Sweden is the only country restricting the limit value scope to upfront carbon, but is considering to extend the boundary of the declaration to the remaining modules in 2027 in order to align with the revised EPBD proposal. Due to a focus on A1-A5, Sweden uses the GWP-GHG indicator which does not account for biogenic carbon uptake in the product or its packaging and emissions in the end of life. The rationale for special attention to upfront emissions is twofold. Firstly, today’s emissions can be measured and verified at building hand-over and mitigation has an immediate effect. Secondly, the ongoing decarbonisation of energy systems and the constructions product supply chain is progressively decreasing the magnitude of future emissions of buildings built today. This gives upfront emissions in modules A1-5 the greatest potential for achieving significant and measurable fossil-based carbon emission reductions for new buildings.
This does not mean that the remaining life cycle stages, which are based on future scenarios, can be ignored. In fact, they are crucial to ensuring that today’s decisions do not shift environmental burdens into the future. A part of this is already achieved through continuing the current regulation of building energy demand and supply according to the EPBD. However, this does not include the remaining modules in the Use and End-of-Life stages. A separation of carbon regulation into an indicator for upfront carbon and a second indicator for a holistic whole-life cycle perspective that includes scenario impacts could bridge the dilemma and allow more tailored carbon regulation for these different areas, thereby reducing today’s emissions while avoiding trade-offs between upfront and lifecycle emissions.
Such separation mandates to exclude biogenic carbon from the calculation of upfront emissions in order to avoid misleading results. This adjustment will not change the incentive for or against using biomaterials, since biogenic carbon emissions are neutral and carbon storage may not be included in the calculation according to EN 15978. This manoeuvre requires data developed after the latest EPD standard (EN 15804:2012+A2:2019) that includes separate reporting of all parts of the GWP indicator (fossil, biogenic, LULUC) and will soon be the default for EPD’s.
Photo: Nordic Sustainable Construction
Biogenic carbon: The Nordic countries currently use varying definitions of Global Warming Potential (GWP). Finnish and Danish legislation use GWP-total, which includes biogenic emissions and emissions from land-use and fossil fuels. Sweden and Norway only include emissions from land-use and fossil fuels in an indicator called GWP-GHG. In the case of the two latter countries, where end-of-life carbon is not included, biogenic carbon cannot be included as it is based on the complementary modules A1-3 and C3 for the carbon calculation. Estonia will most likely require the reporting of both GWP-fossil and GWP-total in parallel. A separate upfront carbon declaration requires the use of the latest EN 15804:2012+A2:2019 EPD standard that includes separate reporting of all parts of the GWP indicator (fossil, biogenic, land use and land use change (LULUC)) and will soon be the default for EPDs. In EU-regulation, the new EPBD ‘life cycle GWP’ indicator corresponds to GWP total without subdivision. GWP total is equal to the GWP-GHG when reporting the full life cycle including stages A to C. However, they are not compatible when comparing module by module or assessing upfront carbon. This problem can be solved by reporting biogenic carbon separately, which will make the different GWP indicators compatible and comparable. The amount of biogenic carbon in products can be estimated from EPD data following the +A2 format in different ways. When biogenic carbon is provided in kgCO2e/functional unit, it can be reported as unchanged. If it is given in kg C/functional unit, it needs to be converted to kgCO2e by multiplying with 44/12. In cases where no specific value is provided, it can be estimated from the GWP-bio values in the A (product) stage. Especially the latter practice aligns well with the so-called environmental essential requirements that are mandated to be declared in an EPD set in the CPR Acquis process as the GWP-bio indicator is part of this pre-determined list. The revised CPR also requires covering the capability to temporarily bind carbon and other carbon removals “to the extent possible”, see ANNEX II: (European Parliament). The CPR Acquis process is ongoing, and binding interpretations are still missing. At the same time, the EPBD states that the life-cycle GWP indicator for building-level carbon declaration, in the energy efficiency certificate, may be complemented with “information on carbon removals associated with the temporary storage of carbon in or on buildings”. Whether this information needs to be reported as elementary carbon or kgCO2e. is not clarified. Furthermore, EPBD implementation also necessitates the addressing of carbon removals associated with carbon storage in or on buildings, however without specifying a method yet. While this requirement assumingly refers to long-term removals that could mostly be considered relevant for the carbon permanently bonded in concrete and cementitious products, however, biobased materials and products in construction can also offer a potential long-term storage of carbon biogenic such as the use of biochar and/or the multiple reuses of timber and other biobased elements, if they can be legally guaranteed. Combining the currently used indicators GWP-total or GWP-GHG with information on biogenic carbon stored in buildings is an important first step in improving modular comparability and adapting to future European requirements.
Building parts included: The decision on what building parts should be included in carbon assessments is related to the chosen life cycle scope. For example, when a scope is limited to upfront emissions A1-A5, the structure tends to be more important, while including the use stage makes short-lived components more relevant. Main differences among Nordic countries and Estonia concern site preparation, building services, external works and furnishing. Finland and Denmark include most building services, while Boverket suggests excluding solar panel installations in the Swedish limit values in 2025.
Exported energy: Member States must ensure the installation of suitable solar panels on new buildings as a consequence of promoting on-site renewables in the REPowerEU plan. The increasing amount and relevance of on-site renewable energy production requires appropriate calculation rules to account for the benefits of exported energy. Treatment of exported energy does not only involve decisions on how savings are allocated but also the supply chain impacts, which are the embodied impacts of the renewable energy systems. The ongoing revision of EN 15978 is expected to provide definitions for reporting exported energy in the new module D2 “Exported utilities”. It allows two approaches for allocating building generated energy production. In Approach A all impacts of the energy generating equipment is allocated to the building life cycle. In Approach B, only the proportional amount of impacts of the equipment corresponding to the energy consumed in the building is allocated to the building life cycle). These two approaches can lead to considerably different results, if a large share of the energy generated on site is exported. For harmonising results and steering effects, the Nordic report on data (Erlandsson, et al., 2024) recommends Nordic countries to use Approach A.
Use of future decarbonisation scenarios: Scenarios for a gradual decarbonisation of energy supply are applied in the Danish 2023 carbon limit value, and are being prepared or updated for Estonia, Finland and Sweden. The purpose are future carbon declarations and limit values and implementing upcoming changes in the EPBD. The updated emission factors for the next generation of Danish limit values in 2025 show significantly lower impacts compared to current emission factors, resulting in lower relative impacts in module B6 compared to other parts of the life cycle (Tozan, et al., 2023) and indicating the need to consider major changes in energy projections when developing and revising limit values. However, assessments in Nordic countries and the EU can only be comparable when using a common base for deriving the decarbonisation scenarios. The European Commission has developed high resolution scenarios based on national information and political decisions, which can therefore be used throughout Europe as a common source of data. These scenarios are derived from the PRIMES (Price-Induced Market Equilibrium System) model which is also recommended by LEVEL(s) framework. This does not mean using the PRIMES-based scenarios in the regulation, if a national regularly updated energy scenario exists, created by the national regulators, as the incentives and regulation for the decarbonisation of the energy sector differ country by country. To maintain both comparability and the use of more specific national scenarios, the Nordic experts on data within the Nordic Harmonisation project (Erlandsson, et al., 2024) recommend a double reporting since the scenarios selected can make a remarkable difference in the results.
It is worth mentioning that the development of district heating decarbonisation scenarios is complex, especially when the use of local data is allowable. If the operator refuses to disclose information on future investments, it is impossible to make reliable predictions regarding the local grid’s future decarbonisation. Aside from this complexity, the question of whether only national averages must be used, or the specific emissions of a local grid can be considered is also dependent on how much the location of buildings should be affected by carbon limit regulation.
Unlike energy supply in module B6, no Nordic country has considered mandatory decarbonisation scenarios for the remaining modules (B1, B2, B4, B5, C1-4) yet with the exception of voluntary frameworks like FutureBuilt and the 2025 DGNB Denmark pilot. The Nordic report on data8 presents a simplified concept to include future decarbonisation scenarios in the assessment focusing on providing the best estimation possible to create a decision support given existing knowledge and uncertainty.
Conservative standard impact data for building components and systems: Conservative standard values support the introduction of industry-wide carbon declaration by providing preliminary inventory data for the building model in early design stages and where specifications are not available. While standard built-ups can be provided by authorities or other actors (For instance, the standard component library in LCAbyg 2023 (Kanafani, Zimmermann, Stranddorf, & Garnow, 2023),the question is what standard solutions may be used directly in carbon declarations and what the allowed deviation between standard and the specific as-built solutions must be. This also includes a differentiation between prefabricated and in-situ deliveries such as timber elements, curtain-wall facades or space modules. Harmonisation can clarify these structure and supply of these standard solutions and their status in a regulation perspective.
Conservative generic impact data for construction products: Most Nordic countries have already developed a national database of generic emission factors, see Table 14. Generic data allows modelling complete inventories independently of the availability of EPD. This is especially important in early design stages, but also in as-built reporting, where specific data is currently lacking for numerous products. Conservative impact levels are key to encouraging building product manufacturers to publish EPDs and assessors to using specific rather than generic data. This incentive principle is important in the current regime, where the use of EPDs cannot be required by legislation due to EU market rules. Potential areas for harmonisation include areas that are not specified in the standardised calculation rules such as EN 15804, in particular the structure and content of the national generic emission factors databases and the guidelines for EPD developers by the national programme operators.
The selection and specification of building products for developing generic data has considerable harmonisation potential. Instead of providing a single generic impact level, one option is to provide a lower and upper emission level of selected products. Another difference in current generic values is the definition of the conservative level. Estonia and Finland use the average value of a sample of products plus 20%, while Norway and Sweden use 25%. Denmark defines conservative values as the upper quartile of a given EPD sample and multiplies it by 1.1. Also, the level of detail in product variants differs such as the variety of concrete classes or the differentiation between in-situ and prefab deliveries. Other products are presented in a version for indoor use and a version for outdoor use. Lastly, some products are classified in broad categories such as timber or in more detail such as pine, cedar and spruce.
Service lives of building components: Scenarios for B2 to B5 are often based on time intervals, dependent on on-site conditions or other parameters. However, information on interval definition is often hard to verify, so some countries require the use of default information. It is difficult, however, to conduct a systematic comparison of assumptions about the service lives of building components between countries when making carbon declarations, due to varying ways of describing and classifying building components and defining service lives. Finland provides both a short and normal component service life for relevant building parts to account for a higher wear-and-tear in certain highly frequented buildings such shopping malls and schools. Denmark uses an approach of assigning service life on the main material and the location of installation in the building. Norway recently acknowledged that the use of varied sources for service lives for building products causes variations in climate impact results, and in response, the committee responsible for revising the Norwegian national standard NS 3720:2018 has initiated work to publish harmonised reference service life values in 2024. The EU Level(s) framework also includes a table of suggested service life values, which indicates a potential upcoming EU harmonisation of component service life.
Table 13. Essential national methodological choices in terms of indicator, scope and accounting (as of June 2024).
Methodological choices in Nordic regulations | Denmark | Estonia | Finland | Iceland | Norway | Sweden | Europe | ||
  |  |   |  |  |  |   |  | ||
General | Reference unit definition | GFA for embodied HFA for operational | HFA | HFA | GFA | GFA | GFA | GFA | UFA |
GWP indicator | GWP-total | GWP-fossil and GWP-total (most likely) | GWP-total | GWP-total | GWP-GHG | GWP-GHG | GWP-GHG | GWP-total5 | |
Handling of biogenic carbon | -1/+1 method not handled separately yet | 0/0 and -1/+1 methods not handled separately yet | -1/+1 method also separately (GWPbio) and in carbon handprint (D4) | -1/+1 method also separately as per EN 15804+A2 (GWPbio) | 0/0 method not handled separately yet | 0/0 method not handled separately yet | 0/0 method not handled separately yet | -1/+1 method, temporary carbon storage may be reported (Annex V) | |
Assessment scope | Life cycle modules considered | 2023: A1-3, B4, B6.1, C3-4; D1 & D2 separate declaration 2025: A4-5 added individually | A1-3, A4, A5, B4, B6.1, C3-4; D1 & D2 separately | A1-3, A4, A5, B4, B6.1, C1, C2, C3-4; carbon handprint separately | A1-3, A4, A5, B4, B6.1, B6.2, C1, C2, C3-4; D1 separately | A1-3, A4, A5 (only waste), B2, B4 | A1-3, A4, A5 | A1-3, A4, A5 (planned to include B2, B4, C1-4 from 2027 in carbon declaration) | full life cycle scope; the Delegated Act will specify the minimum modules required |
Building model parts included | Substructure (piling: allowance for exclusion) Superstructure Building services (without electricity and firefighting systems) External works (partly) | Substructure Superstructure Building services | Substructure (foundations: only declaration or excluded1) Superstructure Building services Furnishing (only fixed) | Substructure Superstructure Building services | Substructure (only pile and shallow foundation) Superstructure (without stairs, ramps and balconies) | Substructure Superstructure PV panels | Substructure (piling: only declaration from 2027) Superstructure Building services (for some building types; PV panels: only declaration from 2025) Furnishing (only fixed, for some building types) | EPBD refers to LEVEL(s): Substructure Superstructure Building services External works3 Furnishing | |
Other | Exported energy calculation | Inclusion of max. 25 kWh/m²/year renewable energy (embodied + operation)2 | To be clarified | Exported energy is part of D3 | To be clarified | Not applicable | Not applicable | Exclusion of solar cells (embodied + operation) in the 2025 limit value, and only separate reporting | prEN 15978 proposes two approaches4; The Delegated Act may require a specific approach |
Handling of long-term carbon removals | Not yet specified | Not yet specified | Not yet specified | Not yet specified | Not yet specified | Not yet specified | Not yet specified | Must be addressed, no further specification of a method yet (Article 7) | |
Template to use when reporting the LCA | Voluntary template to help more uniform submissions (the 2.0 Standard format for LCA delivery) (BR18 - Bygningsreglementet, 2021) | Not yet specified | Not yet specified | online reporting format | No specific format | mandatory data reporting format prepared by Boverket | requires a digital logbook (no specification yet) | ||
| |||||||||
   |  | ||||||||
Table 14. National choices of critical scenarios, use of generic emission factors and standard values (as of June 2024).
Generic data and scenarios in Nordic regulations | Denmark | Estonia | Finland | Iceland | Norway | Sweden | Europe | |
  |  |   |  |  |    |  | ||
Decarbonisation scenarios | Energy decarbonisation scenario for B6 (operation) | Yes 2023: Danish national policy scenario (2020) 2025: new national policy scenario1 | Yes Estonian national policy scenario (2023) | Yes Finnish national policy scenario (to be updated 2024/Q3) | No Iceland already has 99% renewables and district heating | Not relevant B6 is excluded from the scope. | Not relevant B6 is excluded from the scope. May become relevant from 2027 where carbon declaration is planned to include B6. | Yes Level(s) chooses EU PRIMES model (EU Reference scenario) |
Decarbonisation scenarios for B/C modules (embodied) 2 | No | No | No | No | No | No | No | |
Generic emission factors | Data source (base) | Table 7 in Appendix 2 of BR18, §297 | Approved national generic data expected in 2024 | no national generic database for building products yet, EPDs or other generic databases are used | no national generic database for building products, EPDs are used | Boverket’s climate database | No specific plans for development of a common European database | |
Conservative emission factors | New generic data for specific product types are based on the 75% percentile of related EPD Danmark values3 | 1.2 | 1.2 but not for energy and fuels emission data | 1.25 added only if not already included | 1.25 added only if not already included | 1.25 but not for energy and fuels emission data | No specific proposal | |
Standard values | Building elements4 (kgCO2e/m2) | Building services (for A1-3, C3-4: 33-62 kgCO2e/m2; range due to differences per building type) | Building services (for A1-3: 42-125 kgCO2e/m2; for B4: 6,1-141 kgCO2e/m2; range due to differences per building type) As a rule, CO2 data.fi also includes C3, D, but not for the broad standard values for building services available per type of building | Building services (for A1-3: 56-94 kgCO2e/m2; range due to differences per building type) | Not relevant | 2022: No 2025: Building services (for A1-5: 12-60 kgCO2e/m2) Internal finishes and furnishing (for A1-5: 22-53 kgCO2e/m2) | No specific proposal | |
Life cycle modules4 | No | Under investigation | A4, C2 (20,4 kgCO2e/m2) A5 (43-59 kgCO2e/m2) C1 (10 kgCO2e/m2) | A4 (19.8 kgCO2e/m2) A5 (42.5 kgCO2e/m2) C1-C4 (43.75 kgCO2e/m2) B6: average data on energy consumption | No5 | Yes, derived from a study, but only provided as a guide, project-specific values must be used. | No specific proposal | |
| ||||||||
   | ||||||||
4.3 Influential variables for limit values
- Current approaches to carbon declarations and limit values vary in terms of included building parts and processes, especially deep foundations, external works, building services, interior finishes and refrigerants. Harmonisation should focus on deep foundations, external works and building services, as they represent the most significant variability.
- The question frequently is raised as to whether carbon limits should not influence the choice of location, which would potentially result in location-sensitive factors such as module A5, special types of foundation and soil stabilisation, as well as basement parking and outside areas being excluded from the assessment scope, or alternatively treated with separate limits and exemptions for extreme cases.
- All countries use different definitions for the building reference area and whether or not it includes basements, balconies, circulation areas and external walls. Further, basements and balconies may lead to higher or lower total impacts, depending on the overall carbon level. Harmonisation and improved comparability can be approached by developing a common definition for the “useful floor area” for preparing the implementation of EPBD and Level(s) that can be used in parallel with already well-established national definitions, or by providing conversion factors between national definitions.
- Expected future changes in module B and C scenarios or delayed emissions are approached differently in the Nordics. Despite the trend to apply a decarbonisation scenario for operational energy impacts in module B6, no national method in the Nordics have implemented dynamic scenarios for replacements and waste treatment. A harmonisation effort should be discussing how these approaches could be aligned and if the French method of discounting future emissions has the desired steering effect.
- Large differences are observed between generic emission factors found in Nordic national databases. This partly reflects actual differences between products found on each national market, but part of the difference also relates to differences in approaches to derive conservative generic emission factors.
- Finally, the building stock analyses for deriving carbon limits has a significant influence on the comparability of regulation. Harmonisation may lead to common criteria for defining building stock representativity, so that potential archetypes and building samples can be developed and selected on a common basis in order to limit cross-national differences to actual variation in the stock and not method.
Several features of the LCA method and the data used to set and assess limit values influence the level of these limit values and the possible outcomes of the assessment. Data involves both the building cases (and their characteristics) used as a basis to derive the limit values, and the product-level data used for calculating the impact of the building cases. This section gives an overview of some of the most important methodological points that must be considered in the process of setting limit values. It builds on published analyses in Nordic countries as a primary focus, supplemented by illustrative calculations when necessary to further highlight the potential importance of certain variables.
4.3.1 Building and life cycle scope
Table 13 – which presents an updated and summarised version of the comparative mapping of various aspects and details causing variation in Nordic methods provided in the report “Harmonised Carbon Limit Values for Buildings in Nordic Countries” (Balouktsi, Francart, & Kanafani, 2024) – shows that current Nordic climate regulations or proposals apply varying parts of the life cycle and differ in the building components included. It is important to understand the scale of limit value variation caused by the incompatibility of scopes. Furthermore, it is important to understand what it means for an initial limited limit value scope to expand with more modules and building parts in future revisions, considering that (a) in some Nordic countries this is already planned or investigated, as well as (b) the declaration of a whole life cycle scope and a minimum scope for building description for building carbon footprint will be requested by the revised EPBD from 2028. On the other hand, the scope of the initial and progressing limit values in the required national roadmaps according to EPBD by 2027 is still unclear. Often raised questions relating to scope include:
- Site preparation, soil stabilisation, site reinforcement and special foundations: Special foundations like piles are referred to as part of the minimum scope in Level(s) but are often omitted in Nordic carbon declarations and even more so in carbon limits. Depending on soil conditions, their impact can become a significant hotspot (Aspect 1, Figure 11). An exclusion would remove a relevant process from regulation, however their inclusion will create a steering effect towards building in locations with acceptable soil conditions and challenge the freedom of choosing land for development.
- Parking basements: When including both their relatively large floor area and minor material inventory, the relative contribution of parking basements will currently often lead to a lower climate impact per m2. However, in a future low-carbon construction context, parking basements will no longer provide an easy way to meet limits, because they offer limited opportunities to reduce impacts (Aspect 2, Figure 11) A regulatory option would be including only a share of their floor area in the reference area, or reporting them separately with a different limit value than the rest of the building. Level(s) specifies that if parking basement accounts for more than 25% of the total useful floor area, the traffic area of the parking must be subtracted from the total useful floor area.
- External works: External works can make up a significant share of total impacts, depending on building type and the included elements such as infrastructure, landscape or secondary constructions (Aspect 3, Figure 11). Their potentially large contribution and mentioning in Level(s) makes it important to define the exact scope of “external works”. They generally cover any area outside the building footprint but within the site boundary and can include ground-level elements such as hard and soft landscaping, terraces and roofs as well as below ground items, such as irrigation tanks. External structures may use varying types of materials and require maintenance based on traffic. They may also include solar or geothermal energy generation as well as carbon sequestration by vegetation or carbon removal through concrete paving carbonation, affecting both B6 and B1 modules respectively.
- Construction site impacts: The impacts can be significant and can exceed module B6 in case of low-carbon energy supply (Aspect 4, Figure 11). Some Nordic countries already apply calculation rules for module A5, but use diverging scopes. All include energy and fuel consumption, except Norway, which only includes waste (while fuel consumption is regulated by not permitting the use of oil to heat on construction site). Sweden excludes ground works and therefore a considerable share of fuel associated with it. Differences in regulation approaches for module A5 reflect the fact that carbon emissions are strongly influenced by location, both regional and international, due to energy grids, material supply, geology and other factors. A regulation approach, which is willing to influence choice of site, module A5 may include site-sensitive processes based on energy and fuel consumption. When carbon limits should not interfere with the choice of location, A5 may have to be restricted to material wastage alone. A more universal alternative is developing a separate limit value for module A5 for avoiding interference with other modules, eventually differentiated by regional differences such as climate.
- Building services: Their impact can be significant in buildings such as institutions or offices, which is due to the use of metals and electronic components that need to be replaced during the building’s service life. Considering the leakage of refrigerant fluids in the use stage can also influence the results, since these are potent greenhouse gases (Aspects 5 and 6, Figure 11). The new EU Regulation 2024/573 on fluorinated greenhouse gases will limit GWP to 750 kg CO2e/kg from 1st January 2025 for new systems and maintenance of existing ones will reduce the significance of refrigerant impacts.
- Internal finishes and fixed furniture: Internal finishes (i.e., wall paints, flooring materials and suspended ceilings, among others) are expected to be included in the scope of all Nordic countries by 2026 (and are already included in Denmark and Norway), while fixed furniture has only been so far planned to be considered in Sweden and Finland. Like building services, the impact of finishes and fixed furniture can be significant primarily because of the need for replacement and maintenance in the Use stage (Aspect 7 and 8, Figure 11) Therefore, assumptions about replacement frequency considerably influence their calculated impact. Finland has notably introduced differentiated service lives for certain elements depending on the building type, where schools and offices will have a higher replacement frequency for partition walls and floor surfaces compared to housing.
- Maintenance and other often neglected life cycle modules: B2 typically has a low relative importance (Aspect 9, Figure 11), but is useful for demonstrating the advantages of low-maintenance buildings. It may also encourage producers to state this information in EPDs. Beyond climate impact, maintenance-intensive products can have a great effect on life cycle cost and other environmental and health-related indicators. C1 and C2 typically have low importance but are intended to be included in some assessment scopes for completeness (Aspect 10, Figure 11).
LCA scope aspect (building part and/or LC process) | Absolute impact (kg CO2e/m2/yr.) | (Average) median | Notes | ||
|---|---|---|---|---|---|
Context- and location-specific aspects | 1 | Building part: Deep foundations/ Soil stabilisation (A1-3) | 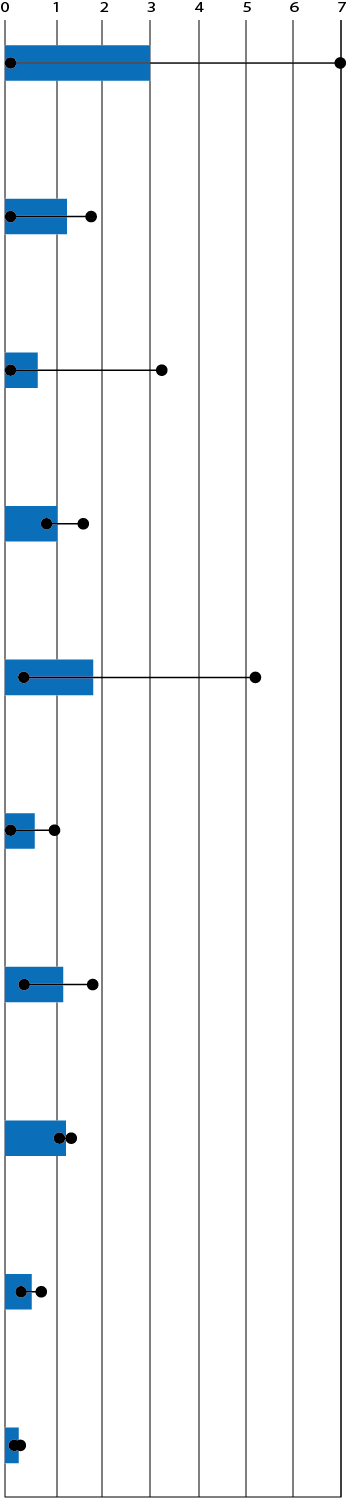 | 2.90 | based on a Finnish study by OneClick LCA Ltd (2021) and BUILD report 2020:04, with the latter not including soil |
2 | Building part: Basement parking (A1-3, C3-4) | 1.20 | based on a Finnish study by OneClick LCA Ltd (2021) and three Danish cases with a basement parking (BUILD report 2023:21) | ||
3 | Building part: External works/ Landscaping | 0.50 | the mean value is based on a Finnish study by OneClick LCA Ltd (2021) and the highest value on ZEN report 2020:24 | ||
4 | LC process: Construction site (A5) | 1.00 | based on a Danish study of 52 construction sites (BUILD 2023:21) | ||
Other often missing aspects | 5 | Building part: Building services (A1-3, A4-5, B4, C3-4) | 1.80 | based on the standard values given in Denmark (A1-3, B4, C3-4), Finland (A1-3, B4), and Sweden (A1-5) per building type | |
6 | LC process: Refrigerants (B1) | 0.58 | based on a Danish study of 10 cases which assumes 2% annual leakage rate (BUILD 2023:23) | ||
7 | Building part: Fixed furniture (A1-5, B4) | 1.10 | based on the A1-5 standard values given in Sweden per building type (Malmqvist et al. 2023) and an estimation for B4 | ||
8 | Building part: Internal finishes (A1-5, B4) | 1.20 | based on the A1-5 standard values given in Sweden per building type (Malmqvist et al. 2023) and an estimation for B4 | ||
9 | LC process: Maintenance (B2) | 0.46 | based on a Danish study of 10 cases (BUILD 2023:23). The median value is more than halved if glass replacement is in B4. | ||
10 | LC process: Deconstruction and transport (C1, C2) | 0.17 | based on a Danish study of 10 cases (BUILD 2023:23) and the standard values considered in Finland | ||
Figure 11 Impact of excluding building parts and life cycle modules from the limit values scope, selected based on the countries’ differences identified earlier. The studies used as a basis are presented in Appendix A. The values are indicative as the number of studies is low as well as the include various scopes and background data. If more than one study is used as a reference the average of the median values in the considered studies is taken into account.
4.3.2 Building reference area
LCA methods used in the various Nordic countries use varying reference area definition to normalise the results per m2, see the report “Harmonised Carbon Limit Values for Buildings in Nordic Countries” (Balouktsi, Francart, & Kanafani, 2024)
Please note that for Finland, Table 6 of this report incorrectly includes balconies as part of the heated reference area.
- External walls
- Basements
- Stairs, corridors and common facilities
- Rooftop terraces, balconies and other areas outside the building enclosure
The significant influence of area definition is illustrated in Figure 12 for an apartment building calculated using different reference unit areas, while keeping all other parameters, especially different national inventory scope, constant. Area definition affects the influence of certain building design choices. In mid-carbon level buildings, basements will decrease emissions per area unit, unlike low-carbon buildings, where basement have the opposite effect. Currently, all Nordic countries include basements in their reference area, although Finland and Estonia only include heated or semi-heated ones. In the case for having balconies in Finland, Norway and Sweden, where balcony area is omitted from the reference area, the emissions per m2 slightly increase. In Denmark, balcony area is included with only 25% in order to avoid disproportionate influences of balconies and other external areas on the overall building impacts, and therefore a smaller increase in normalised impacts is observed.
None of the Nordic countries currently applies the “useful floor area” definition from Level(s) framework. As the revised" - i.e. As the revised EPBD calls for more harmonisation of building LCA at the EU level, results should ideally be reported per useful floor area, at least in addition to the reference area used in each country. It remains to be seen whether the Delegated Act implementing the EPBD will call for a uniform use of useful floor area or allow for different national reference areas; the Nordics could work towards a common unit definition by 2025 along with continuing use the national one, to be ready for an implementation of the EPBD by 2028 or could examine possible conversion factors between national definitions.

Figure 12 LCA results for an apartment building (without basement or balconies), and for the same building with added unheated basement and added balconies, normalised using different definitions of reference area units from the Nordic countries and Level(s) (see Table 6 of report “Harmonised Carbon Limit Values for Buildings in Nordic Countries” (Balouktsi, Francart, & Kanafani, 2024)). Note: the scope of the life cycle inventory and the background impact factors are similar in all cases. Only, the reference area changes. Norway is the only country not including “Balconies” and “Stairs” in the method scope, but they are included here to focus on differences solely coming from the area definition.
Because of many system boundary variations, employing a common useable floor area definition does not produce comparable carbon declarations; however, combining it with disaggregated reporting into life cycle stages and building elements provides a first good step towards this direction. Furthermore, differing secondary conditions connected with useable floor areas, such as temperature limits for heated areas and variances among countries, would also necessitate changes which is connected to additional challenges for the industry and the overall national statistics currently based on energy certification register.
Although all limit value definitions are based on a reference area, other complementary ways of normalising LCA results are being discussed in the Nordic countries. If suitable data are provided, this can easily be addressed digitally. In particular, normalising results per resident or building user could help account for how efficiently the space is used. Space sharing and compact housing strategies are seen as essential to deep decarbonising the building sector, whereas targets normalised per m2 do not stimulate better space utilisation. Since area-based metrics are easily verifiable and appropriate to assess a building’s technical properties, it can be appropriate to combine them with complementary use-based metrics.
4.3.3 Future scenarios in B and C modules
Assessing future life-cycle modules occurring after handover, involves making assumptions on component service lives and end-of-life processes including both the technological and regulative context, which may be outside the realm of building regulation. Unlike assuming current practice for scenarios, a recent trend includes making assumptions on the expected future development of boundary conditions. The decision for or against using dynamic scenarios reflecting technological progress in modules B and C, or applying discount factors for future emissions, substantially impacts the steering effect of carbon limits.
Discounting factors: The simplified dynamic approach in the French RE2020 regulation increases the influence of current emissions over future emissions. Essentially, one tonne of CO2 emitted today is considered to have a larger climate impact than being emitted in 2050. The EN 15978 and Level(s) method under revision may allow national legislative approaches including dynamic scenarios, however no consensus exists on how discounting factors will be designed. Figure 13 (a) illustrates the significant influence of dynamic scenarios on results. Here, a typical Danish single-family house is calculated with the same data without discounting material impacts according to current legislation and with the French time-dependent factors applied. The main argument against the discounting approach is that it leads to negative impacts for wood products, because the biogenic carbon neutrality according to EN 15978 is lost (-1/ + <1). This leads to beneficial incentives for using large amounts of wood instead of using renewable resources more efficiently.
Technology improvement factors: Although no national carbon declaration method considers any future technical progress for post-handover modules other than B6, voluntary methods exist that address future developments in modules following simplified approaches (i.e., considering one or two variations of technology factors), such as the FutureBuilt method in Norway
FutureBuilt Zero follows a simplified approach, where: (a) a technology factor of 0.33 is assumed for the production of PV systems in year 30; (b) for other material-related processes (production, transport and waste incineration) an 1% annual technology development is used based on historical development in Norwegian industry. Therefore, the same development is assumed for all building materials, except for energy-producing equipment (solar cell systems) where the reduction is assumed to be greater (Resch, et al., 2022).
The updated RICS method which forms the basis of future regulations in the UK proposes an additional reporting with a partial use of simplified decarbonisation scenarios, where for B1 associated with fugitive refrigerant emissions, B4, C1-2 and D1 a 0.5 decarbonisation factor is applied. No decarbonisation is considered for: (a) biogenic or LULUC carbon emissions at the end of life of biobased material, as well as fossil carbon emissions at end of life from incineration or energy recovery (for example from plastics), as they are a function of their carbon content, unless carbon capture, usage and storage (CCUS) is used (no rules in Europe about how to include CCUS scenarios as part of the calculation of impact so far are present); (b) removals by materials such as concrete in B1 as they are a function of the original materials installed and not subject to change over time. Refrigerant emissions are, however, assumed to decarbonise over time due to replacement with less harmful refrigerants.
DGNB intends to account for a dynamic effect of climate impact, including both a time aspect for where-when an emission takes place, as well as an estimate for the technological development of material production (assumed as 1%).
Although the development in emission intensity from material production will depend on material types, simplified approaches are useful considering the high uncertainty of all the industry roadmaps and related scenarios. However, there are studies offering detailed analysis per material type, and therefore how the consideration of such issues in the emission factors of future construction products may look (Alig, Frischknecht, Krebs, Ramseier, & Stolz, 2021). According to a Swiss study creating future emission factors for several material types, a Swiss office building calculated dynamic effects in future replacements and End of Life (EoL) (B4, C3-4), has 20% lower impacts (See Figure 4.7 from the report: (Lützkendorf & Balouktsi, 2023)). When applying EU-wide decarbonisation scenarios for modules B and C to the present SFH case results in a decrease of 10-15% (Figure 13b). The significance of this effect raises the question, if a partial decarbonising factor for only one process such as B6 can be justified due to a potentially misleading incentive. Erlandsson, et al., (2024) recommends using one decarbonisation scenario for modules B1.2-B5, B7, and C1-C4 for simplicity, on the side of the typically used decarbonisation scenarios for B6.
The suggested scenario to use for modules other than B6 is the EU Prime scenario called “Total GHG emissions, excl. international excl. LULUCF”.
Typical SFH case | Timber SFH case | Typical SFH case | Timber SFH case |
Typical SFH case | Timber SFH case |
Typical SFH case | Timber SFH case |
Figure 13 (a) Effect of discounting future emissions according to the French approach for two different construction types of a single-family house (SFH), calculated with the updated Danish generic emission factors (to be in force for the 2025 building regulation/BR25) and scope; b) Effect of using simplified decarbonisation scenarios according to EU Calc Reference Scenario (Tech factors 1, corresponding to 1.20% annual improvement for the main products, i.e. minerals and metals) and EU Calc Tech scenario (Tech factors 2, corresponding to about 2.50% annual improvement) which provide the decarbonisation rates of energy in industry including steel, cement, lime, wood etc. The balance -1/+1 is preserved for wood in (b).
4.3.4 Generic emission factors for construction products
Variation in current national generic emission factors affect impact results considerably. In the shown example (Figure 14), the largest deviation in results is 28% and occurs with data from Denmark and Sweden for modules A1-3.
Some of the differences between generic emission factors rely on actual product differences in national markets and eventually from import. The other part of the differences comes from different assumptions and methods behind generic data. Generic data is commonly set on conservative emission levels in order to maintain the incentive for developing product-specific data. Countries use different approaches to define this conservative margin as previously shown in Table 14, which have a major influence on limit values. These aspects are feasible to harmonise across countries (see the Nordic report on data (Erlandsson, et al., 2024) for more detailed recommendations):
- Collecting a sample of product EPD based on common selection criteria and data structure. This cross-national data foundation can then be adjusted for emission levels based on regional market characteristics to reflect national representativeness.
- Countries that are interested in developing a generic database for construction products in the Nordic region can join efforts and create a generic database for low-volume construction products that can be shared among several countries. One or more product EPDs can be selected as representative for the products consumed on the Nordic market.
- The level of conservative factors can be defined jointly. Although the use of conservative values is justified, it should be as small as possible. Conservative factors should be a temporary measure and phased out after the initial stage of carbon regulation in order not to overestimate building impacts. In the long run, voluntary EPDs will be replaced by a mandatory declaration according to EU product regulation (CPR), removing the demand for conservative factors and improving the possibility of assessing and monitoring the real impact levels.
Regarding the latter, significantly tighter limit values encourage the use of product-specific EPDs in the meantime, because they enhance the chances of meeting the requirements. The calculation for Denmark, shown in Figure 14, has been based on the updated Danish impact data for energy supply services and construction products, which will be effective from 2025. However, the overall performance does not align with the newly established value of 6.7 kgCO2e/m2/year for single-family houses as of 2025. To ensure compliance, it will be necessary to utilise product-specific data and make better design choices.
(a)
(b)
(c)
(a)
(b)
(c)
Figure 14. LCA results for a single-family house with aerated concrete walls, normalised using the same reference unit area and applying: (a) the different scopes in terms of life cycle modules and building parts and generic emission factors from Denmark, Finland and Sweden; (b) the same scope (i.e. parts are excluded from each method to reduce to the same building model) to detect the differences coming from data; (c) Examples of differences in generic emission factors for the products explaining the biggest share of the variation in this particular building case. Note: the new Danish data is used for this calculation, which is not yet integrated into Table 7 of BR18 (Kragh & Birgisdottir, 2023). The new Danish independent limit value for the construction process, A4-5 (effective from 1 July 2025), corresponds to an additional 1.5 kgCO2e/m2/year and is not shown in the graph (a). The percentual values represent the differences between SWE and DK data. Underlying figure data are provided in Appendix B.
4.3.5 Approach used to set the limit value
There is no standardised approach for selecting and analysing reference data for deriving carbon limits. Current approaches broadly include are either based on an archetype or sampling method, see also Section 3. Building stocks are complex and vary in many ways, requiring a deliberate method for justifying building carbon regulation. Apart from building properties such as use, size, typology, construction principle or location, building age is particularly sensitive as it reflects the decarbonisation progression. A maximum completion age of, for instance, 5 years is necessary to achieve a representative temporal representativity. However, even by doing so, the building sample would still reflect regulations which are around 6-8 years old, measured from building permit and representing the construction approach of around 7-10 years ago in terms of design and technology.
Examples of sampling and archetype approaches: The background reports from Denmark (Tozan, et al., 2023) and Sweden (Boverket, 2023) represent sample approaches by basically applying repetitive case studies. Representativity increases with the number of cases and the possibility of adjusting the case selection based on the data analysis. The cost-effectiveness and accuracy will also increase, as the sample size grows with mandatory carbon declarations and a systematic case collection. The Danish approach for determining carbon levels from the sample is a progression from the reference year 2023, where 90% of buildings are meant to comply with the lowest level in 2029, with which 10% of the building reference should comply. It was recently agreed (May 2024) that the 2025 threshold along this progression corresponds to 15% of the existing building reference sample should be able to be adhered to (Danish Ministry of Social Affairs, Housing and Senior Citizens, 2024). The archetype approach has been applied in recent EU (Lavagna, et al., 2018; Le Den, et al., 2023) and national projects (Utstøl & Marwig, 2022; Nørsterud, Andvik, & Fuglseth, 2023; One Click LCA Ltd, 2021; Buschka, Bischof, Meier-Dotzler, & Lang, 2021). It allows to control and vary building specifications dynamically opposed to the sampling method, where most parameters are composed randomly and cannot be changed. The number and configuration of archetypes determine the granularity of the possible analyses. The initial development of an archetype model for building stocks requires a large amount of statistical data on the building and stock level such as building use, typology, composition, energy use and so on. Both approaches are valuable and provide different ways of understanding the status quo and the decarbonisation potential.
By monitoring how actual projects perform in relation to the limit values, insights can be gained regarding the development of future limit values, keeping in mind the time gap between the case database and state-of-the-art construction. For instance, if a large share of projects manages to fulfil the limit value without major design changes, the limit value can probably be tightened significantly. Monitoring the real performance of the building stock also presupposes a gradual phasing-out of the conservativity factor in generic data as the number of specific EPDs increases and the development of robust industry averages for more product types becomes feasible.
4.4 Further implications
- Carbon limit levels determine whether decarbonisation in the supply chain will be sufficient for compliance, or whether building design changes are required.
- Implications for structural design and architecture are ambiguous, because technological innovation and assessment methods do not suggest major transitions, but rather multiple small adjustments.
- Carbon limits provide a manageable mitigation of environmental impacts of construction; however, they clearly narrow down the overall environmental implications of construction which need to be addressed in the future.
- Building-level carbon limits will scale the innovation level for decarbonising the supply chain, but require other policy instruments.
- Additional consultancy cost for carbon assessments is estimated about 0.14 - 0.5% of the construction cost.
- Additional cost for unconventional design and product choice has not been estimated and relies on the time progression of limit values. Higher cost must be considered, when the mitigation demand is greater than the evolving decarbonisation in the supply chain.
- Sufficiency-based targets for building less, smaller or with lower quality standards are not discussed, but may become vital for achieving ambitious climate goals, which cannot be resolved with relative carbon limits.
Introducing this type of novel carbon regulation entails potentially far-reaching consequences. The construction sector has to adapt to the new regime implying new practices for planners, designers and contractors, but also for material suppliers and the rest of the value chain. Conventional construction activities with high carbon emissions will be phased out and low-carbon solutions will be demanded.
In this section, we discuss some of the most likely consequences of progressively tightened carbon limits. In practice, the occurrence of consequences will depend on the level and speed of limit values and the order and intensity may vary. Also, national economies, digitalisation and material supply are only some of many variables, which affect potential impacts, but are difficult to foresee. This complexity entails a considerable uncertainty, and impacts should be assessed regularly in each specific national context along with the ongoing progression of limit values.
4.4.1 Building design
Carbon limits will affect building design and material choices, if conventional solutions are unable to decarbonise their production processes at a sufficient pace to comply with low-carbon requirements. High limit value levels such as the current 2023 regulation in Denmark, will still allow projects to comply without significant changes in design or material choices. Even tighter limit values might not necessarily impose changes in design and material composition if the supply chain is able to reduce carbon intensities more than expected at the time of developing limit values. For example, the Finnish draft regulation proposal acknowledges that even without building carbon limits, building emissions would still decrease due to the expected decarbonisation of energy production. By 2035, the emission reductions of the built environment with this course of development could reach 30–35 percent of the 2020 level, if the decarbonisation of the energy sector proceeds as planned. Similar considerations are also examined in other Nordic countries by different stakeholders.
Current Danish study estimating 51% reduction of consumption-based emissions of construction sector between 2021-2030 and translating this change as an expectation for the average climate impact from new construction in a “frozen policy” perspective to fall from approx. 10 in 2021 to approx. 5 kg CO2/m2/year. (Byggeriets Handletank for Bæredygtighed, 2024)
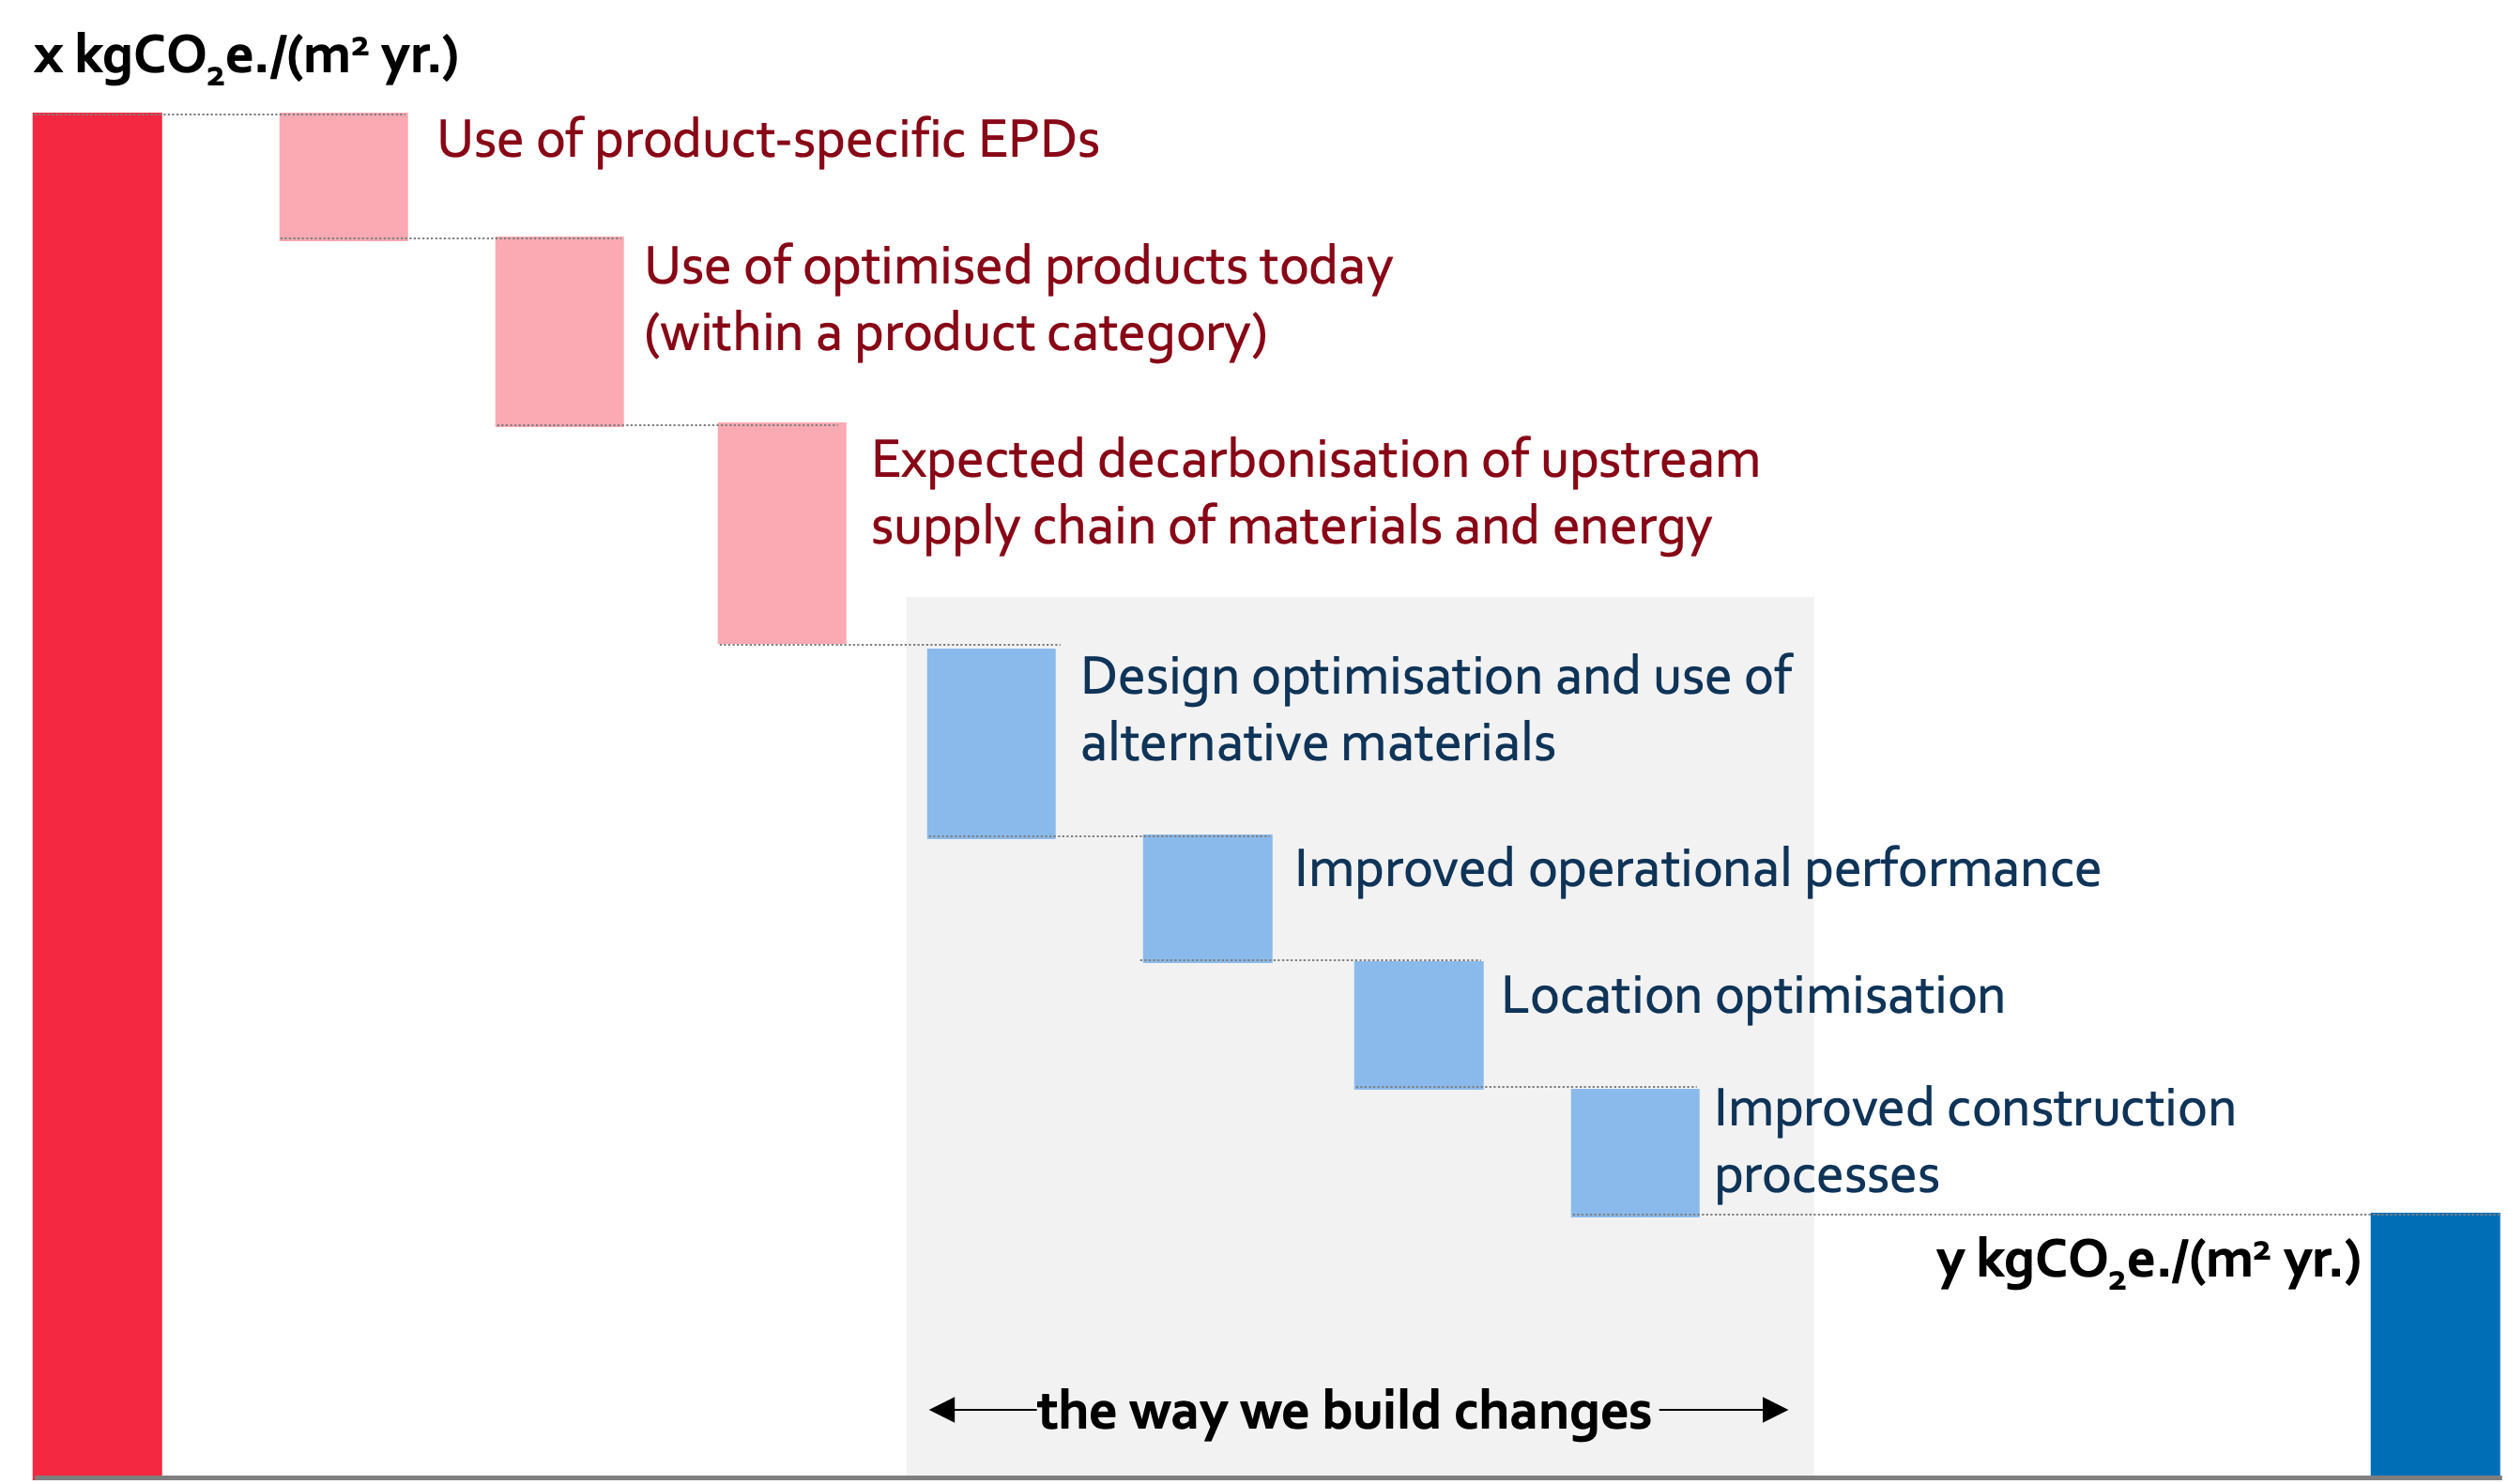
Figure 15- Schematic representation of reduction potential distinguishing between measures of low effort for the designer/consultant (use of different data, choose of better products within the same type, changes in the upstream chain) and optimisation measures.
However, when limit values are tightened, or if decarbonisation of the supply chain is not as far-reaching as expected, changes in building design and material choices might become inevitable. Figure 16 shows result of a case study focusing on consequences of variations in building design, without considering other parameters such as supply chain scenarios. This shows embodied impacts of different variants for an archetypal apartment building. It applies the Danish reference area and current Danish generic data without material decarbonisation scenarios. Results should not be generalised, but illustrate potential effects of carbon limits on design choices.
Structural frame material | Internal wall surface | Façade material | Balconies | Basements, unheated |
CONS Concrete elements | NOR Normal surface | CONF Concrete sandwich | BALC Yes | BAS Yes |
CLT Cross-Laminated-Timber | HIGH High surface | BRI Brick | No | No |
WOOD Wood |
Figure 16. Example of embodied climate impacts (A1-A3, B4, C3-4) of an archetypical apartment building, for various combinations of the parameters above.
Photo: Almanakken, Sweco DK
If a hypothetical limit value for embodied carbon were to be set at 7 kgCO2e/m2/year, almost all designs with a concrete frame would overshoot the limit. This implies that a shift to cross-laminated timber (CLT) or other low-carbon structural materials would be necessary (or that the production of concrete would need to be thoroughly decarbonised). If this arbitrary limit value were to be tightened to 6 kgCO2e/m2/year, all designs with brick facades would also become unfeasible. This illustrates that a tightening of limit values would constrain material choices and potentially restrict the use of common mineral materials, unless a deep decarbonisation of production is achieved. Particularly tight limit values might also constrain other design choices. For instance, balconies lead to higher emissions per m2 (among the ten variants with the lowest emissions, only one has balconies). If designers are required to be highly ambitious in minimising embodied emissions, they might therefore be led to avoid balconies or design them with alternative solutions, in the absence of deep and fast decarbonisation of concrete and brick industries
This is tied to the definition of the reference area, which in Denmark only includes 25% of the area of balconies. Conclusions might be different with a floor area that includes all balconies (see section 4.3.2)
4.4.2 Architectural expression
In most Nordic countries, low-rise buildings in structural timber are the norm, however, the use of wood in mid-rise buildings is a non-standard solution. Wood buildings are often associated with visible wood surfaces, however, depending on climate zone, wood might not be ideal for use as façade cladding for durability and maintenance reasons, especially in multi-story construction. Some of the major implications of limit values for building design affect mid-rise buildings and their expected transition from a structural frame in concrete or masonry to timber. Apartment buildings, offices or public institutions may be those types of building, which will undergo the most visible changes in expression. Unlike facades, roof cladding does not underlie a clear trend towards certain solutions and has therefore more moderate architectural consequences.
From the perspective of inhabitant perception, mid-rise structural timber buildings often expose wooden ceilings, walls or floors. However, this is not a must, since it is possible to clad surfaces in other materials as well. A recent study from Finland (Karjalainen & Ilgın, 2021) among inhabitants of novel timber housing units reveals general satisfaction after several years of residence, apart from the wish for better sound insulation.
Recent timber light house projects show a clear tendency of exposing wood on the interior as well as on the façade, assuming a currently high value of wood in construction.
Concrete, aluminium, facing brick and glass are often preferred in mid- and high-rise structures due to low maintenance and durability. However, they are among the largest carbon impact products in the current state of manufacturing processes. Steel offers a comparatively low-carbon substitution for aluminium without affecting the design. Curtain walls are often the preferred choice in mid- and high-rise buildings and include a dominant use of glass. At the same time, curtain walls challenge building energy performance due to high heating and cooling demand. A reasonable alternative in mid- and low-rise buildings are solid façades with punctuated window holes allowing a greater freedom of material choice and a glazing percentage balancing daylight and insulation performance. Here, biogenic materials, stucco, metals and ceramics might offer new architectural expression balancing carbon emissions, exposure to climate or mechanical force and maintenance.
Brick facades and tiles roofs play a key role in the cultural identity in many central European cities and landscapes. While vernacular architecture was dominated by cheap and easily available materials like timber, stone and sun-dried clay, the pre-modern devastating city fires have promoted the use of inflammable brick walls. This tradition has been continued in the last decades with insulated, facing brick facades, cladding load-bearing walls made of other materials. The reduction of the amount of brick material in exterior walls can be continued by using ceramic tile systems, which offer a similar durability at lower carbon emissions. This may however fail to express the sturdiness, durable monumentality, and decorative modelling options of a deeper masonry wall. The cultural reference to bricks and tiles, however, can be challenged by going back just a little more in history, where unburnt minerals, timber and crops were the cultural norm. This requires at least planning authorities to rethink zoning and cultural heritage goals. Alternatively, a higher re-use rate of bricks and bricks burnt with renewable energy might allow continuing brick facades for selected, culturally relevant, buildings.
4.4.3 Illustration of other environmental impact categories
Isolated indicators like GWP risk overlooking other environmental indicators and resource categories. This section shows a quantitative assessment of other environmental indicators applied to the archetypical apartment building study shown before. For each variant and each environmental category, environmental impacts are expressed as a percentage of their value in the base case (a building with balconies, no basement, a concrete structure and a brick façade) (see Figure 17).
More importantly, a shift from concrete and bricks to biogenic materials (which might be encouraged by a tightening of CO2e limit values) has important implications for other impact categories. Using a wood façade instead of a brick façade leads to lower impacts in most categories except for the use of renewable resources, where it understandably leads to higher impacts. However, the use of a CLT structure appears to lead to higher impacts in the categories of ozone depletion, eutrophication, and photochemical ozone formation as well. It is unclear why this is the case, as data quality in these other impact categories, unfortunately, is poor. Biogenic materials could be expected to lead to somewhat similar impacts, but here the impacts measured per volume of the CLT, and wood cladding products (coming from different data sources) were widely different in some impact categories. These differences call for the development of more robust generic data in environmental categories other than climate change, to better understand the consequences of changes in design and material choices. It is recommended to develop better data in all environmental categories found in EN15804+A2, and to include reliable information related to land use, as it is an impact category in which biogenic materials might have significantly higher impacts than their mineral counterparts.
It should be noted that as the Danish calculation method was used in the above-described estimated example, the results cannot be generalised to all Nordic countries (e.g., the reference area used includes 25% of the areas of balconies).
Figure 17. Impact in all environmental categories for several variants of an apartment building. Environmental impacts are expressed as a% of their value in the base case (a building with balconies, no basement, a concrete structure, and a brick façade). (GWP: global warming; ODP: ozone depletion; POCP: photochemical ozone formation; AP: acidification; EP: eutrophication, ADPE: abiotic depletion, non-fossil; ADPF: abiotic depletion, fossil; PENR: primary energy, non-renewable; PER: primary energy, renewable)
Photo: Køhlers Have, Sweco DK
4.4.4 Wood supply
The use of timber in construction is expected to increase in the coming decades, partly due to the introduction of incentives and requirements for low-carbon construction. This is actively encouraged by initiatives such as the Build in Wood Consortium (Build-in-Wood, n.d.). However, the scaling up of wood construction entails complex environmental implications due to the increased pressure on forests and the limited availability of sustainable timber. Including such considerations in LCA is difficult and leads to unresolved methodological issues (Andersen, Rasmussen, Habert, & Birgisdóttir, 2021). It is critical to investigate how an increased demand for timber relates to the current and future capacity of forests, the impact of forestry on biodiversity and forest carbon storage, and what systemic barriers should be considered to prevent burden shifting. A 2022 study indicates that the consumption of roundwood in Germany is above its sustainable rate based on the Planetary Boundaries, while forestry in the rest of Europe is close to its sustainable harvest potential (Egenolf, Distelkamp, Morland, Beck-O'Brien, & Bringezu, 2022). Furthermore, increased use of wood in construction may interfere with other policy goals, such as the recent European Forest Strategy and the Biodiversity Strategy for 2030, which both emphasise the multifunctional role of forests and do not favour an increase in wood harvest. As part of the EU Forest Strategy, forest conservation is stressed and it is stated that in the short to medium term, the additional benefits from harvested wood products and material substitution are unlikely to compensate for the net forest sink reduction (The European Commission's Knowledge Centre for Bioeconomy, 2021; European Commission, n.d.).
The EU Biodiversity Strategy aims to legally protect 30% of EU’s land area by 2030 which means setting aside forests (European Commission, n.d.). Therefore, a balance must be established between capturing carbon in buildings as temporary sinks, as expressed by the EU Carbon Removal Certification initiative and minimising wood demand in the construction industry (European Commission, 2024).
The limited managed forest area compared with the numerous competing interests between nature and multi-sectoral material demand demonstrate that even renewable resources such as timber have a limited availability. Forest resources and land use change should be considered in a broader perspective, notably in relation with global agricultural systems and bioenergy demand. The availability of roundwood for construction is therefore highly dependent on systemic changes in other sectors, such as moving towards a more sustainable global agricultural sector. A key strategy to expand the available wood supply for construction and increase resource efficiency within the building sector is to implement a cascading use of wood products. Currently, bioenergy and short-lived products such as paper or cardboard packaging utilise most of the harvested timber in Europe (Eurostat, 2023). By redirecting more timber to a primary use in buildings, a higher utility value and temporary carbon storage can be achieved. Before wood fibres are being disintegrated, many engineered wood products can be produced from secondary timber from demolitions – under the precondition of using reversible joints and avoiding chemical contamination. Incineration for bioenergy should only be the last step in a chain of multiple life cycles for wood products. Resource efficiency can further be increased by encouraging the reuse of wood products with suitable technical properties, and by minimising waste wood between harvest and installation. To maximise overall carbon storage, it is therefore important to channel a sustainable supply of timber towards optimal uses, ensuring the possibility of future reuse through design for disassembly principles.
On the demand side, the amount of wood needed for buildings is determined by the choice of structural systems and building geometry and should be kept to a minimum, so that more buildings can be built with the given available wood. This also involves a better handling of waste timber that does not disregard its unique qualities and potential for high-value use, which necessitates identifying waste leaks within the timber value chain resulting from sawmilling. Light timber frames in low-rise structures require less wood than mass timber in high-rises, and carbon limits per m2 will make it harder to build high-rise buildings since these require more materials per m2. Conversely, low-rise buildings would increase urban sprawl and transport needs. This trade-off must be considered as part of sustainable urban planning. Avoiding unnecessary resource use linked with new construction through sufficiency measures (e.g., preserving buildings, reusing components, and implementing less resource-intensive designs) is an essential part of sustainability strategies for the building sector.
The benefits and impacts of biogenic carbon in timber and other plant products differ widely dependent on the chosen assessment method. Modelling buildings as temporary carbon sinks requires to include the whole life cycle of the building. Current environmental product declarations for timber-based construction products refer to EN 16485, which applies the -1/+1 method, where the Global Warming Potential is accounted as a benefit at the start of the cycle and as a burden (release) at its end. The carbon neutrality approach regarding sequestered carbon is only relevant for wood from sustainable forests. If wood supply comes from native forests the GWP-LULUC indicator covers the biogenic carbon changes that result from, e.g. the loss of forests or other soil-related changes. In brief, biogenic carbon from non-native sources/forests is accounted for based on the -1/+1 kg CO2e calculation rule under the GWP-biogenic indicator (i.e., the sum is always zero over the life cycle), while harvest wood from native forests is considered fossil, where the -1 kg CO2e from sequestration is reported as an impact of +1 kg CO2e under GWP-LULUC indicator. This means that in overall wood from non-sustainable forests has no sequestration account. However, a definition of sustainable forest needs to be defined in the context of LCA and EPD to avoid the risk of double-counting and greenwashing; a definition has been proposed by the Nordic project on data (Karlsson, Mattsson, & Erlandsson, 2024), also as a contribution to the EU future Carbon Removal Certification.
While this approach clearly defines the carbon exchange between building and atmosphere, it fails to account for the beneficial delay of emissions during building operation, compared to an immediate release. The French building regulations RE2020 and several private certification schemes such as FutureBuilt (Resch, et al., 2022) and DGNB Denmark (Green Building Council Denmark, 2024) apply a discounting factor, where future emissions have a gradually lower weight in impacts, based on an assumption of improved technology and delayed atmospheric heating effect. This applies to all materials including biogenic carbon, which in effect equals to benefits for carbon storage. The climate implications of temporary carbon storage effect, however, must not be used in product assessments according to EN15978 and 15804, to avoid excessive use of resources, and only the bulk amount of biogenic carbon has to be included as additional information.
Besides the overlooked benefits of using timber, the assessment method has some shortcomings on the impact side as well. The applied attributional LCA method neglects possible strain on resource supply, in this case timber harvest and secondary timber. A consequential LCA approach also simulates possible changes on the market supply side and related environmental impacts. In contrast to attributional LCAs used in certification and regulation, consequential LCA models co-products by substitution or system expansion. Since residues from timber production are often utilised for short-lived products or energy with immediate biogenic carbon emissions, this kind of consequential modelling often shows lower benefits for timber buildings, depending on the considered substituted production (Hansen, et al., 2024). Substitution can also be used in attributional LC by considering the average market mix instead of the marginal mix. However, the utilisation factor commonly applied for roundwood to timber (about 50%) most likely overestimates wood residues for short-lived products. Overall, prior to the implementation of carbon limit policies, the environmental consequences of an increased timber demand should be assessed as a dynamic function depending on the imposed changes in the total timber demand and supply.
To address potential supply challenges for wood and other resources in future carbon limit trajectories, it is important to be able to estimate the material demand for new buildings and renovations. The building archetype approach discussed in chapter 3 is a good foundation for this scenario simulation, since it contains the material inventory of the building. This inventory can be scaled with the expected share of buildings in future building stocks, eventually based on the EU Building Stock Observatory. This material demand scenario can also be explored for other environmental assessments such as biodiversity, for which initiatives are being prepared in some countries (Jensen & Hill-Hansen, 2023).
4.4.5 Construction supply chain
Carbon limits for buildings will generate a new type of additional regulatory stress on construction with indirect implications for the supply chain as a whole. By reducing the allowed carbon budget of buildings, suppliers of energy, construction products and other services are urged to adapt their products to the new requirements. However, there are other instruments, both planned and hypothetical, for decreasing the carbon intensity of raw materials and construction product manufacturing. The European Calculator programme illustrates the effect of building regulation measures, but also many other possibilities and scenarios not directly related to buildings
Products with energy-intensive manufacturing processes have a great decarbonisation potential. Current short-term improvements include increased efficiency and changing fossil fuel sources towards biogas and electricity. This includes products such as ceramics, mineral wool, glass, or metals. As an example, the cement industry claims that it can potentially achieve large carbon savings by changing fuel source, production processes, concrete mixes with supplementary materials and lower cement content as well as using carbon capture, utilisation, and storage technologies (Global Cement and Concrete Association, n.d.). Other resource efficiency levers for mitigating emissions include the reduction of material amounts and avoiding overdesign (excessive material amounts or quality requirements) in design and construction processes. This includes changes in geometry (e.g., vaulted precast floor slab (Vaulted, n.d.)) or handling, being one of the determining factors for cement content in prefabricated wall elements.
Building carbon limits has a prospective effect on the supply chain, creating a demand for low-carbon products needed for a given carbon level, which would not exist otherwise. This mechanism requires clear expectations regarding future carbon limits among industrial stakeholders, communicated for instance through the limit value roadmaps. An important indicator for determining future carbon levels is the carbon impact range of the current product supply. The lowest carbon levels of today, which can be found in best-in-class products, can be used as the new standard level on which future carbon levels will be based – essentially assuming that today’s best practice will be tomorrow’s standard practice. This is especially the case for 2030, when all European countries must have introduced carbon limits. This large-scale market demand for low-carbon products is expected to have a considerable effect on construction product suppliers. Limit values can therefore consider the currently best available technology of today to become the new standard.
Nordic limit value reports estimate the reduction potential of best-in-class low-carbon products instead of generic data at 10-30%, depending on the context and for certain types of products
(Tozan, et al., 2023) shows a 12% reduced impact for Danish buildings by simply using low-carbon bricks (improved bricks have been achieved by reduced material consumption per unit and purchase of biogas certificates); (Malmqvist, Borgström, Brismark, & Erlandsson, 2023)finds a 13% and 10% overall reduction when using “better choices” instead of generic data for concrete, steel and aluminium (but primarily increased recycling for metals) in the Swedish context for A1-5 and A1-5, B2, B4, C1-4 scopes, respectively; (Utstøl & Marwig, 2022) report shows more than 10% and 20% (SFH and four-person home and apartment/office buildings respectively) through a conscious choice of materials that satisfy recommended ‘threshold values’, without any cost consequence. Additional potential reductions of 1-13% when switching from class C to class B and A concrete (with additional cost).
considering that there are roadmaps estimating 60% or higher emission reductions for concrete, bricks and steel by 2035, see Section 3.7.1.
Low-carbon pathways will also make prefabrication a priority in high-rise construction. This is due to the increased use of wood in the structural frame, which requires a greater caution for damage through moisture, which can be achieved through a weather-proof fabrication indoors. Wooden panels or frames are also well suited for transport due to their compact packing and light weight, which removes the high carbon intensity of heavy concrete element transport. It also improves the possibility of design-for-disassembly through using reversible joints.
Innovations will also be key at the end of the building and material life cycles to increase resource efficiency. In order to maintain materials in the loop at the highest possible functional value, measures have to be taken in all stages from the design of components to maintainability and finally disassembly to prepare for the next product system. Cured materials such as cement and lime cannot be recovered without a new heating process, while versatile wood products can be re-used and recycled numerous times following a cascade. The cascade starts from a higher state of integration such as beams and ends with more disaggregated products like particle boards and finally energy recovery. In some cases, also upcycling might be an option. When the benefits of this multi-life cycle use of wood will be sufficiently expressed in future LCA calculation rules, a greater focus on careful dismantling and waste sorting will be necessary to exploit this potential for long-term carbon storage in product loops including buildings.
Building limit values will increase the demand for low-carbon energy supply from the grid and building-integrated energy production. This might impose a conflict in energy systems planning. Local district heating or cooling and large-scale electricity grids operate on system level, where the individual building is only a small part of the consumer side. Moreover, buildings are increasingly helping to balance the grid by flexible use and storing heat and electricity and not least producing energy on site. Building-level carbon regulation fails to include this complexity in performance assessments and there is a risk of sub-optimisation and conflict with system-level optimisation. This risk may be mitigated by maintaining a separation between operational energy regulation and other processes, which allows for a more nuanced management in line with the system-level goals. This can be combined with traditional minimum building-level energy performance standards, which work independent from carbon regulation. This would acknowledge the fact that buildings are both artefacts with carbon impacts and nodes in a greater energy system.
Finally, all considerations of efficiency improvements in material production and energy use must be seen in the light of potential rebound effects. It is important to ensure that efficiency improvements do not lead to increased consumption (e.g. because the product or energy carrier becomes cheaper, or because more of it can be used without overshooting the limit value). The benefits of efficiency improvements will not be fully realised unless incentives and policy measures are actively taken to prevent consumption from increasing.
4.4.6 Socio-economic impacts
The above-discussed influence of carbon limits on innovation in building composition and the supply chain are not technological challenges alone, but also require adaptation at societal and economic levels. In order to secure societal acceptance, policymakers need to involve and prepare stakeholders to gain support for the proposed path. This can be done by conducting a socio-economic analysis of a proposal for limit values based on a survey of the current situation and expert interviews, as was the case in Sweden. This section discusses the consequences of limit values for new buildings, based on the regulatory experiences in Sweden, Finland, and Denmark. Table 15 provides an overview of potential impacts on building owners, the construction supply chain and public administration.
Economic impacts in the construction sector result from new assessment and reporting requirements on the one hand and changes in building design, materials and energy supply on the other. Small and medium-sized consultancies, contractors and manufacturers are particularly dependent on support for new reporting requirements. The preparatory process for limit values in the Nordic countries has mainly focused on the new reporting requirements in light of the first generation of limit values. The numerous support programmes for supply chain innovation and decarbonisation are not specific for the construction industry and will not be treated here.
Reporting is considerably supported by available assessment tools, environmental data and default libraries for products and systems. Capacity building prior to carbon regulation has been accelerated by voluntary sustainability schemes to increase the stakeholder readiness, see the report “Harmonised Carbon Limit Values for Buildings in Nordic Countries” (Balouktsi, Francart, & Kanafani, 2024) for the detailed measures in the Nordic countries. Other measures include industry networks and workings groups, which often overlap with stakeholder consultation processes. A major driver for readiness and adaptation is the early introduction of a regulatory timeline for carbon limit trajectories.
Table 15. Non-exhaustive list of positive (+) and negative (-) economic impacts of carbon limit values to affected stakeholders (Main sources if not stated otherwise: the Finnish government's proposal to the parliament for the construction law (Finlex, 2022) and Boverket’s proposal on limit values (Boverket, 2023))
Stakeholder | (+) Positive impacts | (-) Negative impacts |
|---|---|---|
Building owners and clients |
|
|
Stakeholder | (+) Positive impacts | (-) Negative impacts |
|---|---|---|
Construction supply chain |
|
|
Public administration |
|
Photo: Nordic Sustainable Construction
4.4.7 Other valuable considerations
This report assumes a relative regulation regime, where carbon limits must mitigate emissions per building area unit. This is a common approach and also known in building energy performance, however it does not regulate how much is being built, which is a key factor affecting the total emissions of construction. To tackle this, a policy instrument would need to consider a limitation of construction activity, thus applying a sufficiency regime as suggested by several carbon roadmap initiatives (Le Den, et al., 2023; Reduction Roadmap, n.d.). This could, for instance, be achieved by regulating the per capita carbon intensity, de facto leading to a reduction in floor area per person or function. This would lead to smaller housing units and typologies that have less impact on the environment, such as low-rise multifamily housing units rather than detached houses. Also, the utilisation and refurbishment of the existing building stock will become more profitable. Common to all sufficiency scenarios is a much wider range of societal consequences than expected from relative regulation. In that case, the policy will have to focus much more on the currently low acceptability of such paradigm-shifting measures. A survey performed in several countries demonstrates this (Alexander-Haw, et al., 2024).
Another assumption is that carbon limits are measured as total cumulative life-cycle GWP, meaning a total result for all life cycle stages according to the current EPBD proposal. This implies a 1:1 weighting of upfront impacts and future scenarios as well all included processes including manufacturing, transport, construction, energy systems and waste treatment. As a consequence, cumulative carbon limits are a very broad measure for a large number of factors and industries, which underly varying regulatory regimes and undergo different decarbonisation paths. Since the specific contribution of each of these processes is constantly varying, the regulatory pressure cannot be designed to specific processes, but will be dependent on other decarbonisation level of other processes.
This broad approach implies a strength viewed from a market perspective, where market actors are expected to find the most feasible carbon reductions. It gives the client flexibility to compensate high emissions in one process with mitigation in another. An alternative strategy implies differentiated carbon limits, for instance for upfront carbon and scenarios. This would allow regulating the current emissions which are easy to measure and regulate. Further, operational energy use might stay regulated on a separate track, allowing a specific decarbonisation path including a systems level approach.