Photo: Nordic Sustainable Construction
3. Monitoring building stock carbon emissions
3.1 Introduction
As the Nordic countries strive towards achieving their emission reduction targets, effective monitoring and evaluation of decarbonisation efforts become imperative. This chapter recommends strategies for monitoring the decarbonisation of the gradually growing share of new buildings in the building stock, highlighting key methodologies, data sources and dynamic variables essential for comprehensive assessment and future projections. The aim is to provide recommendations for monitoring approaches to support policymakers, and industry stakeholders in effectively tracking progress, identifying barriers and opportunities and accelerating the transition toward a low-carbon built environment in the Nordic region.
This report chapter provides insights into the following aspects:
- Building stock climate impact modelling approaches
Efforts to decarbonise the building stock necessitate robust modelling approaches to understand emissions dynamics. Two primary methodologies are addressed:
National/sector level: At this macroscopic level, modelling focuses on broad emission trends across economic sectors. Input-Output Analysis and the System of Environmental-Economic Accounting (SEEA, 2012) are commonly used. These methods provide valuable insights into overall emissions profiles and sectoral contributions, aiding in the formulation of national emission reduction strategies.
Building level: Zooming in on individual buildings or building types, this approach employs Life Cycle Assessment (LCA) for emission accounting. Evaluating emissions on a building’s level offers granular insights into specific emission sources and opportunities for mitigation. This micro-level perspective informs targeted interventions and allows setting and monitoring performance targets for individual buildings.
- What building-related data is already being monitored and can it be utilised for carbon monitoring?
In the Nordic countries, significant efforts have been made to gather and monitor building-related data to support various aspects of urban planning, energy efficiency initiatives and environmental sustainability goals. This report section provides an in-depth exploration of the building-related databases currently in place, with a focus on their potential utility for monitoring the decarbonisation of the building stock. Mapping and analysing the existing building-related databases in the Nordic countries will provide valuable insight to the recommendations developed in the following section of this chapter.
- Recommendations for monitoring decarbonisation of the building stock
Recommendations for monitoring the decarbonisation of the building stock will be based on the knowledge gained from the exploration of environmental building stock modelling approaches and the existing building-related data being monitored. By following the recommendations, policymakers and industry stakeholders can strengthen the monitoring infrastructure and enhance the capacity to track and evaluate progress toward decarbonising the building stock in the Nordic countries.
- Recommendations for dynamic variables for projections
Drawing from an analysis of relevant literature and empirical studies, a set of recommendations for incorporating dynamic variables into projections of the building stock in the Nordic countries is proposed. By incorporating these dynamic variables into projections, policymakers and industry stakeholders can develop robust, adaptive and future-proof strategies for decarbonisation and sustainable development in the Nordic countries.
3.2 Environmental building stock modelling approaches
- Both national emission accounts and building-level emission accounts are important to understand the full scope of carbon emission related to the building stock.
- National emissions accounts are well established in all EU and EFTA countries through EU regulation and rely on acknowledged emission accounting methods from the SEEA framework. National emission accounts provide a macroscopic perspective and support policy formulation towards the national reduction goals.
- Sweden has developed a sophisticated sectoral accounts model with more detailed accounts for the building sector based on data from Swedish Statistics.
- Building-level emissions monitoring is important to understand the carbon footprint of individual buildings and for identifying specific emission sources, hotspots and mitigation opportunities. Monitoring building-level emissions accounts is also instrumental in informing the development of building-specific carbon limit values as a measure for decarbonising the building stock.
Photo: Nordic Sustainable Construction
Emission accounting is a critical aspect of monitoring the climate impact of the building stock, aiming to quantify and understand the sources of emissions, their trends and their impact on the environment. As outlined in the introduction to this chapter, two overall modelling approaches for defining climate impact from the building stock are explored. Both National Emissions Accounts and Building-Level Emissions Accounts play crucial roles in accounting for carbon, offering complementary perspectives and insights that are essential for comprehensive and effective emission accounting and monitoring. Below are key reasons why both methods are important in emission accounting:
Macroscopic and microscopic perspectives: National Emission Accounts provide a macroscopic view of emissions at the national or sectoral level, offering insights into broad emission trends, sectoral contributions, and overall environmental impact. On the other hand, Building-Level Emissions Accounts offer a microscopic perspective, focusing on individual buildings or building types to identify specific emission sources, hotspots, and mitigation opportunities. Integrating both perspectives allow for a more holistic understanding of emissions, encompassing both broad trends and detailed insights into specific sources and sectors.
Policy formulation and targeted interventions: National Emission Accounts inform the development of overarching environmental policies and regulations by identifying high-emission sectors, setting emission reduction targets, and allocating resources efficiently. These policies provide the framework for addressing emissions at national or sectoral level. Building-Level Emissions Accounts, on the other hand, support the implementation of these policies by providing detailed insights into building-specific emissions and mitigation opportunities. By targeting emissions at the building level, policymakers and stakeholders can implement tailored interventions, such as building codes, energy efficiency incentives and sustainable building practices, to achieve emission reduction goals effectively.
Monitoring and evaluation: Both National Emission Accounts and Building-Level Emissions Accounts play critical roles in monitoring and evaluating the effectiveness of emission reduction measures and environmental policies over time. National Emission Accounts provide indicators for tracking overall emission trends, assessing progress toward emission reduction targets, and evaluating the impact of policy interventions at a national or sectoral level. Building-level emissions Accounts enable stakeholders to monitor the performance of individual buildings or building portfolios, track changes in emissions over time, and assess the effectiveness of specific mitigation measures. This continuous feedback loop supports adaptive management and evidence-based decision-making, ensuring that emission reduction efforts remain effective and responsive to changing environmental conditions and priorities.
3.2.1 National/sectoral emission accounts
All European Union (EU) Member States and European Free Trade Association (EFTA) countries are legally required to provide data according to the European environmental accounts, established in Regulation (EU) 691/2011 (The European Parliament and The Council of The European Union, 2024). This regulation provides a legal framework for the harmonised collection of comparable data from all EU Member States and EFTA countries, ensuring consistency and reliability in environmental reporting across the region.
The European environmental accounts are aligned with the System of Environmental-Economic Accounting (SEEA) 2012 Central Framework (SEEA, 2012 C), which serves as an internationally recognised statistical standard for environmental accounting. SEEA 2012 C provides guidelines and principles for organising and presenting environmental information within an economic accounting framework, enabling systematic analysis of the interactions between the economy and the environment. Concretely, SEEA complements national economic input-output accounts (income, production, capital, and expenditure in various sectors) with environmentally relevant information such as flows of energy and materials (including pollutants emitted by various sectors), stocks of natural resources or ecosystem services, in a structure compatible with economic accounts. Key features of National/Sectoral Emissions Accounts include:
Comprehensive data collection: National/Sectoral Emissions Accounts collect data on a wide range of pollutants, including greenhouse gases (e.g., carbon dioxide, methane, nitrous oxide), air pollutants (e.g., sulphur dioxide, nitrogen oxides), and water pollutants (e.g., phosphorus, heavy metals). Data is collected from various sectors of the economy, including energy, industry, transportation, agriculture, and waste management.
Harmonised reporting: The European environmental accounts ensure harmonised reporting of emissions data across EU Member States and EFTA countries, facilitating comparisons and assessments of environmental performance at the regional and national levels. This harmonisation is essential for monitoring progress towards international agreements and targets, such as the Paris Agreement on climate change.
Time series analysis: National/Sectoral Emissions Accounts provide time series data, allowing for the analysis of emission trends over time. This longitudinal perspective enables policymakers, researchers and stakeholders to identify patterns, drivers and changes in emissions patterns, informing the development of targeted mitigation measures and policies.
Sectoral breakdown: Emissions data is disaggregated by economic sectors, allowing for the identification of sector-specific emission sources and trends. This sectoral breakdown is instrumental in understanding the contributions of different economic activities to overall emissions and prioritising sectors for emission reduction efforts. Although the sectoral breakdown is an important instrument in policy making, none of the sectors in the national accounts sufficiently describes the GWP related to buildings directly. GWP related to buildings typically falls under sectors such as: Industry, Household, Manufacturing and Transport.
To circumvent the inherited issue with the sectors represented in the national accounts, The Swedish National Board of Housing, Building and Planning (Boverket), in collaboration with Statistics Sweden (SCB) and The Royal Institute of Technology (KTH), has developed a model for estimating the environmental indicators of the construction and real estate sector (Boverket, 2024). The environmental indicators provide insights into the environmental impact of the construction and property sector, focusing on emissions to air, energy use, use of hazardous chemicals and waste generation. In the environmental indicators, the National Board of Housing, Building and Planning wants to capture all the environmental impact that occurs in:
- Construction of buildings (new construction)
- Renovation, rebuilding and extension
- Property Management
- Heating of buildings
These indicators support the national environmental quality target ”Good built environment” and are used to monitor progress towards this target.
The model for the production of data for the environmental indicators is based on the Swedish Standard Industrial Classification (SNI) (Boverket, 2024). The SNI, is based on the industry standard classification system used by the European Union (Statistics Sweden, n.d.), NACE Rev.2, and is primarily an activity classification system. This is the same classification used to produce statistics in national and environmental accounts. In Boverket, SCB and KTH’s model, specific SNI industries that fit the delimitation for the environmental indicators has been selected.
The analysis adopts a life cycle perspective, encompassing the environmental impact of all construction and property operations in Sweden, including supply chains. Data is updated annually to maintain comparability between years.
3.2.2 Building-level emission accounting
Building-level emission accounting is essential for understanding and managing the carbon footprint of individual buildings. The building level emissions accounts are essential for identifying specific emission sources, hotspots, and mitigation opportunities. Monitoring building-level emissions accounts is also instrumental in informing the development of carbon limit values for buildings as a measure for decarbonising the building stock.
A literature study (Röck, et al., 2021) on environmental modelling of building stock categorises four types of typical modelling approaches: Life cycle approach; Materials flow analysis; Energy simulation; and Cost-benefit analysis. The similarity in the different approaches presented in the study is the possibility of aggregating results to a stock level. The building specific carbon accounting method introduced in the Nordic countries’ national legislation is based on Life Cycle Assessments (LCA). This approach will thus also be the focus for developing a recommendation for building level carbon accounting in this report.
With the ambition of monitoring carbon emissions related to building activity, the emissions could be categorised into the four elements of the building stock dynamic presented in Section 2.2:
- New buildings
- Buildings in use
- Renovations
- Demolishing
A yearly monitoring of emissions, similar to the national accounts, would require only monitoring emissions happening each year related to each activity (see Figure 4). Results from LCA can typically not be used directly for this purposed as it may contain emissions from more life-cycle stages depending on the national methodology (scope) for LCA calculations. If data from climate declarations (LCA) is reported in separate modules, a proposal for monitoring the yearly up-front emissions with life cycle modules defined in EN15978 and based on the four activities mentioned above could be:
- A1-A5 of LCA calculations for new buildings
- Yearly energy use data for heating, cooling, electricity, etc. (with emission factors) for buildings in use
- A1-A5 of LCA calculations for renovations
- Waste amount and waste management data (with emission factors)
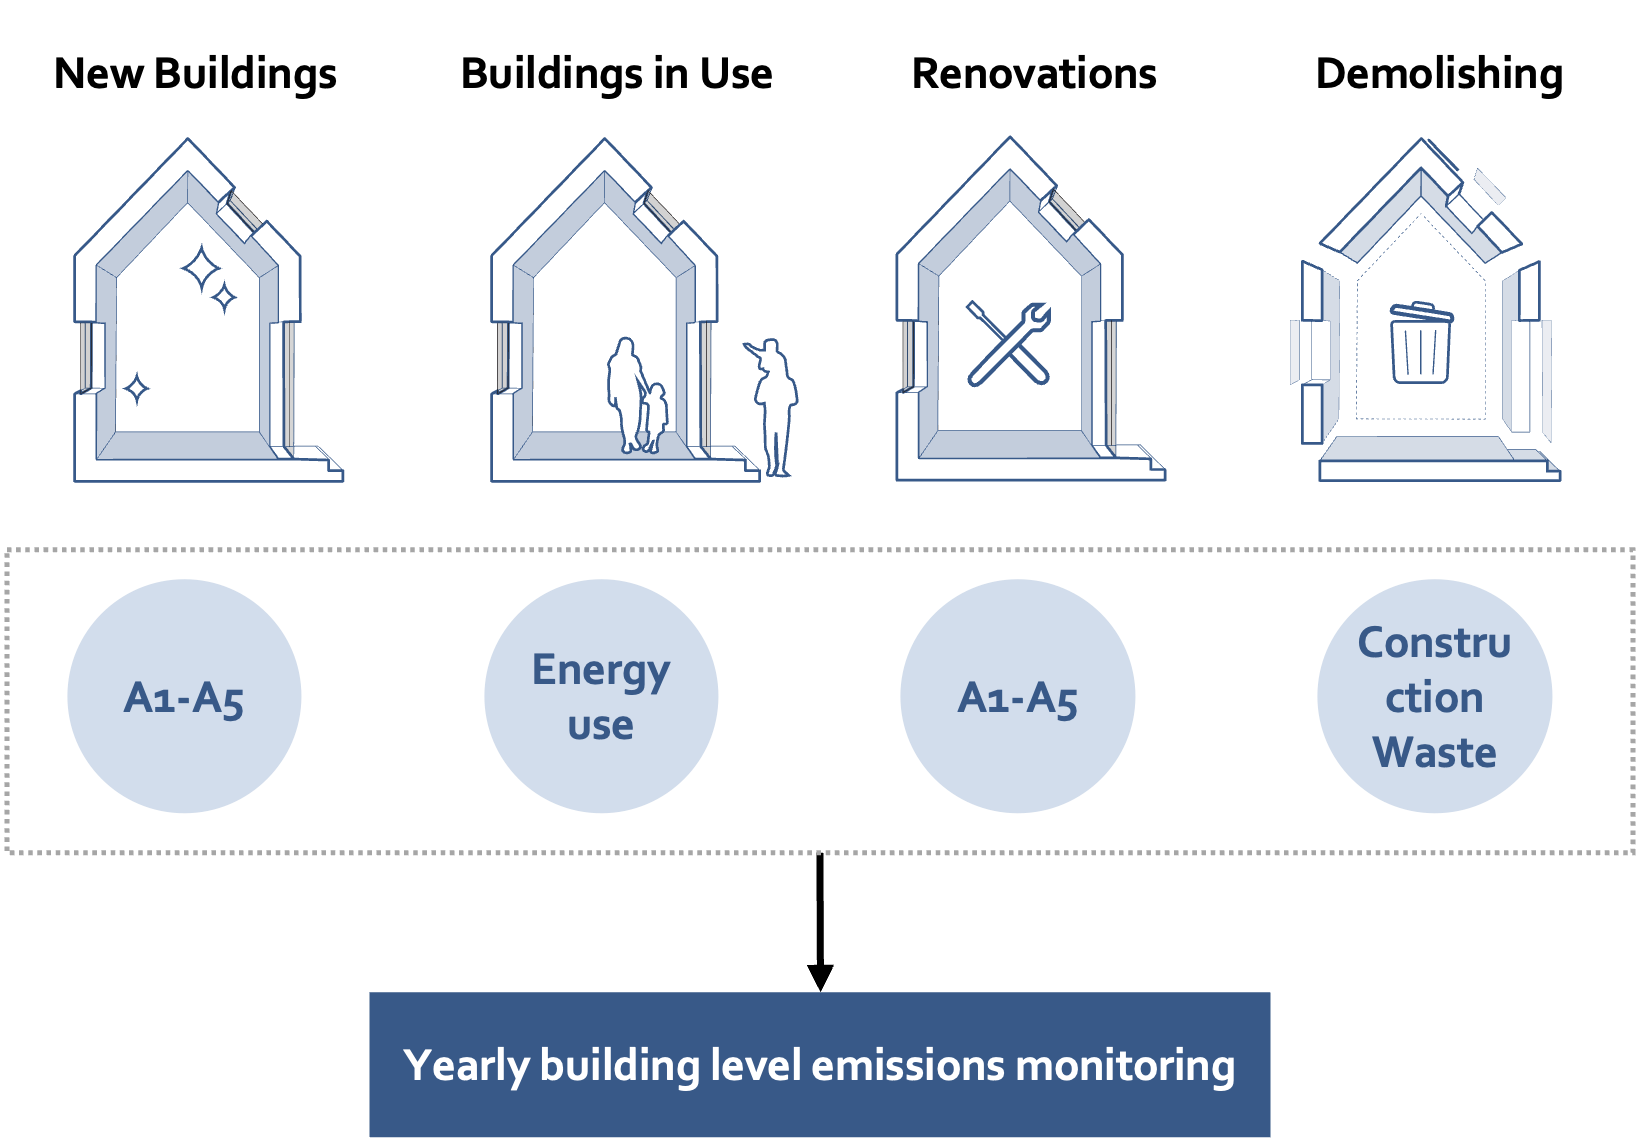
Figure 4. Yearly building-level carbon emission accounting for the four elements in the building stock dynamic
3.2.3 Building stock aggregation
To effectively monitor and manage decarbonisation efforts at the building stock level, it is necessary to aggregate building-level emission accounts. This aggregation will provide a macro-level view of the carbon footprint and the progress made toward reducing emissions across an entire national portfolio of buildings. Two principal methods for aggregating building-level data for decarbonisation monitoring are presented: the Archetype Approach and the Sampling Approach.
Archetype approach
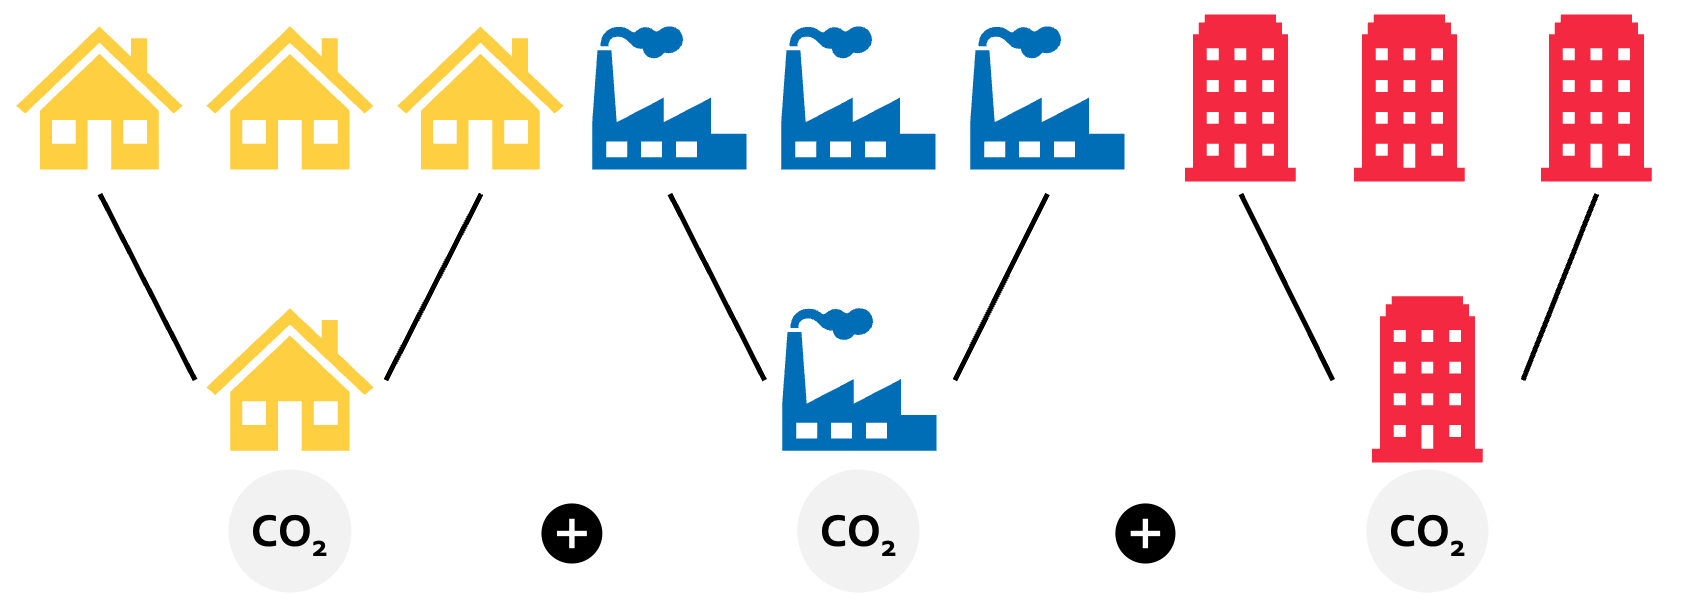
Figure 5. Building stock modelling of carbon emissions using archetypes based on building type
Archetype-based modelling involves representing numerous buildings with a smaller number of representative building types or archetypes. Buildings are clustered based on common characteristics such as type, construction year, size, etc. These archetypes are then used to model the environmental impacts of the entire building stock (See Figure 5). There could be challenges with categorising hybrid buildings containing several functions. If building registration data would allow it, a hybrid building could be divided into functions with area data for each function.
Methodology:
- Archetypes are defined based on building typology and construction year.
- Emission factors for each archetype are developed for reporting emissions for the recommended scope.
- Archetypes emissions factor are updated regularly to reflect changes and follow decarbonisation trends.
Advantages:
- Provides a structured and simplified approach to modelling the diverse building stock.
- Allows for the representation of various building types and characteristics.
- Enables tracking of emission trends over time and across different building categories.
Sampling approach
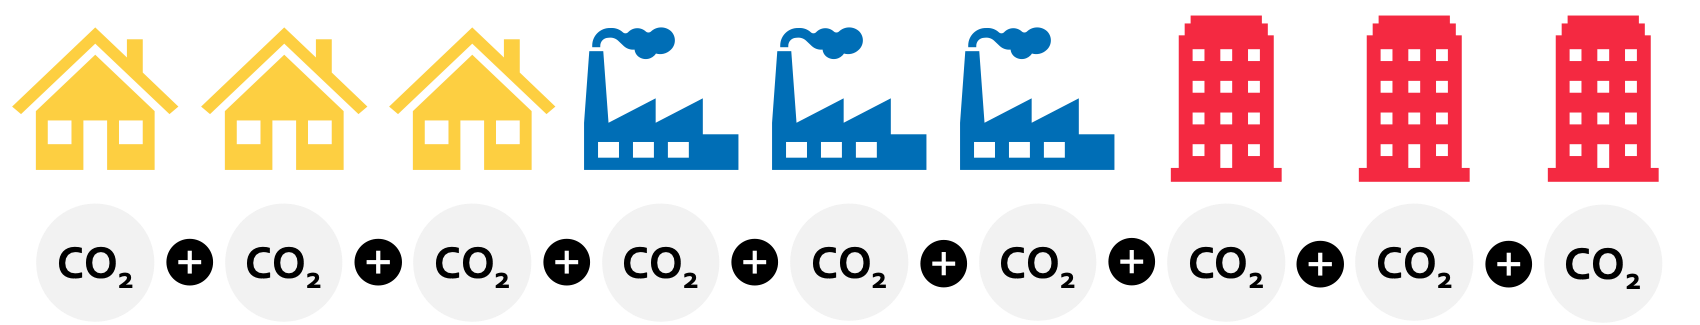
Figure 6. Sample modelling of carbon emissions
The sampling approach involves collecting and analysing data from individual buildings. This method focuses on assessing environmental impacts on a building-by-building basis, leveraging data from e.g., carbon declarations and energy performance certificates (Figure 6). As this approach involves an individual emission factor (based on the LCA result) for each building, it is well suited for hybrid buildings containing more functions, as it would not have to fit a standardised emission factor based on specific building typology.
Methodology:
- Data derived from carbon declarations are used to assess environmental impacts.
- A digital infrastructure is established to manage and extract data efficiently.
- The approach facilitates a comprehensive assessment of environmental impacts for new buildings and potential renovations.
- It offers a granular understanding of emissions, materials, building parts, and types, enhancing accuracy and adaptability.
Advantages:
- Provides a more granular and accurate understanding of environmental impacts.
- Enhances efficiency through streamlined data extraction and management.
- Facilitates easy integration of data from new buildings and renovations.
3.3 Building related data
- A comprehensive and detailed mapping of all building-related data being recorded in each country is uncovered to understand the data landscape and the potential for utilising the data for monitoring carbon emissions on building-level.
- Key attributes potentially relevant for building-level emissions monitoring are identified and analysed concerning quality, accessibility and comparability.
- All Nordic countries have a large number of sources available for recorded building-level data for each key attribute.
- Data and data collection formats within each key attribute are not harmonised and can, in many cases, not be compared as it stands today.
- The current data recording landscape is not fit for direct or indirect comparable building-level emissions accounting.
- Sweden is the only Nordic country with an available database on carbon declaration from new buildings.
- There is a potential for creating harmonised archetypes based on the data available. This would require Nordic cooperation in defining archetypes, area definition and other characteristics
This chapter aims to offer a detailed overview of building-related data and other relevant information sources about buildings in the Nordic countries, that are being recorded today. The objective here is to gain a deep understanding of the building-related data at our disposal to determine whether the current data can be utilised for building-level carbon emission monitoring.
Table 10 lists the names of the sources for the building-related data used in the research is presented. Together with the country abbreviation, the numbers 1-8 create a unique identifier (e.g., DK1) for each database which will be used to refer to the databases going forward in the report.
Table 10. Databases and other relevant information sources containing data on building characteristics, operations, building materials and GHG emissions related to these, which are available in each nation.
Denmark | Estonia | Iceland | Finland | Norway | Sweden |
Building and Housing Register (BBR) | Estonian Building Register (EBR) | Building register (Mannvirkjaskrá) | Generic climate impact data (Rakentamisen ja infrarakentamisen päästötietokannat, SYKE) | The land register (Kartverket) | Property register (Lantmäteriet) |
DK1 | EST1 | ICE1 | FIN1 | NOR1 | SWE1 |
Protected and listed buildings (FBB) | Land Register /Immovables Register | Property register (Fasteignaskrá) | Energy certificate database (Energiatodistusrekisteri) | Statistics Norway (Statistisk Sentralbyrå) | Building register (Bebyggelseregistret) |
DK2 | EST2 | ICE2 | FIN2 | NOR2 | SWE2 |
Waste database (ADS) | Statistic Estonia | Statistics Iceland | Registry of Finnish Heritage buildings (Museovirasto) | Cultural heritage search (Kulturminnesøk) | Generic climate impact database (Boverket) |
DK3 | EST3 | ICE3 | FIN3 | NOR3 | SWE3 |
Energy certificate (Energimærke) | Waste database (JATS) | Data library of The National Energy Authority (Orkustofnun) | Land, property, and ownership registry (Maanmittauslaitos) | Energy certificate (energimerke) | Energy certificate database (Boverket energideklaration) |
DK4 | EST4 | ICE4 | FIN4 | NOR4 | SWE4 |
Building archive (Byggesagsarkiv) | Planning database (PLANK) | Energy use (Veitur Utilities) | Statistical information on buildings, land, and everything (Tilastokeskus) | GeoNorway - Listed buildings (freda bygninger) | SCB - Statistics Sweden |
DK5 | EST5 | ICE5 | FIN5 | NOR5 | SWE5 |
Generic climate impact data (LCAbyg component library) | Emission factors for building materials (CO2 calculator) | Waste statistics (Úrgangstölfræði) | Built environment information data (Suomen Ympäristökeskus, paikkatietoaineistot) | Case inspection (Saksinnsyn) | Energy statistics (Energiläget) |
DK6 | EST6 | ICE6 | FIN6 | NOR6 | SWE6 |
Generic climate impact data (Building regulation 2018 (BR18) Appendix 2 table 7) | Certified building register (GreenBookLive) | OneClickLCA | Climate declarations register (Boverkets Klimatdeklarationsregister) | ||
DK7 | ICE7 | NOR7 | SWE7 | ||
Danish statistics | DFØ limit values tool | Climate impact data (BM Tool) | |||
DK8 | NOR8NOR8 | SWE8 |
A diverse array of attributes was identified in the reported databases and other sources of information. They were condensed to the following key attributes that were found relevant for aggregated building stock modelling:
- Building characteristic data
- Construction year
- Construction materials
- Building type
- Area
- Emission-related data
- Emissions related to building materials.
- Operational energy demand (operational emissions)
- Carbon declarations
Figure 7 illustrates the key attributes in a hierarchical tree model, showcasing their interrelation with the overarching objective of monitoring the decarbonisation progress of the building stock. These attributes have been categorised into either “building stock” descriptors or “emission” descriptors.
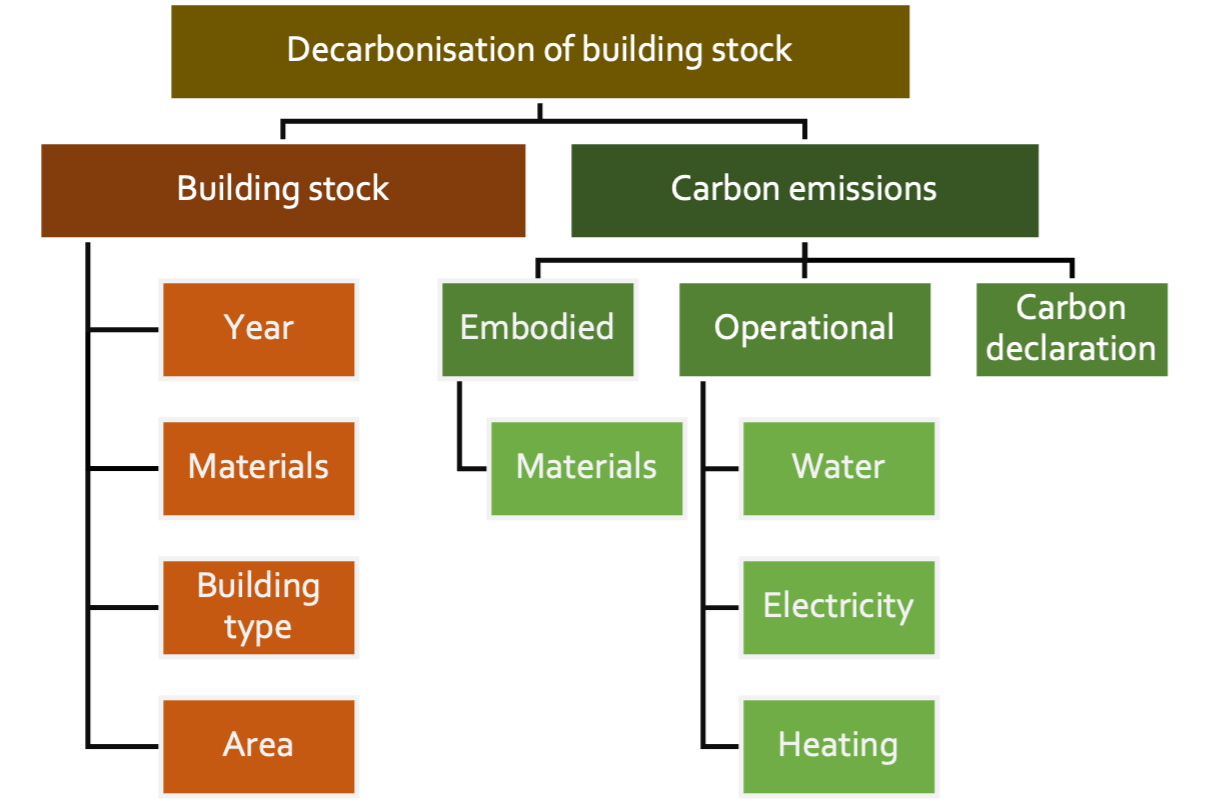
Figure 7. Key attributes derived from the databases presented in a relational tree model.
3.3.1 Analysis of key attributes
Table 11. Building related databases in the Nordic countries mapped according to key attributes for building stock modelling.
DENMARK (DK) | ICELAND (ICE) | ESTONIA (EST) | FINLAND (FIN) | NORWAY (NOR) | SWEDEN (SWE) | ||
Building Characteristics | Year | DK1 | ICE1 | EST1 | FIN2 | NOR2 | SWE1 |
DK8 | ICE2 | EST3 | FIN3 | NOR3 | SWE2 | ||
ICE3 | FIN4 | NOR5 | |||||
FIN5 | |||||||
Materials | DK1 | ICE1 | EST1 | FIN4 | NOR6 | SWE2 | |
DK2 | ICE2 | EST4 | FIN5 | ||||
DK3 | FIN1 | ||||||
DK5 | |||||||
Building type | DK1 | ICE2 | EST1 | FIN4 | NOR1 | SWE1 | |
DK8 | ICE3 | EST3 | FIN5 | NOR2 | SWE5 | ||
EST5 | FIN2 | NOR3 | |||||
Area | DK1 | ICE1 | EST1 | FIN4 | NOR1 | SWE1 | |
DK2 | ICE3 | EST3 | FIN6 | NOR2 | |||
DK8 | FIN5 | NOR3 | |||||
Carbon Emissions | Embodied (Data on construction products) | DK7 | EST6 | FIN1 | NOR7 | SWE3 | |
NOR2 | |||||||
Operational | DK1 | ICE3 | EST1 | FIN2 | NOR2 | SWE4 | |
DK2 | ICE4 | EST3 | FIN5 | NOR4 | SWE5 | ||
DK4 | ICE5 | FIN1 | SWE6 | ||||
DK8 | ICE7 | ||||||
Carbon declarations | SWE7 |
The following section is dedicated to an analysis of each of the key attributes, as well as the corresponding databases resulting from the mapping exercise. In this examination, we will delve into the specifics of data quality and database type to assess their potential in describing aggregated levels for use in environmental building stock modelling in Nordic countries.
The objective of this analysis is to define whether the attributes identified in the databases could provide a foundation for robust and reliable environmental building stock modelling in the Nordics.
Photo: Nordic Sustainable Construction
Building stock characteristics – construction year
To monitor emissions from new buildings and new material in renovations, a building’s construction year will be important to record in order to capture the temporal aspect of the decarbonisation of the building stock. Construction year can also help determine the age of the building and identify construction methods and materials used. This information can potentially be used to estimate the building’s carbon footprint and plan for future renovations or demolitions.
Most Nordic countries have multiple databases that contain information on building age. However, the information provided in these databases can vary. Some databases include construction year and not the year of renovation, resulting in slight discrepancies in the data that can complicate the process of combining information from different databases.
Building stock characteristics – material type and quantity
In most of the Nordic countries’ databases, the material description is very limited and primarily focused on descriptions of roof and façade materials. Estonia’s databases provide more detailed information on additional building elements like foundations and interior surface materials. In general, the quality of data on building materials is not found comprehensive enough to use directly or as an estimated inventory for LCA calculation.
Building stock characteristics – building type
Information on building type can be especially useful when using an archetype-based aggregation approach. This approach involves clustering buildings based on common characteristics such as building type and construction year. Utilising building typology data is commonly used in building stock modelling due to the large number of buildings involved and the limited availability of detailed building data.
There are multiple databases recording building typology available in each country. There are databases available for both individual buildings and building stock on a larger scale. This makes it easy to extract the required information and determine the total number of buildings in each typology.
Building stock characteristics – area
Information about the built area can be an important parameter to monitor the building stock. Each country has at least one, and often two or three databases that provide this information. The databases vary from individual building level to national statistics databases, which often have the average floor area for different types of buildings recorded. This makes the information easily extractable.
In Nordic countries, the building and property databases contain data on the gross floor area (GFA) of all buildings, while a subset of other buildings in the databases have additional information on other types of areas. The building and property registers define GFA in varying ways and incorporate different elements in the calculation of the floor area. Additionally, the definition of the area used for calculating carbon declarations in the Nordic countries varies (See chapter 4.3.2).
Emissions related to building materials
Most Nordic countries have been provided with a database or list, by their respected authority, which is often required to be followed when using generic environmental impact data for building materials in the national carbon declarations. The emission factor data in each database differs based on factors such as the energy mix, transportation distance, and original location of the products. The databases are tailored to each country and as a result, the embodied carbon emissions for the same type of materials vary for each country. Sweden’s database only includes the product stage (A1-A3) and construction stage (A4 – A5). This variation in generic data makes it difficult to compare results from carbon declarations. This will be further unfolded in Chapter 4. Norway and Iceland do not have access to such databases or lists.
Emissions related to operations
Carbon emissions related to the operation of a building, such as water usage, heating and electricity consumption in buildings are not reported in any databases. Several databases are reporting on both labels (energy), actual usage (energy/heating/water), and supply type (energy/heating). There are databases available at the individual building level and on a larger scale for building stock. The larger-scale data sources are typically the national statistics banks.
If data from databases containing either information on labels or actual usage is to be utilised for monitoring emissions related to operations, emission factors can be used to calculate the carbon emissions related to the operations. Choosing correct emissions factors should be carefully considered, so it does not reflect the national production, but the actual use of energy including the trade between Nordic countries and rest of the Europe. To account for this and evaluate emissions with emissions factors, a Nordic electricity mix (including import and export) is recommended.
Energy label | Denmark | Estonia | Finland | Sweden* | Norway |
Limit value [kWh/m2] | Limit value [kWh/m2] | Limit value [kWh/m2] | Limit value [Energy performance of a new building] | Limit value [kWh/m2] | |
A++ | 27 | ||||
A+ | < 30 + 1000/Area | ||||
A | < 52,5 + 1650/Area | < 105 | < 90 | EP is ≤ 50% | 85 + 600/Area |
B | < 70,0 + 2.200/Area | < 171 - 200 | < 91 - 155 | EP is > 50 - ≤ 75% | 95 + 1000/Area |
C | < 110 + 3.200/Area | < 201 - 250 | < 156 - 192 | EP is > 75 - ≤ 100% | 110 + 1500/Area |
D | < 150 + 4.200/Area | < 251 - 300 | < 193 - 272 | EP is > 100 - ≤ 135% | 135 + 2200/Area |
E | < 190 + 5200/Area | < 301 - 350 | < 273 - 402 | EP is > 135 - ≤ 180% | 160 + 3000/Area |
F | < 240 + 6.500/Area | < 351 - 410 | < 403 - 472 | EP is > 180 - ≤ 235% | 200 + 4000/Area |
G | > 240 + 6.500/Area | < 411 - 470 | < 473 | EP is > 235% | > F |
H | > 471 |
Figure 8. Energy label limit values for apartment buildings in the Nordic Countries. In some countries there are differentiated values for different building typologies. *The percentages constitute shares of the requirement for energy performance in the construction of new buildings.
For all the Nordic countries except Iceland, there are energy certificate databases which contains labels for all new buildings. However, the value for each grade in the label (A, B, C, etc.) do not align across countries, making comparisons between countries difficult with the label alone. See Figure 8 for an example with limit values for each grade for apartment buildings typologies). Additionally, the energy label in Estonia, Norway and Finland varies with the typology of the building. The energy labels are primarily updated when there is a transfer of ownership or tenant for the buildings.
Besides the national databases, the EU Building Stock Observatory (BSO), that was established in 2016 as part of the Clean Energy for All Europeans package, is also a key source for large-scale energy data from building. It aims to provide an understanding of the energy performance of the building sector through reliable, consistent, and comparable data. The background data for the operational energy use in BSO originates from Eurostat’s energy statistics on household energy use, which means that the data is based on actual energy use.
Carbon declarations
A public register of building carbon assessments can provide very valuable data for monitoring carbon emissions from buildings and for the development of carbon limits. Sweden is currently the only Nordic country that has established a mandatory data reporting format and a database infrastructure for handling the data from carbon declarations that are being delivered to the authorities. It is available for researcher on request and is planned to be open when the quality is assured. Boverket is also providing summarised statistics (Boverket, 2024) on the climate impact derived from the data and presents the data on a dedicated website.
Iceland has also prepared a digital infrastructure (Húsnæðis- og mannvirkjastofnun, n.d.) for gathering climate declaration data for when the requirement in the building regulations is taken into force on 1 September 2025, but it is not yet mandatory to use. Denmark has created a voluntary reporting scheme in excel-format (BR18 - Bygningsreglementet, 2021), that can be used to hand in LCA results to the authorities.
The handling and availability of data collected from carbon declarations in the other Nordic countries remains undecided.
3.4 A harmonised approach for monitoring decarbonisation of the building stock
- Carbon emissions, related to the developing building stock, should be monitored with a dual-level monitoring system in place: National accounts (already established) and building-level accounts.
- The Swedish model for sectoral account developed by Boverket and Swedish Statistics can be introduced in the Nordic countries for a harmonised, detailed sectoral monitoring approach.
- A building-level monitoring approach needs to be established. For a harmonised Nordic approach to monitoring emissions related to new buildings, the Nordic countries can follow the Swedish method (Boverket) for disclosing data from all collected carbon declarations for new buildings.
- For building-level monitoring of emissions related to operational energy use, leverage data from the EU building stock observatory with Nordic emission factors.
- For building-level monitoring of emissions related to renovations introduce climate declaration on renovations (starting with larger renovations). Follow the recommendations on data collection and disclose data on A-modules (material production and construction site).
- For building-level monitoring of emissions related to building demolishing, strengthen the data collection on the amount of construction waste divided in fractions. Monitor the waste management of construction waste fractions.
It is recommended to monitor emissions on both sectoral level and building levels combined. This recommendation is based on the understanding that each approach offers unique insights and benefits that are crucial for a comprehensive assessment of the environmental impact of the building stock and for the effective implementation of decarbonisation strategies.
Sectoral emission accounts provide a macroscopic view of emissions. This perspective is essential for understanding the overall environmental impact and for relating emissions to national policies outlined in Chapter 2. Building-level emission accounts focus on individual buildings or types of buildings. This detailed perspective is necessary for identifying specific emission sources, hotspots and opportunities for mitigation at a more granular level, and allows building sector stakeholders to develop strategies on a building level.
This monitoring approach enables adaptive management and evidence-based decision-making. Policymakers and stakeholders can develop strategies that are both broad in scope and detailed in application, leading to more effective and sustainable outcomes in emission reduction and environmental protection.
3.4.1 Sectoral level monitoring
The national level accounting covers the full scope of emissions related to the national economy, which is why it could be concluded that the full scope of emissions related to the elements in the building stock dynamics should be covered. The issue with the national accounting method is the level of detail. It does not match the life cycle modules of buildings and it is not possible to gain insight into emissions distributed into categories such as new building, renovations, buildings use and demolitions.
The Swedish model for sectoral emissions accounting (described in chapter 3.2.1) in the housing and real estate sector tackles this issue by distributing the emissions into the mentioned categories. As the calculation method is based on the industry standard classification system used by the European Union, it could be introduced in all Nordic countries, for a harmonised monitoring approach to a more granular sectoral-level monitoring. It would involve utilising the calculation methodology developed by Boverket in collaboration with SCB and KTH and is deemed to be relatively cost-effective, as the calculation methodology is already developed, and statistic data should be available in correct formats.
3.4.2 Building level monitoring
The primary limitation of the existing data landscape mapped out in the previous chapter is the inability to directly facilitate the monitoring of environmental impact from buildings. To address these limitations, a sampling methodology is recommended. This approach aligns with the introduction of carbon declarations in the Nordic countries in the forthcoming years. Furthermore, the EU Energy Performance of Building Directive (EPBD) Article 7 states that Member States must ensure that the life-cycle Global Warming Potential (GWP) is calculated in accordance with Annex III and disclosed through the energy performance certificate of the building. Establishing a digital infrastructure to manage data derived from carbon declarations and/or GWP disclosed in the energy performance certificates, can provide a more robust foundation for carbon emission modelling. In the following, recommendations for monitoring carbon emissions for each element in the building stock dynamic are presented.

New buildings
For new buildings, the recommendation is to use a sampling method when carbon declarations are in place. Carbon declarations can then be analysed, and data presented. This involves establishing a data-gathering infrastructure. Sweden has established a digital infrastructure and is already utilising the data for presenting carbon accounts. A screenshot from Boverket’s website, with a presentation of median data for all carbon declarations delivered to the Swedish authorities in the period 2022-2023 is shown in Figure 9. It is highly recommended to follow Sweden’s approach on the disclosure of data from carbon declarations. The approach leverages the data and provides a granular understanding of emissions, materials, building parts and types, enhancing comparability.
Figure 9. Overview of climate impact from building types based on statistical data from building carbon declarations Figures modified from original figure from Boverket website (Boverket, 2024).
Iceland has prepared a digital infrastructure for gathering climate declaration data for when requirements laid down in the building regulations enter into force on 1 September 2025. The results are submitted to an electronic LCA submission portal (Húsnæðis- og mannvirkjastofnun, n.d.). It is done by breaking down the results into each life cycle phase A1-A3, A4, A5, B4, B6, C1-C4 and D (see screenshot from submission portal in Figure 10). Stakeholders are encouraged to start using the submission portal before the requirement takes effect.
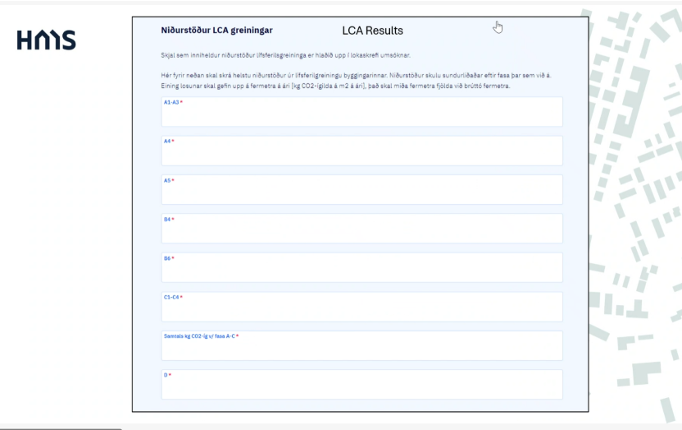
Figure 10. Iceland’s LCA submission portal

Buildings in use
Accounting for carbon emissions from energy use in buildings is a critical component in efforts to decarbonise the building stock. The accounting method should align with established practices and frameworks to ensure consistency and comparability of data. In the context of the European Union, the EU building stock observatory provides a model for accounting practices for energy use in the European building stock. It is recommended to apply the same method and potentially utilise the same data. Use emission factors that represent the amount of CO2 emitted per unit of energy consumed for each energy source.

Renovations
Renovations play a significant role in reducing the overall environmental impact of the building stock, as they provide opportunities to implement energy-efficient technologies and materials. However, current data monitoring for renovations is insufficient or non-existent.
While carbon declarations are not currently required for renovations, their introduction could significantly enhance data availability and accuracy. Carbon declarations for renovations would ensure that data on the environmental impact of renovation projects is systematically collected and reported. On the other hand, excessive reporting requirements might create a barrier to renovation, while renovation should instead be broadly encouraged as a strategy to preserve existing buildings and improve their viability and energy efficiency. A dedicated infrastructure for reporting data would serve as a central repository for data related to renovation activities.

Demolition
There are currently no system or databases in the Nordic countries to directly monitor emissions related to the demolition processes. For emissions related to demolitions or dismantling of buildings for renovations, the recommendation is to focus on utilising construction waste data. Construction waste is recorded in most Nordic countries and typically offers insight into waste fractions and waste amounts generated. This can be coupled with use of emission factors that represent the amount of CO2 emitted per amount of each waste fraction treated. Such factors should be consistent with those used in the EU’s environmental accounts and the System of Environmental-Economic Accounting (SEEA).
3.5 Modelling dynamic elements in future projections
- For projections of carbon emissions related to the development of the building stock consider dynamic variables such:
- Development of emissions factors for energy use (electricity, heating, cooling and gas)
- Development of emissions factors for production of construction materials
- Development in use of recycled construction material
- Renovation rates
- Building stock growth based on population.
- Building typology requirement change
- Dwelling size development
- Materiality and building characteristics change
Unlike static elements, which remain constant, dynamic elements can fluctuate over time. Dynamic scenario variables represent specific variables that are altered within a model to explore alternative scenarios.
To gain a comprehensive understanding of different approaches and methodologies used in modelling dynamic elements in monitoring environmental impact from the building stock, two research studies (Röck, et al., 2021; Ohms, et al., 2024) and two reports on decarbonisation initiatives (International Energy Agency, 2023; UK Green Building Council, 2021) have been analysed to provide valuable insights and examples of how dynamic elements can be effectively incorporated into future projections.
Table 12 presents the analysis by categorising the proposed dynamic elements found in the studies into three groups: emission factors, building stock, and building design. The emission factors category includes variables such as decarbonisation of the electricity grid and material production optimisations. These factors focus on reducing carbon emissions and improving materials. The building stock category captures the variations in the aggregate number of buildings, as affected by a range of dynamic factors. This category explores how factors such as population growth, changes in demographic and urbanisation impact the overall number of buildings. The building design category pertains to modifications in the building’s specifications, including its shape, dimensions and type of construction materials.
By categorising the proposed dynamic elements into these three groups, Table 13 provides a structured overview of the different aspects that could be considered when modelling dynamic elements in future projections.
Table 12. Analysis of dynamic variables for building stock projections included in other relevant studies.
Emission factors (Energy supply, material production optimisation) | Building stock (More/less buildings, more/less of certain types) | Building design (Change in building design, change in material use) | |
Environmental modelling of building stocks – an integrated review of life cycle-based assessment models to support EU policy making |
|
|
|
Dynamic environmental sustainability assessments of the built environment: Coupling material flow analysis. (MFA) and LCA |
|
|
|
IEAs pathway to 1.5-degree |
| ||
UKGBC’s Whole Life Carbon Roadmap |
|
|
|
After analysing the categorisation presented in Table 12, it is important to consider certain elements when modelling dynamic elements in future projections. Based on the analysis, the following recommendations can be made:
Integration of dynamic elements into models
Incorporate changes in building stock size and renovation plans, considering the growth in population and household composition based on demographic projections and the expected increase in retrofitting of existing buildings, as highlighted by the UKGBC’s Whole Life Carbon Roadmap.
Model the impact of changes in building design and materiality, including the increase in built-up area per person, the adoption of low-emission materials like timber and low-impact concrete and the reduction in material usage through design efficiency.
Account for the evolution of energy consumption and the electricity mix, emphasising the shift towards renewable and low-emission energy sources, as well as the anticipated improvements in energy efficiency for heating, cooling, and lighting.
Scenario development
Develop scenarios that reflect different rates of decarbonisation of the energy supply, as suggested by the IEA’s Pathway to 1.5-Degree report, and the optimisation of material production processes. Scenarios for decarbonisation of the energy supply cannot stand alone, as this would make the model incomplete. Decarbonisation scenarios should be made for all processes within the system boundary (transportation, construction site, material production, waste management etc.)
Create scenarios based on the anticipated reduction in operational carbon emissions and average energy usage in residential and commercial buildings, as outlined in the UKGBC’s Whole Life Carbon Roadmap.
Consider scenarios that simulate the impact of climate change on building characteristics and the consequent changes in building typology requirements.
Policy and strategy alignment
Align the scenarios with existing national policies and strategies, such as the national decarbonisation strategies, renewable energy plans, carbon neutrality goals and national plans for renovation of the building stock.
Incorporate strategies for energy decarbonisation, including renewable energy and other low emissions energy resources, as well as the increase in energy demand from the building sector.