7. Climate projections for the Barents and Norwegian Sea with NoBa Atlantis
Cecilie Hansen and Ina Nilsen
Institute of Marine Research, Norway
Institute of Marine Research, Norway
7.1 The NoBa Atlantis end-to-end ecosystem model
The Nordic and Barents Seas Atlantis model (NoBa Atlantis) is an implementation of the general Atlantis framework developed by Elizabeth Fulton at CSIRO, Australia (Fulton et al. 2011). NoBa has 53 species and functional groups, which are defined to represent the functioning ecosystem even if simplified (Fig. 33). Important commercial species, such as Northeast Atlantic cod, snow crab, mackerel and Norwegian spring spawning herring, are all represented by individual components, while small pelagic fish, corals, benthic detritivores and mesopelagic fish are represented as larger functional groups. The model uses a three-dimensional grid to represent the ecosystem, with each grid cell or "box" representing a specific area of the sea. These boxes are defined based on ecological gradients, bathymetry (sea floor topography), and management boundaries. The parameterization of NoBa is provided in detail in Hansen et al. (2016), and a sensitivity study of the most calibrated parameters is performed in Hansen et al. (2019). There are three different species representations available in the Atlantis framework: age structured vertebrates, age structured invertebrates and invertebrate biomass pools. The age structured invertebrates are in NoBa only representing two groups: the shrimp and the cephalopods. Snow crabs are implemented as vertebrates to be able to reconstruct their expansion and potential biomass development in the Barents Sea. Species are seasonally redistributed according to predefined seasonal patterns, except baleen whales, which have a density dependent movement. There are several options for adding temperature sensitivity in Atlantis, requiring information on optimal temperatures for movement, recruitment and spawning, in addition to how temperature impacts their growth rates. In the version of the model used for this project, a knife-shaped cut off has been applied, which in practice means that individuals who experiences temperature outside of its range will 1) either move or die, 2) not be able to spawn and 3) the temperature will impact its growth rates. In this version of the model code, it was not possible to disconnect these, such that temperature effects will always impact all these processes.
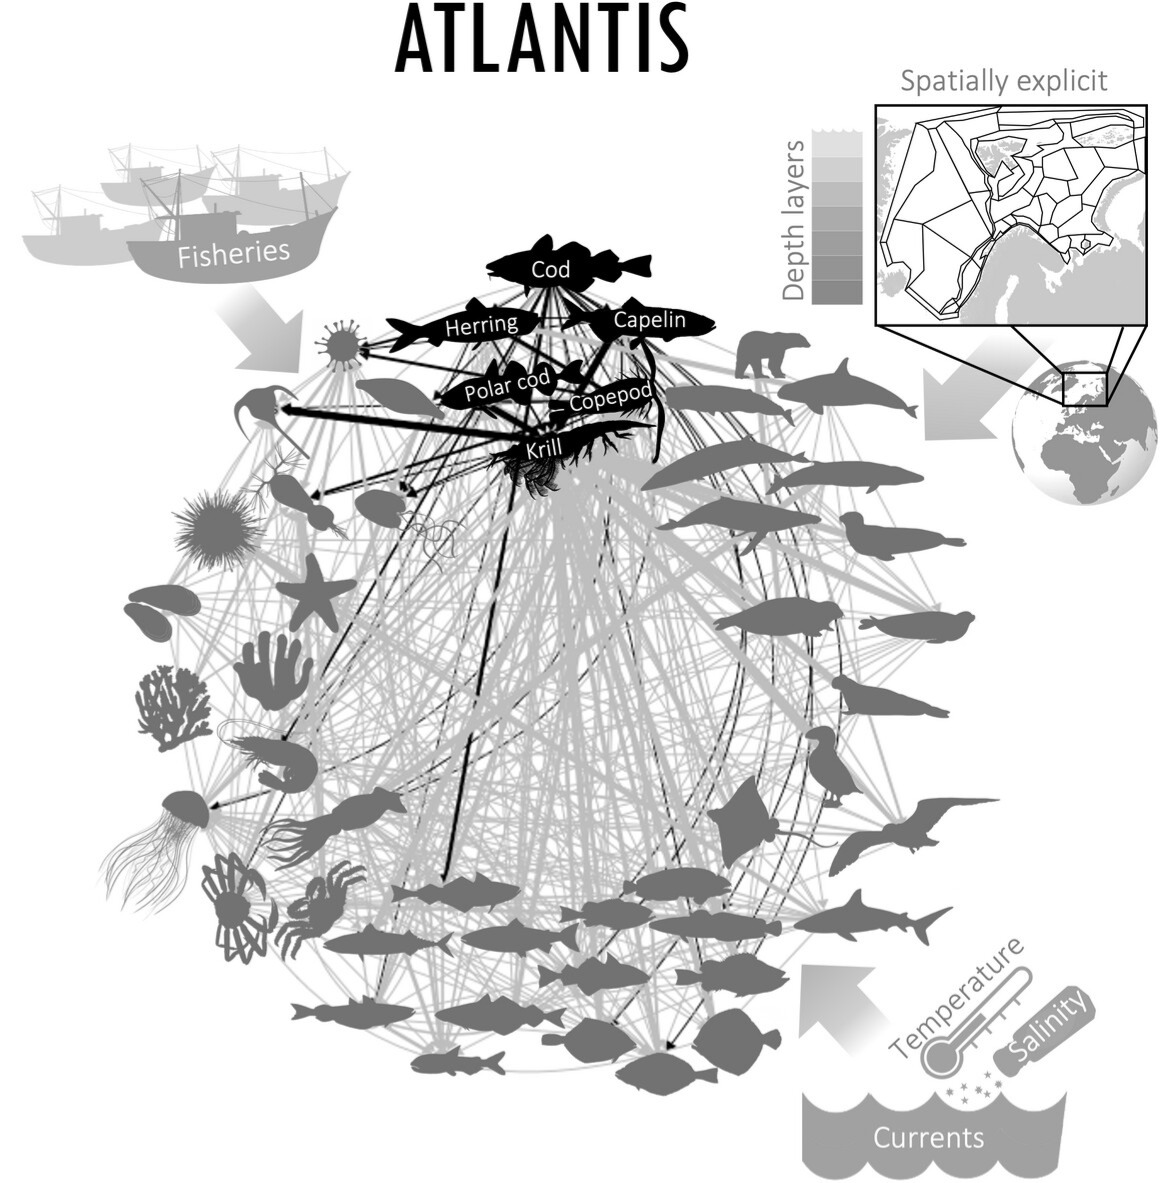
Figure 33. The diet matrix in NoBa Atlantis connects the functional groups, while fisheries, temperature, salinity, ice and currents act as forcing to the model. From Nilsen et al. (2022).
NoBa requires daily input of temperature, salinity, volume flux (between faces and layers in the polygons) and sea ice thickness and concentration. In Nilsen et al. (2023), the impact of resolution of the physical model used for forcing was explored. The study showed that if regional downscaling is not available, a global model can be used as input, as the Atlantis polygons are relatively coarse. However, the downscaled regional model used for forcing in the study was based on the global model, and recent findings have shown that they are both in the colder range of the projections, such that the SSP5-8.5 applied in our simulations are more similar to SSP2-4.5 in other global models. There is ongoing work to downscale from other global models, to evaluate the potential differences between the projections. Each polygon-layer combination in NoBa gets a daily input of the physical parameters, which is then applied in the biological processes.
7.2 Results and discussion
It has earlier been concluded that the knowledge of the response of phytoplankton and zooplankton to future climate change has only low confidence. In an ecosystem model this would also propagate to higher trophic levels. In the simulations explored here (Nilsen et al. 2024), this uncertainty has been accounted for by adding nine different perturbation simulations (Fig. 34) to each of the three projections (SSP1-2.6, SSP2-4.5, SSP5-8.5). The perturbations have been performed by linearly increasing/decreasing the growth rates of the phytoplankton and zooplankton. The level of the perturbations was based on projected changes in NORWECOM.E2E (Sandø et al. 2024). Note that snow crab was removed from the results due to a bug in their set-up, causing a population crash (not related to temperature change).
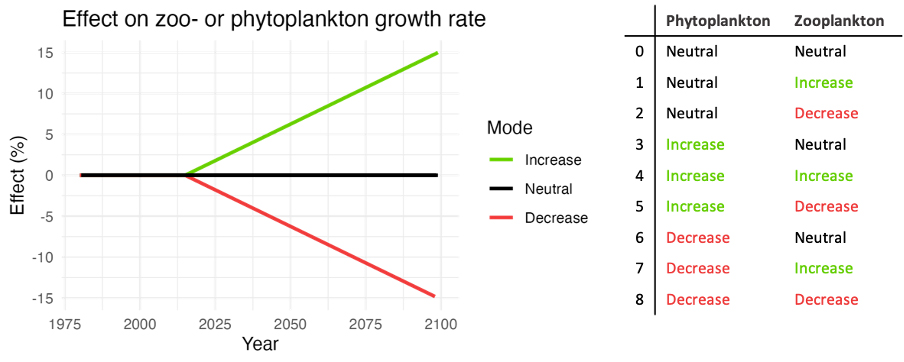
Figure 34. Each future projection includes nine simulations, where a combination of linear increase/decrease of zooplankton and phytoplankton has been applied. From Nilsen et al. (2024).
Due to the level of uncertainties in the study, among others connected to how the individual species’ functional temperature response was implemented, the study focuses on the processes behind the responses.
Depending on their temperature ranges, and the accuracy in the knowledge of these, the species have from a strong negative response to a strong positive response. Prawns and mesopelagic fish turned out as climate winners, while, e.g., capelin and Greenland halibut are climate losers (Fig. 35). Polar cod, where a strong negative response was expected, did not show a clear response to temperature. This can be explained by the lack of connections between the recruitment function of polar cod and sea ice; however, it is not clear whether a strong significant relationship exist for the whole stock, and how dependent their survival is on the sea ice extent in spring and summer.

Figure 35. Species response to future projections, when compared to their median levels across 2090–2099 (the last 10 years of the simulation) for the SSP1-2.6 projection. The species are sorted by effect on biomass from positive response (green, increase) to negative response (red, decrease). From Nilsen et al. (2024).
All in all, there were seven species that responded positive to climate change (Fig. 35). When comparing their biomass trajectories, the differences became evident toward the last part of the projections, after 2065. This is the same time slot as when the physical responses diverge in the Nemo-NAA10km model and is thus expected. Haddock was among these species but is known from earlier studies to have strong responses to perturbations in the model system. This is due to its recruitment function, something shown in the large range around its response, driven by the perturbations in each of the nine simulations representing each of the projections. The prawns experienced a strong growth-related response to higher temperatures, particularly in shallow-depth polygons close to the coast. In some of these polygons, the temperature would increase beyond their tolerance limit toward the end of the projections, but the biomass fraction contained in these polygons is significantly lower than the total biomass, hence a positive response was reported for the population as such (Fig. 36).
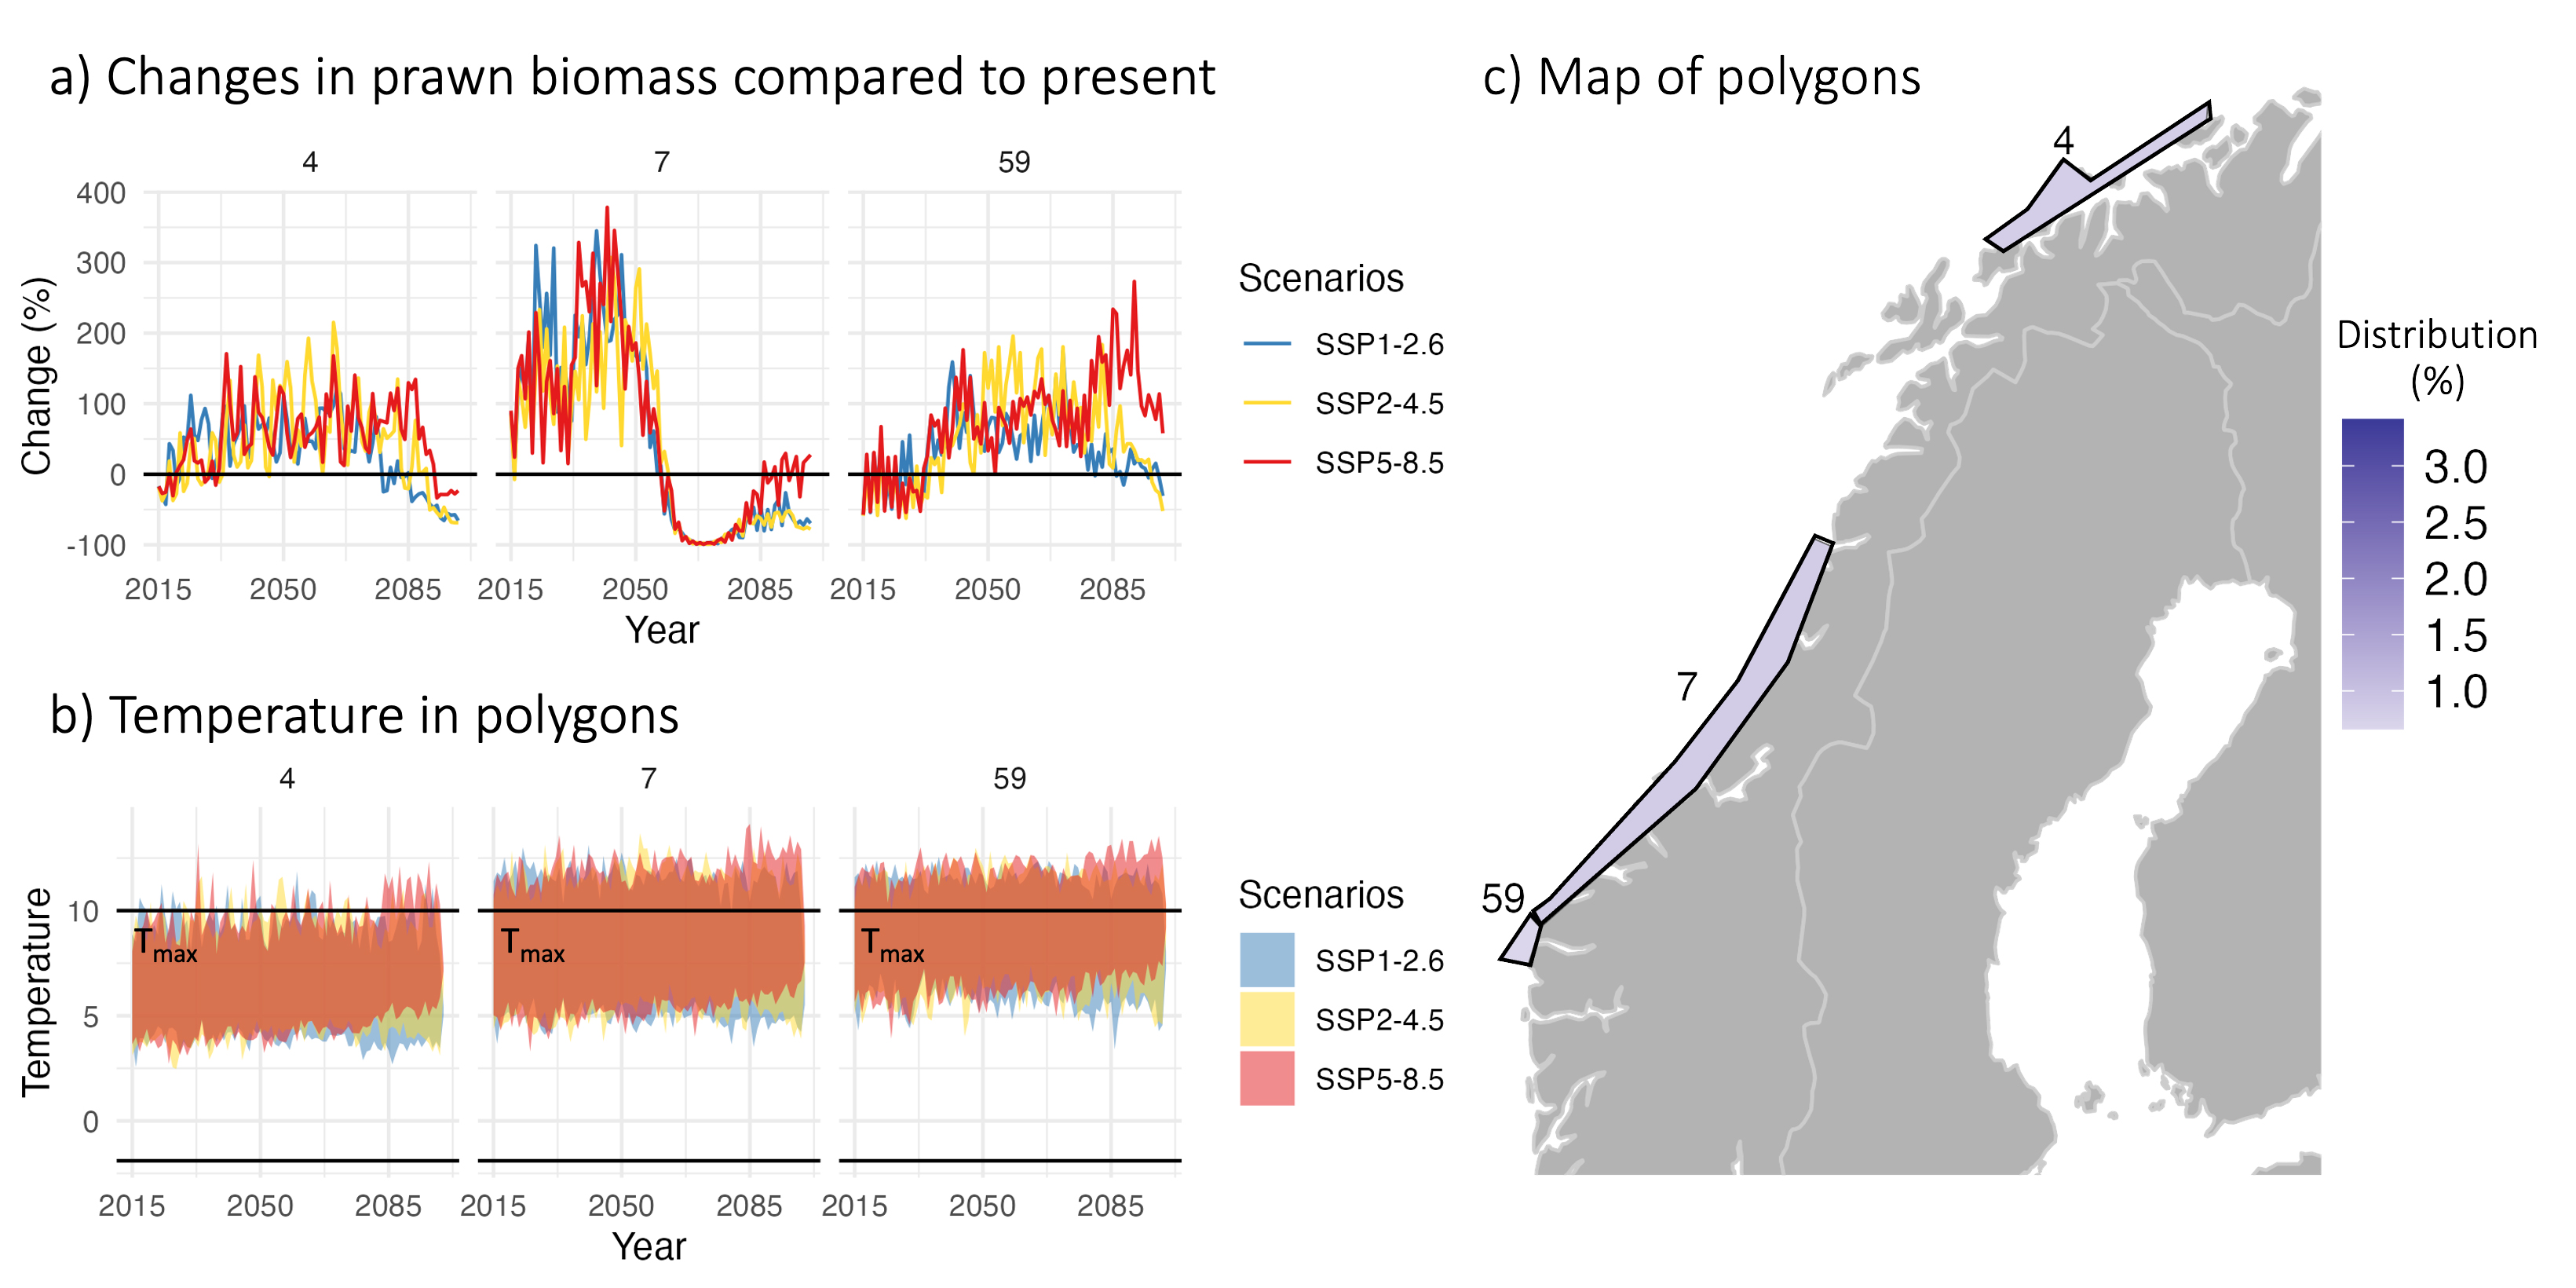
Figure 36. Changes in prawn biomass under three different climate change scenarios a) compared to present, the temperature in the three selected polygons, including tolerance levels (Tmax) b), and the location of these shallow water polygons c). From Nilsen et al. (2024).
Twelve species responded negatively to the projected climate change (Fig. 35), among these, cod and capelin. The decrease in cod was strongly related to the decrease in capelin, caused by a decline of large zooplankton in their main summer-feeding areas. The consumption of capelin by cod was reduced by 18% in the SSP5-8.5 projection, double the decrease in the SSP1-2.6 projection.