3.4 The journey of participating citizens
This section describes the journey of participating citizens based on surveys conducted during the initiative. The surveys provide insight into citizens’ wardrobe needs and solutions, including indications about the extent to which the challenge resulted in changes in consumer behavior towards a more circular approach prolonging the lifespan of textiles.
3.4.1 The wardrobe survey (December 2023)
Participating citizens started with a wardrobe survey in December 2023 in which they mapped out the content and the characteristics of their own wardrobes. The exercise involved estimating the amount of clothes they owned,
The respondents were asked to provide a rough estimate, excluding socks and underwear.
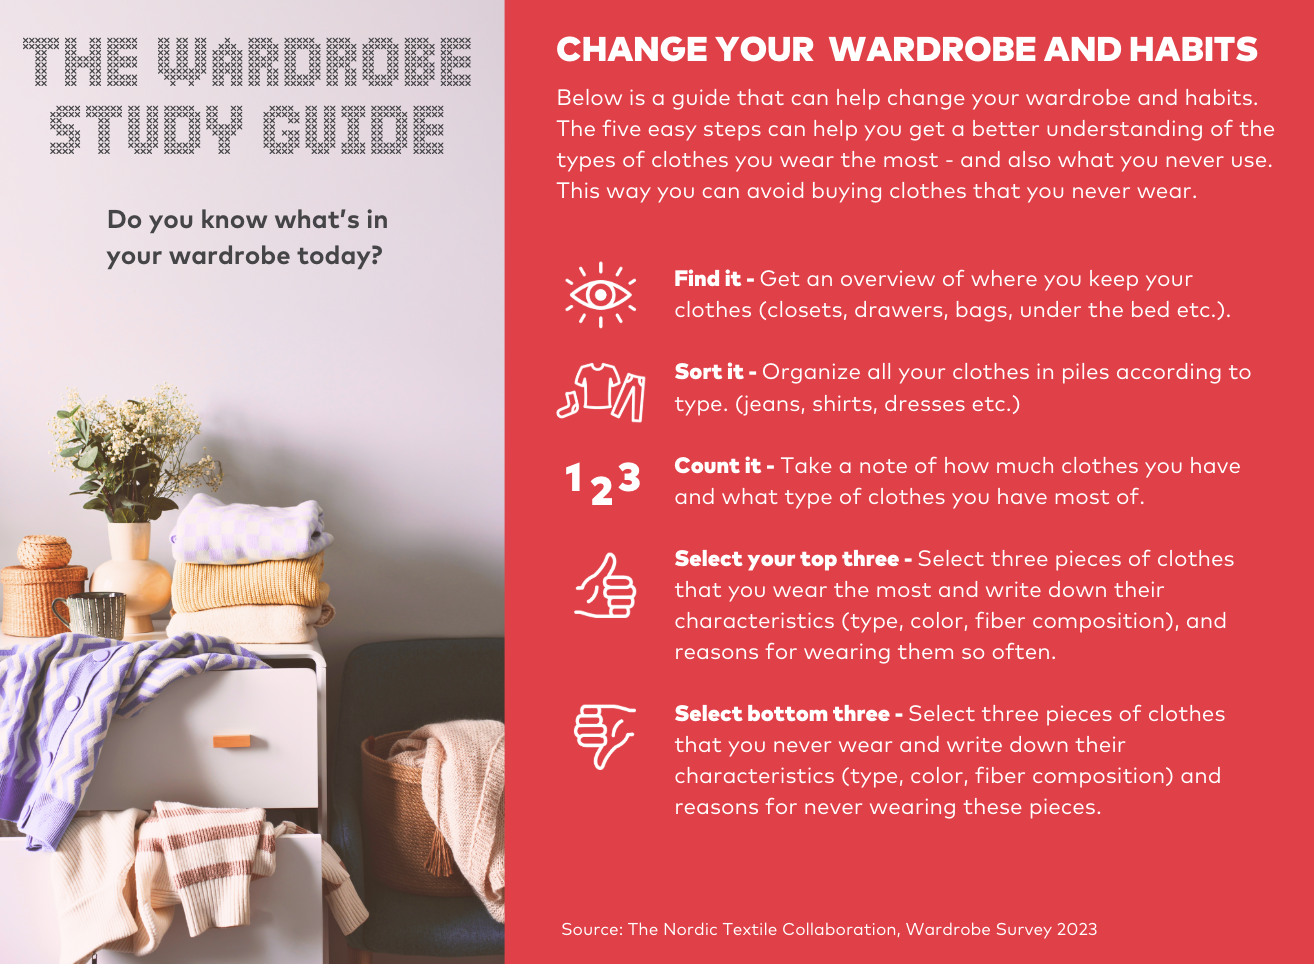
This part of the questionnaire was inspired by wardrobe study methods. See, for example, Else Skjold & Johanne Stenstrup (2020) Klæd dig bedre: En guide til mindre tøjspild og mere garderobeglæde (Gyldendal) and Kate Fletcher & Ingunn Grimstad-Klepp (2017) Opening up the wardrobe: A Methods Book (Novus).
Infographic developed by Holm Kommunikation based on the Wardrobe Survey 2023
a) Wardrobe size
Around one quarter of the respondents (26%) estimated they had fewer than 100 pieces of clothing in their wardrobe. A little less than half of the respondents (40%) reported having between 101–200 pieces of clothing in their wardrobe. In comparison, 19% stated that they had 201–300 pieces of clothing in their wardrobes, whereas the remaining 15% of the respondents reported owning more than 300 pieces of clothing. This pattern was more or less the same across the four Nordic countries.
Country | 0–100 pieces | 101–200 pieces | 201–300 pieces | 300 or more pieces |
Denmark | 7 | 9 | 3 | 3 |
Finland | 8 | 7 | 4 | 3 |
Norway | 2 | 5 | 1 | 1 |
Sweden | 2 | 9 | 6 | 4 |
Subtotals | 19 | 30 | 14 | 11 |
Percentage of all respondents | 26 | 40 | 19 | 15 |
The table shows the number of citizens from each country grouped by wardrobe size. For example, seven participants from Denmark report having up to 100 pieces of clothing in their wardrobe.
Source: The Wardrobe Survey, December 2023
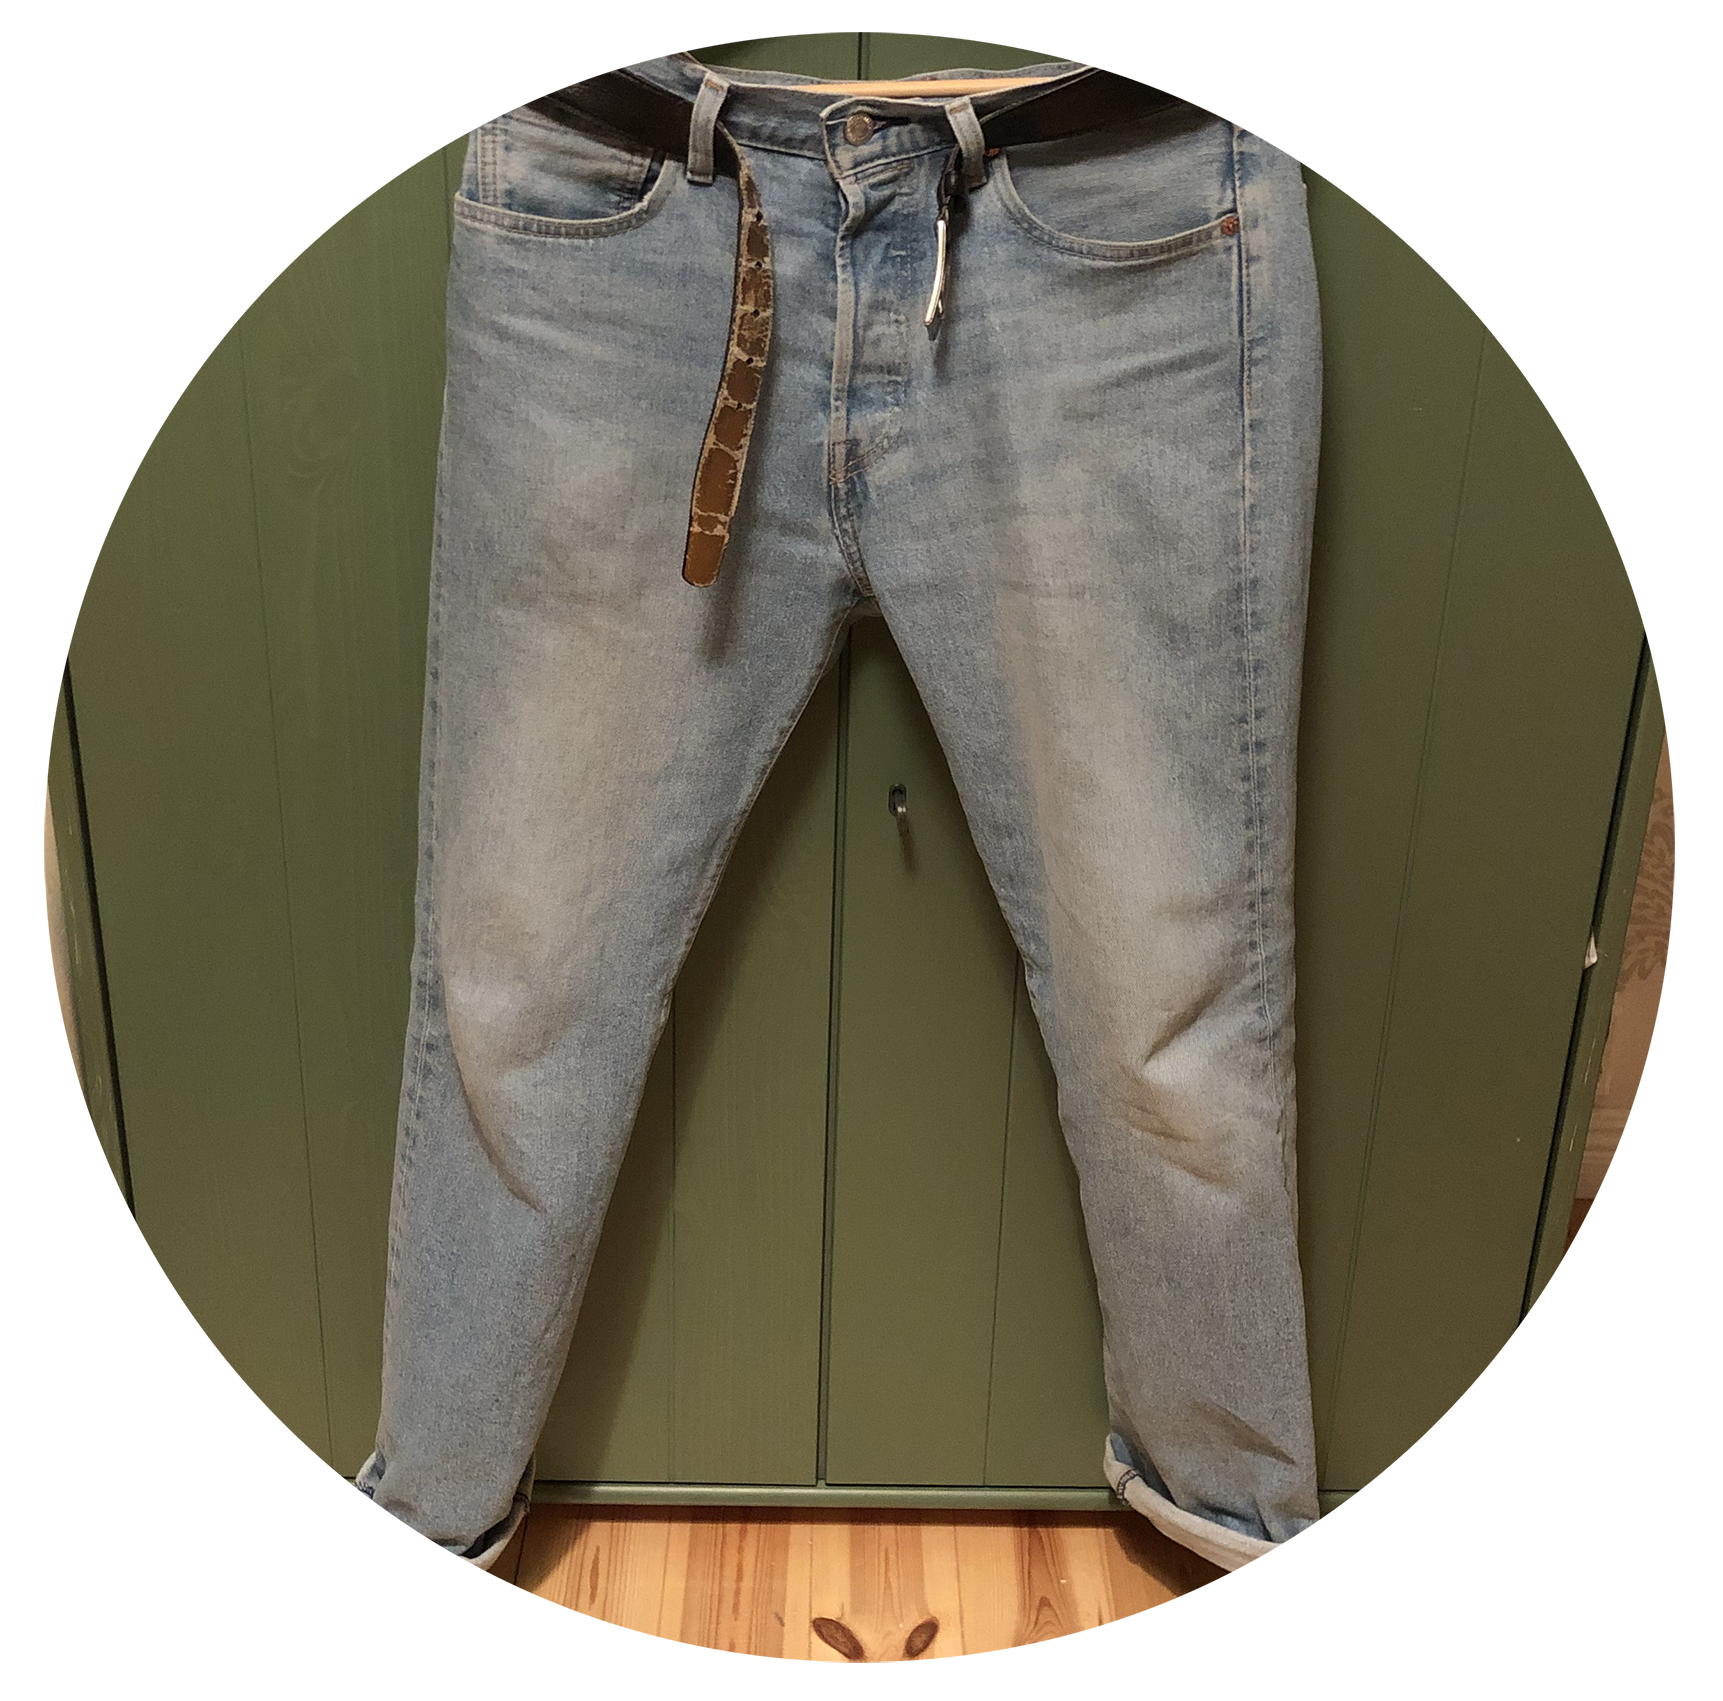
b) The three most-used pieces of participating citizens
In the wardrobe survey, citizens were asked to identify and describe the three pieces of clothing that they use the most. The survey shows that pants, jeans and leggings (35.4% of the responses), long-sleeved shirts and blouses (33% of the responses), and dresses (8.1% of the responses) constituted the top 3 of participating citizens’ most-used pieces of clothing, closely followed by t-shirts (7.2% of the responses), jackets (5.3% of the responses) and tops (4.8% of the responses). Few participants reported skirts as the most-used items (2.4% of the responses), whereas blazers, vests, bathrobes, gym clothes, one-pieces and shorts were reported by only 1 or 2 respondents (in total, these categories amounted to 3.8% of the responses).
Most-used clothes among participating citizens
The table shows the categories of clothing that participating citizens have included in their top 3 most used pieces. The numbers in the table refer to the number of times the specific category was mentioned. For example, the items within the category “pants, jeans and leggings” were mentioned 74 times corresponding to 35.4% of the total number of responses.
Source: The Wardrobe Survey, December 2023
Having identified the most-used pieces of clothing, the participants described key characteristics of these items, including colors, fiber compositions and reasons for wearing them so often. The survey shows that the majority of the most-used pieces of clothing were one-color pieces in black, blue, gray or white (68% of the pieces). In comparison, pieces with more than one color amounted to 13% of the most-used clothes. When it came to fiber composition, the most-used clothes typically contained lots of cotton (26% of the most-used clothes were made from 100% cotton, and 22% consisted of a mixture of fibers with at least 50% cotton). In comparison, 12.5% of the most-used clothes were made from a blend that mostly contained polyester (at least 50% polyester).
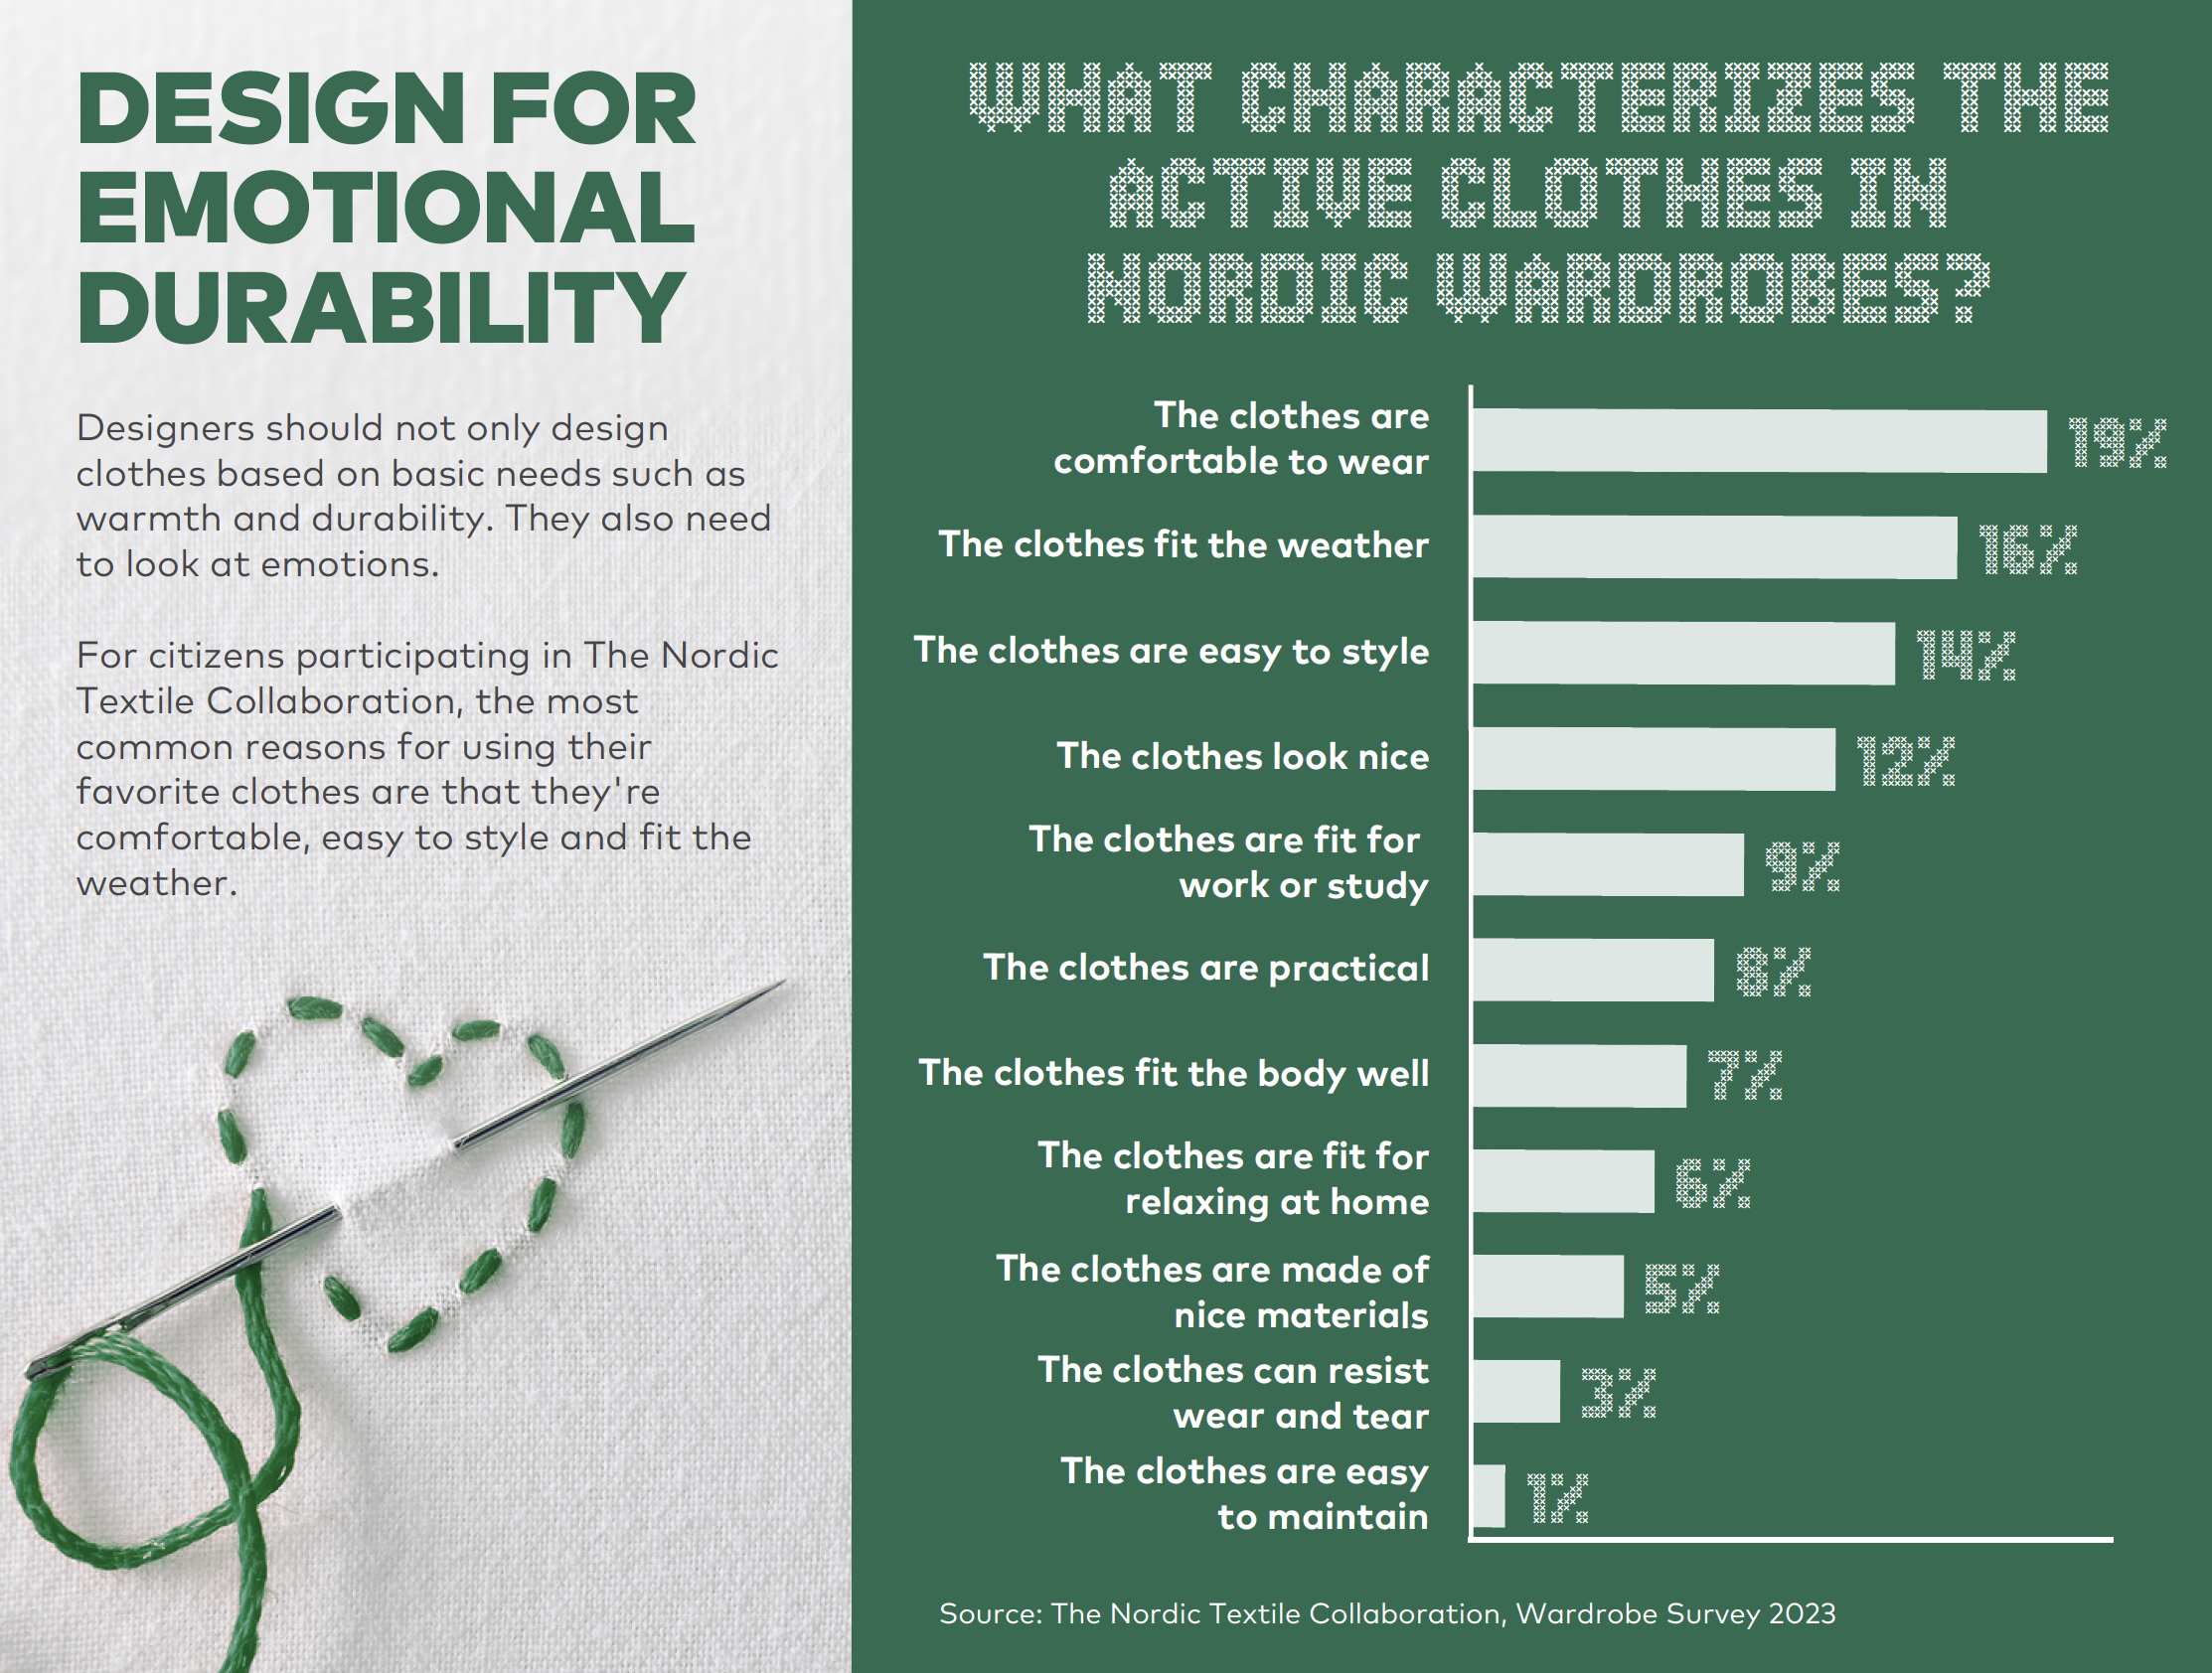
The main reasons for wearing the pieces so often included that the clothes were comfortable to wear (19% of the responses), were weather-appropriate (16% of the responses), and were adaptable, i.e., they were easy to combine with other pieces and easy to use in many different contexts, such as for work and festive occasions (14% of the responses):
Infographic developed by Holm Kommunikation based on the Wardrobe Survey 2023
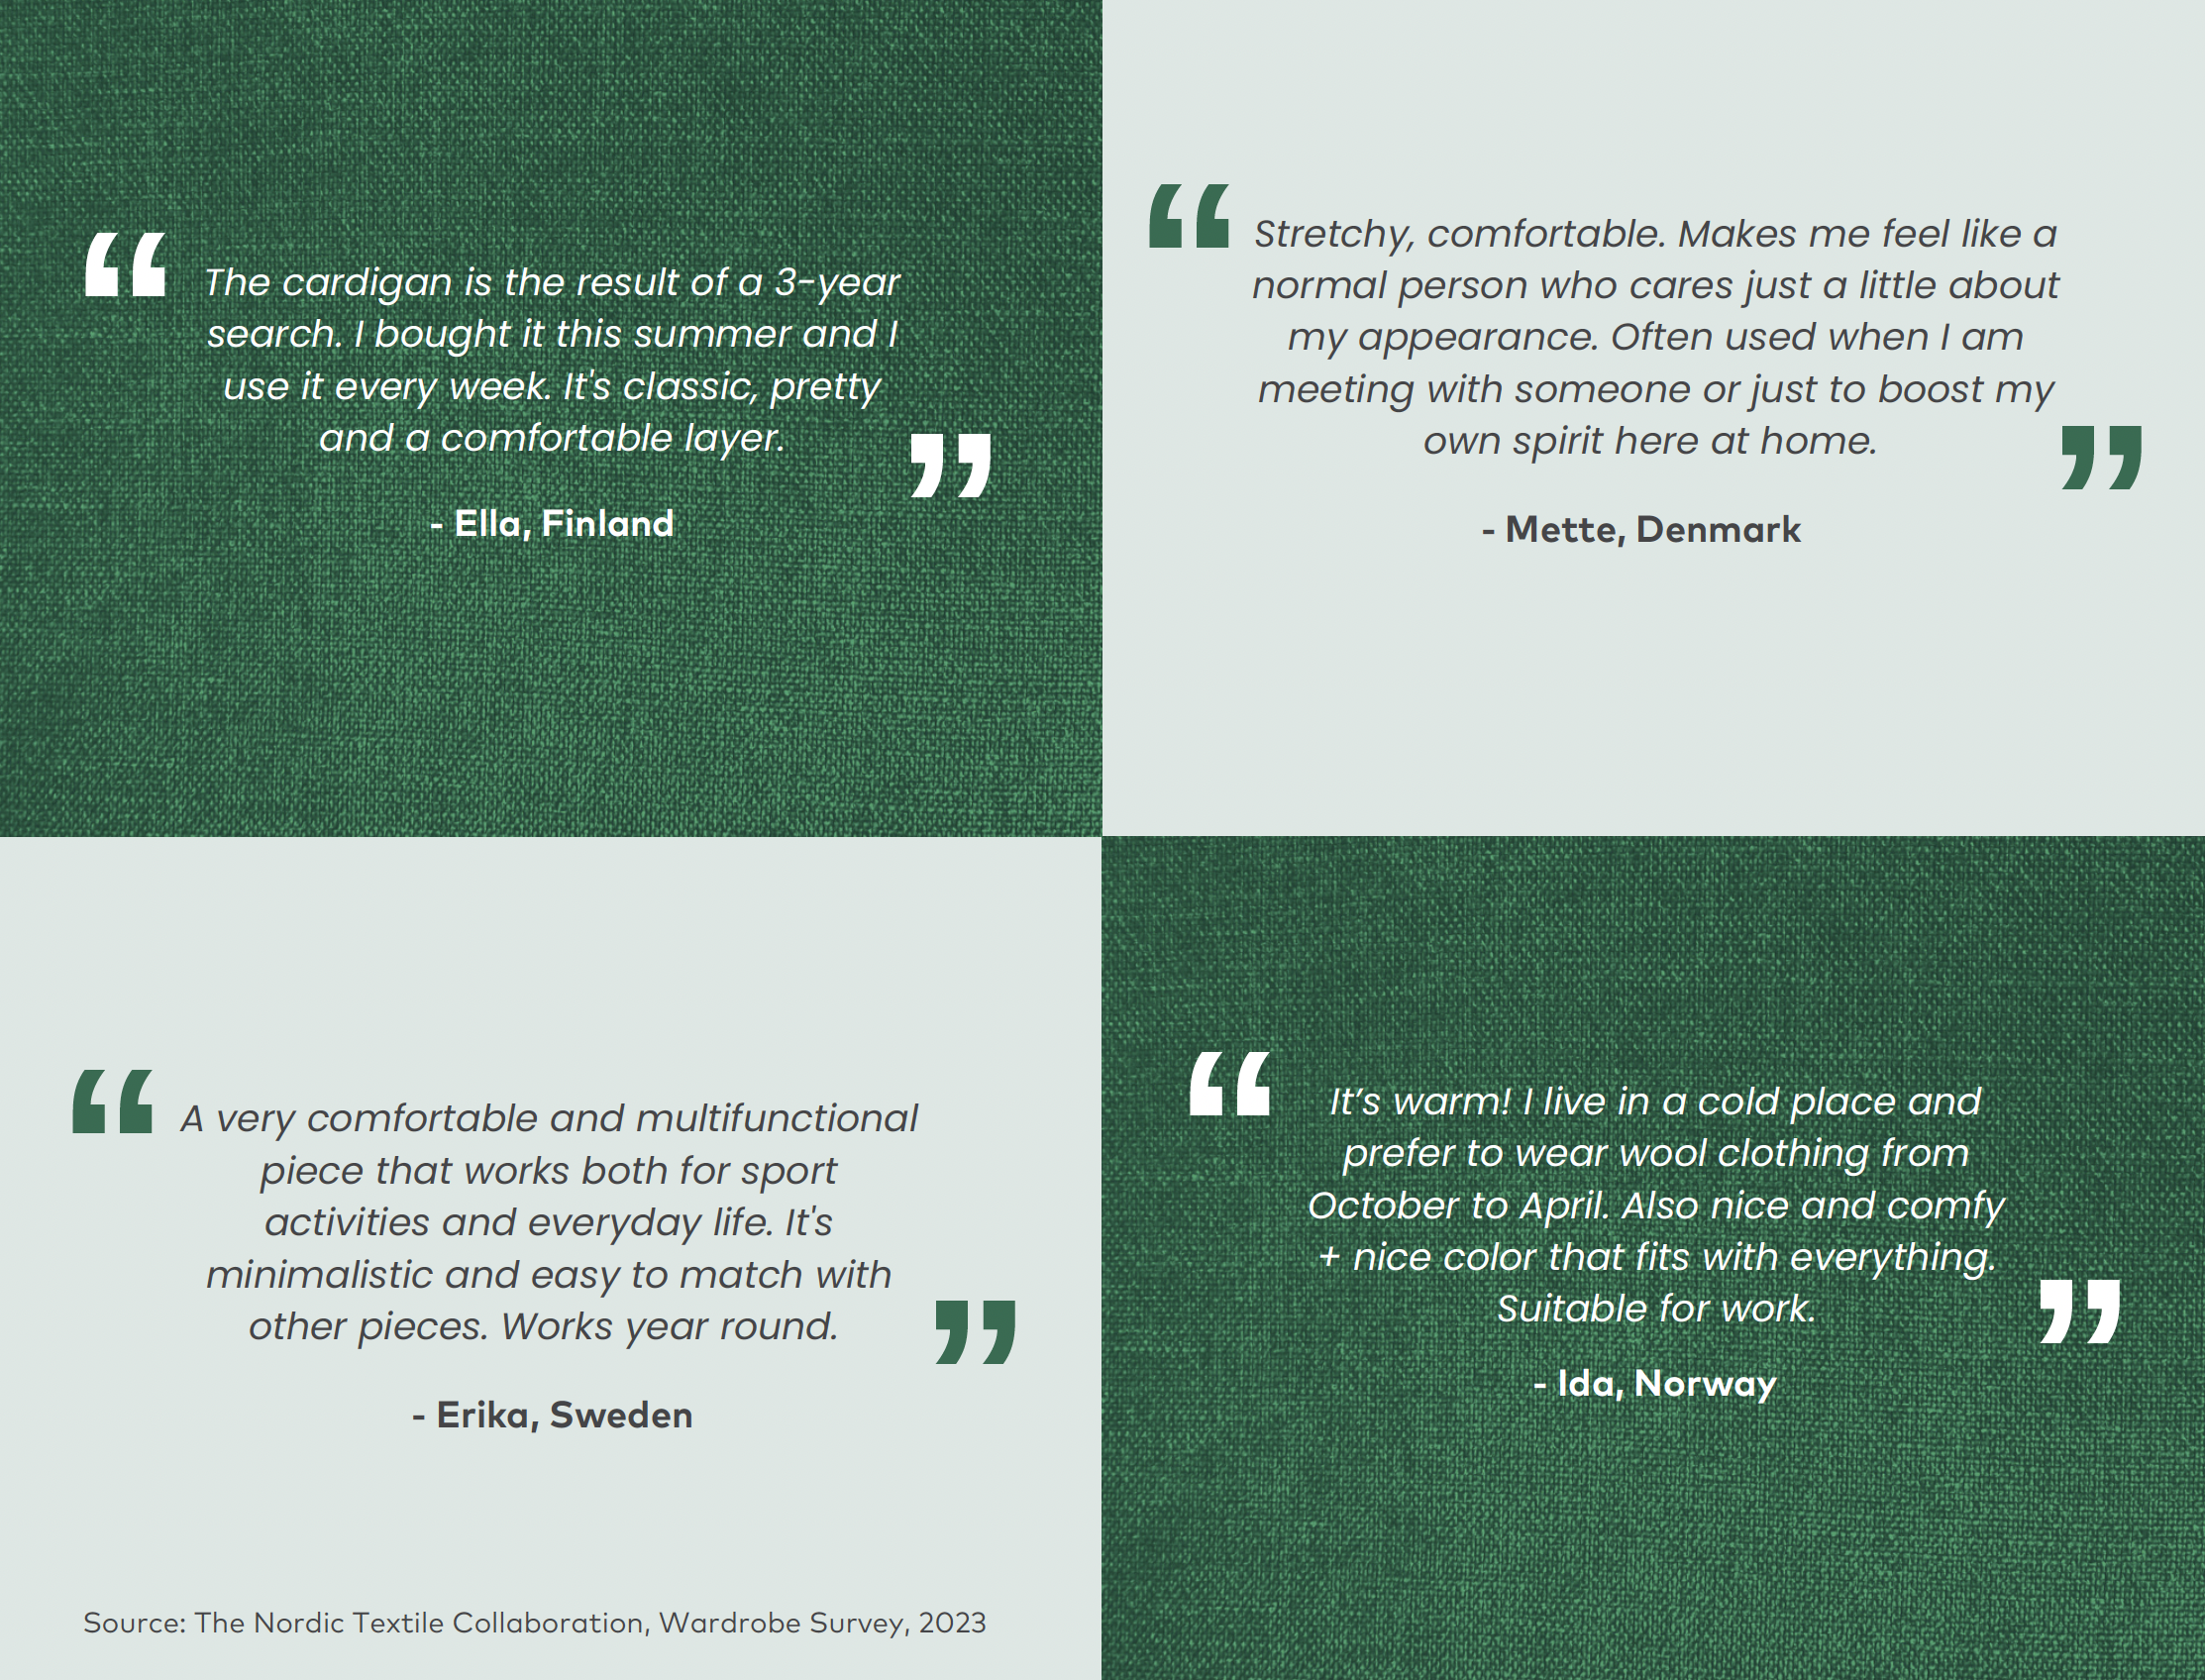
The infographic displays quotes from participating citizens describing key characteristics of their most used clothes.
Infographic by Holm Kommunikation based on the Wardrobe Survey 2023
Infographic by Holm Kommunikation based on the Wardrobe Survey 2023
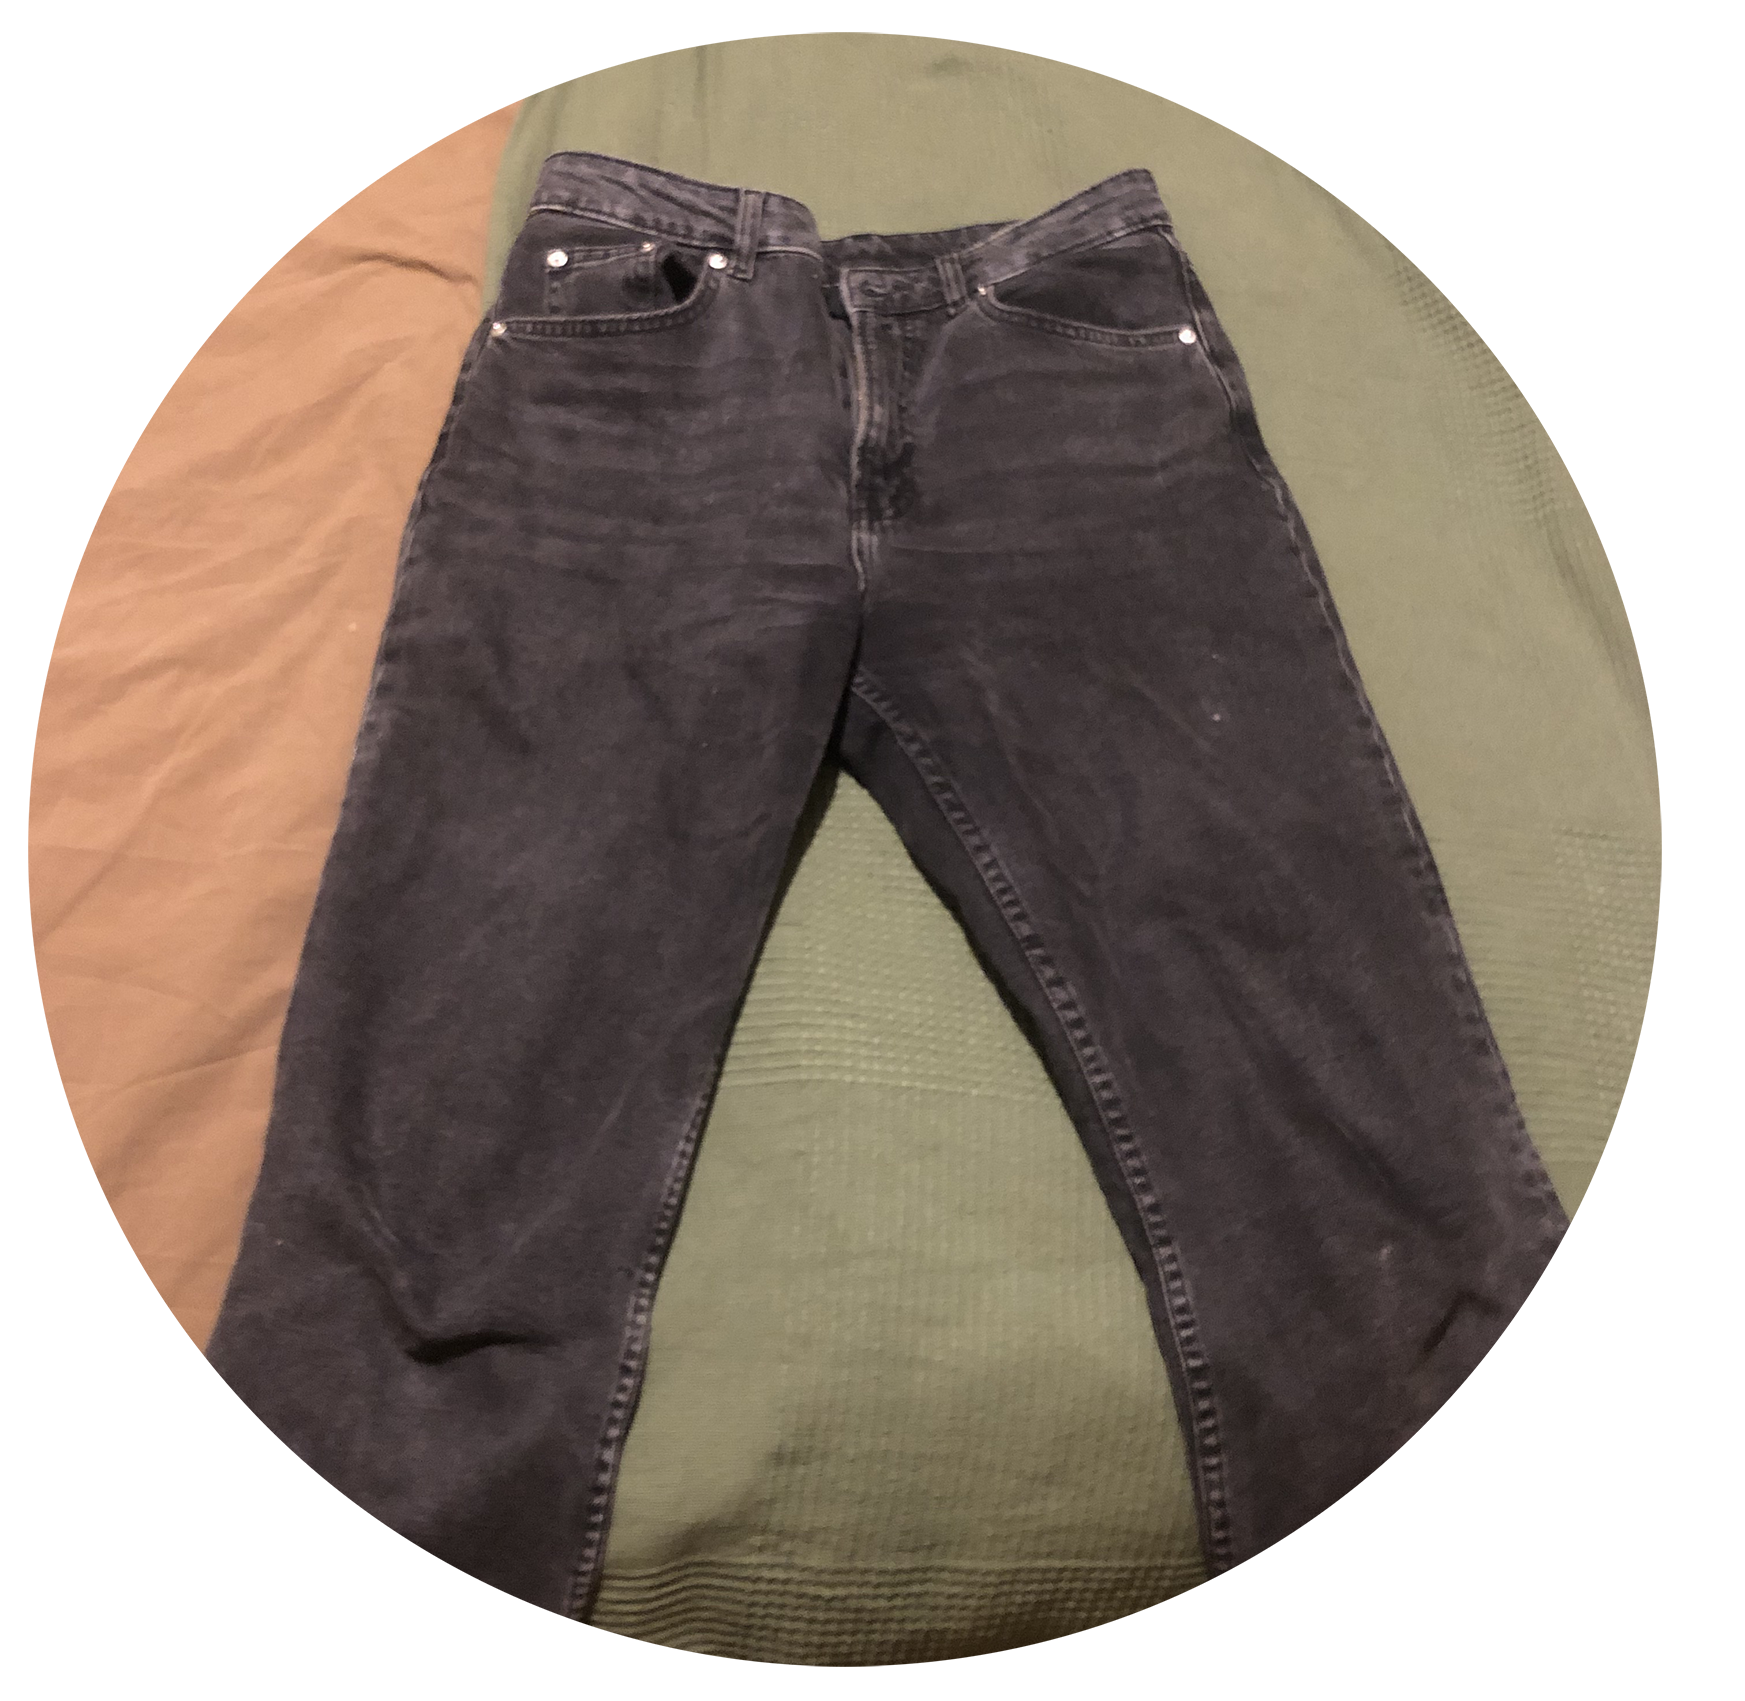
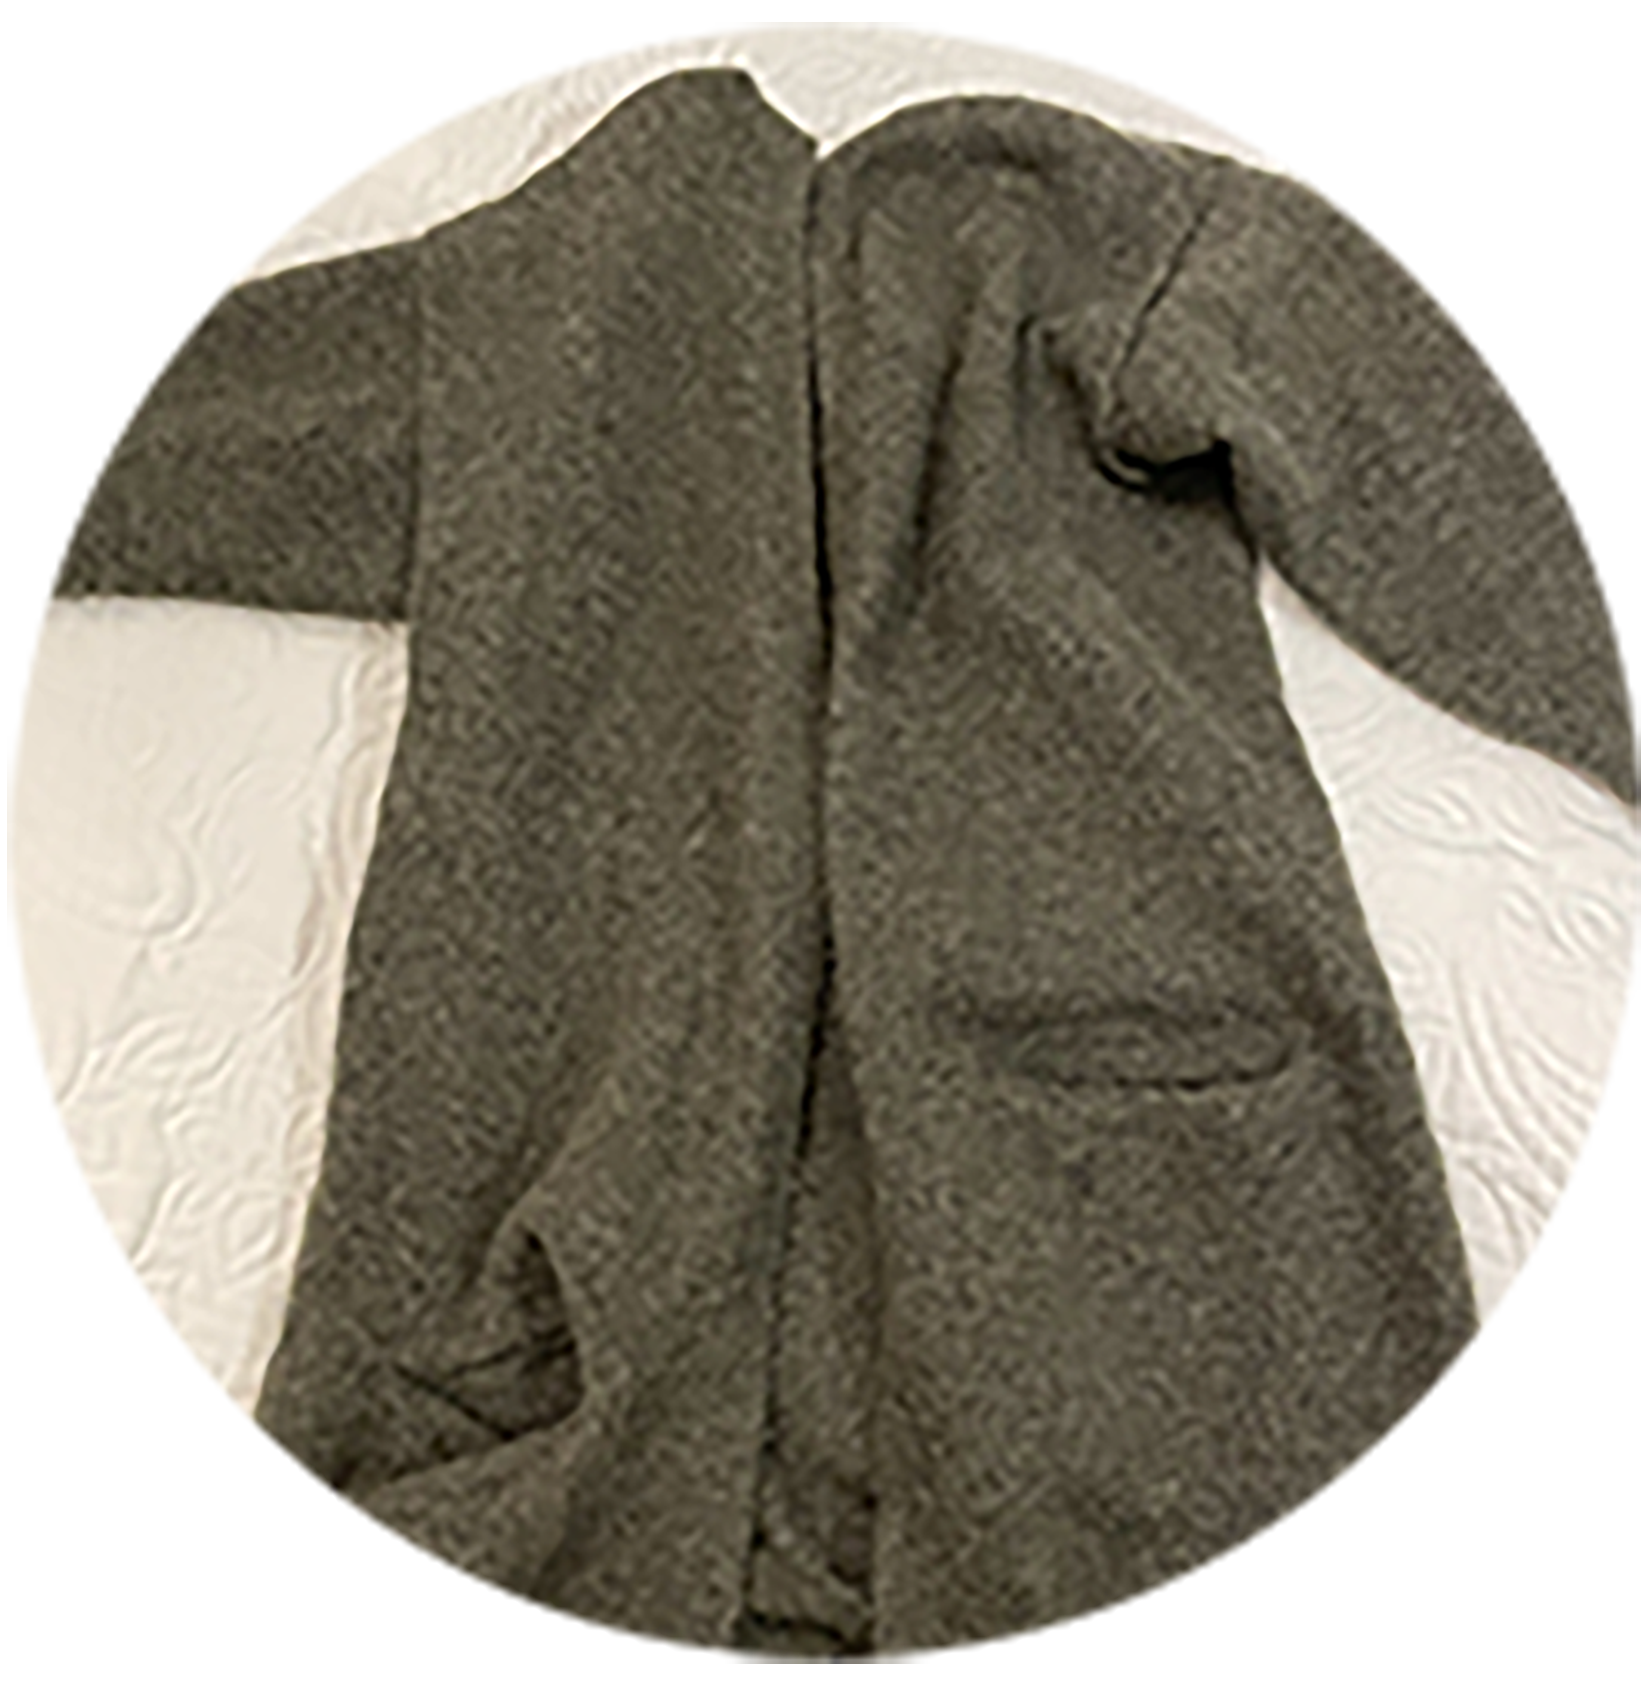
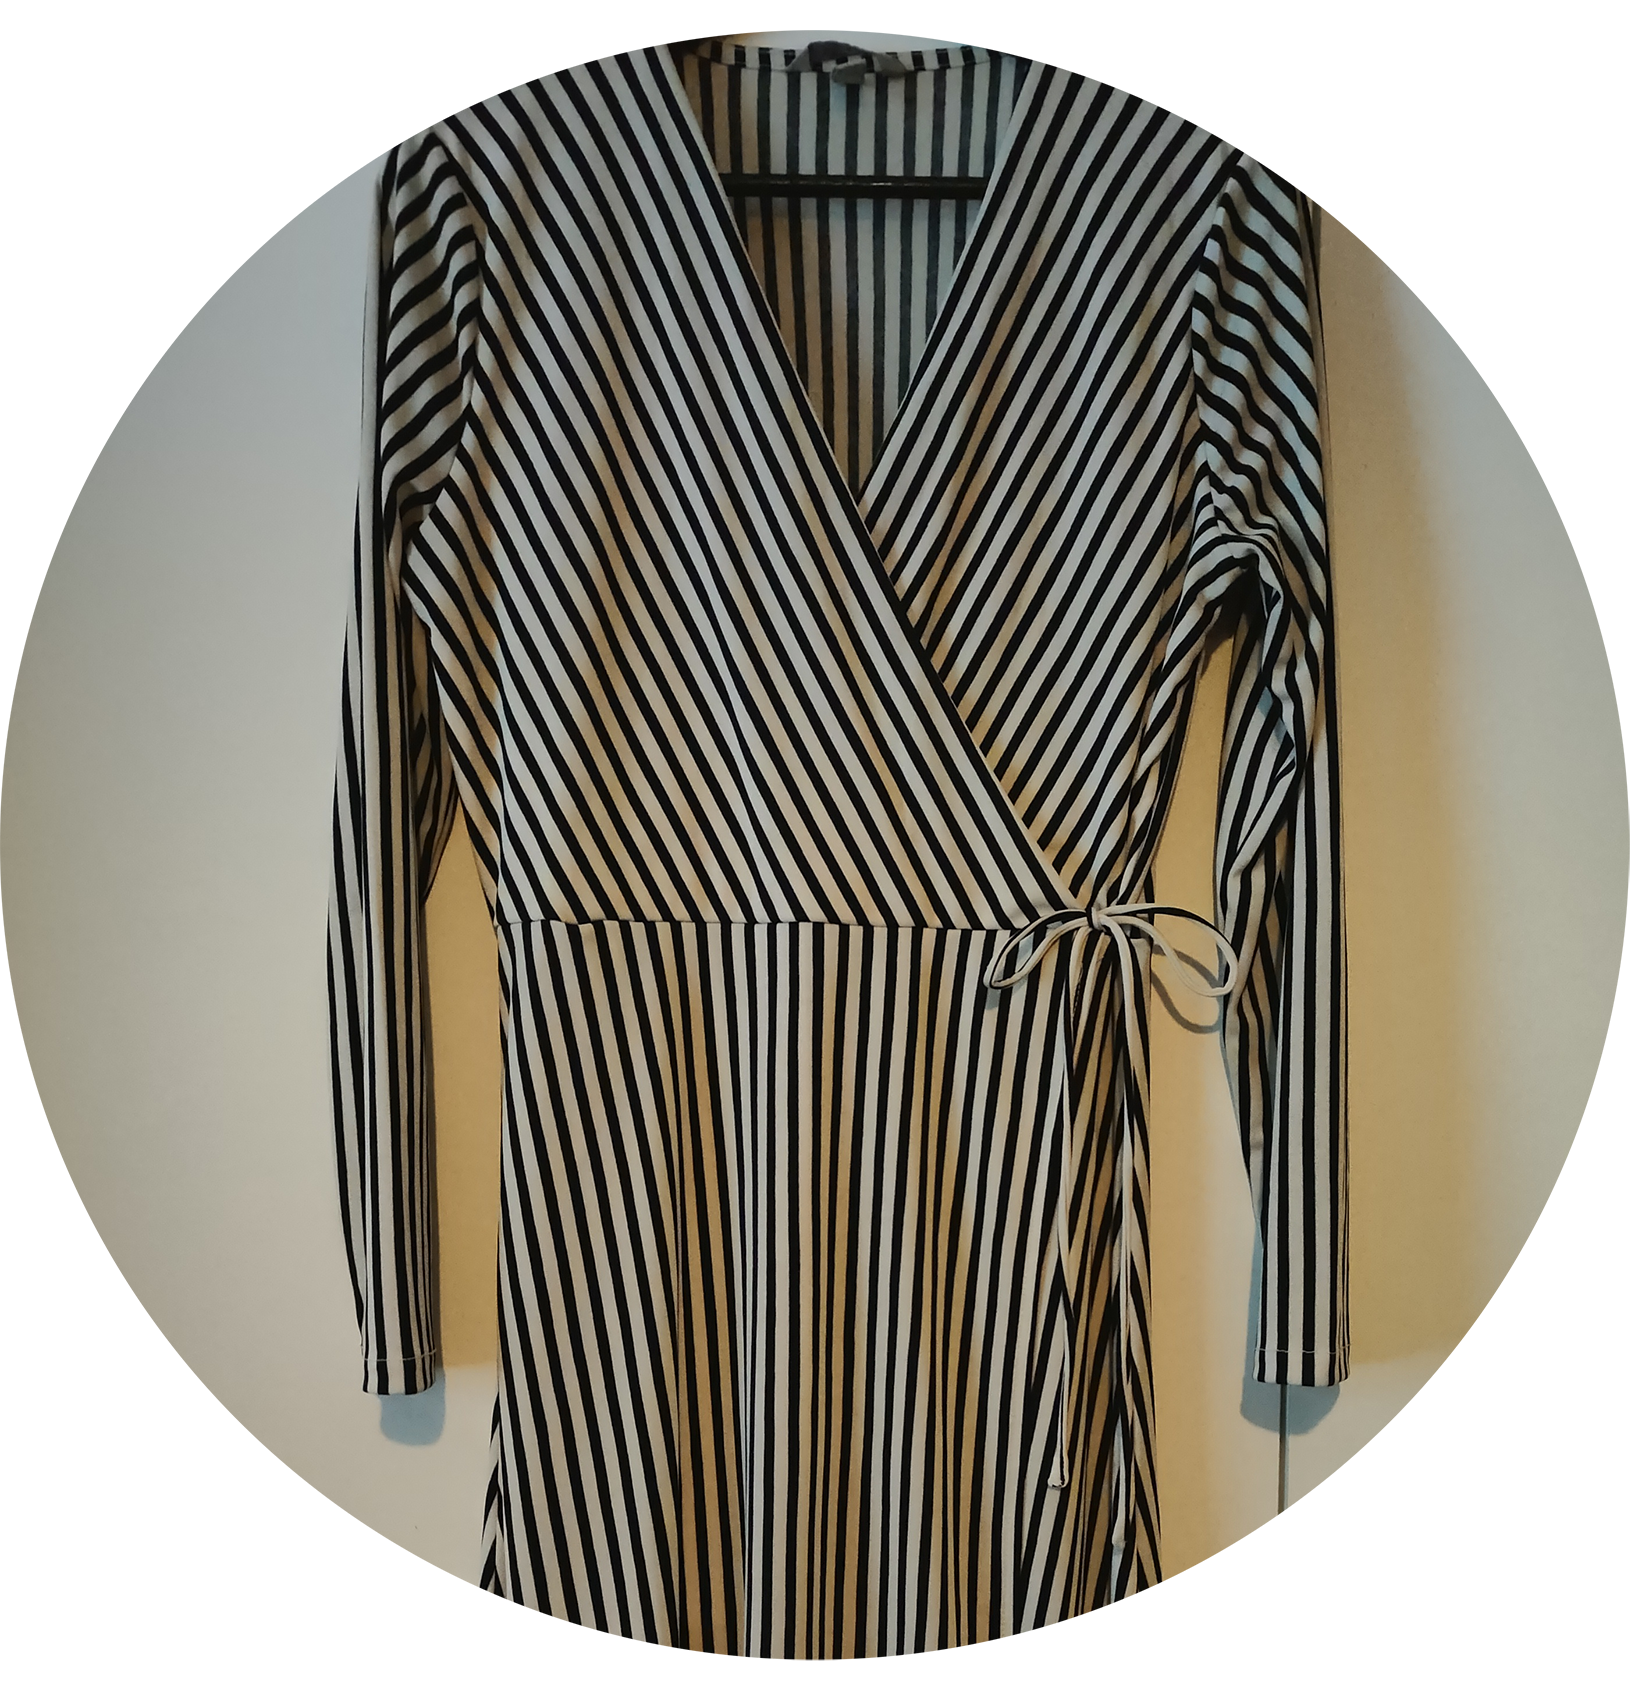
Pictures submitted by participating citizens
Source: The Wardrobe Survey, December 2023
Source: The Wardrobe Survey, December 2023
c) The three least-used types of clothing in the wardrobe of participating citizens
The survey shows that dresses (31.3% of the responses), long-sleeved shirts and blouses (18.2% of the responses) and pants, jeans and leggings (16.5% of the responses) constituted the top 3 of participating citizens’ least-used pieces of clothing. The top 3 were closely followed by jackets (8.5% of the responses), skirts (7.9% of the responses), t-shirts (5.1% of the responses), blazers (3.4% of the responses), and tops and suits (each corresponding to 2.3% of the responses). Shorts, vests, one-pieces, costumes, kimonos, scarfs and high heels were reported by only one or two respondents (in total, these categories amounted to 3.4% of the responses).
Least-used clothes among participating citizens
The table shows the categories of clothing that participating citizens have included in their top 3 least used pieces. The numbers in the table refer to the number of times the specific category was mentioned. For example, dresses were mentioned 54 times corresponding to 31.3% of the total number of responses in this part of the questionnaire.
Source: The Wardrobe Survey, December 2023
Interestingly, the same types of clothing (pants, shirts and dresses) appeared in the top 3 for most-used and least-used pieces. Dresses, however, were much more prominent among the least-used pieces, taking first place (31.3%) compared to third place among the most-used pieces (8.1%).
There were also only minor differences between most-used and least-used clothes when it came to colors. As with the most-used clothes, the majority of the least-used clothes were one-color in black, blue, gray or white (53% of the pieces) and pieces with more than one color amounted to 13% of the least-used clothes. When it came to fiber composition, the least-used clothes were characterized by high levels of polyester (16% of the least-used clothes were made of 100% polyester and 13% of the least-used clothes consisted of a blend of fibers with at least 50% polyester), as well as cotton (21% of the least-used clothes were made from 100% cotton). Thus, there seemed to be a tendency among participating citizens to have more polyester-based clothing in the pile of least-used clothes compared to the pile of most-used clothes.
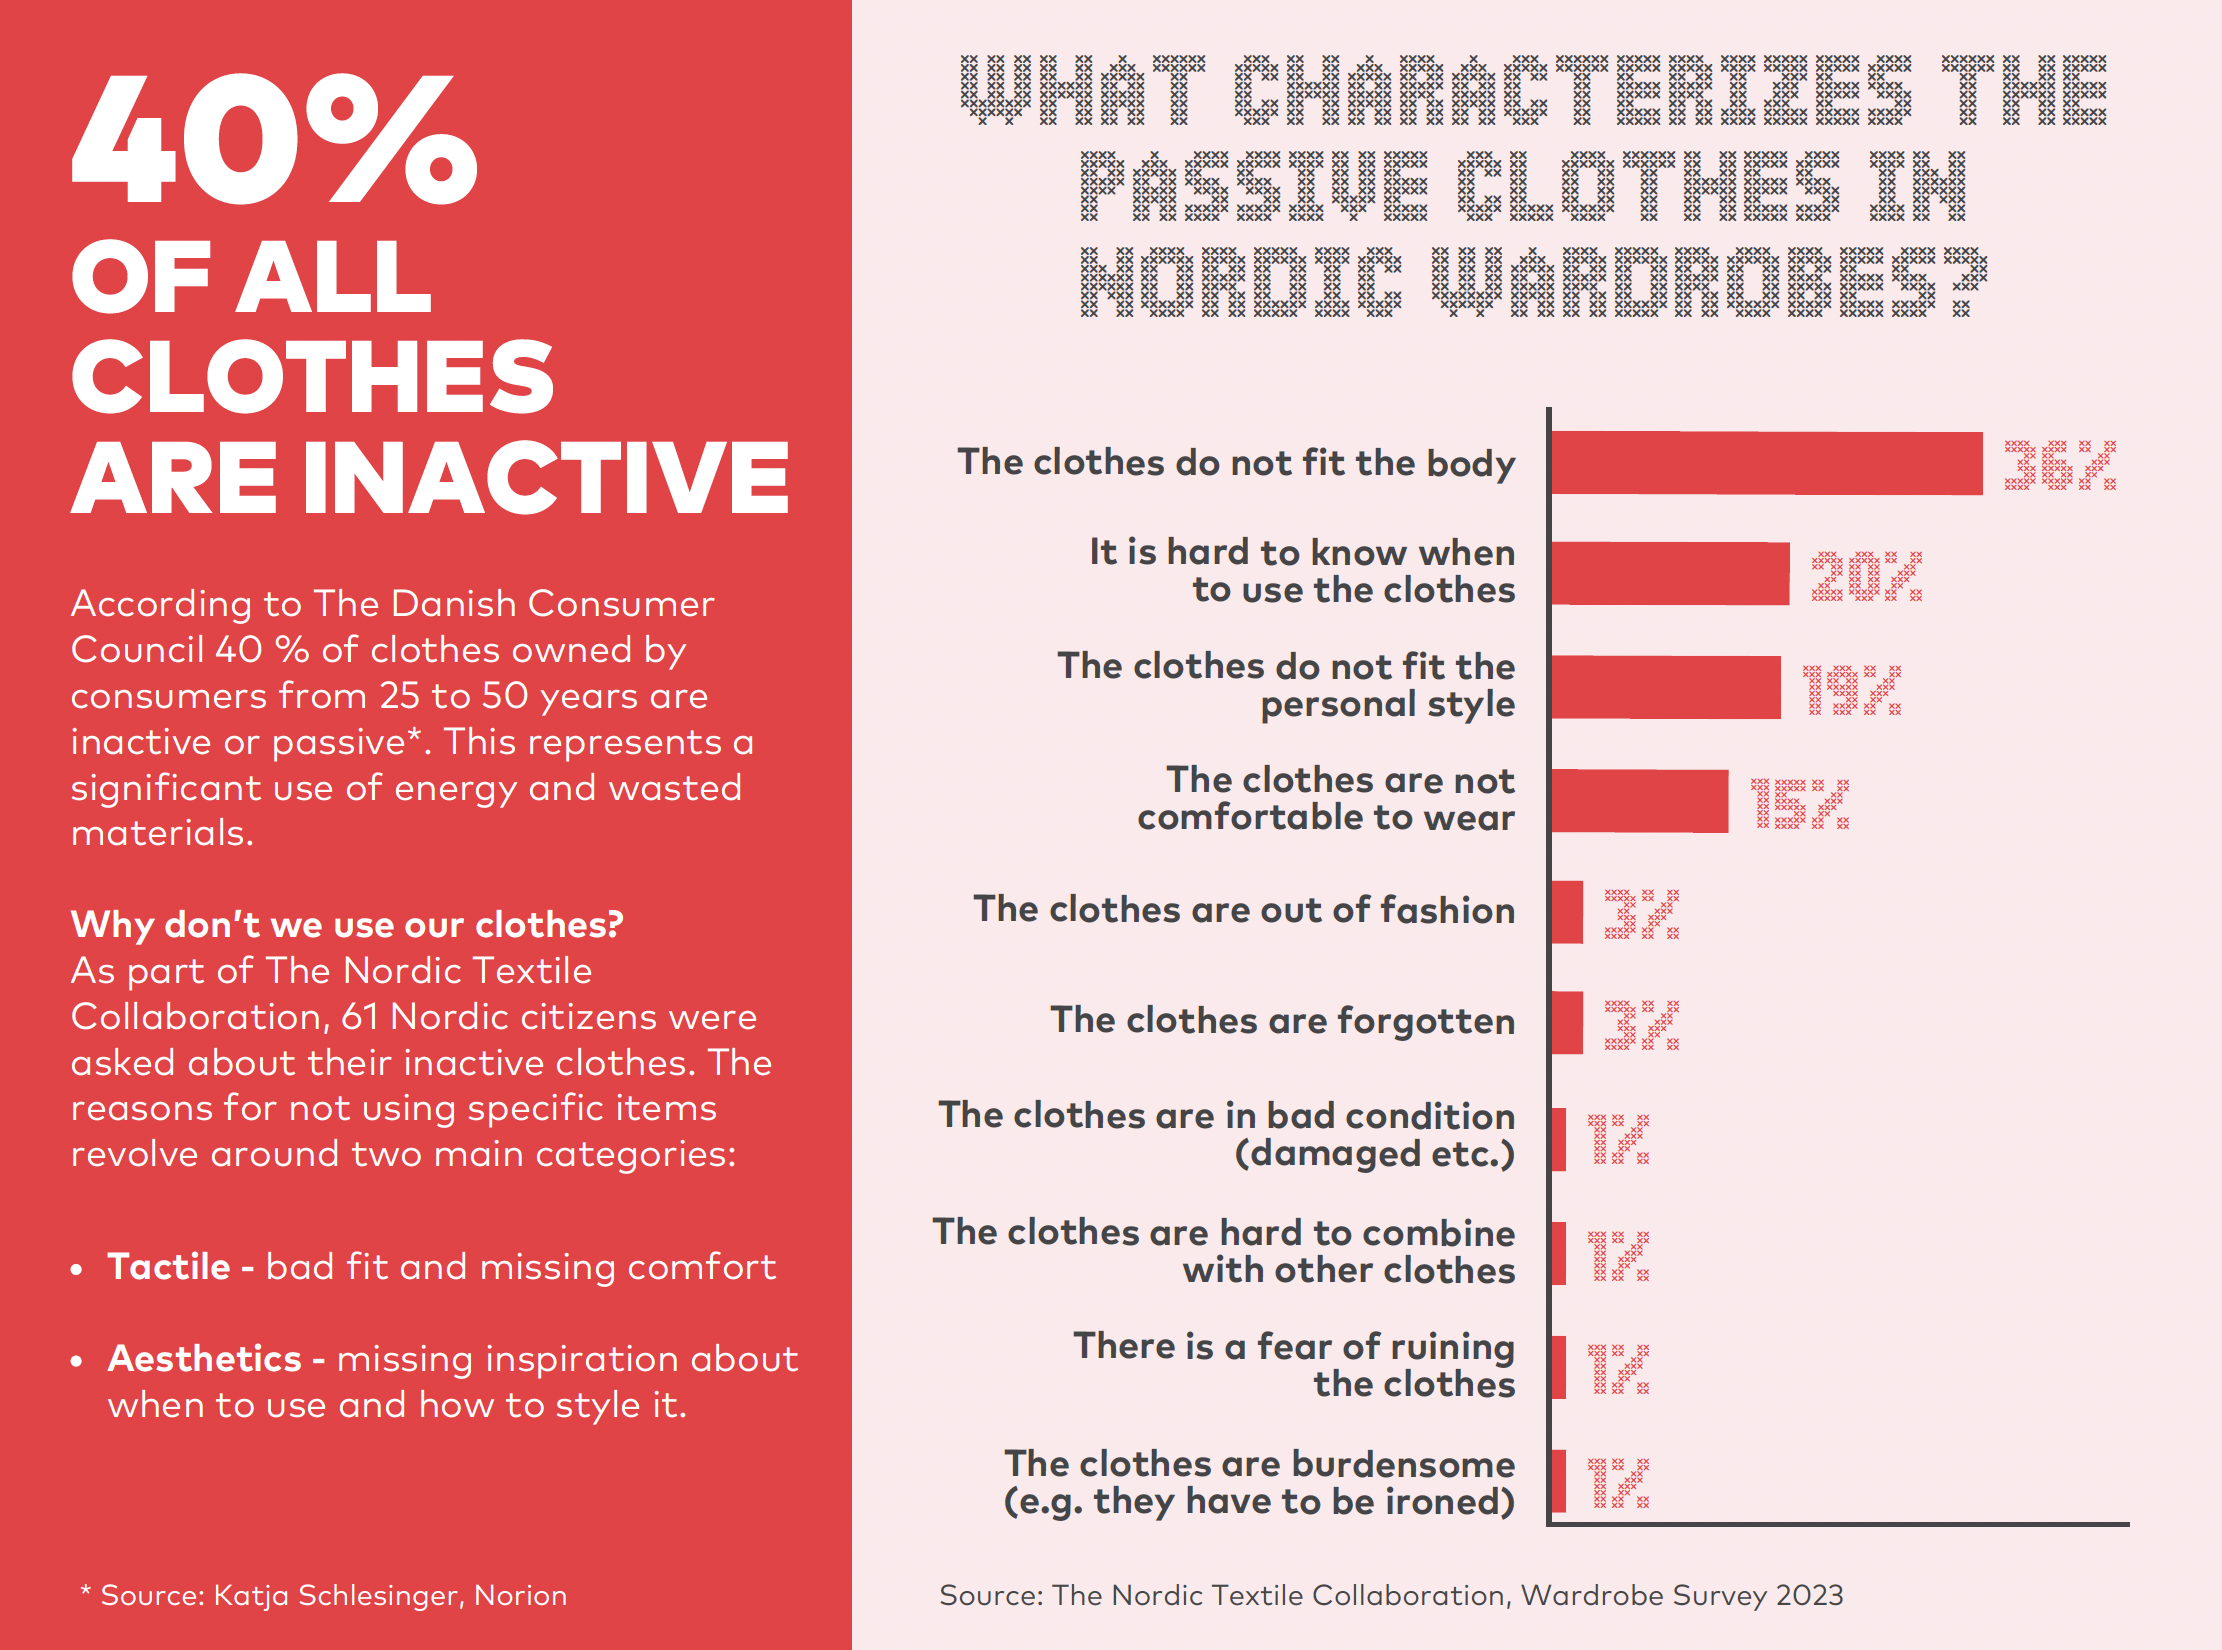
The main reasons for never wearing these pieces included that the clothes did not fit (36% of the responses), there was never an occasion for wearing them (20% of the responses), and the clothes did not fit the owner’s personal styles (19% of the responses):
Infographic developed by Holm Kommunikation based on webinar presentation and the Wardrobe Survey 2023
Thus, the survey indicates that the least-used parts of citizens’ wardrobes were not comfortable to wear as they did not fit the respondents’ body types and personal style, and they were not adaptable to the different situations and occasions that unfolded in the respondents’ lives. In this way, the least-used parts of the wardrobes seemed to suffer from not having the qualities characterizing the most-used items.
Most-used pieces of clothing | Least-used pieces of clothing | |
Types (The top 3) | Pants, jeans and leggings Long-sleeved shirts and blouses Dresses | Dresses Long-sleeved shirts and blouses Pants, jeans and leggings |
Dominant colors | Black, blue, gray and white | Black, blue, gray and white |
Dominant fibers | Cotton Polyester | Polyester Cotton |
Reasons for using and not using, respectively | Fit and comfortable to wear Adaptable to many occasions Easy to maintain | Misfitting and uncomfortable to wear Not suitable for various occasions Hard to maintain |
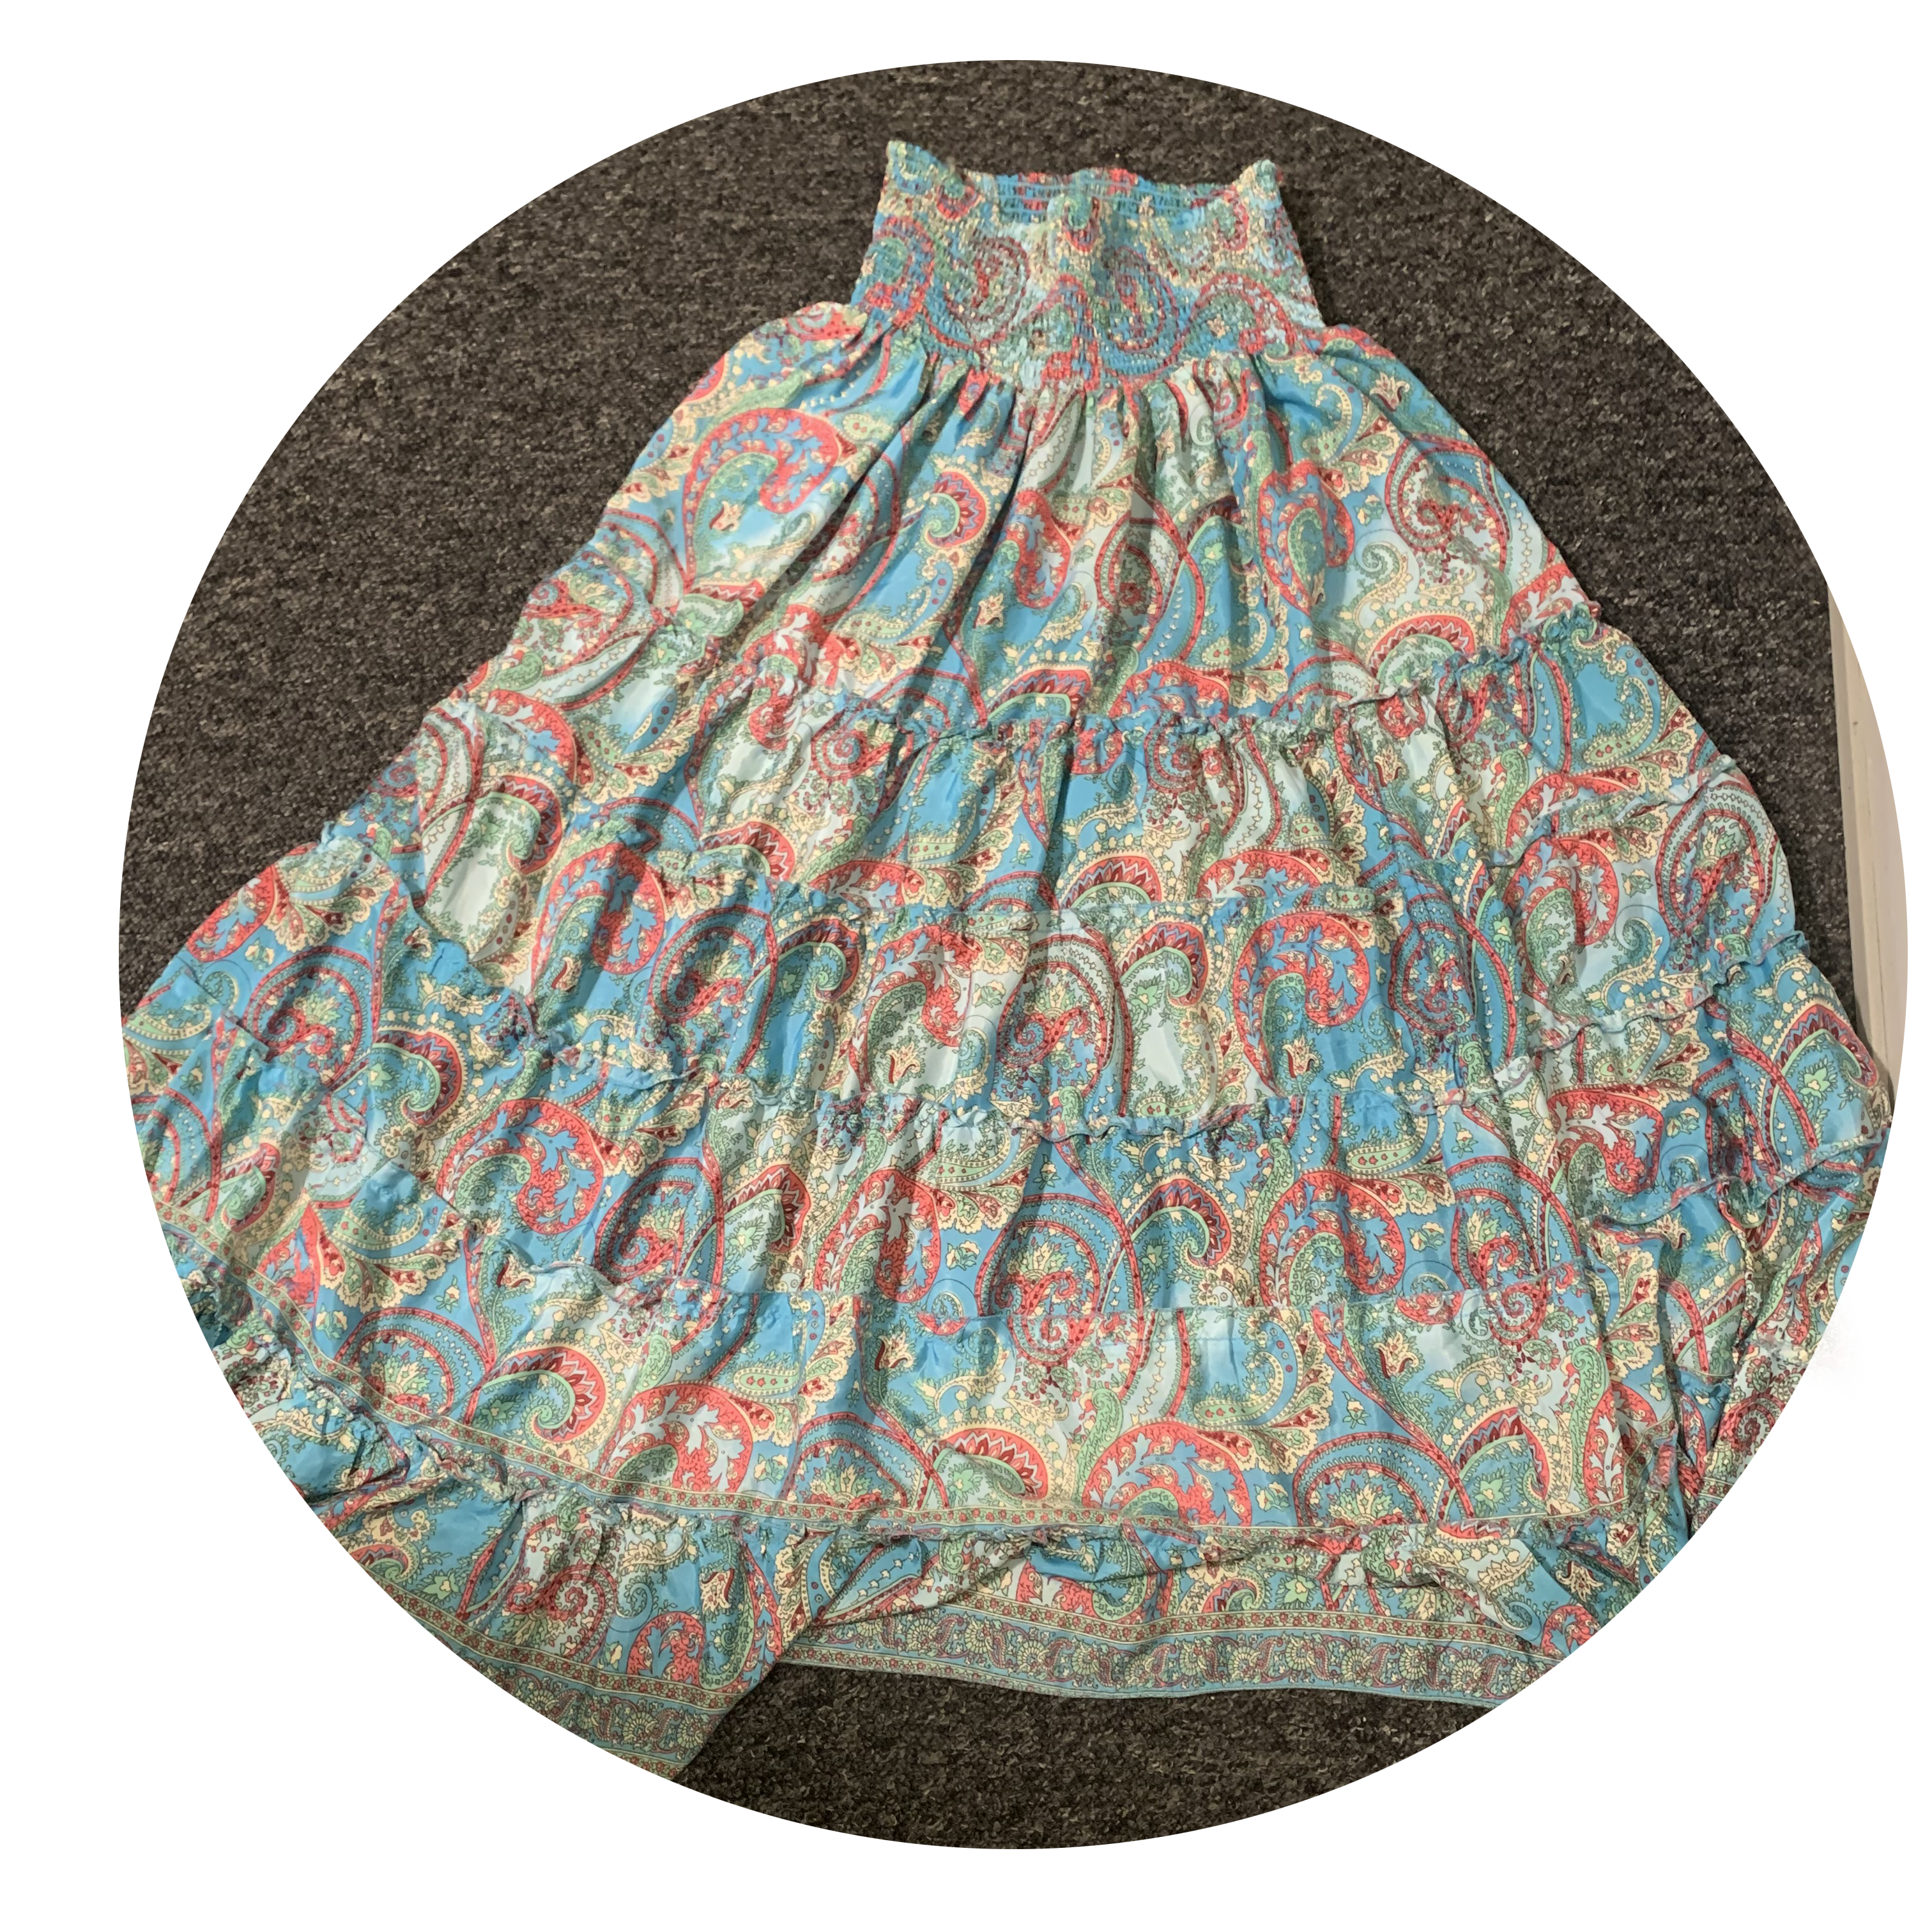
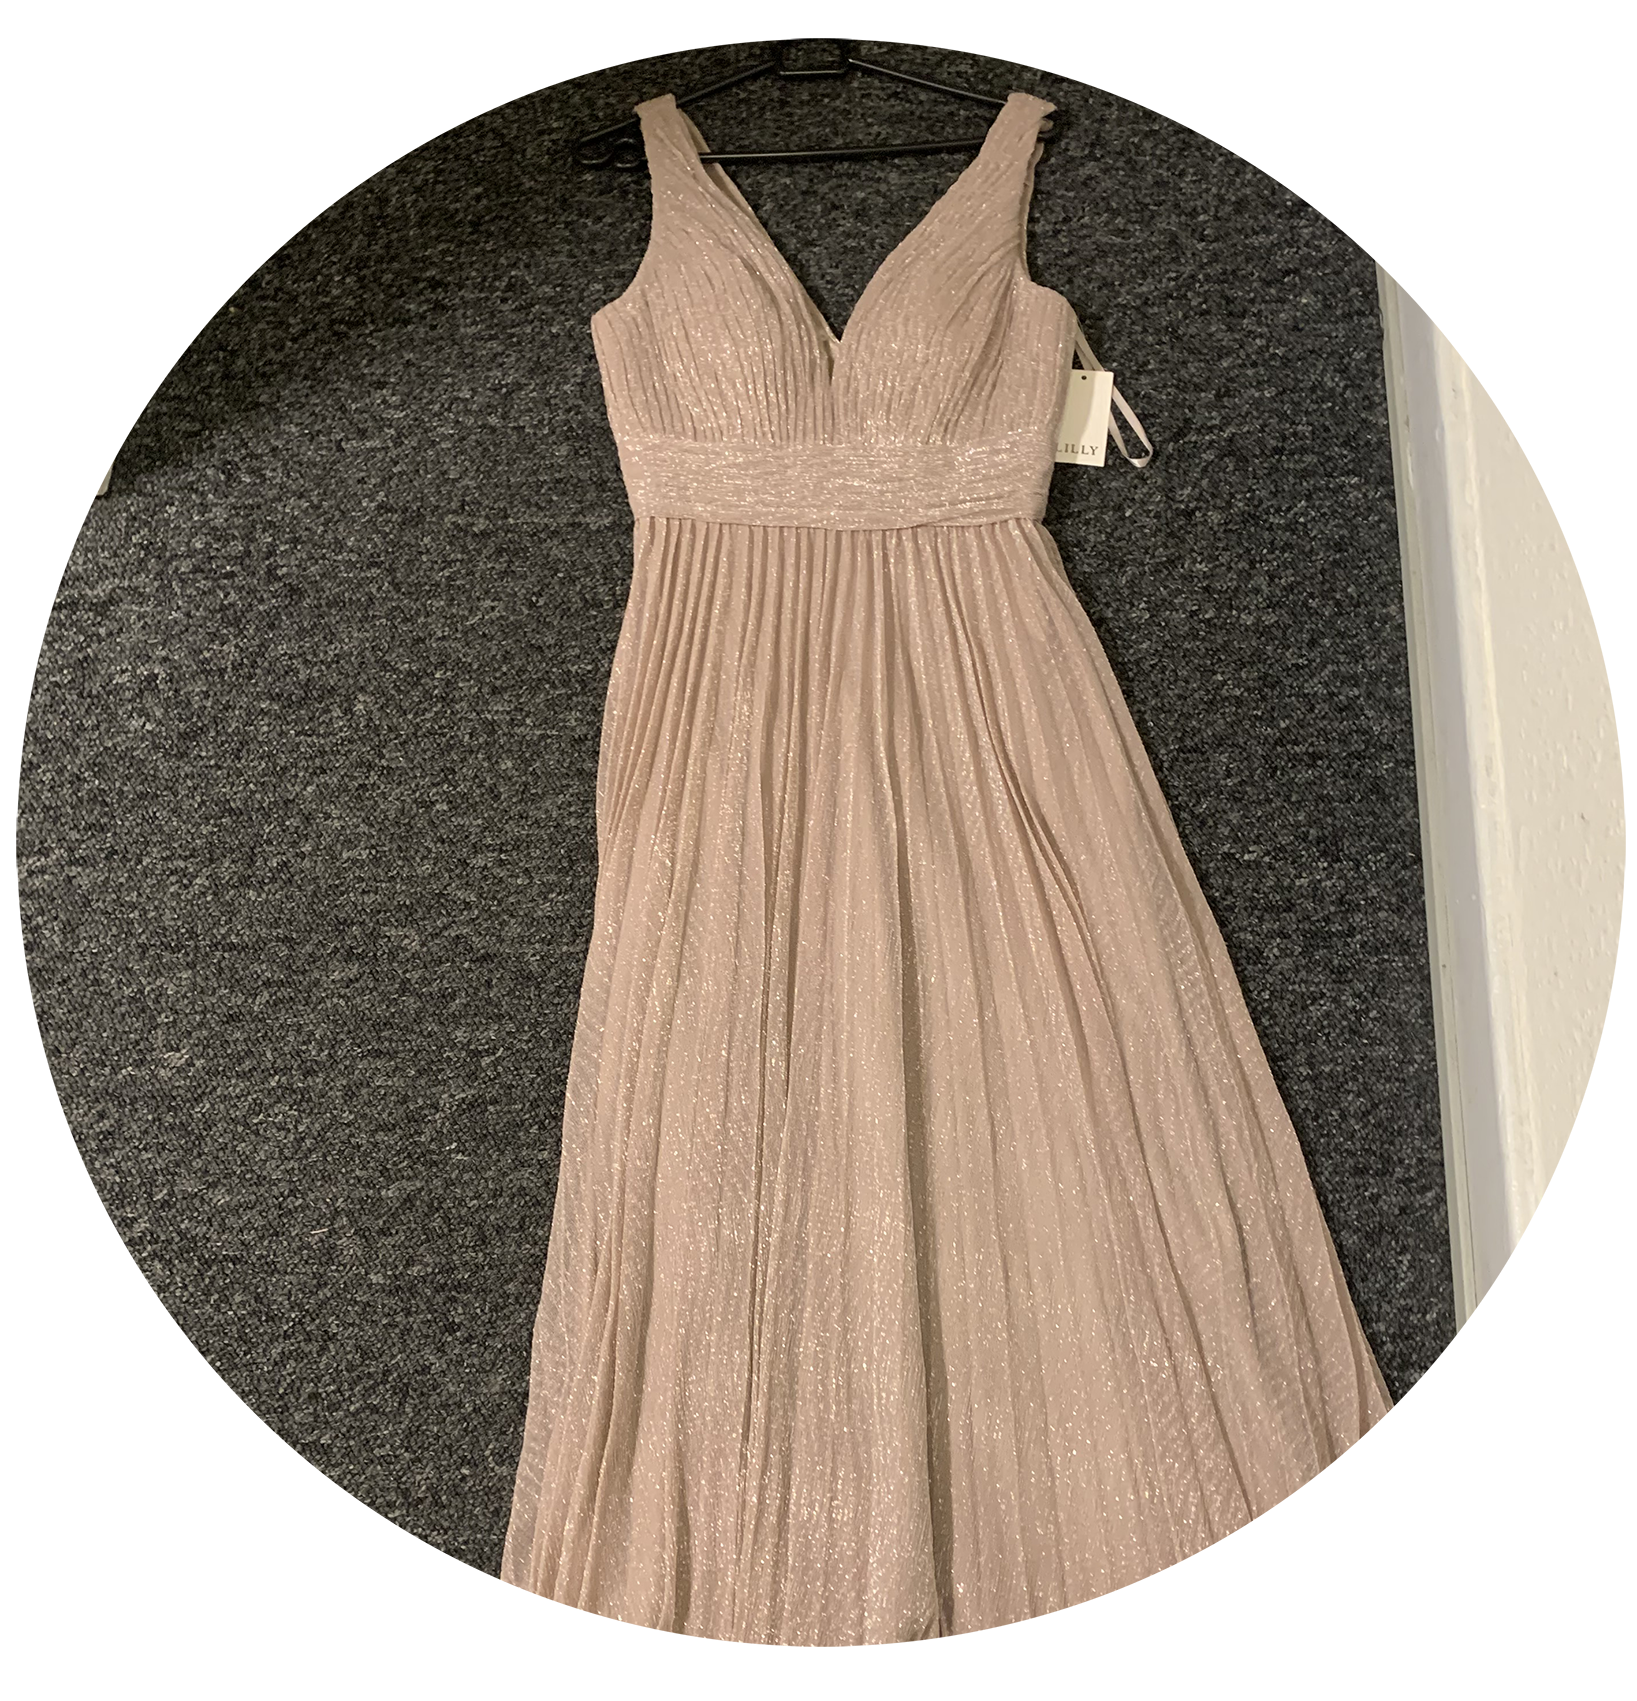
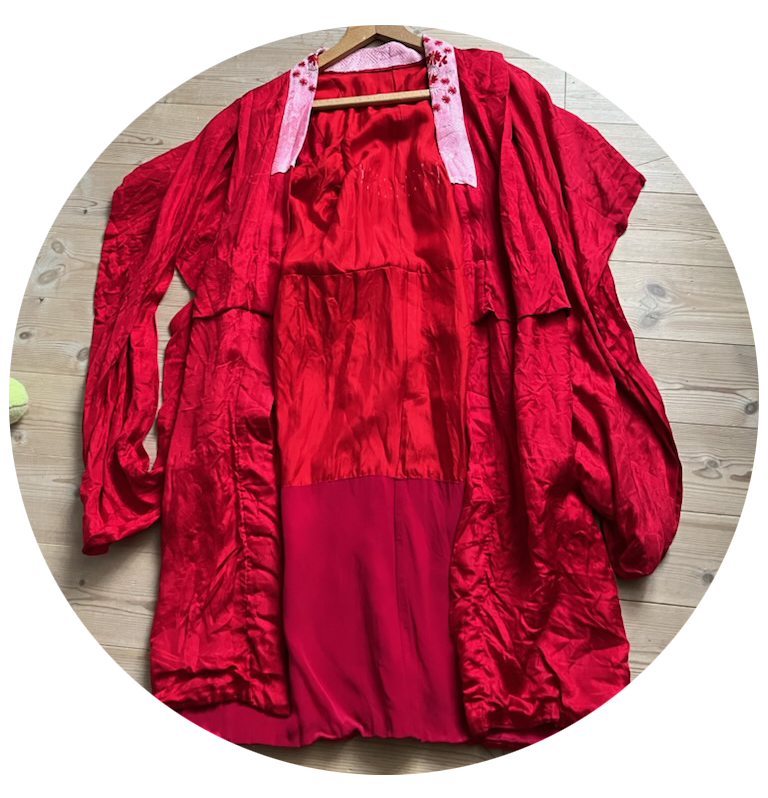
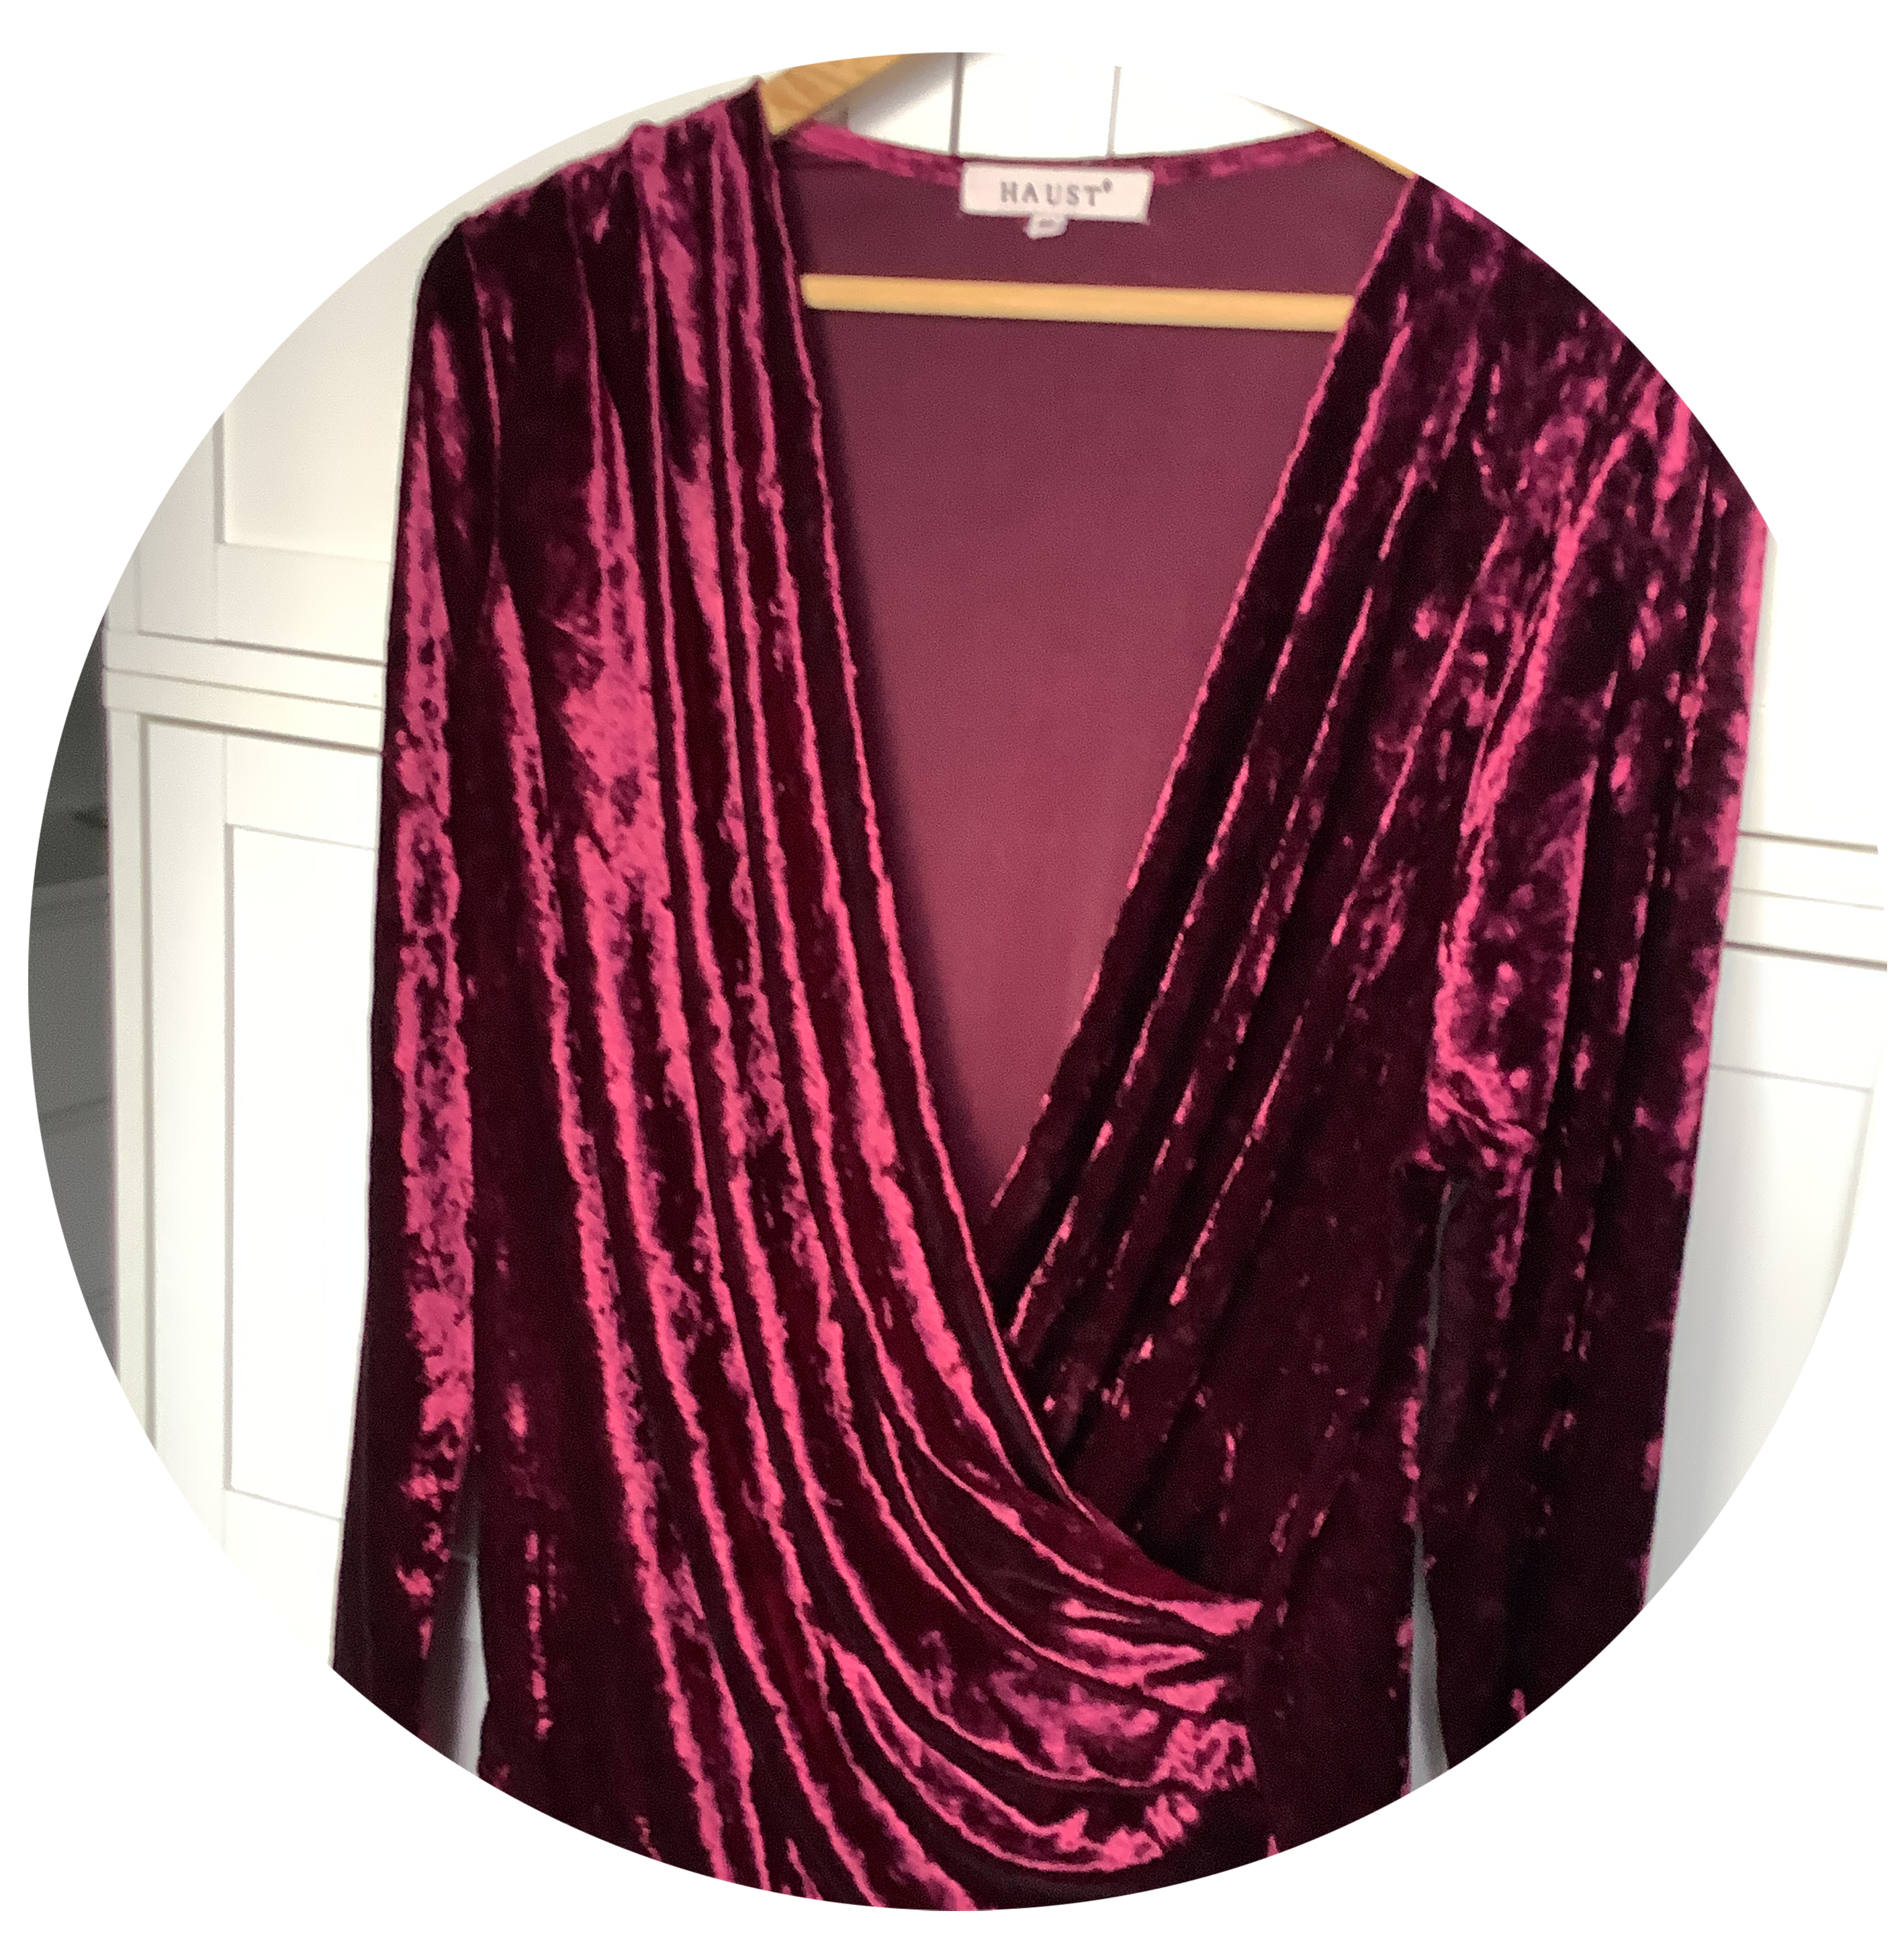
Pictures submitted by participating citizens
Source: The Wardrobe Survey, December 2023
Source: The Wardrobe Survey, December 2023
d) Wardrobe needs and solutions before the six-month challenge
57 citizens responded to this part of the survey, of whom 45 foresaw that they would have specific wardrobe needs during the six-month challenge. The remaining 12 citizens did not foresee any needs. Three of the 12 citizens with no needs elaborated that this was because they already had what they needed in their wardrobe.
Looking through the list of expected needs, four types of clothing stand out: The need for new pants, jeans or leggings (26.4% of the needs), followed by dresses (10% of the needs, often for special occasions like weddings and graduations), jackets (9.2%) and shoes (8.5%).
Based on the list of expected wardrobe needs, citizens indicated how they intended to meet these needs during the period January–June 2024:
Source: The Wardrobe Survey, December 2023
As shown in the figure above, in December 2023, participants expected to solve 44% of their wardrobe needs by shopping secondhand, whereas participants anticipated to solve 24% of the needs by repairing or redesigning what they had in their existing wardrobe. Furthermore, the participants responded that they would probably have to solve 14% of their needs by buying new textile products. A few needs were intended to be solved by means of borrowing (8%), swapping (5%), restyling existing wardrobe pieces (3%) or renting (2%).
3.4.2 Results from citizen logs (January–June 2024)
During the six-month challenge, citizens filled out monthly logs about how they fared, emphasizing what type of wardrobe needs they faced and how they solved these needs. The following sections present findings from the monthly logs, comparing these with the findings from the pre-survey described above.
Findings regarding wardrobe needs
Each month during the six-month challenge, citizens were asked to describe wardrobe needs during the month. Based on an analysis of their descriptions of needs in the logs, it becomes clear that the reasons for having wardrobe needs fall into three types of categories:
- Not present: What participating citizens wanted to wear was not part of their wardrobe (e.g., due to weather changes). More than half of the wardrobe needs (58.4%) identified were justified with reference to the fact that the specific type of clothing was missing.
- Damage: What participating citizens wanted to wear was damaged and needed repair. Around one third of the wardrobe needs (32.3%) were caused by damage to existing clothes.
- Misfit: What participating citizens wanted to wear no longer fitted. Approximately, one of ten wardrobe needs (9.3%) was related to fit: In other words, the respondent already owned a similar garment which was not damaged, but it didn’t fit the respondent.
January | February | March | April | May | June | Total | % | |
Not present | 25 | 18 | 23 | 10 | 12 | 6 | 94 | 58.4 |
Damage | 17 | 8 | 11 | 9 | 7 | 0 | 52 | 32.3 |
Misfit | 8 | 2 | 1 | 3 | 1 | 0 | 15 | 9.3 |
Total | 50 | 28 | 35 | 22 | 20 | 6 | 161 | 100.0 |
The table shows wardrobe needs during the six-month challenge grouped by the three categories of “not present”, “damage” and “misfit”. The numbers in the table refer to the number of times each of the reasons has been mentioned. For instance, 25 wardrobe needs in January were justified using the argument that the specific type of clothing was not present in the wardrobe.
Source: Citizen logs January–June 2024
Common for all logs was that some citizens did not experience any needs at all, for instance, because they were satisfied with the content of their existing wardrobes:
I simply figured what I have is good enough.Carl, Denmark, March 2024
No needs to buy anything yet as my wardrobe is still big enough for my needs.Johanne, Norway, April 2024).
Other citizens reported having a wardrobe that fulfilled all needs but that they were nevertheless having this feeling of being unsatisfied with the content of their existing wardrobes:
I have thought a lot about my wardrobe, because of this project. I don't really need more clothes, because I have a lot, but I sometimes feel like I don't have the "right thing" to wear. I think I miss clothes that I feel appropriate to wear for work. My style has also changed a bit, and some of my clothes are a bit too worn out.Stina, Sweden, January 2024
No specific needs. There is an emotional challenge, though. I own enough clothing, but I find mornings difficult and end up wearing the same 10–15% of my clothing every day.Ella, Finland, June 2024
Findings regarding solutions to wardrobe needs
The participating citizens used different solutions to accommodate the identified wardrobe needs. Seven types of solutions were mentioned in the logs during the six-month challenge:
- Using existing wardrobe
- Borrow
- Swap
- Rent
- Repair/redesign
- Secondhand
- Buying new
Interestingly, the solutions applied during the six-month challenge are somewhat different from the solutions anticipated in the Wardrobe Survey from December 2023. As illustrated in the table below, a growing number of citizens accepted their existing wardrobe during the six-month challenge; borrowing, swapping, rentals, repair and redesign matched expectations, while the actual use of the secondhand market turned out to be lower than expected: In December 2023, 44% of needs were expected to be solved using second-hand market finds, but it never went higher than 18% except in June, when 50% of the needs were solved using second-hand stores.
December | January | February | March | April | May | June | |
Using existing wardrobe | 3% | 26% | 18% | 40% | 14% | 40% | 17% |
Borrow | 8% | 2% | - | - | - | - | - |
Swap | 5% | 4% | 3% | - | 4% | - | - |
Rent | 2% | 2% | - | - | - | - | - |
Repair/redesign | 24% | 30% | 25% | 11% | 14% | 30% | - |
Secondhand | 44% | 14% | 18% | 11% | 18% | 10% | 50% |
Buying new | 14% | 8% | 18% | 29% | 23% | 5% | 17% |
Unsolved | - | 14% | 18% | 9% | 27% | 15% | 17% |
Total | 100% | 100% | 100% | 100% | 100% | 100% | 101%* |
*Percentages have been rounded and therefore they do not total to 100%. | |||||||
The table provides an overview of solutions applied by participating citizens to fulfil wardrobe needs during the six-month challenge. For example, 30% of the wardrobe needs identified in January 2024 were solved using repairs and/or redesign methods.
Sources: The Wardrobe Survey December 2023 and Citizen logs January-June 2024
Tendencies during the six-month challenge documented in the monthly citizen logs can be summarized as follows:
- Poor fit and damages caused the vast majority of wardrobe needs.
- Using existing wardrobes only satisfies citizens to some extent (never more than 40% of the needs)
- Borrow, swap and rentals were used very little (never exceeded more than 4% of the needs)
- Repair and redesign feature often (between 11–30% of the needs are solved using these options)
- Secondhand features quite often (solved between 11–18% of needs in January–May and 50% in June)
- Buying new pieces of clothing was not avoided (used as a solution to changing wardrobe needs in 8–29% of the cases). When citizens bought new clothes, it was often due to the need for underwear, swimsuits or clothes for special occasions. Those citizens reported that they had tried to look for swimsuits and clothes for special occasions in second-hand shops, both physical and online stores, to no avail. Seasonal shifts also seemed to matter as the highest rates of new buys were observed in March and April where many citizens reported being in need of spring and summer clothes. Thus, new wardrobe needs seem to arise when a seasonal change occurs.
- Unsolved needs were widespread and constant.
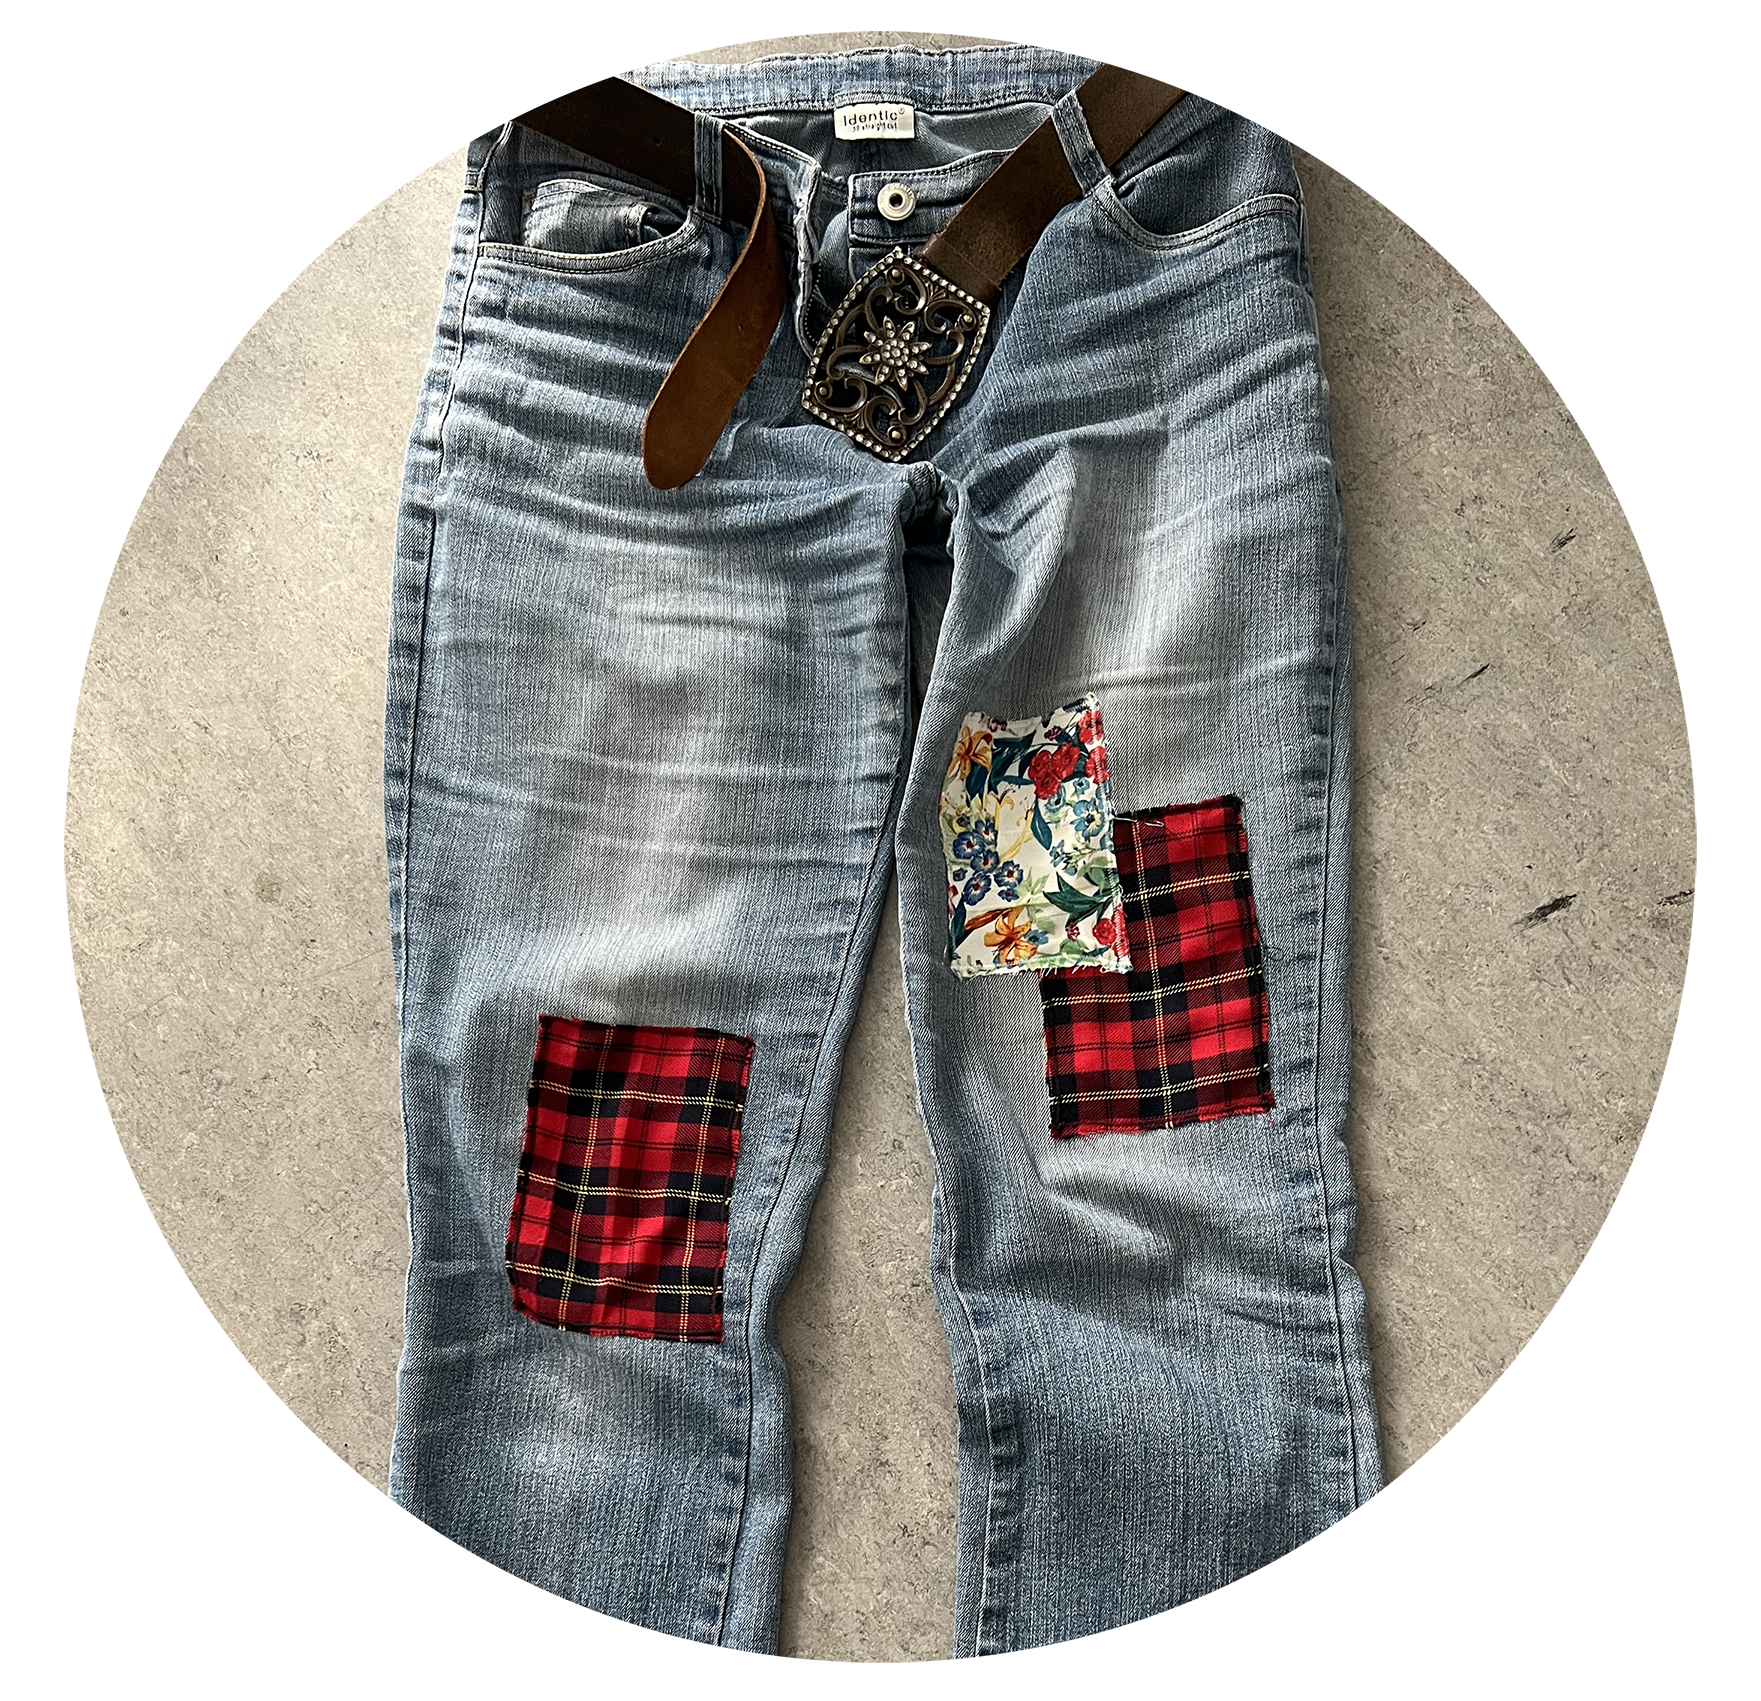
1.
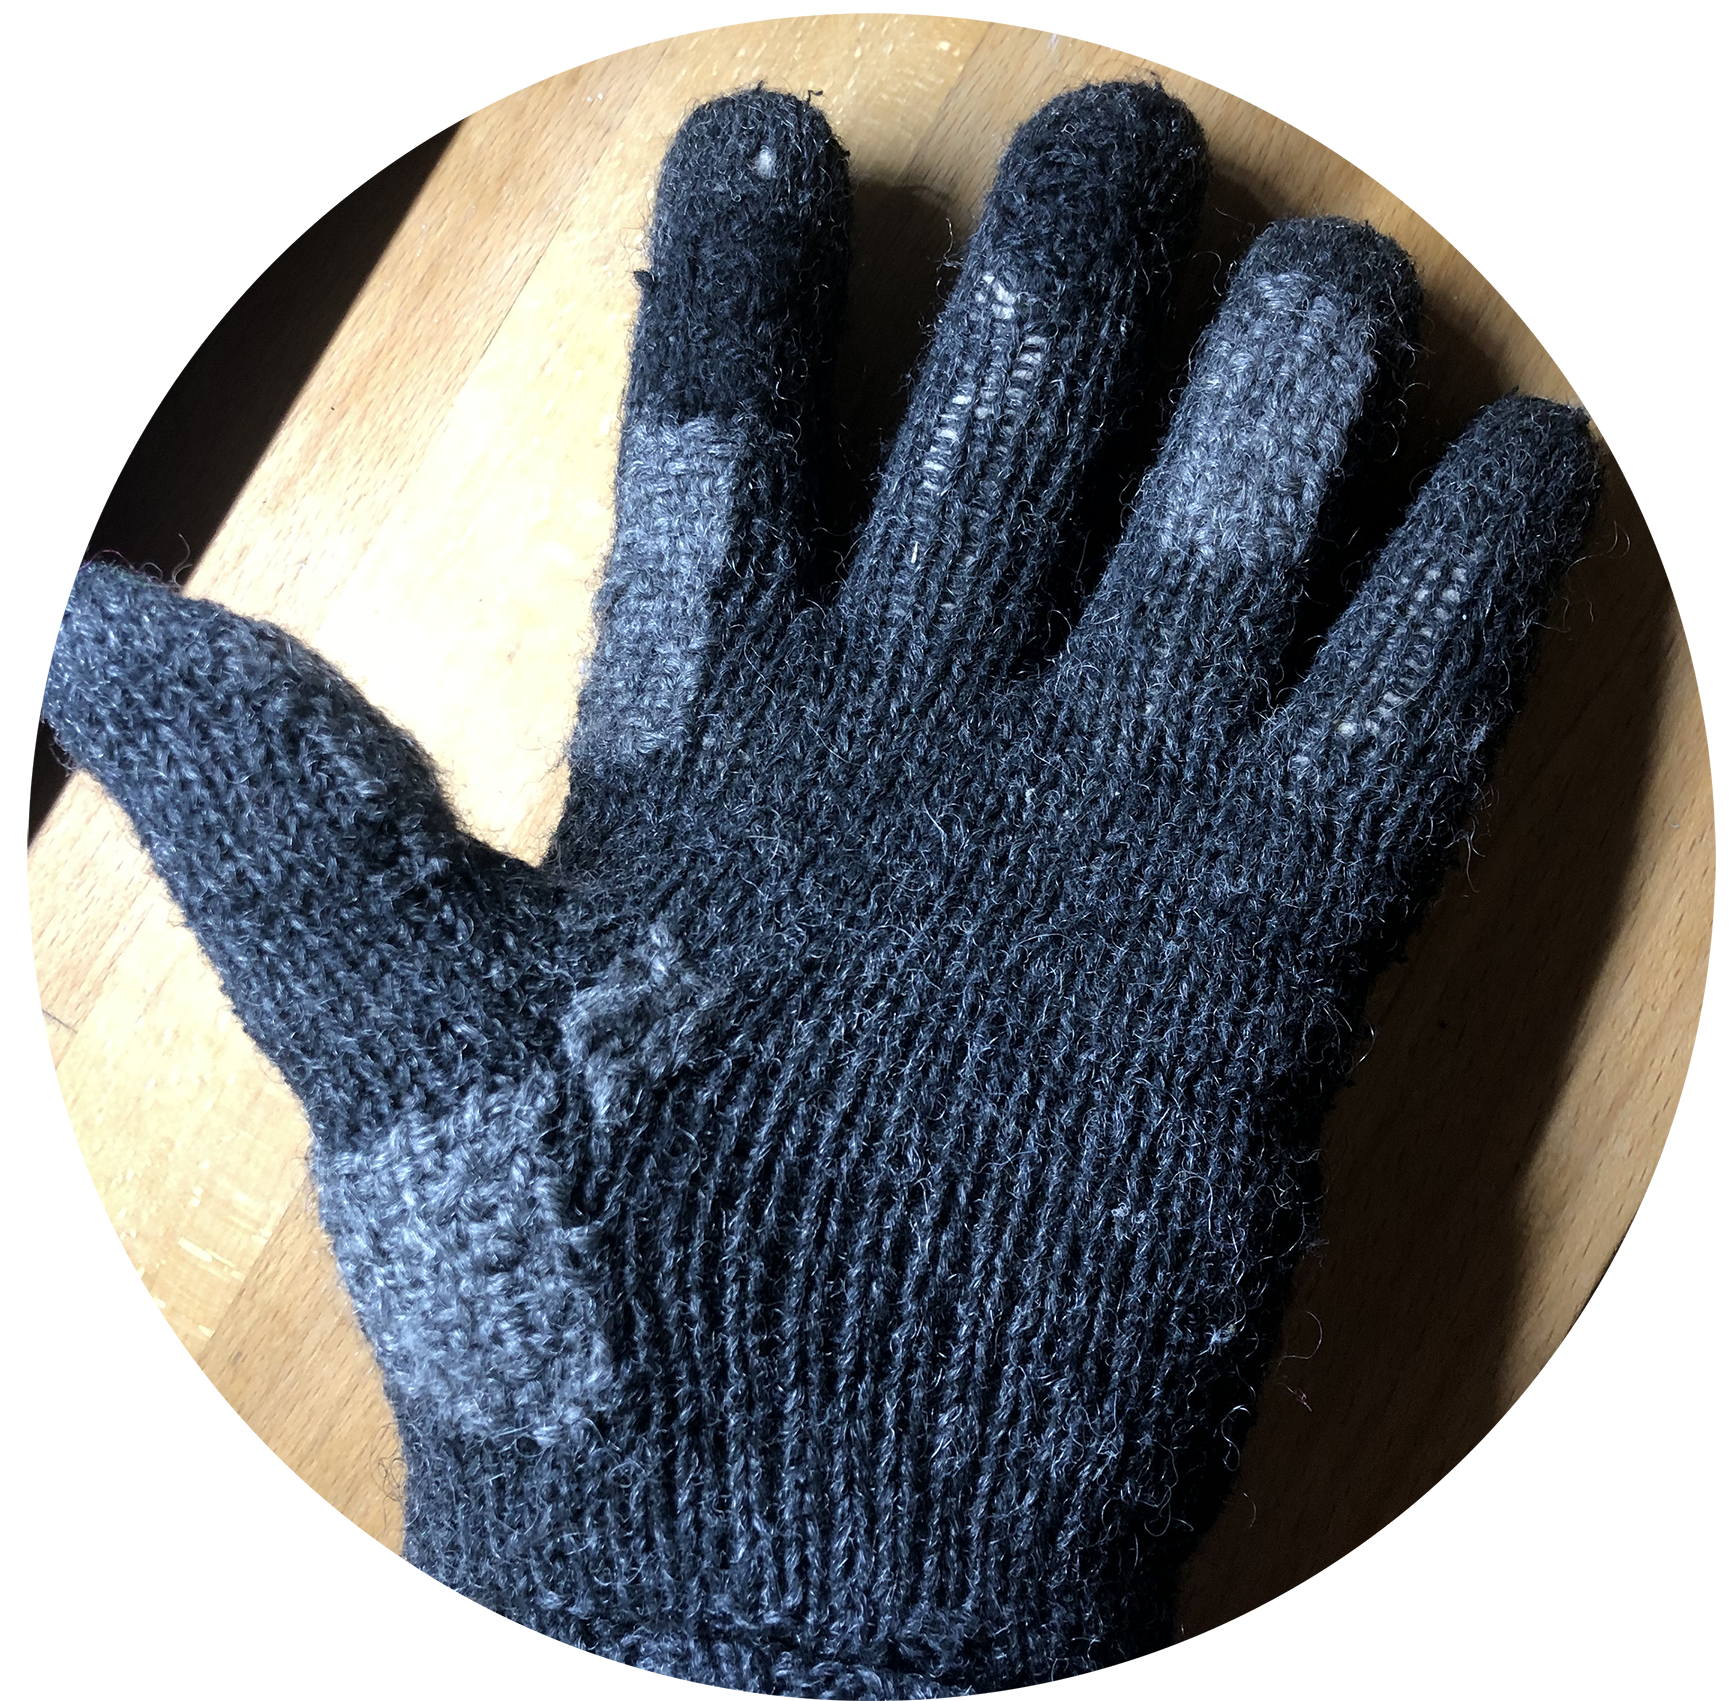
2.
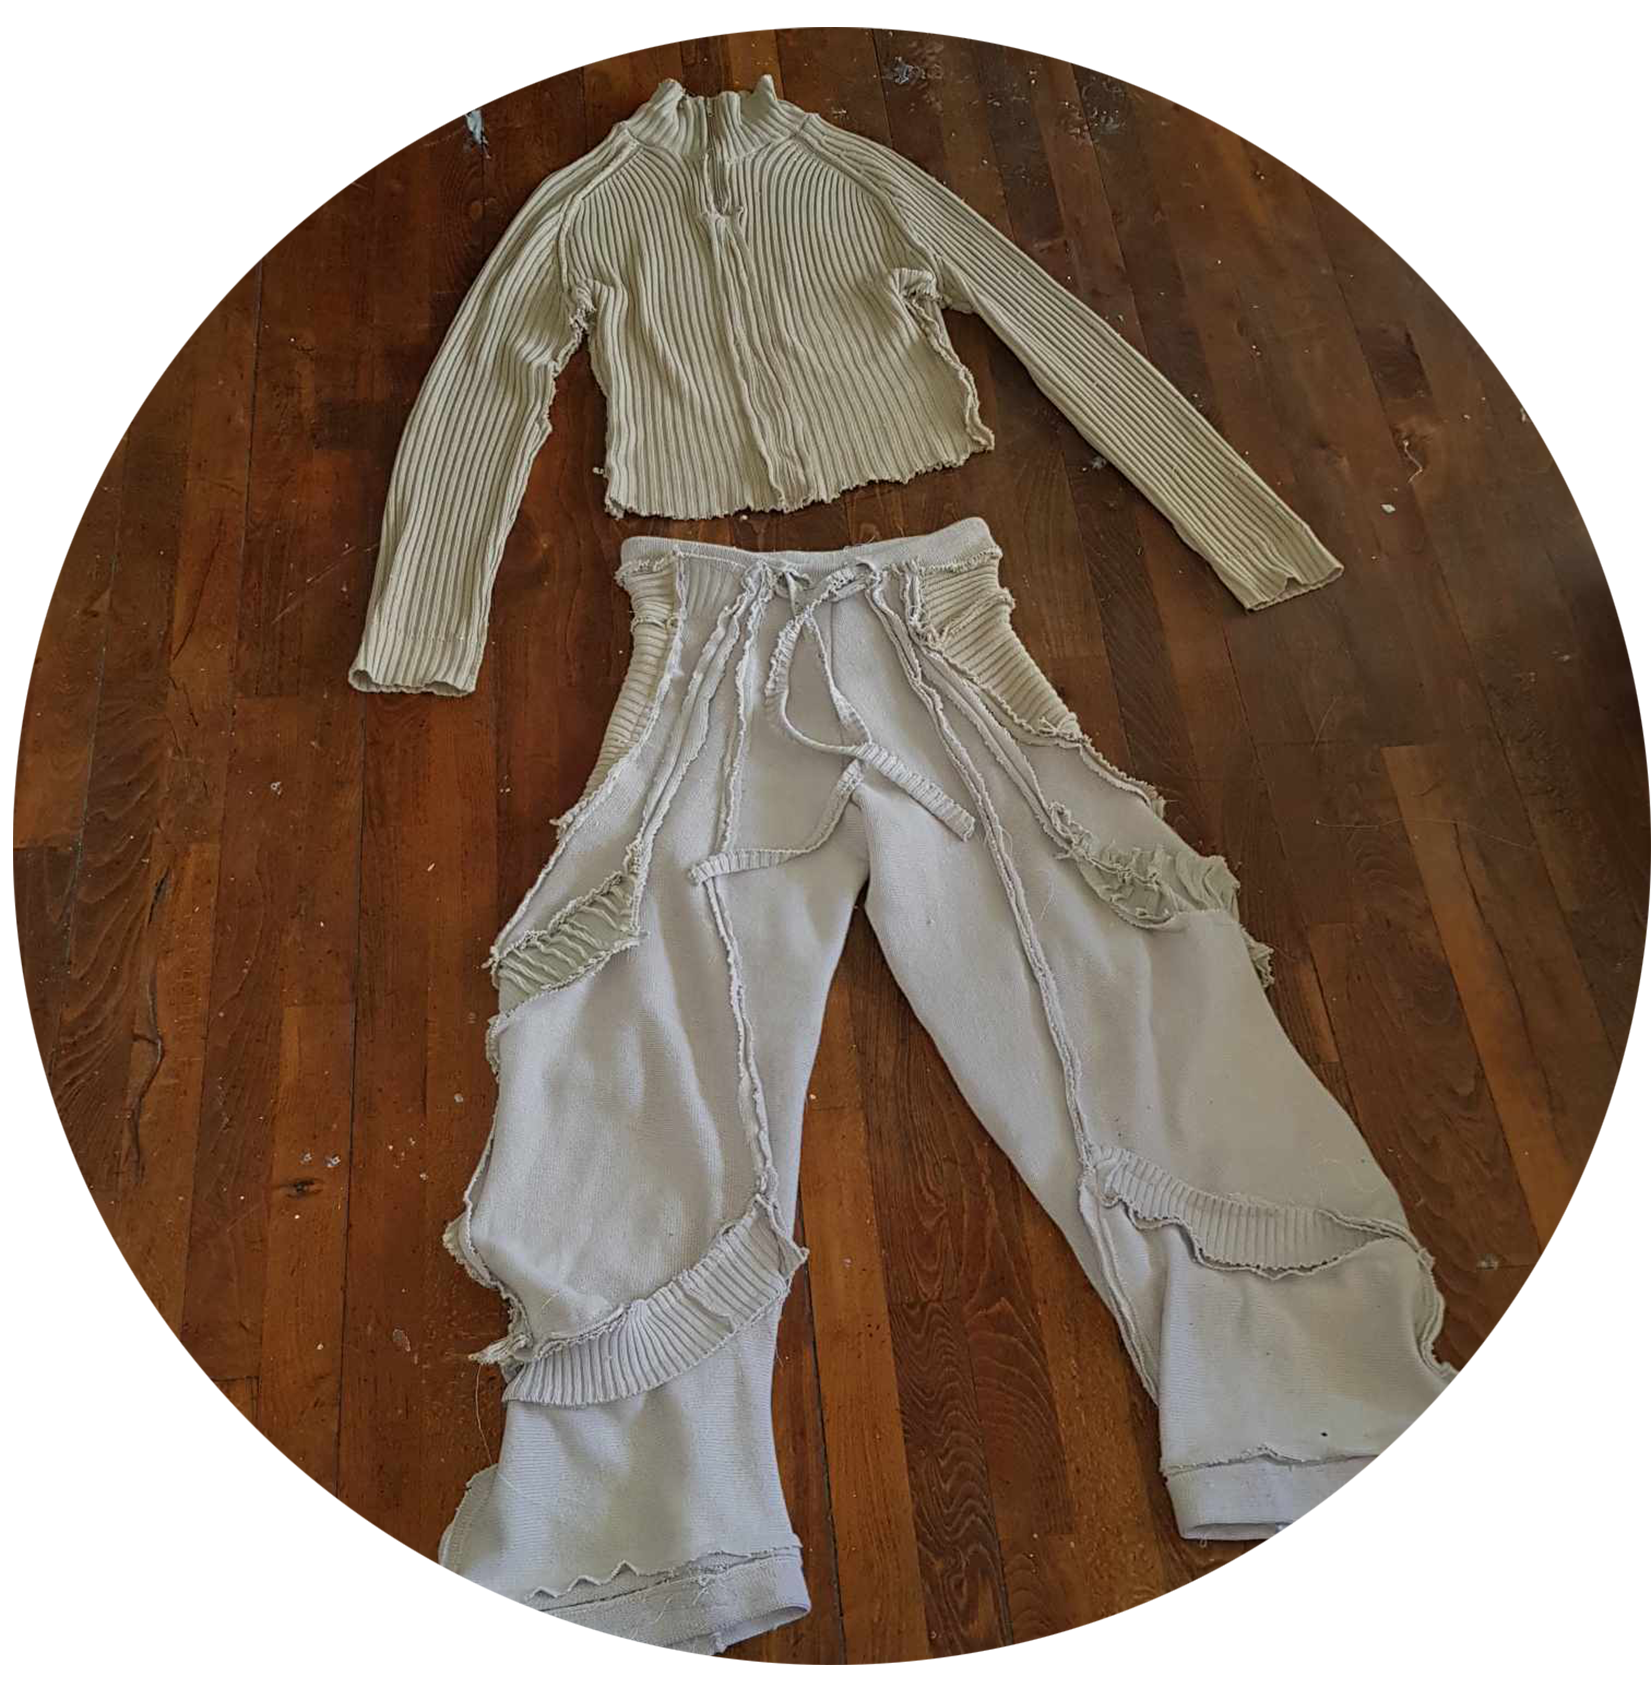
3.
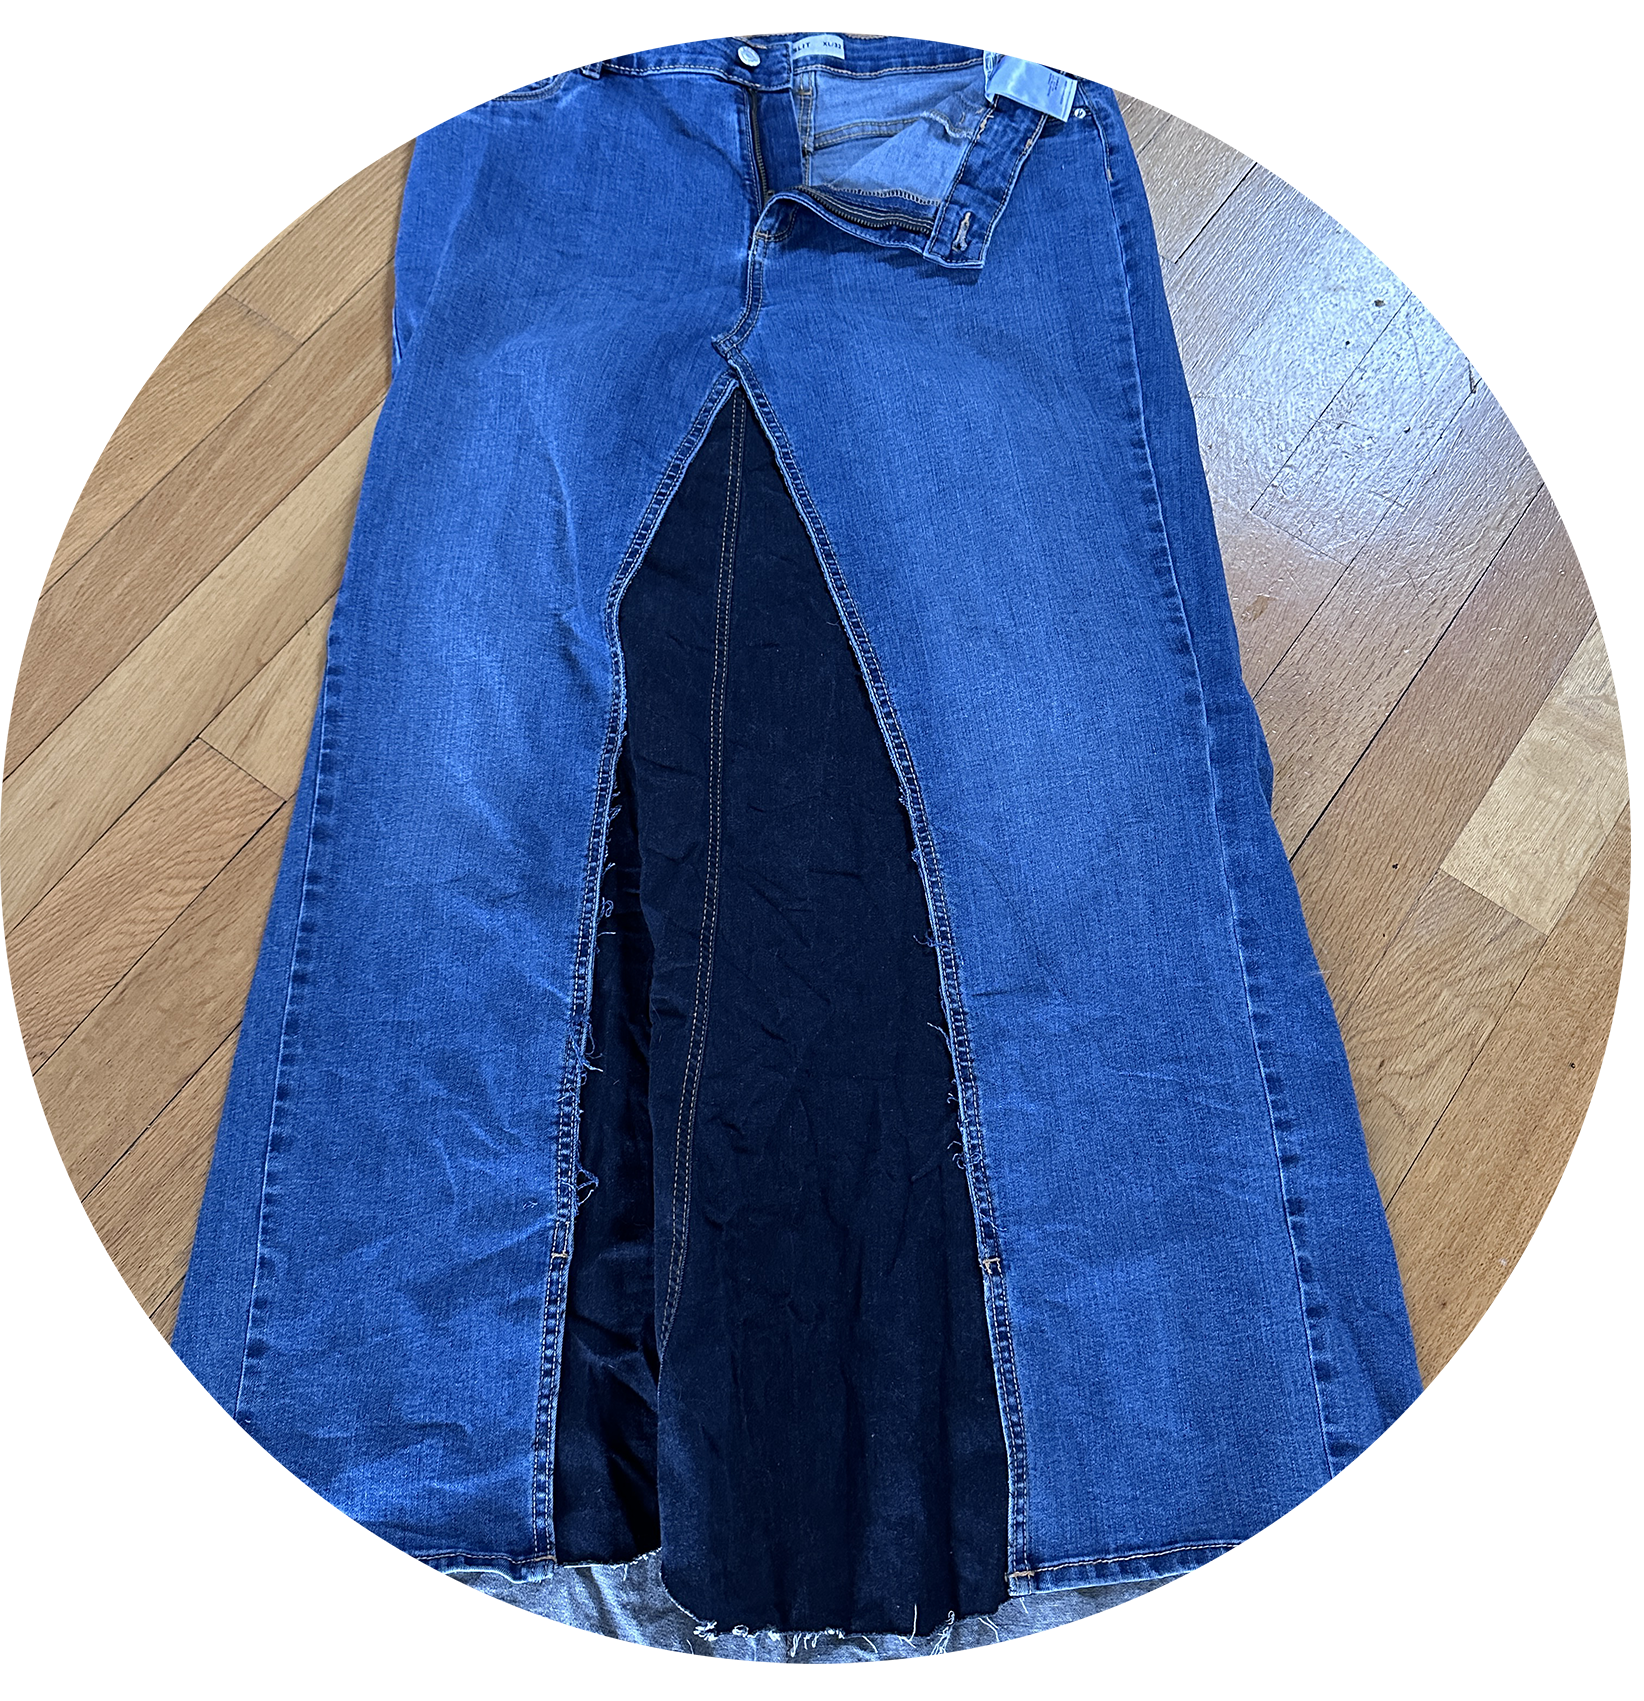
4.
5.
Jeans repaired with patches Gloves repaired with stitches Pants and blouse redesigned into a suit Two pairs of jeans redesigned into a skirt Shirt repaired with embroidery
Pictures submitted by participating citizens
Source: The Wardrobe Survey, December 2023
Source: The Wardrobe Survey, December 2023