1. Current status of the waste incineration sector in the Nordics
1.1 Sweden
Country-specific definitions
Vägledning till definitionen av kommunalt avfall, https://www.naturvardsverket.se/4967fb/contentassets/6aa56ee36643417ca7057ccbaa40bb66/vagledning-definitionen-kommunalt-avfall-version-2.pdf
The following terms are defined in Swedish legislation, but largely originate in the Waste Framework Directive and can thus be used as a guideline for other countries as well.
Directive 2008/98/EC of the European Parliament and of the Council of 19 November 2008 on waste and repealing certain Directives (Text with EEA relevance), https://eur-lex.europa.eu/legal-content/EN/TXT/PDF/?uri=CELEX:02008L0098-20180705
Waste: Any object, matter or substance belonging to a specific waste category which the holder disposes of or intends or is required to dispose of.
Municipal waste: Waste from households and other sources similar in nature and composition to household waste, excluding manufacturing waste, waste from agriculture and forestry, waste from fishing, wastes from septic tanks, sewage networks and sewage treatment, construction and demolition waste and end-of-life vehicles.
Household waste: Previous definition of waste from households and comparable waste from other activities. The legal term has been dropped and partly replaced by municipal waste; the municipality's exclusive right of collection has also been changed. Nowadays, the term household waste can only be used for waste actually originating from households.
1.1.1 Capacity, energy generation and emissions
Numbers on waste input and energy output
The installed capacity for incineration of mixed waste in Sweden was about 7.1 Mtons in 2021 with a planned use of 6.3 Mtons (including stops for revision and other planned stops). The latest numbers from 2022 show that 6.8 Mtons of waste was sent to incineration facilities.
Kapacitetsutredning 2022-Energiåtervinning och mängder restavfall till år 2027, Avfall Sverige
Avfall i Sverige 2020, Naturvårdsverket
The historical development of municipal waste incineration in Sweden has seen a distinct rise in treated volumes starting from the 1970s, see Figure 1.
Figure 1 Development of different waste handling methods over time. All numbers concern municipal waste.
Svensk Avfallshantering 2022, Avfall Sverige
While landfill still dominated in 1975, both recycling and waste incineration with energy recovery have grown more important since, with biological treatment of household waste (i.e., composting) steadily increasing as well. Landfill of untreated household waste does not occur on a relevant scale anymore. Almost all waste incineration with energy recovery in Sweden is done in combined heat and power (CHP) plants.
In the coming years, a capacity decrease of around 100 ktons per year is projected, while two new, smaller plants with a combined capacity of around 40 kton per year are planned, leaving the total capacity at a similar level as today.
The district heating sector is well-established in Sweden, and waste incineration contributes substantially to the energy balance: 17.9 TWh of heat were generated in 2022, with an additional production of 3 TWh electricity. Some units also produce district cooling, but the volume is marginal in comparison (0.09 TWh in 2022).
In total, waste incineration supplies around 25% of all district heating and around 1.8% of the Swedish electric power.
Among other reasons, the integration with the district heating sector has led to a high per-capita incineration capacity, which in part must be filled by waste from other countries. The import of waste-derived fuels to dedicated waste incineration plants (i.e., excluding sorted waste to recycling facilities and waste-derived fuel used in cement factories or other industries) in Sweden has stagnated at 1.4 to 1.6 Mtons per year since 2017. In the decade before that, a steep increase could be observed. The main countries of origin are Norway and Great Britain. For 2027, Avfall Sverige projects a necessary import volume of 1 to 1.9 Mtons, depending on the degree of sorting in Swedish and imported municipal waste and the development of incineration capacity until then.
Emissions
While emissions of dioxins, NOx, SO2 or HCl from waste incineration have been widely discussed and are frequently used as an argument against this technology, the focus of this report is on fossil CO2 emissions. When assessing these, it must be considered that waste-derived fuels are made up of a mixture of biogenic and fossil sources. The share of fossil and biogenic CO2 emissions can be determined indirectly by measuring the C14 content in the exhaust gases.
During the last decades, recycling behavior, the composition of waste-derived fuels and the overall fuel mix in CHP plants have changed considerably. The change from fossil- to biofuels in the Swedish CHP sector is distinct: from 2010 to 2021, total CO2 eq emissions decreased by more than 50%, see Figure 2.
Figure 2 Biogenic and fossil emissions from waste incineration assuming a 60:40 share as gathered from several sources.
Restavfallets Klimatpåverkan 2021, https://www.stockholmexergi.se/content/uploads/2021/07/Rapport-Avfallets-klimatp%C3%A5verkan-2021.pdf
Hållbarhetsredovisning 2022, https://www.renova.se/globalassets/02.hallbarhet/renova_hallbarhetsredovisning.pdf
In combination with the above-mentioned expansion of waste incineration, the share of fossil CO2 the sector contributes to total CO2 emissions from CHP has therefore increased as well: in 2021, 73% of all CO2 eq emissions in the CHP sector were from waste incineration. This highlights the importance of strategies to decrease these emissions, for example by increasing the recycling ratio of waste currently going to incineration or by deploying CCS in waste incineration.
1.1.2 Technology developments and pilots
As for many other industries, CCUS is considered a promising technology for the waste incineration sector to both handle inevitable fossil CO2 emissions and provide a feedstock of carbon-containing molecules for the chemical- or fuel industry of the future. No industrial-size pilots have been deployed so far, but projects are being drawn up, e.g., at the Sävenäs plant in Göteborg, where one to two out of four fuel lines might be equipped with CCS until 2030.
Här blir avfall till el och värme, Renova, 2023, https://www.renova.se/globalassets/11.-pdf-er/har-blir-avfall-till-el-och-varme/har_blir_avfall_till_el_och_varme_2023_v_2.pdf
Apart from CCS, other technological advances are made in the waste sector:
On the recycling side, an industrial scale pyrolysis plant for material recycling of plastics which cannot be recycled mechanically and with a capacity of initially 25.000 ton/year is planned at Borealis in Stenungsund (the plans for establishment however being put on hold for the time being
Personal communication, Marie-Louise Johansson, Borealis, 2023-12-01
Plastic in Sweden – facts and practical advice, Naturvårdsverket, 2022, https://www.naturvardsverket.se/496fd7/globalassets/media/publikationer-pdf/8800/978-91-620-8888-0.pdf
As a means to increase operational flexibility, efficiency and the resilience of the local district heating network, Mälarenergi in Västerås is currently constructing a 300.000m3 underground hot water reservoir in a rock cavern previously used as heavy oil storage. In case of unplanned outages, the cavern can supply the city of Västerås with district heating for about 2 weeks.
Some research is also conducted towards extracting materials from waste- or ash streams in the future.
1.2 Norway
1.2.1 Capacity, energy generation and emissions
In comparison with other European countries, the Norwegian population generates more waste per person, reaching 726 kg in 2020, than the EU-27 average representing 505 kg.
Municipal waste statistics. (n.d.). Retrieved 23 October 2023, from https://ec.europa.eu/eurostat/statistics-explained/index.php?title=Municipal_waste_statistics
Avfall i Norge. (2022, December 8). Miljøstatus. https://miljostatus.miljodirektoratet.no/tema/avfall/
This trend was observed while the amount of waste treated has remained fairly stable since 2012, showing a slight increase as shown on Figure 3. It reached a peak in 2018 at 11.8 Mtons and decreased to 11.5 Mtons in 2021. Mechanical recycling remained the main waste treatment with a share of 33% in 2021. Then, incineration has the second biggest flow of waste treated, representing 26.5% in 2021.
Figure 3 Evolution of waste treatment in Norway. Source: 10513: Avfallsregnskap for Norge (1 000 tonn), etter behandlingsmåte, materialtype, statistikkvariabel og år. Statistikkbanken. (n.d.). SSB. Retrieved 22 October 2023, from https://www.ssb.no/system/
As one of the main treatment options for waste in Norway, the incineration activity is constituted of 18 plants in operation as of 2022. Of which, 7 main incineration plants burning more than 100 000 ton of waste per year.
Avfallsforbrenning med energiutnyttelse. (2022, December 9). Miljøstatus. https://miljostatus.miljodirektoratet.no/tema/avfall/avfallshandtering/avfallsforbrenning-med-energiutnyttelse/
Avfallsforbrenning med energiutnyttelse. (2022, December 9). Miljøstatus. https://miljostatus.miljodirektoratet.no/tema/avfall/avfallshandtering/avfallsforbrenning-med-energiutnyttelse/
08940: Klimagasser, etter utslippskilde, energiprodukt og komponent, GWP-verder etter Kyotoprotokollen (AR4) (avslutta serie) 1990 - 2022. Statistikkbanken. (n.d.). SSB. Retrieved 17 October 2023, from https://www.ssb.no/statbank/table/08940
Figure 4 Volume of waste incinerated over time and related emissions. Source: Avfallsforbrenning med energiutnyttelse. (2022, December 9). Miljøstatus. https://miljostatus.miljodirektoratet.no/tema/avfall/avfallshandtering/avfallsforbrenning-med-energiutnyttelse/
The volumes sent to incineration tripled during that period, peaking in 2016 at 3.8 Mtons and decreased steadily from 2018. The economic crisis in 2008 led to a reduced waste generation, coming probably mainly from the construction and service sector.
Avfall i Norge. (2022, December 8). Miljøstatus. https://miljostatus.miljodirektoratet.no/tema/avfall/
Avfall i Norge. (2022, December 8). Miljøstatus. https://miljostatus.miljodirektoratet.no/tema/avfall/
The emission curve related to the incineration activity follows the evolution of the total waste delivered. Different data series have been gathered by the Environment Agency to produce Figure 4 and the split between incineration with or without energy recovery is not registered in this reporting since 2012, even though a limited incineration activity that does not recover energy still remains today.
Miljødirektoratet. (2019). Avfallsplan 2020-2025—Status og planer for avfallshåndtering, inkludert avfallsforebyggingsprogram (1582; p. 72). Miljødirektoratet. https://www.regjeringen.no/contentassets/c6a9a384d90c4af18bfd8458f3167708/avfallsplan-2020-2025.pdf
Miljødirektoratet. (2019). Avfallsplan 2020-2025—Status og planer for avfallshåndtering, inkludert avfallsforebyggingsprogram (1582; p. 72). Miljødirektoratet. https://www.regjeringen.no/contentassets/c6a9a384d90c4af18bfd8458f3167708/avfallsplan-2020-2025.pdf
Veileder for KOSTRA rapporteringsåret 2020 -Skjema 21: Husholdningsavfall 2020. (n.d.). https://www.ssb.no/forside/_attachment/440910
The type of waste that is sent to incineration is represented in Figure 5. The split has not significantly changed since 2012. Most of the waste is mixed waste, representing 60% of the total share in 2021. Then, wood waste (18%), hazardous waste (12%), plastic (3%) and sludge (3%) make up the rest of the volume in 2021. All other categories are under 1% each.
Figure 5 Type of waste incinerated over time. Source: Avfallsforbrenning med energiutnyttelse. (2022, December 9). Miljøstatus. https://miljostatus.miljodirektoratet.no/tema/avfall/avfallshandtering/avfallsforbrenning-med-energiutnyttelse/
Some trends in terms of volume and type of waste can be identified. Historically, a decrease in paper waste has been observed. This decrease is due to changes in newspaper reading habits.
Sveinung, B., Frode, S., & Andreas, D. (2019). Avfallsmengder fram mot 2035—Energigjenvinningens rolle i sirkulørækonomi (07/2019; p. 32). Mepex Consult AS. https://avfallnorge.no/fagomraader-og-faggrupper/rapporter/avfallsmengder-fram-mot-2035
There are no official national statistics regarding the composition of mixed waste that goes to waste incinerators, however, analyses have been conducted at the municipal level for the commune of Oslo and the intercommunal area of Romsdal in 2017. The results are shown in Figures 5.1 and 5.2 below. They reveal that both regions share similarities in the overall composition of mixed waste, i.e. the dominance of food waste as a significant component of mixed waste (32.3% in Oslo and 20.9% in Romsdal) or the relatively low percentage in hazardous and/or EE-waste. Nevertheless, the variations in percentages suggest that waste composition is not uniform and can vary between regions, i.e. due to local consumption patterns or waste management strategies.
Hjellnes Consult AS for Renovasjonsetaten. (2017) Avfallsanalysen Oslo 2017 (p.23) https://avfallnorge.no/fagomraader-og-faggrupper/plukkanalyser/analyse-i-oslo-kommune ; Sveinung, B., Frode, S. (2018) Plukkanalyse RIR 2017 (p.5). https://avfallnorge.no/fagomraader-og-faggrupper/plukkanalyser/plukkanalyse-romsdalen-interkommunale-renovasjons-selskap-iks
Figure 5.1 The composition of residual waste in the commune of Oslo Source: Hjellnes Consult AS for Renovasjonsetaten. (2017) Avfallsanalysen Oslo 2017https://avfallnorge.no/fagomraader-og-faggrupper/plukkanalyser/analyse-i-oslo-kommune
Figure 5.2 The composition of residual waste in the intercommunal area of Romsdal Source: Sveinung, B., Frode, S. (2018) Plukkanalyse RIR 2017. https://avfallnorge.no/fagomraader-og-faggrupper/plukkanalyser/plukkanalyse-romsdalen-interkommunale-renovasjons-selskap-iks
Furthermore, the continuous developments in sensor and sorting technology occurring upstream allow to deliver more waste to material recycling and have an influence on the type of waste that the incineration plants receive.
Miljødirektoratet. (2019). Avfallsplan 2020-2025—Status og planer for avfallshåndtering, inkludert avfallsforebyggingsprogram (1582; p. 72). Miljødirektoratet. https://www.regjeringen.no/contentassets/c6a9a384d90c4af18bfd8458f3167708/avfallsplan-2020-2025.pdf
Sveinung, B., Frode, S., & Andreas, D. (2019). Avfallsmengder fram mot 2035—Energigjenvinningens rolle i sirkulørækonomi (07/2019; p. 32). Mepex Consult AS. https://avfallnorge.no/fagomraader-og-faggrupper/rapporter/avfallsmengder-fram-mot-2035
Miljødirektoratet. (2019). Avfallsplan 2020-2025—Status og planer for avfallshåndtering, inkludert avfallsforebyggingsprogram (1582; p. 72). Miljødirektoratet. https://www.regjeringen.no/contentassets/c6a9a384d90c4af18bfd8458f3167708/avfallsplan-2020-2025.pdf
A potential for incinerating more hazardous waste has been observed.
Sveinung, B., Frode, S., & Andreas, D. (2019). Avfallsmengder fram mot 2035—Energigjenvinningens rolle i sirkulørækonomi (07/2019; p. 32). Mepex Consult AS. https://avfallnorge.no/fagomraader-og-faggrupper/rapporter/avfallsmengder-fram-mot-2035
Sveinung, B., Frode, S., & Andreas, D. (2019). Avfallsmengder fram mot 2035—Energigjenvinningens rolle i sirkulørækonomi (07/2019; p. 32). Mepex Consult AS. https://avfallnorge.no/fagomraader-og-faggrupper/rapporter/avfallsmengder-fram-mot-2035
Role of waste incineration in waste treatment
The national strategy for Circular Economy sets time-incremented goals as shown in Table 1.
Requirements | 2020 | 2025 | 2030 | 2035 |
Preparation for reuse and material recycling of household waste and similar waste from the industry | 65% | 70% | ||
Material recycling of all packaging | 65% | 70% | 70% | |
Preparation for reuse and material recycling of building and construction waste | 70% | |||
Reduction in food waste | 15% | 30% | 50% |
Table 1 Preparation for reuse and material recycling goals in Norway in 2035
Klima- og miljødepartementet. (2021). Nasjonal strategi for ein grøn, sirkulær økonomi (978-82-457-0524–9; T-1573 N, p. 164). https://www.regjeringen.no/no/dokumenter/nasjonal-strategi-for-ein-gron-sirkular-okonomi/id2861253/
No goal is set for waste incineration in this strategy, but it is mentioned that a significant amount of the remaining waste not being reused or recycled will have to be incinerated. It is however required that the plant should produce heat and electricity from it.
Klima- og miljødepartementet. (2021). Nasjonal strategi for ein grøn, sirkulær økonomi (978-82-457-0524–9; T-1573 N, p. 164). https://www.regjeringen.no/no/dokumenter/nasjonal-strategi-for-ein-gron-sirkular-okonomi/id2861253/
Moreover, a further requirement has been implemented since January 2023: all food and plastic waste must be sorted out.
miljødepartementet, K. (2022, June 7). Strengere krav til kildesortering av avfall [Nyhet]. Regjeringen.no; regjeringen.no. https://www.regjeringen.no/no/aktuelt/strengere-krav-til-kildesortering-av-avfall/id2917708/
Role of waste incineration in the energy sector
The incineration sector plays a significant role as a district heating provider. As shown in Figure 6, waste incineration has been the main provider of heat used in district heating since 2013, representing 43% of the total production in 2022, reaching 3036GWh. Wood chips incineration has gained a bigger role over time, reaching 28% in 2022.
Figure 6 District heating supply in Norway over time. Source: Fjernvarme og fjernkjøling. (n.d.). SSB. Retrieved 3 October 2023, from https://www.ssb.no/energi-og-industri/energi/statistikk/fjernvarme-og-fjernkjoling
On the other hand, waste incineration plays a less significant role in electricity generation. With 83MW of installed capacity in 2022, waste incineration represents 13% of the total installed capacity provided by thermal plants in Norway and only 0.2% of the total installed capacity overall as shown in Table 2. The Norwegian Energy Regulatory Authority does not provide normal year production for the waste incineration activity. By taking the 13% ratio of installed capacity and assuming a normal year production for all the thermal plants, it is estimated that the waste incineration would produce 0.4TWh.
Technology | Installed capacity (MW) | Normal year production (TWh) |
Hydroelectric | 33730 | 136.9 |
Wind | 5083 | 16.9 |
Thermal | 559 | 2.7 |
Waste incineration | 83 | 0.4 |
Total | 39455 | 156.9 |
Table 2 Electricity production in Norway. Modified from: Kraftproduksjon—NVE. (n.d.). Retrieved 23 October 2023, from https://www.nve.no/energi/energisystem/kraftproduksjon/
International trade linked to waste incineration
The Norwegian waste policy is framed by the European Economic Agreement (EEA). It ensures a common waste market in the European economic area and each year Norway exports 2 Mtons and imports a bit below 1 Mtons of waste (all waste treatment types included).
Klima- og miljødepartementet. (2021). Nasjonal strategi for ein grøn, sirkulær økonomi (978-82-457-0524–9; T-1573 N, p. 164). https://www.regjeringen.no/no/dokumenter/nasjonal-strategi-for-ein-gron-sirkular-okonomi/id2861253/
Secretariat of the Basel Convention. (2020). BASEL CONVENTION ON THE CONTROL OF TRANSBOUNDARY MOVEMENTS OF HAZARDOUS WASTES AND THEIR DISPOSAL (p. 98). https://www.basel.int/TheConvention/Overview/TextoftheConvention/tabid/1275/Default.aspx
Commission Decision of 3 May 2000 replacing Decision 94/3/EC establishing a list of wastes pursuant to Article 1(a) of Council Directive 75/442/EEC on waste and Council Decision 94/904/EC establishing a list of hazardous waste pursuant to Article 1(4) of Council Directive 91/689/EEC on hazardous waste (notified under document number C(2000) 1147) (Text with EEA relevance) (2000/532/EC), (2015). http://data.europa.eu/eli/dec/2000/532/2015-06-01/eng
The export of waste has increased since 2010, partly due to an increase of mixed waste export to incineration plants in Sweden. With a total incineration capacity of around 1.7–2 Mtons of mixed waste in 2019,
Sveinung, B., Frode, S., & Andreas, D. (2019). Avfallsmengder fram mot 2035—Energigjenvinningens rolle i sirkulørækonomi (07/2019; p. 32). Mepex Consult AS. https://avfallnorge.no/fagomraader-og-faggrupper/rapporter/avfallsmengder-fram-mot-2035
Import og eksport av avfall. (2022, June 20). Miljøstatus. https://miljostatus.miljodirektoratet.no/tema/avfall/import-og-eksport-av-avfall/
Miljødirektoratet. (2019). Avfallsplan 2020-2025—Status og planer for avfallshåndtering, inkludert avfallsforebyggingsprogram (1582; p. 72). Miljødirektoratet. https://www.regjeringen.no/contentassets/c6a9a384d90c4af18bfd8458f3167708/avfallsplan-2020-2025.pdf
While 750 000 tons of mixed waste was exported to Sweden for incineration in 2018, 160 000 tons of mixed waste coming from the UK has been imported the same year to be incinerated in Norway.
Miljødirektoratet. (2019). Avfallsplan 2020-2025—Status og planer for avfallshåndtering, inkludert avfallsforebyggingsprogram (1582; p. 72). Miljødirektoratet. https://www.regjeringen.no/contentassets/c6a9a384d90c4af18bfd8458f3167708/avfallsplan-2020-2025.pdf
CO2 emissions from the waste incineration sector
Dedicated statistics on fossil and biogenic CO2 are available from the national industrial registry. Trends can be observed even though emission reporting data for some plants is missing in the registry. Figure 7 indicates a progression in total CO2 emissions from 160ktons in 2000, to 1.5 Mtons in 2022. There has been a general decrease to 194ktons emitted in 2007 but it increased steadily after that. The share of biogenic CO2 fluctuated between 12% in 2003 and 62% in 2009. There have been 0.74 Mtons of biogenic CO2 emissions in 2022, representing 51% of total CO2 emitted. The fluctuation of the biogenic share might be due to the change in waste type and reporting practices from companies. Some companies are monitoring their biogenic CO2 and others base their reporting on a standard ratio. This aspect will be further discussed in the legislative framework chapter on Norway.
Figure 7 Fossil and biogenic CO2 emissions over time. Source: Norske utslipp, Landbasert industri. (n.d.). Retrieved 23 October 2023, from https://www.norskeutslipp.no/no/Landbasert-industri/?SectorID=600
1.2.2 Technology developments and pilots
Carbon capture and storage
The Norwegian government has made major funding commitments to the Longship Project which aims to realize the first industrial Carbon Capture and Storage (CCS) chain. As part of the project, for the implementation of a carbon capture installation that will capture up to 400 000 tons of CO2 per year, the WtE plant Hafslund Oslo Celsio has secured a state aid agreement with the Norwegian government that gives, up to a certain level (NOK3.08 billion
Karbonfangst i Oslo realiseres. (n.d.). Hafslund. Retrieved 20 October 2023, from https://hafslund.no/nyheter/karbonfangst-i-oslo-realiseres
Regulatory Lessons Learned from Longship – The public sector’s involvement in Europe’s first industrial CCS chain. (n.d.). Fullskala. Retrieved October 19, 2023, from https://ccsnorway.com/publication/regulatory-lessons-learned/
The City of Oslo ensures realisation of carbon capture and storage (CCS). (2022, March 23). Oslo Kommune. https://www.oslo.kommune.no/politics-and-administration/politics/press-releases/the-city-of-oslo-ensures-realisation-of-carbon-capture-and-storage-ccs ; Status june 2023, Longship. (2023, August 8). Fullskala. https://ccsnorway.com/status-june-2023-longship/
Further opportunities to secure investments and revenues for CCS technology are being explored within the context of voluntary carbon markets (VCMs), where bio-CCS (or often called BECCS) certificates from waste incineration could be sold to potential buyers. Hafslund Oslo Celsio is working with CCS+, an initiative that aims to unlock the potential of certified CO2 capture, utilization, removal, and storage solutions, to develop the appropriate carbon accounting methodologies for that purpose.
CCS+ initiative—Partners. (n.d.). CCS+ Initiative. Retrieved October 12, 2023, from https://ccsplus.org/governance/
For further discussion see, i.e. Möllersten, K., & Zetterberg, L. (2023). Bringing BECCS credits to voluntary carbon markets—A policy brief by Sustainable Finance Lab
The Returkraft waste incineration plant in Kristiansand is testing out CCS technology with support from CLIMIT since May 2023 after having received funding for research, development and demonstration of CCS technologies under the CLIMIT programme run by Gassnova SF.
Returkraft is testing out membrane technology with support from CLIMIT. (2023, June 29). Climit. https://climit.no/en/news/returkraft-is-testing-out-membrane-technology-with-support-from-climit/
Other waste incineration actors are also looking to implement carbon capture. As most of them face the same challenges, 8 of the main actors active in waste incineration decided to create a common collaboration entity (KAN) to share information and work together to solve different challenges linked to the implementation of CCUS.
KAN - Klimakur for Avfallsforbrenning. (n.d.). KAN - Klimakur for Avfallsforbrenning. Retrieved 23 October 2023, from https://www.kanco2.no
1.3 Finland
Definitions (Waste Act 646/2011)
Municipal waste means waste generated from permanent dwellings, free-time dwellings and residential homes as well as other residential waste, including paper, cardboard, glass, metal, plastic, textile and biowaste as well as discarded electrical and electronic equipment, discarded batteries and accumulators, and discarded large items, as well as waste that is similar in nature generated from administrative, service and business activities excluding, however, septic tank and cesspool sludge.
Mixed municipal waste means the municipal waste remaining after fractions specified by waste type have been separately collected at source.
1.3.1 Capacity, energy generation and emissions
In the report "The circular economy of waste incineration and influencing the climate effects with different control methods" from the year 2021, it is pointed out that currently in Finland approximately 56% of the total amount of municipal waste is incinerated. Based on environmental permits, the combustion capacity of waste incineration plants is a total of approximately 1.8 Mtons/year. Based on the environmental reports of waste incineration plants, the incineration capacity utilization rate is approximately 90%. The situation has changed a little since this, because during this survey, nine waste incineration plants were in use, and currently 11 waste incineration plants are in operation, whereby the waste incineration capacity has increased to 2.1 Mtons/a.
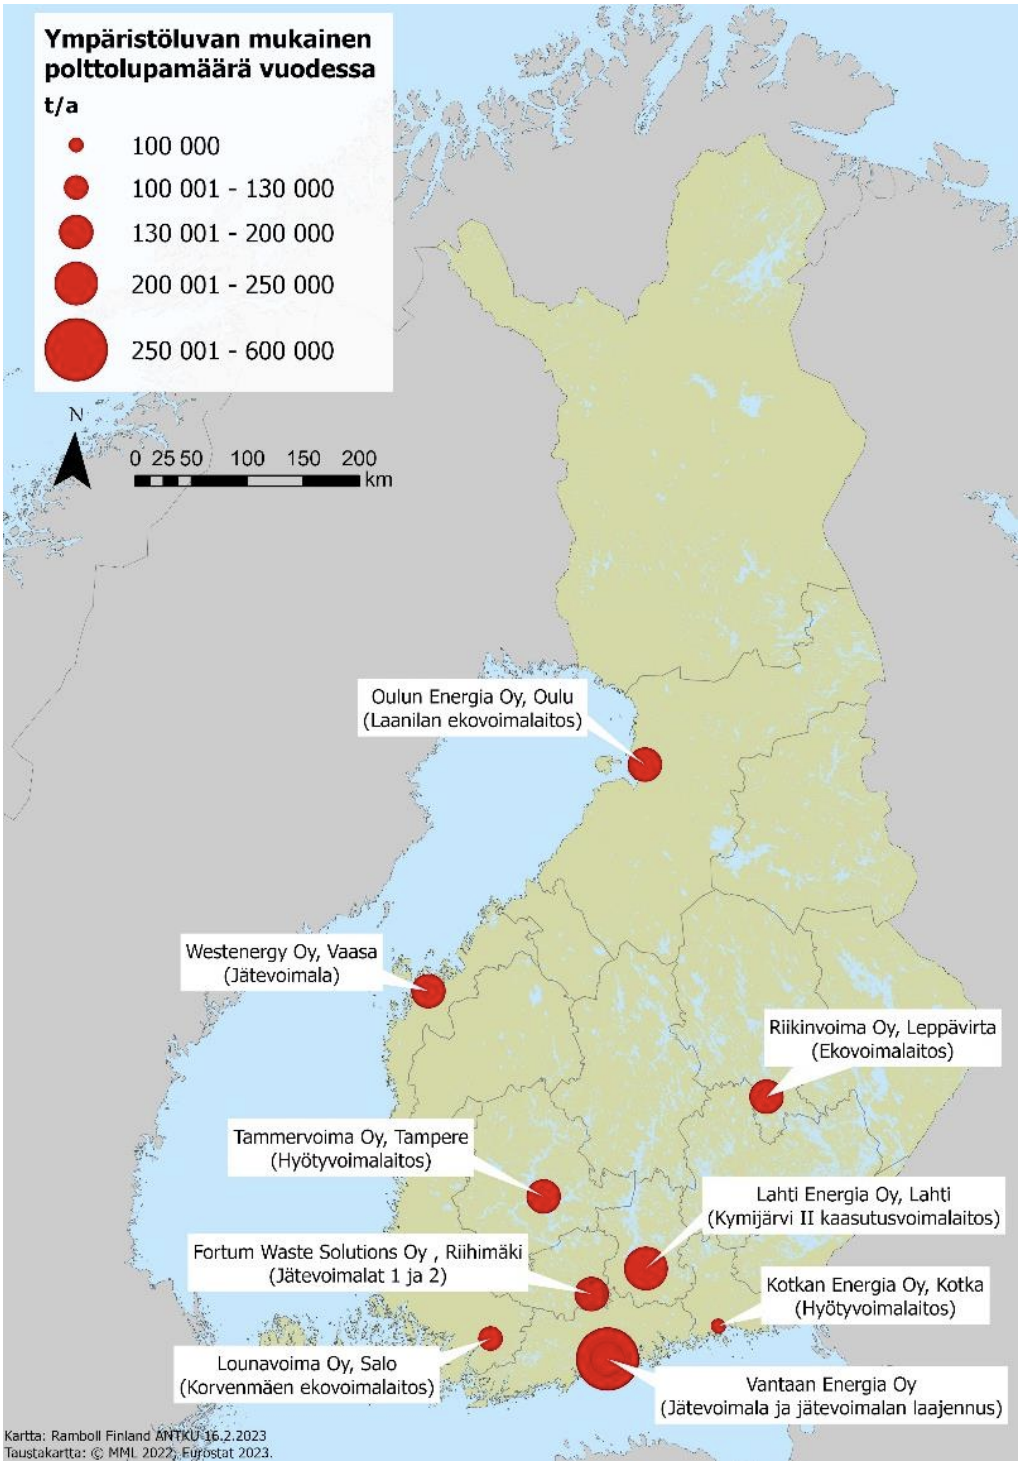
Figure 8 Location of Finnish waste incineration plants (Ministry of Economic Affairs and Employment: Waste incineration inclusion to the emission trade, 2023)
Plant | Location | Capacity, t/a | Started at |
Fortum Waste Solution 1 | Riihimäki | 175 000 | 2007 |
Fortum Waste Solution 2 | Riihimäki | 130 000 | 2012 |
Kotkan Energia Oy | Kotka | 120 000 | 2009 |
Oulun Energia Oy | Oulu | 175 000 | 2012 |
Lahti Energia Oy, Kymijärvi II | Lahti | 250 000 | 2012 |
Westenergy Oy | Lahti | 200 000 | 2013 |
Vantaan Energia Oy | Vantaa | 420 000 | 2014 |
Vantaan Energia Oy, Expansion | Vantaa | 180 000 | 2022 |
Tammervoima Oy | Tampere | 180 000 | 2016 |
Riikinvoima Oy | Leppävirta | 170 000 | 2016 |
Lounavoima Oy | Salo | 120 000 | 2021 |
Total | 2 120 000 |
Table 3 Capacity of Finnish incineration plants
In 2021, energy utilization of waste accounted for 62% of municipal waste processing, in 2020 the corresponding figure was 57%. Waste incineration has increased since 2020 at the expense of material recycling. In 2021, the share of material recycling in municipal waste processing was 37%, while in 2020 the share was 42%. (Ministry of Economic Affairs and Employment in Finland) (tem.fi), p. 9)
2021 | Amount of waste, tons |
In total | 3 490 676 |
Energy utilization | 2 109 565 |
Disposal incineration | 6 088 |
Material utilization | 1 360 524 |
Landfill placement and other disposal | 14 499 |
Table 4 Finnish municipal waste by treatment method in 2021.
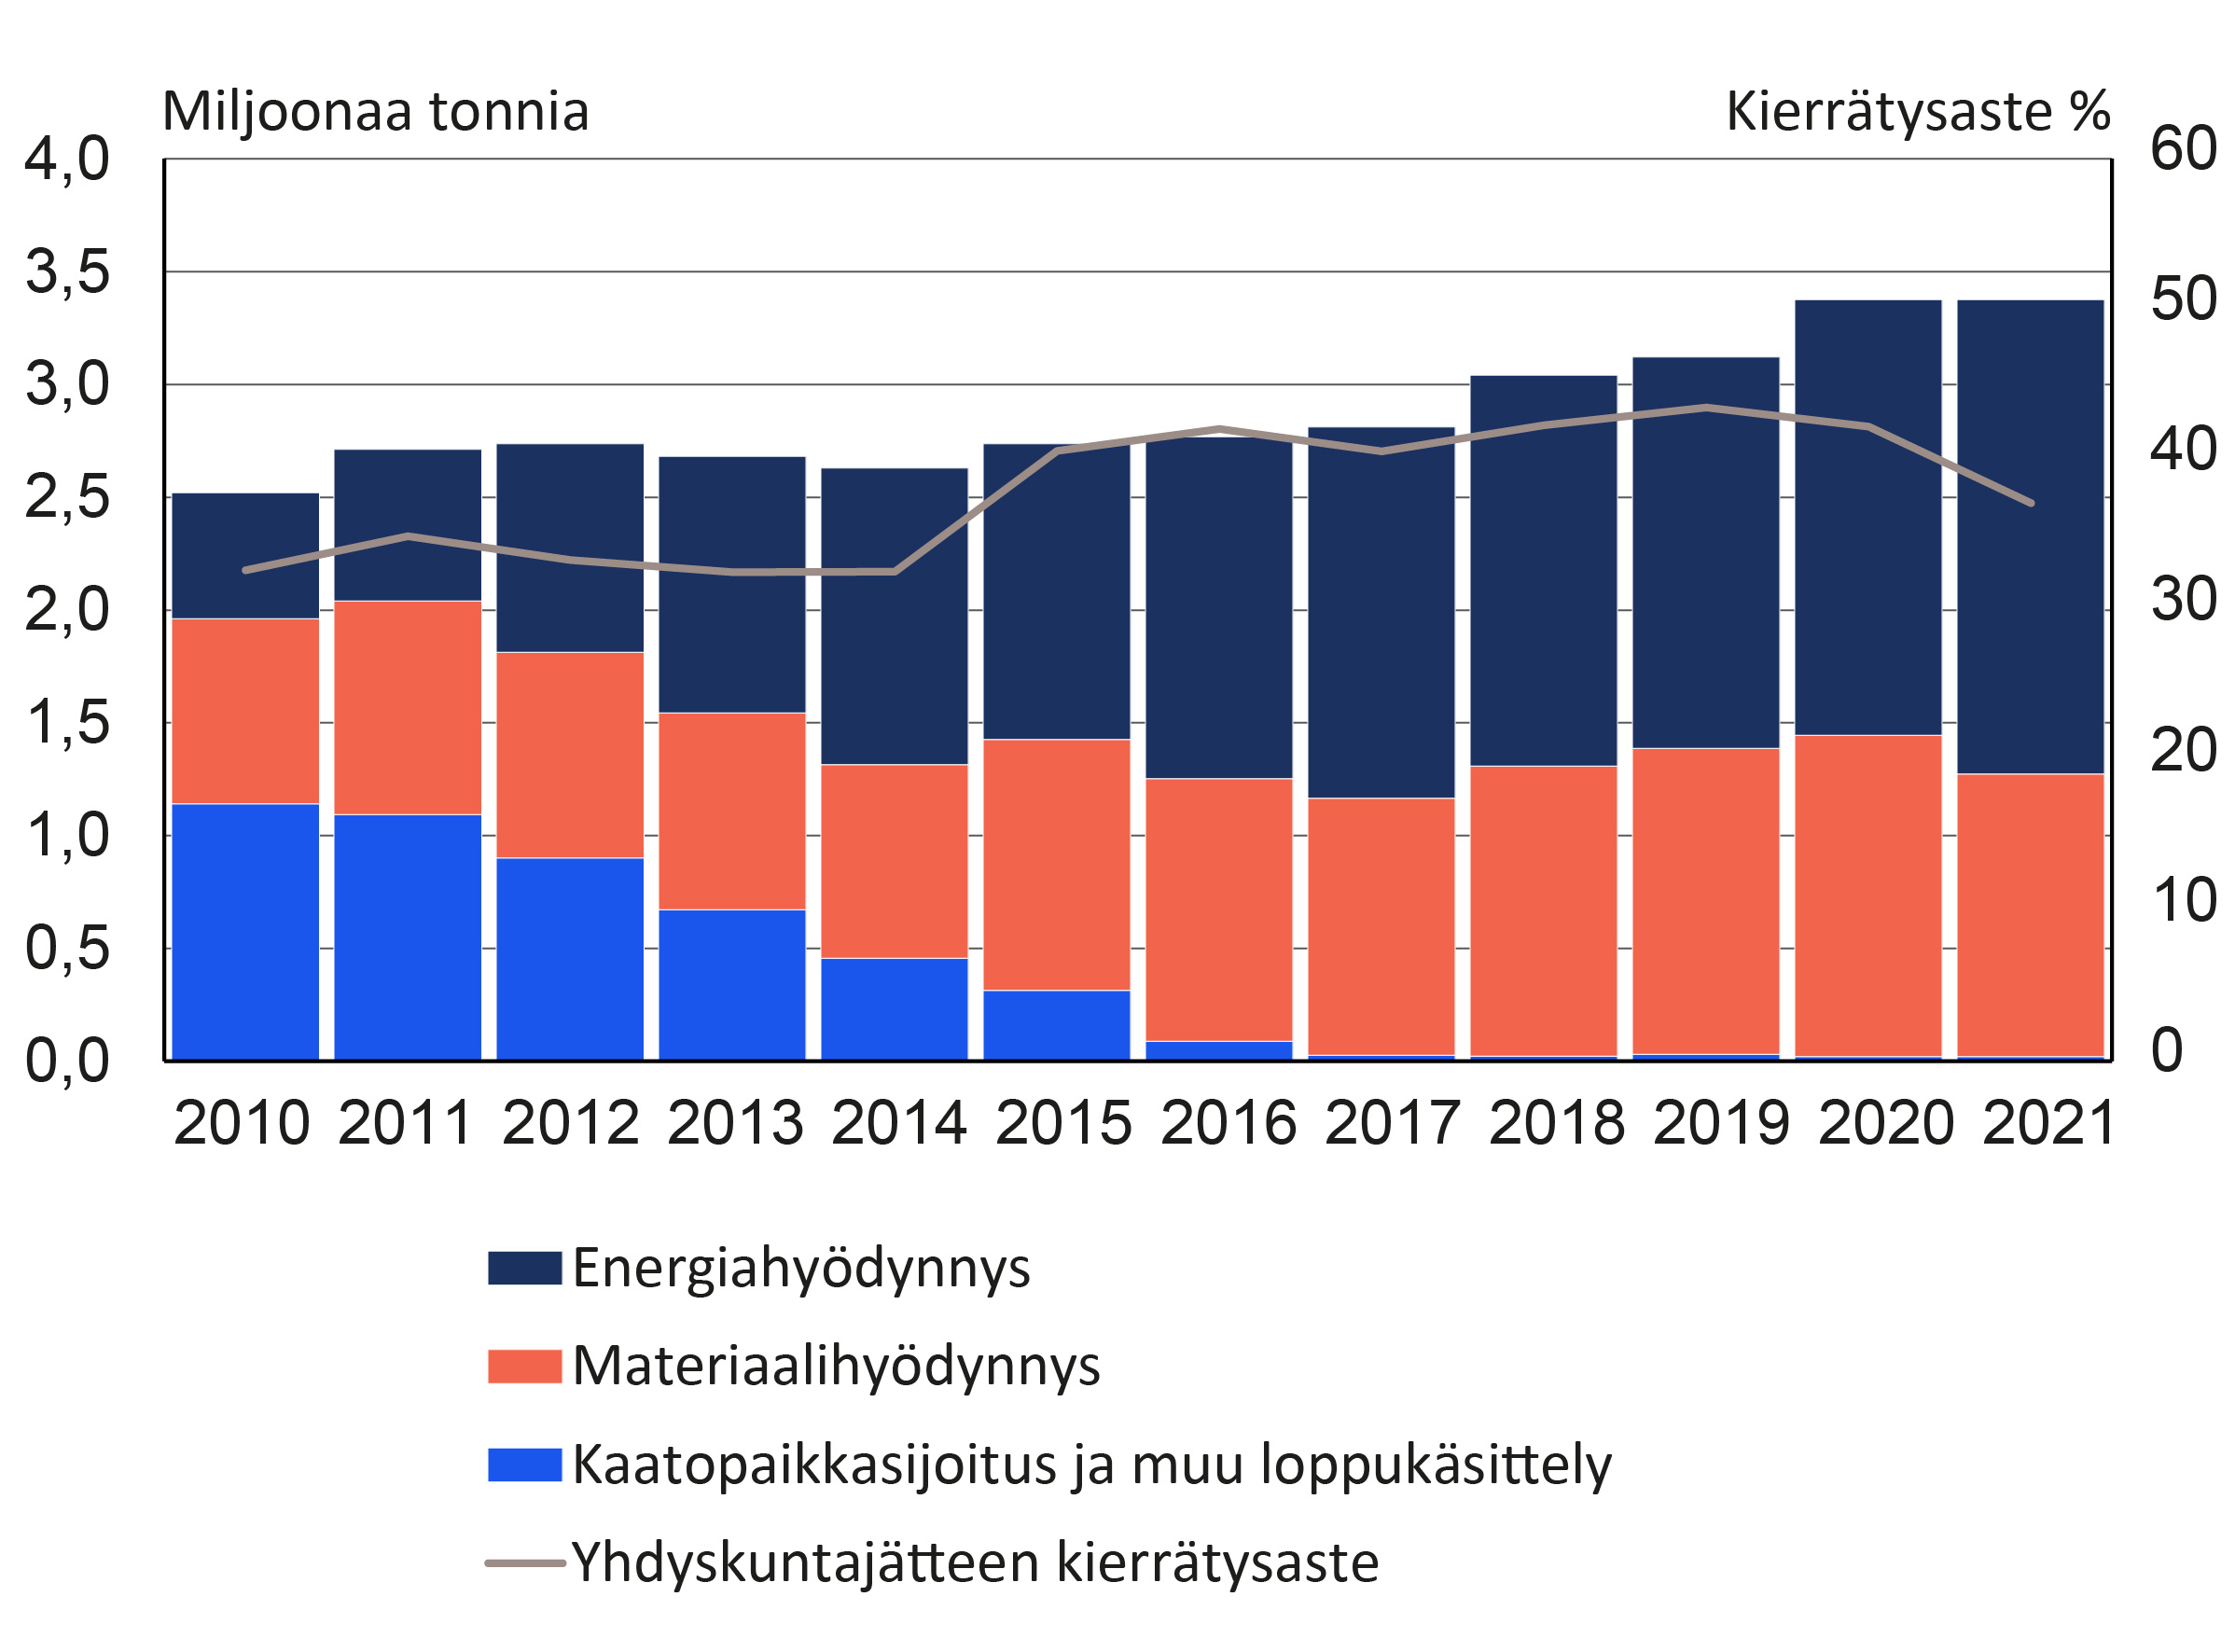
Figure 9 Treatment of municipal waste in Finland: energy utilization (dark blue), material recycling (red), landfill (light blue)
Table 5 Amounts of different wastes by treatment 2021
ISSN=2323-5314. Helsinki: Statistics Finland [Referenced: 20.10.2023]. Access method: https://stat.fi/en/statistics/jate)
2021 | Amount of waste (1000 tons) | ||||
Total | Energy recovery | Incineration without energy recovery | Material recovery | Lanfilling and other disposal | |
Chemical waste | 403 | 29 | 99 | 105 | 171 |
Metallic waste | 1 411 | 0 | 0 | 1 411 | 1 |
Glass waste | 107 | 0 | 0 | 106 | 0 |
Paper and cardboard waste | 272 | 11 | 0 | 261 | 0 |
Plastic and rubber waste | 112 | 94 | 1 | 17 | 1 |
Wood waste | 2 774 | 2 675 | 3 | 95 | 0 |
Animal and vegetal waste | 900 | 171 | 0 | 726 | 3 |
Household and mixed waste | 2 914 | 2 411 | 9 | 442 | 52 |
Sludges | 1 061 | 361 | 21 | 217 | 462 |
Mineral waste | 116 179 | 460 | 3 | 7 307 | 108 409 |
Other waste | 878 | 276 | 29 | 491 | 83 |
Of which hazardous waste | 25 056 | 97 | 121 | 254 | 24 584 |
Total | 127 012 | 6 490 | 165 | 11 176 | 109 182 |
According to Statistics Finland's data, electricity production in 2021 was 69.3 TWh, and waste incineration plants produced approximately 1% of this amount (approx. 0.7 TWh). District heat production in 2021 was a total of 40.8 TWh, and waste incineration plants accounted for about 7% of this (approx. 3 TWh). Co-incineration plants are excluded from this review, but they increase the share of electricity and heat produced by waste incineration. For example, in 2019, 2.3 TWh/a of energy obtained from waste was produced in co-incineration plants (AFRY Management Consulting Oy, 2021).
Municipal waste as a fuel differs to some extent from other typically used fossil - and biofuels. Municipal waste is highly inhomogeneous, which makes determining the quality of the waste often unreliable and creates challenges for truthful reporting of emissions and dividing emissions into biogenic and fossil. This is, however, inherent to municipal waste being a mix of different materials and not exclusive for Finland.
The calculations are based on the CO2 factors given by Statistics Finland, which estimates annually the composition of wastes and amounts of biogenic and fossil carbon and the emission rate. In 2023 the share of biogenic carbon has been estimated 60% for SRF (solid recovered fuel) and 50% for municipal or mixed wastes.
Carbon dioxide emissions from incineration plants was 0,7 Mton in 2021 (Statistics Finland). This figure does not include emission data from co-incineration plants, so the total carbon dioxide emissions from waste combustion are higher.
Finland's co-incineration plants are allowed to burn a total of just over 1 Mtons of waste per year based on environmental permits. With the completion of the co-incineration plants under construction, the capacity according to environmental permits will increase by about 85,000 tons. Combustion permits have been issued in co-incineration plants for several waste fractions, such as SRF, recycled/dismantled wood, municipal waste, sludge, forest industry production rejects, industrial side streams and collected oils. Based on the environmental reports of the co-incineration plants, waste incineration permits are not used to their full extent. According to the data of the latest reports, only about 40% of the capacity according to the environmental permits is in use. More than 50% of the amount of recycled fuel permitted by the environmental permit is used in only 7 co-incineration plants. (Influencing the circular economy and climate effects of waste incineration with different control methods, 2021)
Municipal waste was not imported remarkably during 2017–2021, however, after that the import has increased partly due to incineration capacity available and ending the import of wood from Russia. The numbers on import are not available for 2022, but there is evidence that the import has been increasing.
Figure 10 Export of municipal waste from Finland
Åland
In 2020, the Region of Åland produced 47 400 tons of non-hazardous waste of which 21 100 tons was transported and handled outside the region. Of the transported waste 48% equaling 10 200 tons was transported to the mainland of Finland and 52% equaling 10 900 tons to Sweden. A vast majority of the combustible household waste is transported to Sweden for combustion due to the shorter distance. There are no plans on establishing an own combustion plant on Åland at the moment due to the small amount of combustible waste generated. The government of Åland is preparing a new law regarding waste which will aim at a greater recycling rate.
1.3.2 Near-term trends
Finland is far behind the targets in recycling wastes. Municipal waste is not placed on landfills, but material recycling should reduce waste incineration. The recycling rate of municipal waste was 39% in 2021, when the targets are 55% for 2025 and 60% for 2030.
Waste incineration plants are sized according to estimated waste quantities and energy demand, and they are designed for base load production. The plants are also relatively new and are designed for long-term use. The current capacity covers the whole of Finland, and no larger new facilities are planned. The import of waste-based fuels has been increasing (year 2022: 47 thousand tons), but the future trends are not available.
According to interviews, most of the facilities have a plan or road map for implementing CCU, where CO2 is used to produce methane and other chemicals. For example, Nordic Ren-Gas Oy has development agreements with several incineration plants.
1.4 Denmark
1.4.1 Capacity, energy generation and emissions
Denmark’s Energy Agency (Energistyrelsen) publishes annual benchmarking reports covering the Danish waste sector. The most recent report is based on data for the year 2020.
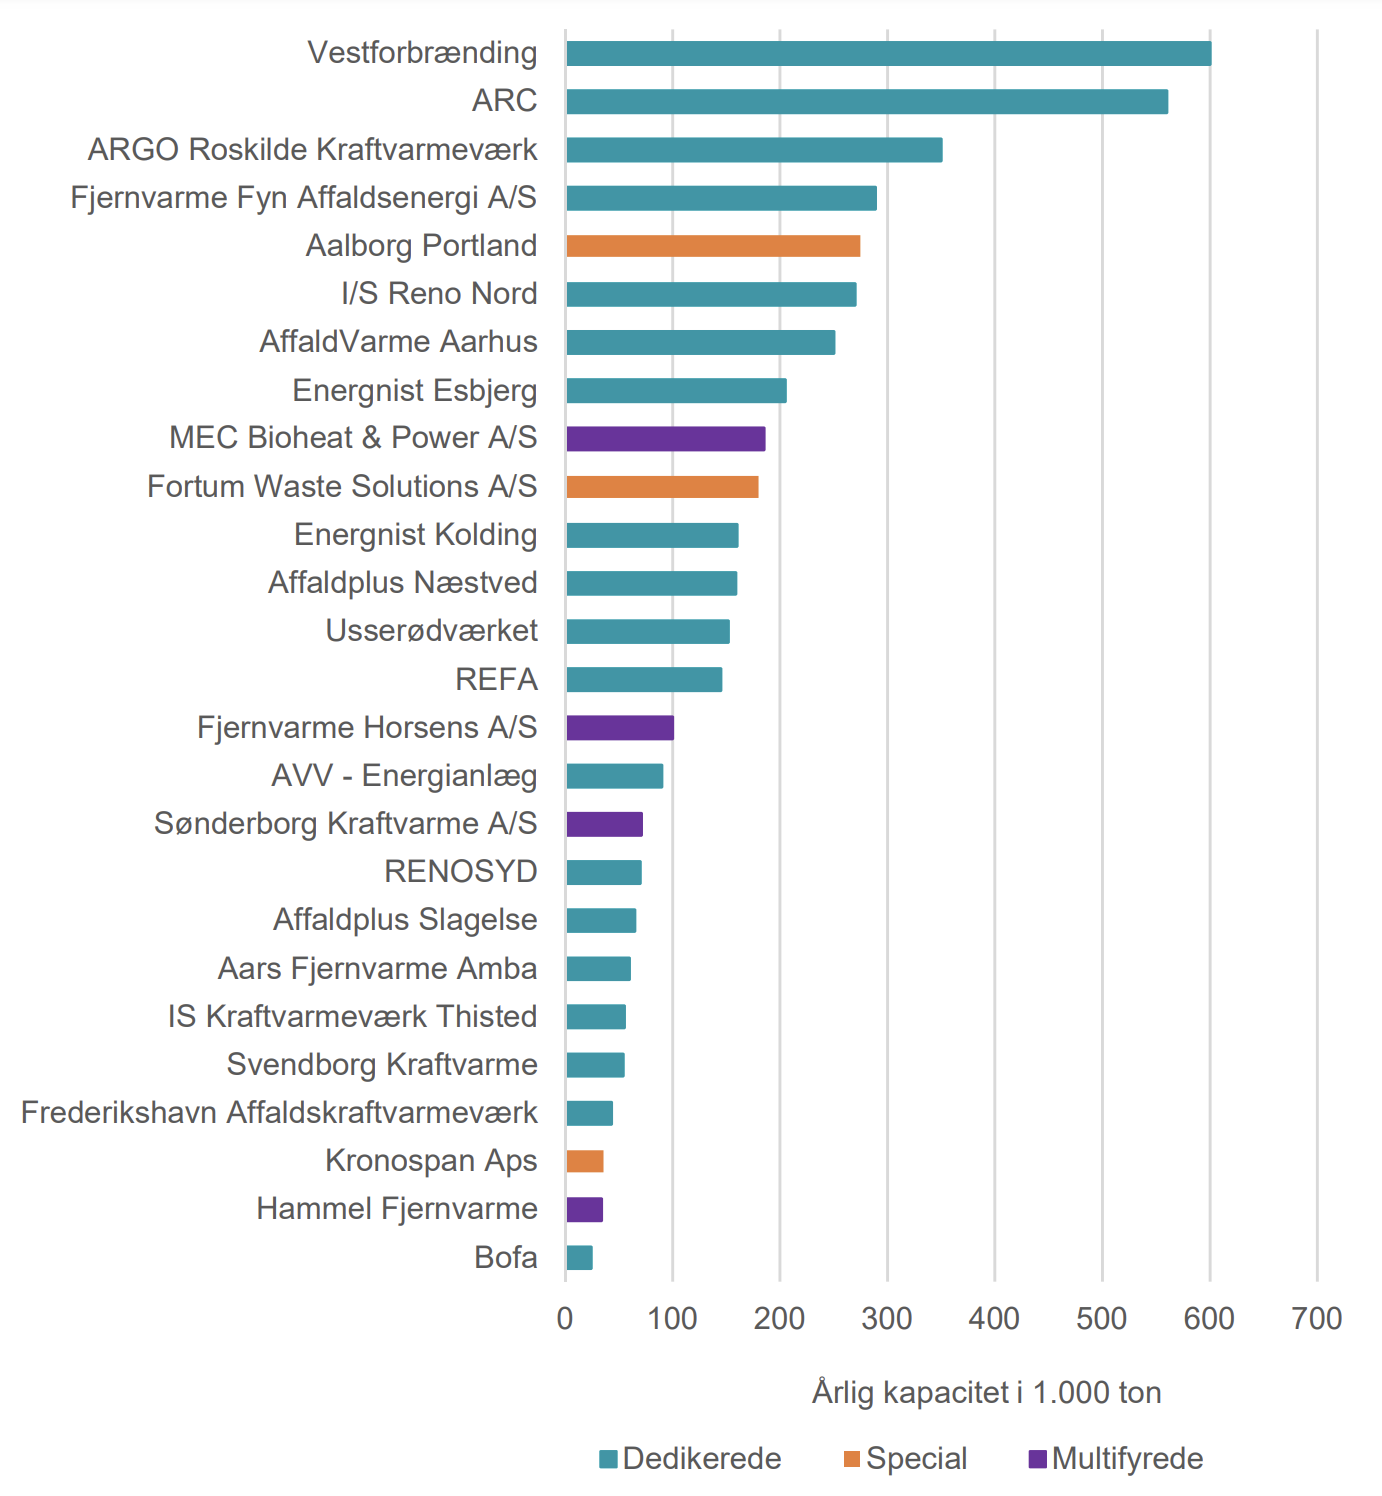
Figure 11 Capacity of Denmark’s waste incineration plants in 2020 according to their environmental permits. Green: dedicated waste incineration plants, orange: special waste fractions, purple: multifuel
Benchmarking af affaldssektoren – Forbrænding, 2020, Energistyrelsen
The sector is a major contributor to the Danish energy system: in 2020, it covered 24% of the total heat input to the country’s district heating network and 4.3% of its electricity supply, see Figure 12 and Figure 13.
Figure 12 Heat supply from Danish waste incineration plants.
Figure 13 Electricity supply from Danish waste incineration plants.
Fossil CO2 emissions (CO2eq.) were 1.6 Mtons in 2019. Biogenic emissions were higher (ca 2.2–2.3 Mtons CO2),
Benchmarking af affaldssektoren – Forbrænding, 2020, Energistyrelsen
Greenland
In Greenland, there are currently no centralized waste incineration units installed, but waste is taken care of locally either by incineration or landfill. In 2020, about 20 small scale incineration plants for handling non-hazardous waste have been in operation distributed among the five municipalities. In addition, more than 20 waste incineration plants not being in operation exist.
Affaldshandlingsplan 2020-2031, 2020, Departementet for Forskning og Miljø

Figure 14 Waste incineration units in Greenland (green – in operation, blue – not in operation, red – no unit at local community).
The Government of Greenland has developed a long-term waste management plan to improve the sector. Within that plan, the establishment of two larger centralized waste incineration plants is decided. The plants are to be built in Nuuk and Sisimiut with a total capacity of 140 tons per day and are planned to supply district heat locally. The plants are to be finished by 2023 and 2024, respectively.
https://esani.gl/ (accessed 2023-10-05)
There is little data available on the total amounts of waste generated in Greenland, an article from 2011 estimating it to about 50 000 tons.
Eisted, R., & Christensen, T. H. (2011). Waste management in Greenland: current situation and challenges. Waste Management & Research: The Journal for a Sustainable Circular Economy, 29(10), 1064–1070. https://doi.org/10.1177/0734242X10395421
Global Recycling (2021) Greenland – Waste Management on thin Ice, https://global-recycling.info/archives/5971
Faroe Islands
There are two waste incineration plants in operation on the Faroe Islands, taking care of the waste management for the 54 000 inhabitants. One plant in the capital of Tórshavn and another one in Leirvik, operated by the waste management company IRF and taking care of the waste from the remaining 28 municipalities. The plant in Leirvik incinerates about 25000 tons of waste per year and delivers heat to nearby industries in the range of 20 GWh, using about 20–30% of the heat generated. The waste incineration plant in Tórshavn incinerates about 17 000 tons of waste, supplying about 32 GWh of district heat. In total, about 42 000 tons of waste are incinerated, generating roughly 50 GWh of district heat, see Table 6.
Waste incineration is an important part of the waste management system on the Faroe Islands, avoiding transport by ship, the sludge and fly ash being disposed of locally on deposits as well. There also is a high level of awareness of the sustainability aspects in relation to waste handling, with Burðardygt Vinnulív (the Faroese Sustainable Business Initiative) having started a network of businesses working actively towards achieving the Sustainable Development Goals, thereby also addressing waste management.
Burðardygt Vinnulív, https://www.burdardygtvinnuliv.fo/ (accessed 2023-10-05)
2020 | 2021 | 2022 | ||
IRF - Leirvik | Waste incinerated [tons] | 24 728 | 25 080 | 23 378 |
Heat generated [MWh] | 73 596 | 70 352 | 66 578 | |
District heat delivered [MWh] | 16 389 | 14 765 | 20 545 | |
Tórshavn | Waste incinerated [tons] | 17 361 | 16 812 | 15 871 |
District heat delivered [MWh] | 32 000 | 32 000 | 32 000 |
Table 6 Waste incinerated and district heat delivered in the plants on Faroe Island.
Irf (2023) Ársfrásøgn 2022 (Annual report 2022), available at https://irf.fo/arsfragreidingar/
Kommunala Brennistøðin, https://www.torshavn.fo/um-kommununa/fakta-og-bygnadur/politiskur-og-fyrisitingarligur-bygnadur/kommunala-brennistoedin (accessed 2023-10-05)
Umhvørvisstovan – Faroese Environment Agency https://www.us.fo/
1.4.2 Near-term trends
In the period until 2035, Energistyrelsen projects a steep decline of the amount of waste being incinerated – caused by a decrease of available incineration capacity and a changed composition of waste (i.e., lower plastic content and heating value) due to higher sorting efficiency and less import.

Figure 15 Historic and projected CO2eq emissions from waste incineration in Denmark
In line with the above-mentioned goal, the Danish government has also recently passed a law to adjust the waste incineration capacity by introducing a tender-based model, forcing the waste incineration plants to compete for waste.
https://avfall2resurs.se/2023/06/19/den-danska-forbranningspolitiken-ar-idioti/ (accessed 2023-12-07)
Another interesting example on a local island level is Bornholm, having established a vision of being an island without waste by the year 2032.
Bornholm showing the way – without waste 2032, https://bofa.dk/wp-content/uploads/2019/01/BOFA_mini-publikation_UK_A4_160119.pdf
Concerning CCS, the Danish government recently awarded storage licenses for 13 Mton carbon per year to be filled in 2030,
1.5 Iceland
1.5.1 Capacity, energy generation and emissions
Iceland has one waste incineration plant – the Kalka plant – which, according to its environmental permit, is allowed to incinerate 25 ktons of waste per year. According to Iceland’s 5th biennial report to the UNFCCC emissions from waste incineration were 6 ktons CO2eq. in 2020. At full capacity, the Kalka plant emits about 14 ktons per year CO2eq.
1.5.2 Near-term trends
According to Iceland’s 5th biennial report to the UNFCCC, no expansion of the country’s waste incineration sector is expected.
1.5.3 Technology developments and pilots
Carbon Centric will install a carbon capture plant at the Kalka waste incinerator.
1.6 The overall picture for the Nordics

Figure 16 Overview of locations of waste incineration plants in the Nordics (own data collection visualized in Google maps).
As was mentioned in the introduction, the waste incineration sector plays an important role for the Nordic countries’ energy systems. Comparing the different countries is not a trivial task – different definitions of what waste is, how and by whom it is collected, and which waste should be incinerated make comparisons over longer time periods and countries difficult. In this section, data from Eurostat, the European Statistical Office, is used. Due to the reporting procedure and requirements,
A decrease in landfill can be observed historically in all analyzed countries, meaning that almost no organic waste is disposed of in that way anymore. Instead, both recycling – at first, biodegradable waste to composting, followed by plastics, paper, metal and other recyclable materials – and waste incineration have grown more and more important. Figure 17 to Figure 19 show the incinerated volumes of waste and the generation of heat and power from the sector.
Figure 17 Total waste incineration volumes in the Nordic countries. Numbers exclude industrial renewable waste.
Especially for district heating, waste incineration delivers important baseload capacity and covers 7% (Finland) to 43% (Norway) of the total heating energy demand.
Figure 18 Heat generation from waste incineration to the district heating networks for Sweden, Norway, Denmark and Finland.
Concerning electricity production, other power sources dominate in the Nordic countries. However, waste incineration generates around 1–4% of the total electricity supply while contributing to grid stability due to their constructive layout using turbines with high inertia, a trait they share with other heat-to-power technologies.
Figure 19 Power generation from waste incineration for Sweden, Norway, Denmark and Finland.