Global Rules Scenario
A set of far-reaching policies across the plastic lifecycle could reduce annual mismanaged plastics by 90% and annual virgin plastic production by 30% by 2040 relative to 2019 levels – equivalent to a 95% reduction in annual mismanaged plastics and a 60% reduction in annual virgin plastic production relative to the Business-as-Usual Scenario.
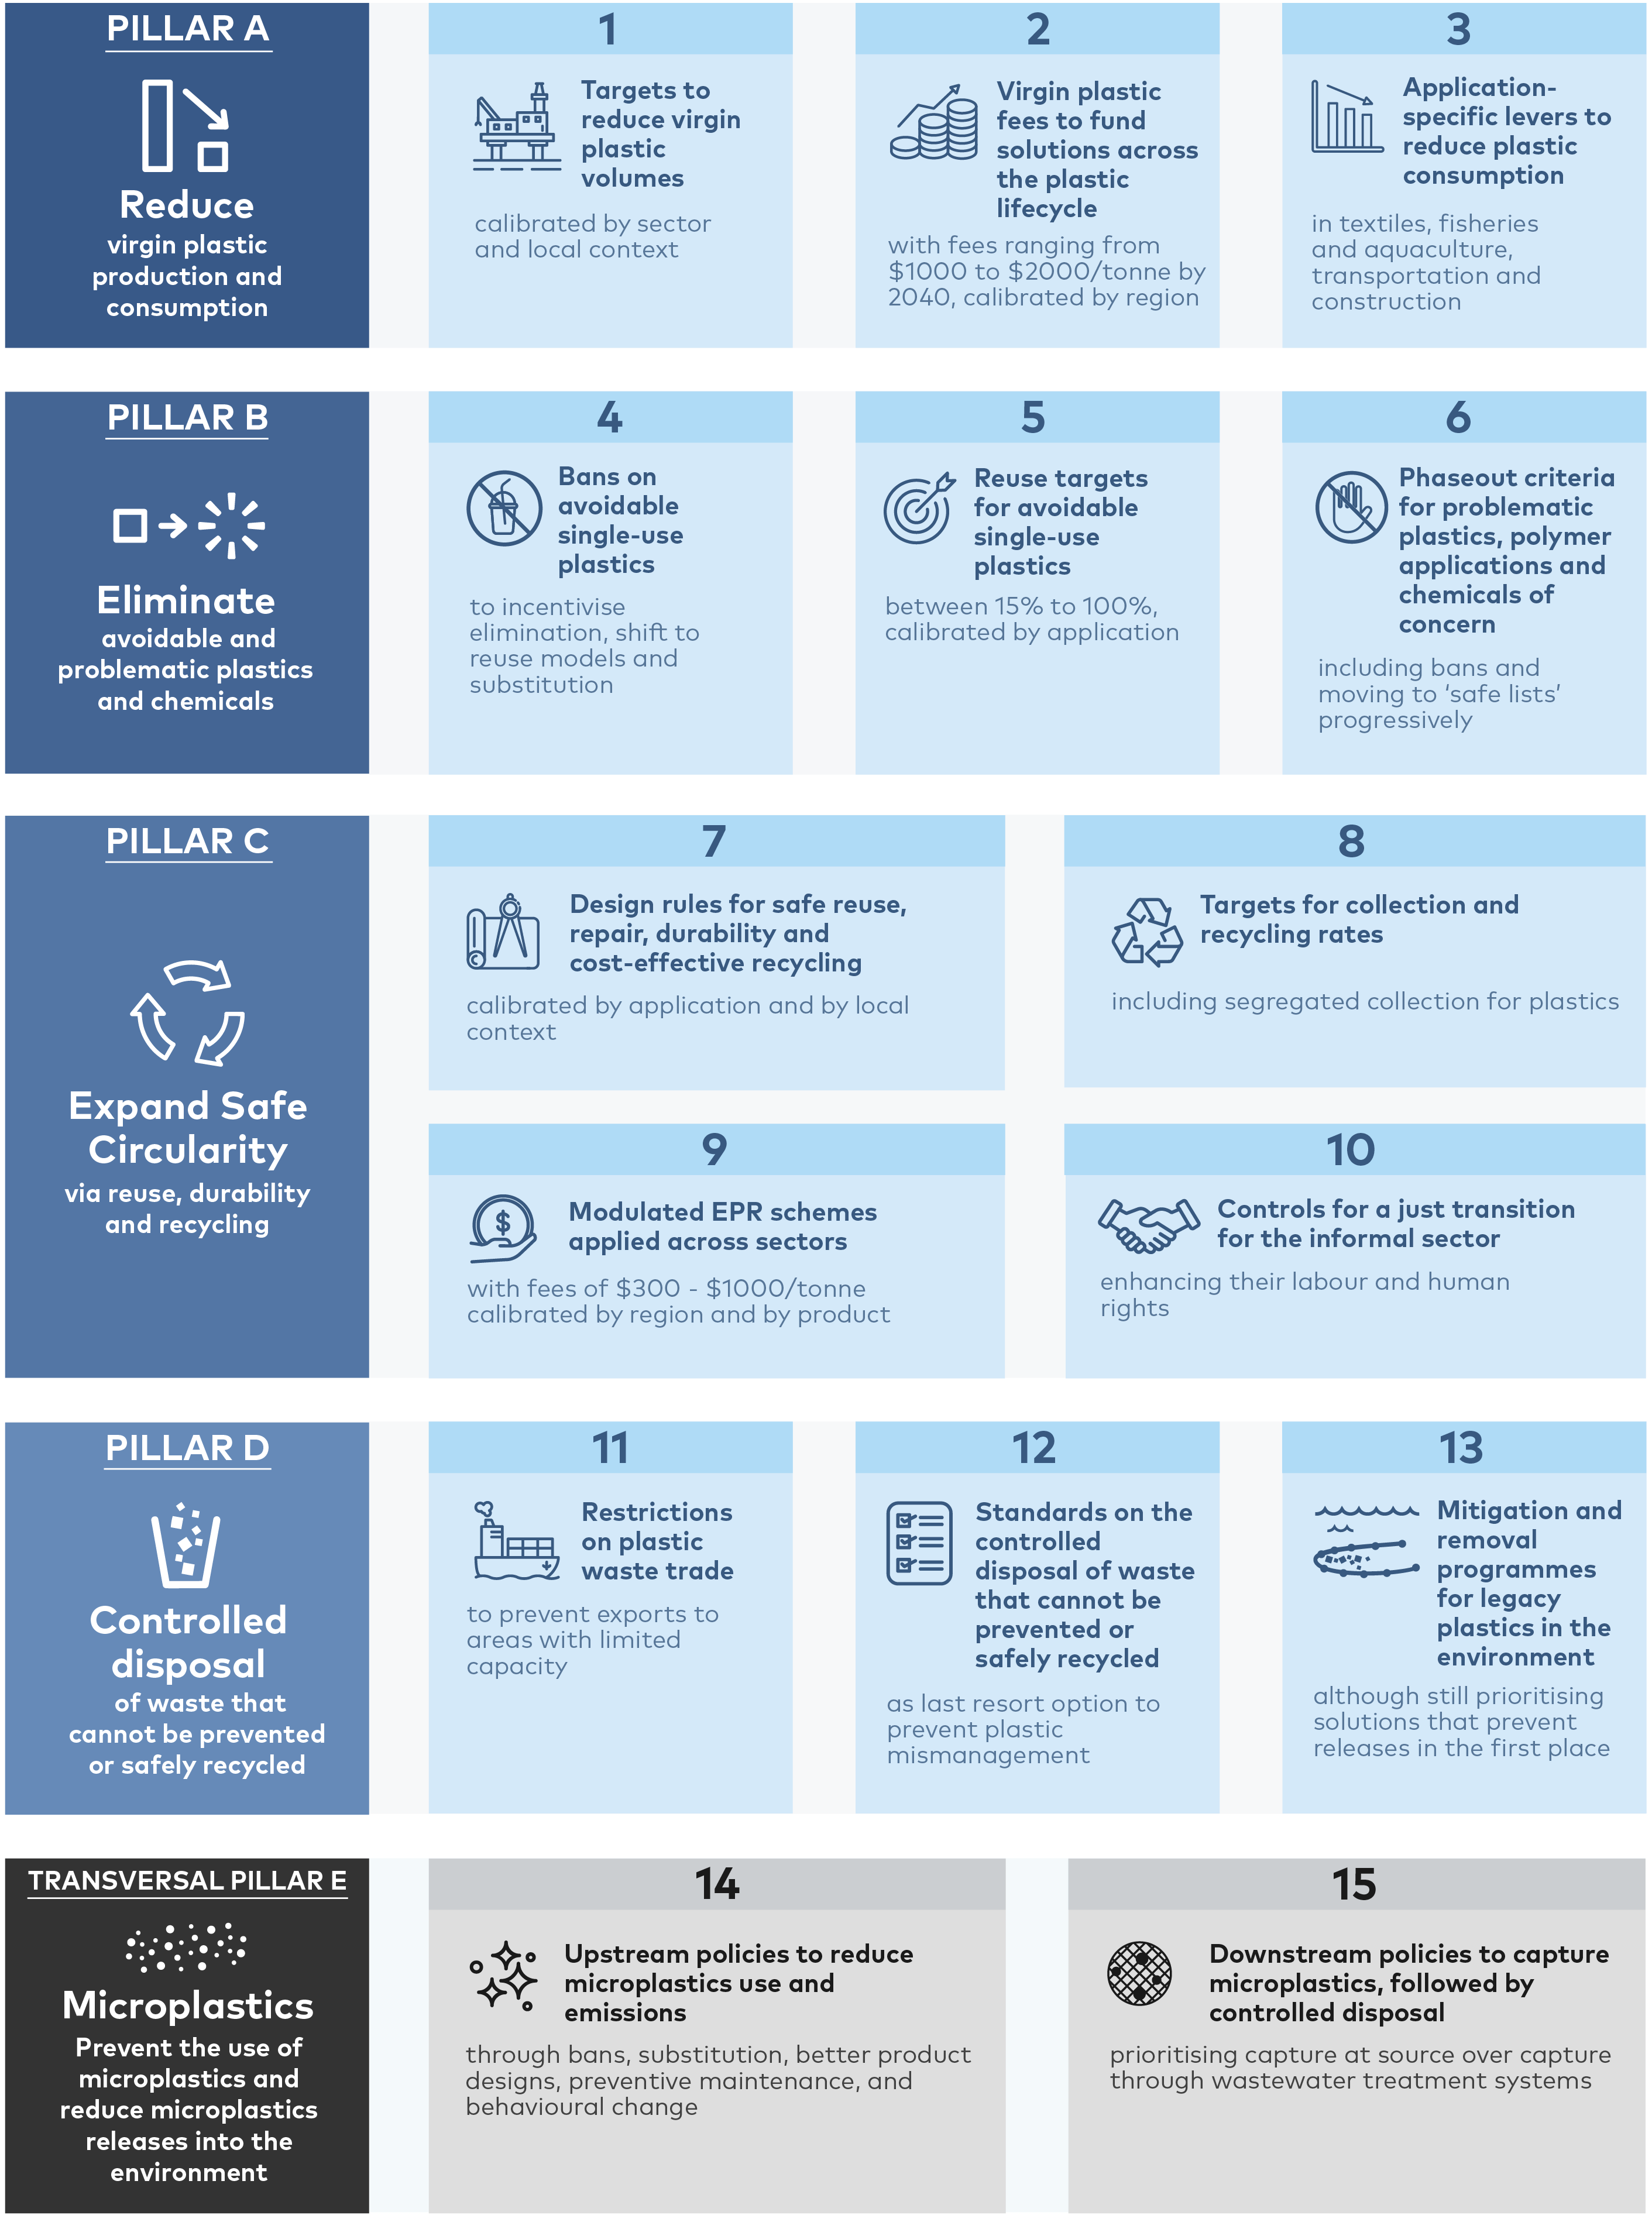
The Global Rules Scenario seeks to define and estimate the impact of a package of far-reaching policies that, if implemented concurrently across all jurisdictions, could minimise mismanaged plastics and microplastic emissions by 2040, while also mitigating GHG emissions. The Global Rules Scenario is not the only possible package that could achieve a similar outcome. The mechanics of the model estimate the combined effect of 15 policy interventions on plastic stocks and flows across the value chain, as well as on GHG emissions, costs and employment. Importantly, efforts are needed across the plastic lifecycle, with policies mutually reinforcing each other – for example, the redesign of plastics is critical to enable a high-value recycling economy.
The Global Rules Scenario would reduce plastic volumes in the system; eliminate avoidable single-use plastic applications; expand circularity via safe reuse, recycling and durability; and facilitate the controlled disposal of waste that cannot be prevented or recycled.
The package of policies selected draws on submissions from UN member states and other organisations ahead of INC-2, interviews and open consultations. The Global Rules Scenario includes 15 policy interventions to be implemented globally and concurrently, grouped under five pillars (See Figure 7). This report’s approach to determining the scale of each pillar is discussed later in the report (see Box 5).
FIGURE 7
15 policy interventions in the Global Rules Scenario
The Global Rules Scenario would result in a 30% reduction in annual virgin plastic production relative to 2019 levels – equivalent to a 60% reduction by 2040 relative to the Business-as-Usual Scenario.
The Global Rules Scenario estimates the impact of all policy interventions in Figure 7 on the annual production of virgin plastics, resulting in the levels of reduction displayed in Figure 8. When looking at total plastic production and consumption (both recycled and virgin plastics), the Global Rules Scenario would result in an increase of 9% in 2040 relative to 2019 levels (with a significant increase in the share of recycled plastics). This is due to the fact that in some regions and sectors, the expected growth in population and consumption would outpace the impact of reduction and elimination policies.
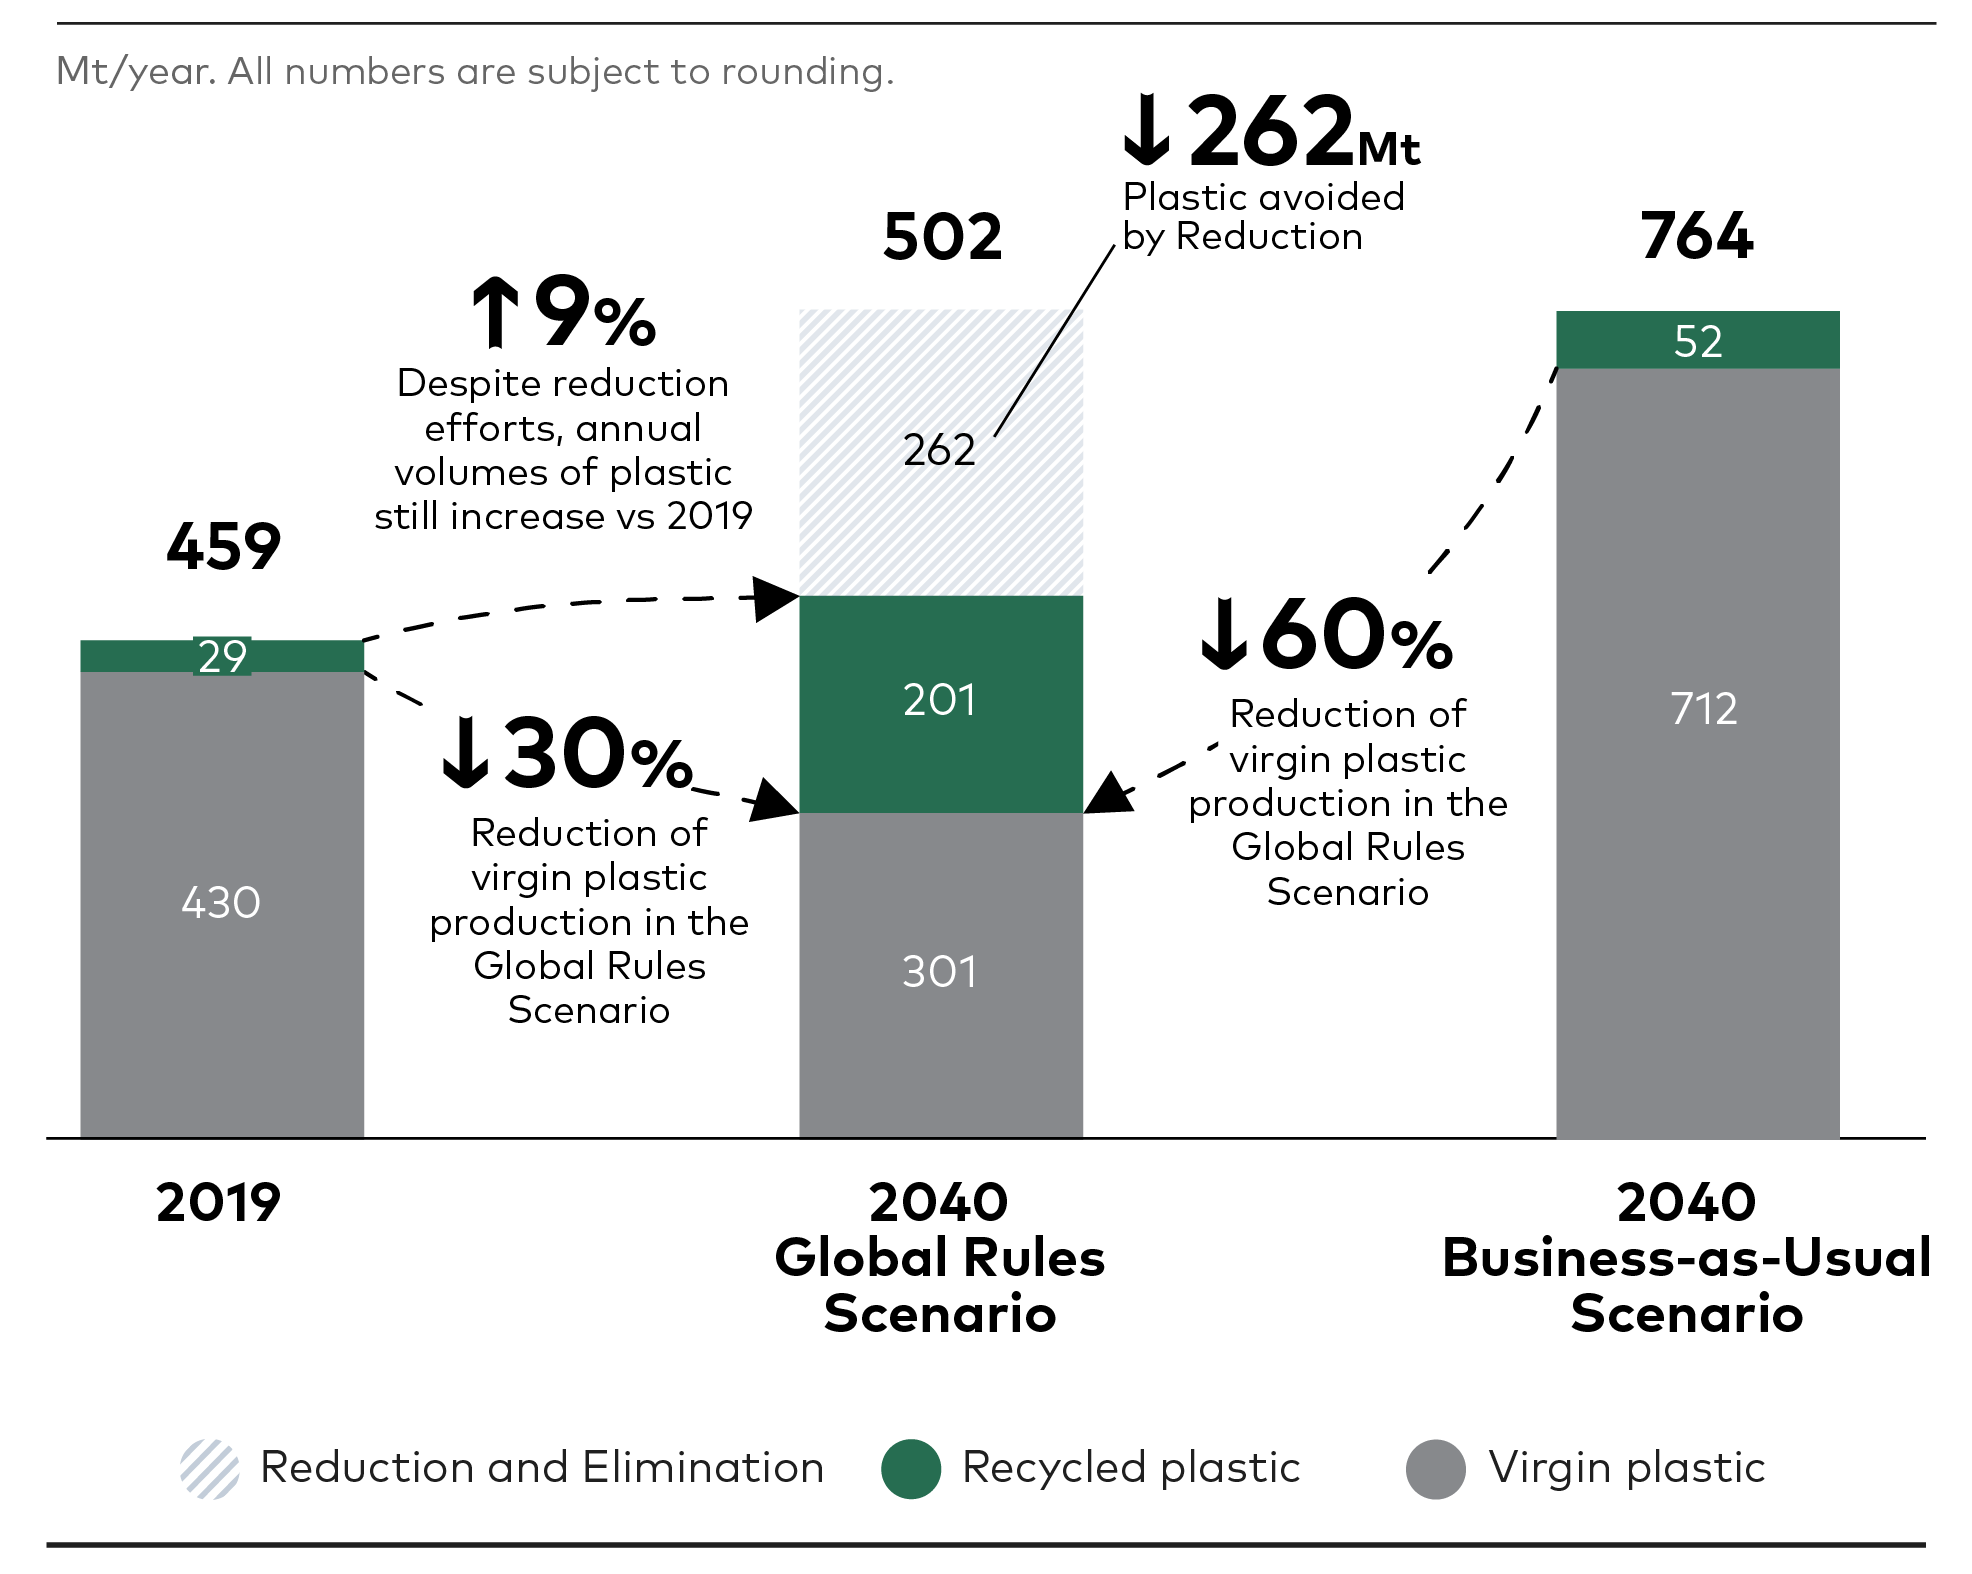
FIGURE 8
Annual plastic production under the Business-as-Usual and Global Rules Scenarios
The Global Rules Scenario would result in a 30% reduction in annual virgin plastic production by 2040 relative to 2019 levels.
The Global Rules Scenario would result in a 90% reduction in annual mismanaged plastic volumes relative to 2019 levels – equivalent to a 95% reduction by 2040 relative to the Business-as-Usual Scenario.
The drop in annual mismanaged plastic volumes would be driven by reduced production and consumption and increased circularity (via design, safe reuse and recycling), with scaled controlled disposal where necessary for waste that could not be prevented or safely recycled. In the Global Rules Scenario, the reduction in plastic production and consumption outlined above would prevent 184 Mt of plastic waste annually by 2040. Moreover, as collection and sorting increased, more feedstock would become available for recycling; and scaling capacity would also be incentivised through recycling targets and fees on virgin plastics. Recycling output in the Global Rules Scenario would grow from 29 Mt in 2019 to 201 Mt by 2040 (187 Mt via mechanical recycling and 14 Mt via chemical recycling). Mechanical recycling is prioritised over chemical recycling – the latter would be used only for a few limited types of waste that cannot be processed through mechanical recycling (see Box 4).
Despite all efforts and policies to reduce waste and increase circularity, the Global Rules Scenario would still result in significant volumes of plastic waste that cannot be either prevented or recycled.
Due to solutions not scaling in time or being outpaced by population and economic growth; and due to plastic waste from applications with long lifespans that are already in use or designs that hinder recycling.
This notwithstanding, 13 Mt of plastic volumes would still end up being mismanaged annually by 2040; an estimated 4 Mt would end up in dumpsites, 2 Mt burned in the open and 7 Mt released into land and water environments. Out of these 7 Mt, microplastics would represent 5 Mt. Figure 9 shows the end-of-life fate of plastic waste by 2040, comparing the Business-as-Usual Scenario and the Global Rules Scenario, as well as relative to 2019 levels.
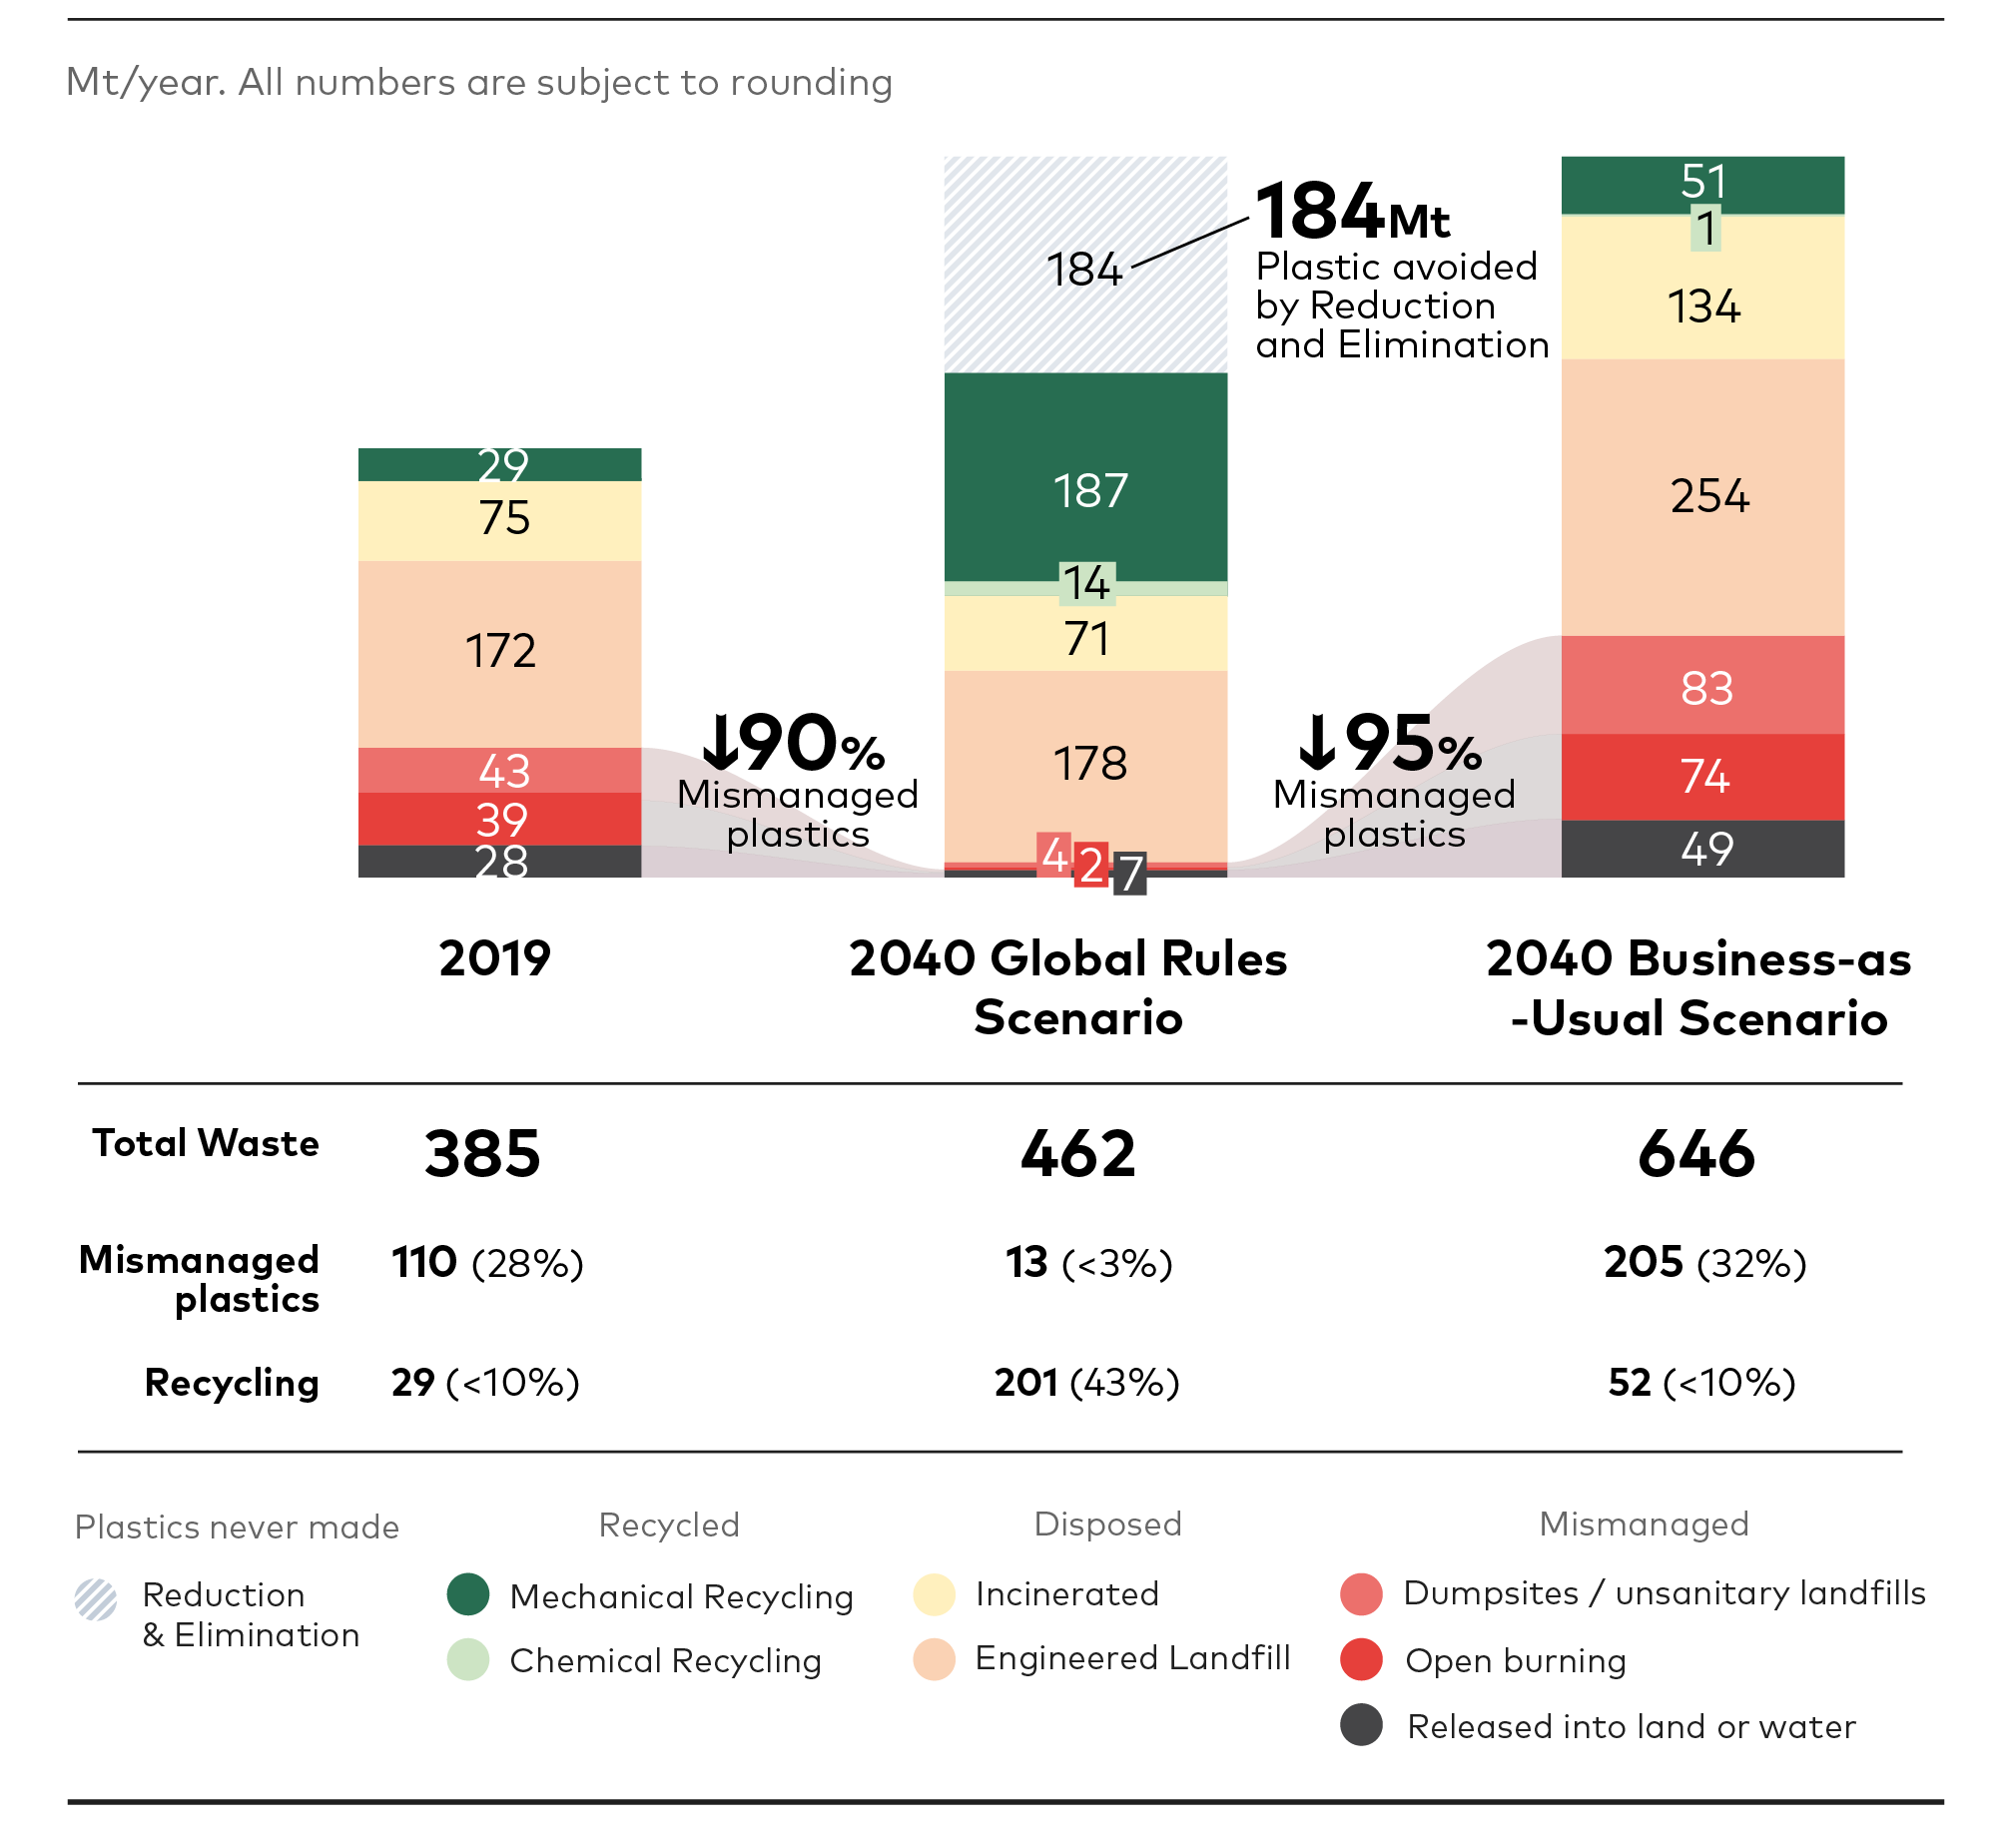
FIGURE 9
End of Life fate of plastic waste in 2019 and 2040 in the Business-as-Usual and Global Rules Scenario
The Global Rules Scenario would result in a 90% reduction in annual mismanaged plastic volumes relative to 2019 levels
The current trajectory could see annual volumes of mismanaged plastic almost double by 2040 relative to 2019 levels
The Global Rules Scenario would result in estimated GHG emissions of 1.9 GtCO2e per year by 2040 – an equivalent level to 2019 (1.9 GtCO2e per year), but representing a reduction in emissions from the global plastic system of 40% relative to 2040 levels in the Business-as-Usual Scenario (3.1 GtCO2e per year) as shown in figure 10. This would be driven mainly by a decline in virgin plastic production due to reduction, elimination and recycling. The Global Rules Scenario would thus not be aligned with the Paris Climate Agreement, so further reduction of virgin plastics production and additional decarbonisation levers would be needed beyond the Global Rules Scenario.
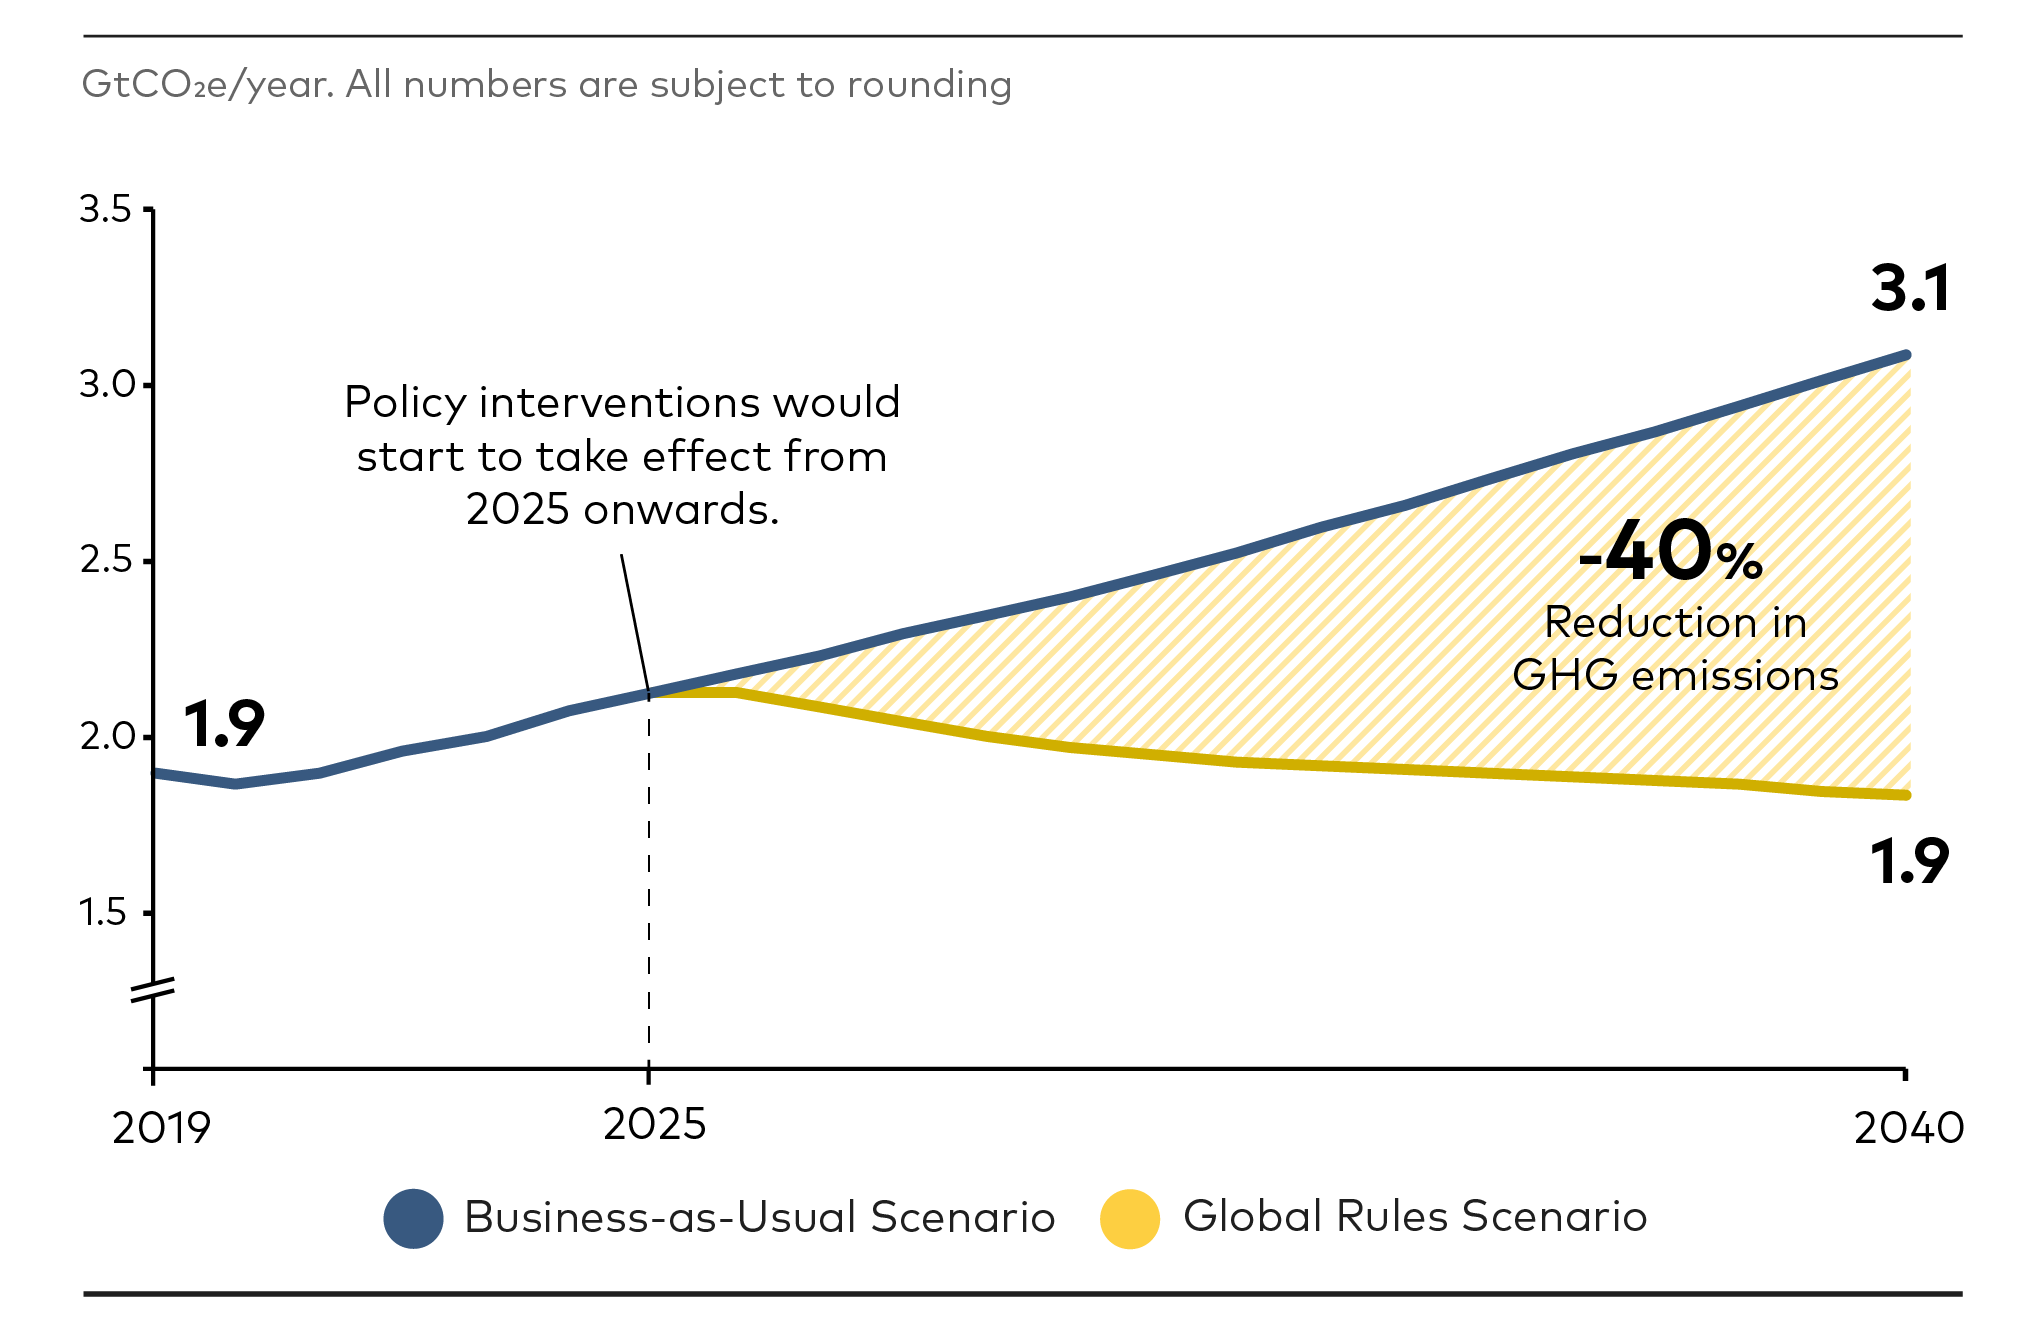
FIGURE 10
GHG emissions from the plastic system under the Business-as-Usual Scenario
The current trajectory could lead to a 63% increase in annual emissions from the plastic system
The following sections explain the impacts of the policies set out in the Global Rules Scenario, and the key learnings and considerations for their implementation.

PILLAR A
Reduce
virgin plastic production and consumption
Previous studies have highlighted that it is essential to reduce virgin plastic production and consumption in order to solve the problem of mismanaged plastics.
The Pew Charitable Trusts and Systemiq. (2020). Breaking the Plastic Wave: A Comprehensive Assessment of Pathways Towards Stopping Ocean Plastic Pollution.
OECD. (2022). Global Plastics Outlook: Economic Drivers, Environmental Impacts and Policy Options
Persson L., et al. (2022). Outside the Safe Operating Space of the Planetary Boundary for Novel Entities.
International Energy Agency. (2018). The Future of Petrochemicals Towards more sustainable plastics and fertilisers.
Recognising that plastics have valuable uses in many sectors, the analytical approach adopted in this report assesses virgin plastic reduction opportunities against key environmental and social constraints. After applying these constraints, the overall reduction in virgin plastic volumes in the Global Rules Scenario would be 30% relative to 2019 levels and 60% by 2040 relative to the Business-as-Usual Scenario, as result from the implementation of all policies listed in Figure 7. To estimate the opportunity for plastic reduction or substitution in specific applications without creating unintended consequences, the report leverages previous analyses on technological, financial and behavioural constraints – for example, in relation to municipal solid waste plastics
The Pew Charitable Trusts and Systemiq. (2020). Breaking the Plastic Wave: A Comprehensive Assessment of Pathways Towards Stopping Ocean Plastic Pollution.
ODI. (2020). Phasing out plastics.
The policy interventions in Pillar A include virgin plastic reduction targets, which would seek to reduce virgin plastic consumption and hence demand for production; virgin plastic fees to further disincentivise the use of plastics; and application-specific policies to reduce consumption, including substitution mandates, policies to reduce fishing gear losses and bans on the disposal of overproduced textile stock, among other things. The Global Rules Scenario assumes the implementation of policies to reduce demand for plastics across all sectors of the economy. The analysis suggests that without a significant reduction in consumption, it is unlikely that the problem of mismanaged plastic volumes could be resolved by 2040.
Reducing virgin plastic volumes is essential to reduce waste management infrastructure and reduce GHG emissions

Policy Intervention 1
Targets to reduce virgin plastic volumes
calibrated by sector and local contexts
Virgin plastic reduction targets would send a strong signal to industry regarding the level of change needed. The reduction in virgin plastic volumes that could be achieved in the Global Rules Scenario would vary significantly by geography. The largest reductions would be required in regions that are predominantly composed of high-income economies (ie, Europe, the USA and Canada, Japan, the Republic of Korea and Oceania). In these regions, the Global Rules Scenario would result in a reduction in virgin plastic volumes of 51% to 63% relative to 2019 levels – equivalent to a 65% to 73% reduction by 2040 relative to the Business-as-Usual Scenario. These regions already have high consumption and low demographic/economic growth. They also have advanced infrastructure that would allow for greater avoidance of plastics, greater scaling of reuse models (and the reverse logistics involved), and better controls to avoid regrettable substitutions (eg, sustainable sourcing of safe alternative materials).
The projections differ for other regions, such as China and upper-middle-income countries in Central and South America and the Caribbean. In these regions, economic growth, and therefore consumption per capita, are forecast to increase – especially for applications such as textiles and durables; although demographic growth will be limited. The Global Rules Scenario would result in a reduction in virgin plastic volumes by 2040 in these regions of 36% to 39% relative to 2019 levels – equivalent to a 60% reduction by 2040 relative to the Business-as-Usual Scenario. These regions have important differences when it comes to urban and rural regions, with urban areas having more advanced infrastructure to accommodate reduction levers (eg, reuse models).
Finally, regions such as India, South and Southeast Asia and Africa and the Middle East are forecasted to have high relative economic and consumption per capita growth, starting from low levels today. High demographic growth is also expected. Low and middle-income countries in these regions face greater challenges in scaling reduction levers: for example, the lack of advanced water supply systems in some areas could hinder the scale of safe reuse and refill models; and small single-use sachets cannot easily be banned given the strong reliance on day-to-day purchasing and consumption in low-income households. Given this economic and demographic growth, and the challenges of reducing plastics without creating negative social impacts, these regions would see plastic consumption increase relative to 2019 levels in the Global Rules Scenario. In these regions, the Global Rules Scenario would result in an increase in virgin plastic consumption of 8% to 57% relative to 2019 levels – equivalent to a 38% to 48% reduction by 2040 relative to the Business-as-Usual Scenario.
The reduction in virgin plastic consumption would also vary by sector and application, depending on multiple factors. The model behind this analysis considers the projected growth for a specific sector or application; the available (or potential) alternatives to plastic – whether alternative materials with better environmental performance or other models (eg, safe reuse, repair and the use of recycled content); the capacity to change designs to reduce plastic use; and the requisite product characteristics (eg, barriers, resistance, flexibility).
High-income economies, with high levels of consumption, would require a larger reduction in plastic volumes
Governments would set binding targets on virgin plastic reduction as part of their environmental strategies
To implement this policy intervention, national governments would set national targets for virgin plastic reduction as part of their plastic, industrial or environmental strategies. As an example, reduction targets of 15% to 20% by 2040 for plastic waste generation per capita are currently under discussion in the European Union.
European Parliament. (2023). Revision of the Packaging and Packaging Waste Directive.
The required reduction could be aggregated to a global target, to signal the level of action required and communicate it under a single objective.

Policy Intervention 2
Virgin plastic fees to fund solutions across the plastic lifecycle
with fees ranging from $1000 to $2000 /tonne by 2040, calibrated by region
A virgin plastic fee would impose a charge on virgin plastics at a specific stage of the plastic lifecycle. In the Global Rules Scenario, this fee would be applied at the national level – most likely to national plastic producers (if the country produces plastic) and importers of products containing virgin plastic. The fee would have two main objectives. First, it would aim to discourage virgin plastic use and promote new business models, the use of substitute materials and/or recycled plastics. Virgin plastic fees represent an opportunity to level the playing field with other materials and models by internalising plastic’s economic externalities (environmental and human health impacts). Second, the fee would raise significant funds that could be reinvested in solutions across the plastic lifecycle. This could be accomplished by establishing national or regional funds to collect and invest such resources.
In theory, a virgin plastic fee could reduce plastic demand over time; however, the analysis found no publicly available data to provide estimates. Therefore, the model behind this analysis does not assume any impact on plastic demand from the application of a virgin plastic fee, even though this may be the case in reality. However, when applying fees to virgin plastics, the model does assume that recycled plastics will gain market share over time. Empirical evidence indicates that the market share of recycled plastics may grow at the expense of virgin plastics,
Ellen MacArthur Foundation. (2022). The Global Commitment 2022.
USA Plastic Pact. (2021). Problematic and Unnecessary Materials Report.
National Association for PET Container Resources. (2021). 2021 PET Recycling Report.
Independent Commodity Intelligence Services. (2022). US R-PET and PET Prices Database.
When applying a virgin plastic fee, the main questions to consider include the following:
- Should the fee apply to virgin plastic only, or also to recycled content? The Global Rules Scenario would apply the fee to virgin plastic only, rather than all plastic, to increase circularity while also raising funds for solutions across the plastic lifecycle.
- What part of the value chain should pay the fee? If the fee were applied only to producers, fewer companies would fall under its scope, thus reducing the complexity of policy implementation. However, implementing the fee further downstream (eg, on converters and/or companies that sell plastic products) would allow for modulation (ie, the imposition of a higher fee for more problematic plastics).
- What should be the fee level and should it change over time? Table 1 sets out the fees in the Global Rules Scenario, which are differentiated by region and would increase progressively. The model leverages ranges from the OECD’s Global Ambition Scenario in its Global Plastics Outlook: Policy Scenarios to 2060, adapted to a 2040 timeline and with some modifications. The Global Rules Scenario assumes the application of this fee to virgin plastic.
Virgin plastic fees can level the playing field by internalising plastic’s economic externalities
Region | Virgin plastic fee considered | |
By 2030 | By 2040 | |
Europe, the USA and Canada, Japan, the Republic of Korea, Oceania | US$1,000/ton | US$2,000/ton |
China, Central/South America and the Caribbean | US$750/ton | US$1,500/ton |
India, Eurasia, South and Southeast Asia, Africa, the Middle East | US$500/ton | US$1,000/ton |
TABLE 1
Virgin plastic fee in the Global Rules Scenario
- What solutions should the funds raised be deployed towards? In the Global Rules Scenario, it is assumed that the funds would be invested nationally across the value chain, including in new business models (eg, reuse), changes in design, infrastructure, sorting and controlled disposal. To simulate this, the model compares the revenues raised against the investment and operational costs of different solutions (eg, the cost of scaling collection systems) to estimate the impact of this policy in each region and the increased capacity of these solutions.
Before implementing these policies, local studies should be conducted to determine the right level of fees to impose. There are concerns that raising the cost of virgin plastic could increase consumer prices. In high-income regions, costs passed on to consumers may not have a major impact. However, in low and middle-income regions, this unintended consequence should be monitored and ideally prevented. For example, a US$1,000 fee per tonne of virgin plastic would translate into an incremental cost of 2.5 cents for a 500-millilitre PET bottle. When applied to the retail price of a top-selling soft drink, this would increase retail prices by 1% in the UK and by 6% in Indonesia.
One 500-millilitre PET bottle can include 25 grams (g) of PET plastic. A fee of US$1,000 per tonne applied to 25g would translate to an incremental cost of 2.5 cents. The average retail price for a top-selling 500ml PET bottle of soft drink in 2022 was US$2 in the UK and US$0.39 in Indonesia.
Globalproductprices. (2023). Retrieved from https://www.globalproductprices.com/
Globalproductprices. (2023). Retrieved from https://www.globalproductprices.com/
There are few existing instances of virgin plastic fees, particularly for packaging producers. Examples include Spain’s plastic packaging tax, introduced in 2023 and applicable to virgin plastic (€450 per tonne of plastic);
Ministerio de Hacienda y Funcion Publica, España. (2023). Base Imponible, tipo impositivo y cuota tributaria
UK Government. (2022). The Plastic Packaging Tax (General) Regulations 2022.
Parliament of the Republic of Ghana. (2013). 863 Act to amend the Customs and Excise (Duties and Other Taxes).
Policy Intervention 3
Application-specific levers to reduce plastic consumption
in textiles, aquaculture, transport and construction
This section focuses on policies to reduce plastic volumes in specific sectors. For each sector, multiple policies are assumed in aggregation, combined with other policies in the Global Rules Scenario such as design rules that would enhance durability. Although there is an overlap with other policies and pillars, these policies are presented separated as they cover sector transformations such as eliminating overstocks in textiles and shared mobility in transport.
Policy interventions could be applied to specific applications in order to reduce plastic use (and hence production), resulting in plastic being eliminated, reduced or replaced by other materials. When introducing policies that could trigger the replacement of plastic with other materials, a comprehensive case-by-case analysis should be conducted that considers the local context, supply chains, viable substitutes and climate impacts, to avoid unintended consequences. To this end, best practice is to conduct product LCAs, to demonstrate that the alternatives will improve overall environmental, health and social impacts. Alternative materials should ensure product safety as well as better collection and recycling rates, responsible sourcing, responsible waste management, no deforestation etc.

The textiles industry faces specific issues when it comes to plastic use. For instance, overproduction and overstock constitute a chronic problem in the industry, estimated to account for as much as 30% of the total volume of production.
Australian Circular Textile Association. (2021). THREAD TOGETHER - A socially equitable solution to fashion’s waste problem.
Ellen MacArthur Foundation. (2017). A new textiles economy: Redesigning fashion’s future.
Federal Association for Secondary Raw Materials and Waste Disposal. (2020). Demand, consumption, reuse and recycling of clothing and textiles in Germany.
ABC News. (2021). Dead white man’s clothes.
The Global Rules Scenario would include bans on the disposal of unsold items – from both overstock and returns – following the example of the EU Strategy for Sustainable and Circular Textiles.
European Commission. (2022). EU Strategy for Sustainable and Circular Textiles.
European Commission. (2023). ReSet the Trend.

Any loss of fishing gear generally translates in a direct release of plastic into the ocean, in addition to creating new demand to replace the lost gear. By preventing abandoned, lost and otherwise discarded fishing gear (ALDFG), production would decrease and negative impacts on wildlife and the environment would be reduced.
Intentional gear abandonment presents persistent challenges, particularly in lower and middle-income regions. Losses from intentional gear abandonment vary depending on the type of gear used, the attitude of the fishers and their willingness to recover lost gear. Gillnets, traps and pots are some of the most common types of ALDFG that contribute significantly to plastic releases into the ocean.
Global Ghost Gear Initiative. (2021). Best Practice Framework For The Management Of Fishing Gear.
FAO. (2019). Voluntary Guidelines on the Marking of Fishing Gear.
Additional efforts to combat the intentional discharge of rubbish and gear from ships at sea have been made through the International Maritime Organization and its MARPOL Annex V policy. However, the effective implementation of this policy may have been limited. A globally enforced and legally binding policy based on MARPOL and extended to smaller fishing vessels could support the effort to reduce the release of plastic from fishing gear into the environment.
Although some gear loss is inevitable during regular usage, several policies could help to prevent unintentional gear loss, such as reduced gear conflict, improved maintenance and the use of appropriate gear for prevailing weather conditions. One of the most common causes of gear loss – gear conflict and entanglement with other fishing or maritime equipment, or with the seabed (dolly ropes) – could be addressed through spatial and temporal fishing restrictions imposed by policies such as the EU Maritime Spatial Planning Directive and through the use of alternative materials or fishing methods.
Richardson K., et al. (2018). Understanding causes of gear loss provides a sound basis for fisheries management.
FAO. (2019). Voluntary Guidelines on the Marking of Fishing Gear.
Global Ghost Gear Initiative. (2021). Best Practice Framework For The Management Of Fishing Gear.
To maximise the likelihood of success of these policies, support should be provided to fishers during this transition through awareness campaigns and education programmes on best practices and policies.
By including policies to reduce unintentional gear losses and prevent intentional gear abandonment, the Global Rules Scenario assumes a reduction of 40% in annualplastics demand from fisheries and aquaculture by 2040relative to the Business-as-Usual Scenario. The analysis also considers ratios of gear losses
Richardson K. et al. (2022). Global estimates of fishing gear lost to the ocean each year.

The ODI’s Phasing Out Plastics report analysed how much plastic could be substituted by changing construction designs by 2050.
ODI. (2020). Phasing out plastics: The construction sector.
The ODI’s analysis highlights that the improved impacts presented by alternative materials would result from longer product lifespans and lower whole-life costs. These substitutions would have to be assessed on a case-by-case basis to avoid unintended consequences or regrettable substitutions. Best practice would be to conduct product LCAs to demonstrate that the alternatives would improve overall environmental, health and social impacts.
The Global Rules Scenario considers a partial realisation of these estimates by 2040, assuming a 40% reduction in annual plastic demand from the construction sector relative to the Business-as-Usual Scenario. To encourage renovation and refurbishment, governments and municipalities could implement urban planning practices that promote compact cities which reduce demand for plastic materials per building unit. Governments could also restrict developers’ choice of building materials. The ODI report Phasing Out Plastics suggests that sustainability certification schemes and public procurement policies could pave the way towards the implementation of these changes.

The ODI’s Phasing Out Plastics report also analysed how much plastic could be substituted by changing the design of automotive products by 2050.
ODI. (2020). Phasing out plastics: The automotive sector.
By incentivising the adoption of ridesharing, car-sharing, mobility-as-a-service and managed fleets of shared vehicles, governments could encourage increased vehicle utilisation, occupancy and lifespan, and thus a reduction in total cars sold by 2040 compared with the ODI’s business-as-usual scenario, resulting in lower demand for plastics. The Global Rules Scenario considers a partial realisation of these estimates by 2040, assuming a 10% reduction in annual plastic demand from the transportation sector relative to the Business-as-Usual Scenario. The substitution of plastics in the transportation sector is not considered, as plastics may be needed for light-weighting and innovative vehicle design.
PILLAR B
Eliminate
avoidable and problematic plastics and chemicals
While Pillar A focused on reducing plastic consumption, particularly of virgin plastic, Pillar B focuses on eliminating avoidable or unnecessary plastic, and phasing out problematic plastic products, polymers and chemicals of concern. Defining ‘avoidable’, ‘unnecessary’ and ‘problematic’ is complex, as there are millions of plastic products that trade internationally. For this reason, the first step would be to establish globally accepted criteria for defining these terms. There are already some high-level directions on what these criteria should focus on, with this report considering the criteria displayed in Box 3 below.
Box 3:
Defining ‘avoidable’, ‘unnecessary’ and ‘problematic’ plastics
These would include plastic or plastic products that meet any of these points:
- They contain hazardous chemicals or create hazardous conditions that pose a risk to human health or the environment (applying the precautionary principle) during their production, use or waste management.
- Their use can be avoided (or replaced by a reuse model or materials with better sustainability performance) while maintaining utility, with a focus on single-use applications.
- They are not reusable or recyclable.
- They hinder or disrupt the circularity of other items.
- They have a high likelihood of ending up as litter or in the natural environment.
Alternative materials to replace plastic should be assessed towards equivalent criteria. (Adapted from the Ellen MacArthur Foundation’s Global Commitment Criteria.
Ellen MacArthur Foundation. (2020). New Plastics Economy Global Commitment - Commitments, Vision and Definitions.
Global harmonization of the criteria would be required, to make it effective in international markets. However, important regional and national differences must be taken into consideration when applying these criteria. In particular, it is important to differentiate by application, to ensure that any prohibition of a substance or format does not have unintended consequences from a social and environmental perspective. Criteria would therefore require scientific input and expertise from different local contexts. Based on the criteria, the focus would then be on elimination through bans and the gradual phaseout of problematic plastic products, polymer applications and chemicals of concern.
Pillar B addresses this through bans and reuse targets on avoidable single-use plastic, and through a phaseout criteria for problematic plastic products, polymer applications and chemicals of concern.

Policy Intervention 4
Bans on avoidable single-use plastics
to incentivise elimination, shift to reuse models and substitution
Avoidable or unnecessary plastics include ‘products that can currently be reduced or substituted with non-plastic fit-for-purpose substitutes and/or can be eliminated entirely without compromising the consumer’s access to the product, inability to meet health or safety regulations, or causing undesirable environmental outcomes’.
Raubenheimer, K., Urho, N. (2020). Possible elements of a new global agreement to prevent plastic pollution. Nordic Council of Ministers, Denmark, Copenhagen.
Environmental Investigation Agency (EIA). (2018). Unpacking nonconventional plastics.
In the Global Rules Scenario, a specific list of plastic applications is assumed to be in scope for these bans. As a starting point, the analysis includes bans on single-use plastic applications under the EU Single Use Plastic Directive,
European Parliament. (2019). Directive (EU) 2019/904 of the European Parliament and of the Council of 5 June 2019 on the reduction of the impact of certain plastic products on the environment.
The Pew Charitable Trusts and Systemiq. (2020). Breaking the Plastic Wave: A Comprehensive Assessment of Pathways Towards Stopping Ocean Plastic Pollution.
The Global Rules Scenario assumes the imposition of bans by 2040 on:
- food service disposables and food and beverage takeaway single-use plastic applications (eg, straws, stirrers; on-premises food service disposables; off-premises plastic cups, lids, containers, clamshells and cutlery);
- plastic pots, tubs and trays for fruit and vegetables (not applied to dairy, meat or ready meals);
- single-use plastic bags;
- logistics and business-to-business single-use plastic applications (eg, films to wrap pallets and single-use crates for beverages); and
- multi-material/multi-layer sachets should better choices become available (eg, mono-materials, other materials).
To estimate the potential reduction in plastic consumption that would result from these bans, the analysis assumes global implementation by 2040 and compares the relative volume impacted versus the total consumption of plastic in a household, differentiated by region. The impact of these bans is estimated together with that of reuse targets (see Policy Intervention #5) that may affect the same products (see Figure 11, page 46). For those volumes impacted, the analysis assumes the most likely outcome of the ban – elimination, a shift to safe reuse models or replacement with other materials – based on past analysis.
The Pew Charitable Trusts and Systemiq. (2020). Breaking the Plastic Wave: A Comprehensive Assessment of Pathways Towards Stopping Ocean Plastic Pollution.
Before imposing bans on single-use plastic applications, it would be necessary to conduct a comprehensive case-by-case analysis that considered the local context, supply chains, viable substitutes and climate impacts, to avoid unintended consequences or regrettable substitutions. For example, miscalculations on which single-use packaging applications should be banned could end up increasing food waste. Also, banning small single-serve sachets in applications without alternatives could negatively impact on the livelihoods of those reliant on day-to-day consumption due to low purchasing power. To conduct such analysis – particularly in the case of bans that may result in replacement with other materials – best practice would be to undertake product LCAs, to demonstrate that the alternatives would improve overall environmental, health and social impacts. Safe alternative materials should ensure better performance over the entire lifecycle of the material, including collection and recycling rates, positive social impacts (eg, responsible sourcing of raw materials, responsible waste management practices) and positive environmental impacts (eg, no deforestation).
When imposing bans on avoidable single-use plastic applications, governments should consider the timeframes needed for industry adaptation. Bans should be reviewed over time to ensure that the applicable regulations reflect advances in product design, recycling technologies and waste management infrastructure.
There are already examples of bans on certain single-use plastic applications around the world.
Karasik, R., et al. (2023). Plastics Policy Inventory. Duke Nicholas Institute.
Bans on single-use plastic applications would result in the elimination of plastics, a shift to reuse models, or substitution with less impactful materials

Policy Intervention 5
Reuse targets on avoidable single-use plastics
between 15% to 100%, calibrated by applications
Reuse models are new delivery models that replace avoidable single-use plastic with alternatives that can be used across multiple rotation cycles. They encompass diverse solutions
Ellen MacArthur Foundation. (2023). From single-use to reuse: A priority for the UN treaty.
Reuse targets, in the context of the Global Rules Scenario, are policies under which final distributors – such as retailers and food service providers – are mandated to cover a percentage of their sales volumes through safe reuse models. The Global Rules Scenario includes reuse targets for beverage containers, food service and business-to-business (eg, logistics) applications; and, in certain regions, incentives for reusable sanitary and female hygiene products. To select the appropriate reuse target levels for each plastic application, the Global Rules Scenario builds on past analysis to accommodate for technological, financial, performance and behavioural constraints.
The Pew Charitable Trusts and Systemiq. (2020). Breaking the Plastic Wave: A Comprehensive Assessment of Pathways Towards Stopping Ocean Plastic Pollution.
European Parliament. (2023). Revision of the Packaging and Packaging Waste Directive.
Ministère de l'Écologie, France. (2020) LOI n° 2020-105 du 10 février 2020 relative à la lutte contre le gaspillage et à l'économie circulaire (1).
To encourage the adoption and implementation of new models, governments would need to introduce reuse targets for these applications as a set percentage of total sales volumes. The reuse targets envisaged in the Global Rules Scenario would apply to the following single-use plastic applications:
- Beverages containers (sodas, water, alcohol): Safe reuse models would account for 25% of sales volumes in high-income regions and 15% in low and middle-income regions.
- Household products (eg, cleaning, personal care): As for beverages.
- Logistics packaging and business-to-business plastics: Plastic uses such as films to wrap pallets and single-use crates would shift to 100% reuse designs.
- Takeaway food and beverage containers: As these applications also fall within the scope of the single-use plastic bans discussed in Policy Intervention #4, 100% of these designs would either be eliminated or shift to safe reuse models.
Accountability for meeting these reuse targets would be placed on final distributors, including retailers and food service providers (eg, hotels, restaurants and caterers).
When implementing these targets, governments should incentivise the development of infrastructure to facilitate the operation of safe reuse systems; regulate reusable packaging designs; and introduce standards to avoid any negative impact on health or the environment, including standards for usage, collection, washing, storage, handling and filling, and elements controlling the operation and performance of the reuse system.
Zero Waste Europe. (2023). Policy recommendations for efficient and economically viable reuse packaging systems.
- A sufficient number of rotation cycles and return rates: To achieve 10 to 15 rotation cycles – the threshold for minimum economic viability – a return rate for reusable packaging of at least 90% is required, to reduce production and conversion costs and prevent GHG emissions. To this end, packaging systems should be designed to maximise consumer understanding and convenience, and should provide incentives to achieve economic savings and enhance environmental benefits.
- Shared infrastructure to incentivise collaboration across the value chain: The system infrastructure that would require development relates to drop-off networks, return logistics, washing facilities, redistribution, item tracking, customer refunds and employee training. Increased adoption of safe reuse models is critical to achieve economies of scale for collection points and reverse logistics. This would require industry to collaborate through one or a limited number of reuse networks which would localise sorting and cleaning infrastructure, reduce transport distances and lower logistics costs and emissions. Governments could support this by investing in or incentivising the development of this infrastructure, including all infrastructure assets described above. Channelling EPR fees to fund this infrastructure would be one possibility.
- Optimised and standardised reusable packaging designs: Analysis shows that packaging design which is optimised for safe reuse systems can reduce cost per unit through highly standardised collection, sorting, washing, storage and filling systems. Interoperability can be enhanced by standardised ‘universal’ designs that facilitate the acceptance of packaging across different reuse schemes. Design can also positively impact on transportation costs and emissions rates, which depend on the density of filling, sorting and cleaning infrastructure and the specialisation of filling lines. If implemented effectively, standardised designs could also enable smaller players to access economically competitive reuse logistics. Governments could support this by requiring and encouraging the adoption of these common standards, and by incentivising durable products and ‘universal’ designs.
The scenario includes reuse targets for beverage containers, food service and business-to-business applications
Reuse models can replace avoidable single-use plastics in favour of alternatives used over multiple cycles.
Existing examples of reuse targets could help to shape the implementation of this policy in other regions. For example, the EU Packaging and Packaging Waste Directive (94/62/EC) lays down plans to prevent the production of packaging waste and promote the reuse of packaging. The 2023 draft revision proposes concrete reuse targets for certain packaging applications, including cold and hot beverages (80% by 2040), takeaway and ready-prepared food (40% by 2040) and logistics (90% by 2030).
European Parliament. (2023). Revision of the Packaging and Packaging Waste Directive.
Bundesministerium der Justiz. (2023). Gesetz über das Inverkehrbringen, die Rücknahme und die hochwertige Verwertung von Verpackungen.
Ministère de l'Écologie, France. (2020) LOI n° 2020-105 du 10 février 2020 relative à la lutte contre le gaspillage et à l'économie circulaire (1).
Zero Waste Europe. (2021). France’s law promoting bulk and reusable packaging, Waste Prevention Legislation.
Please note the list of single-use applications assumed to be impacted by bans and reuse targets was compiled only for the purpose of modelling the Global Rules Scenario. When deciding on which bans or reuse targets to apply, specific analysis for each local context would be required, as stated elsewhere in this report. Figure 11 presents an example of the estimated plastic consumption in packaging and consumer goods in an average household (the analysis is differentiated by region). In the model, the impact of bans and reuse targets from Policy Interventions #4 and #5 is estimated in aggregate, since bans and reuse targets overlap in scope. Further details on this estimate can be found in the Technical Annex.
FIGURE 11
Household plastic consumption composition and reduction by 2040 in the Global Rules Scenario vs the Business-as-Usual Scenario
Reuse targets and bans should be applied to avoidable single-use plastics, in addition to other policies to reduce plastic production and consumption.
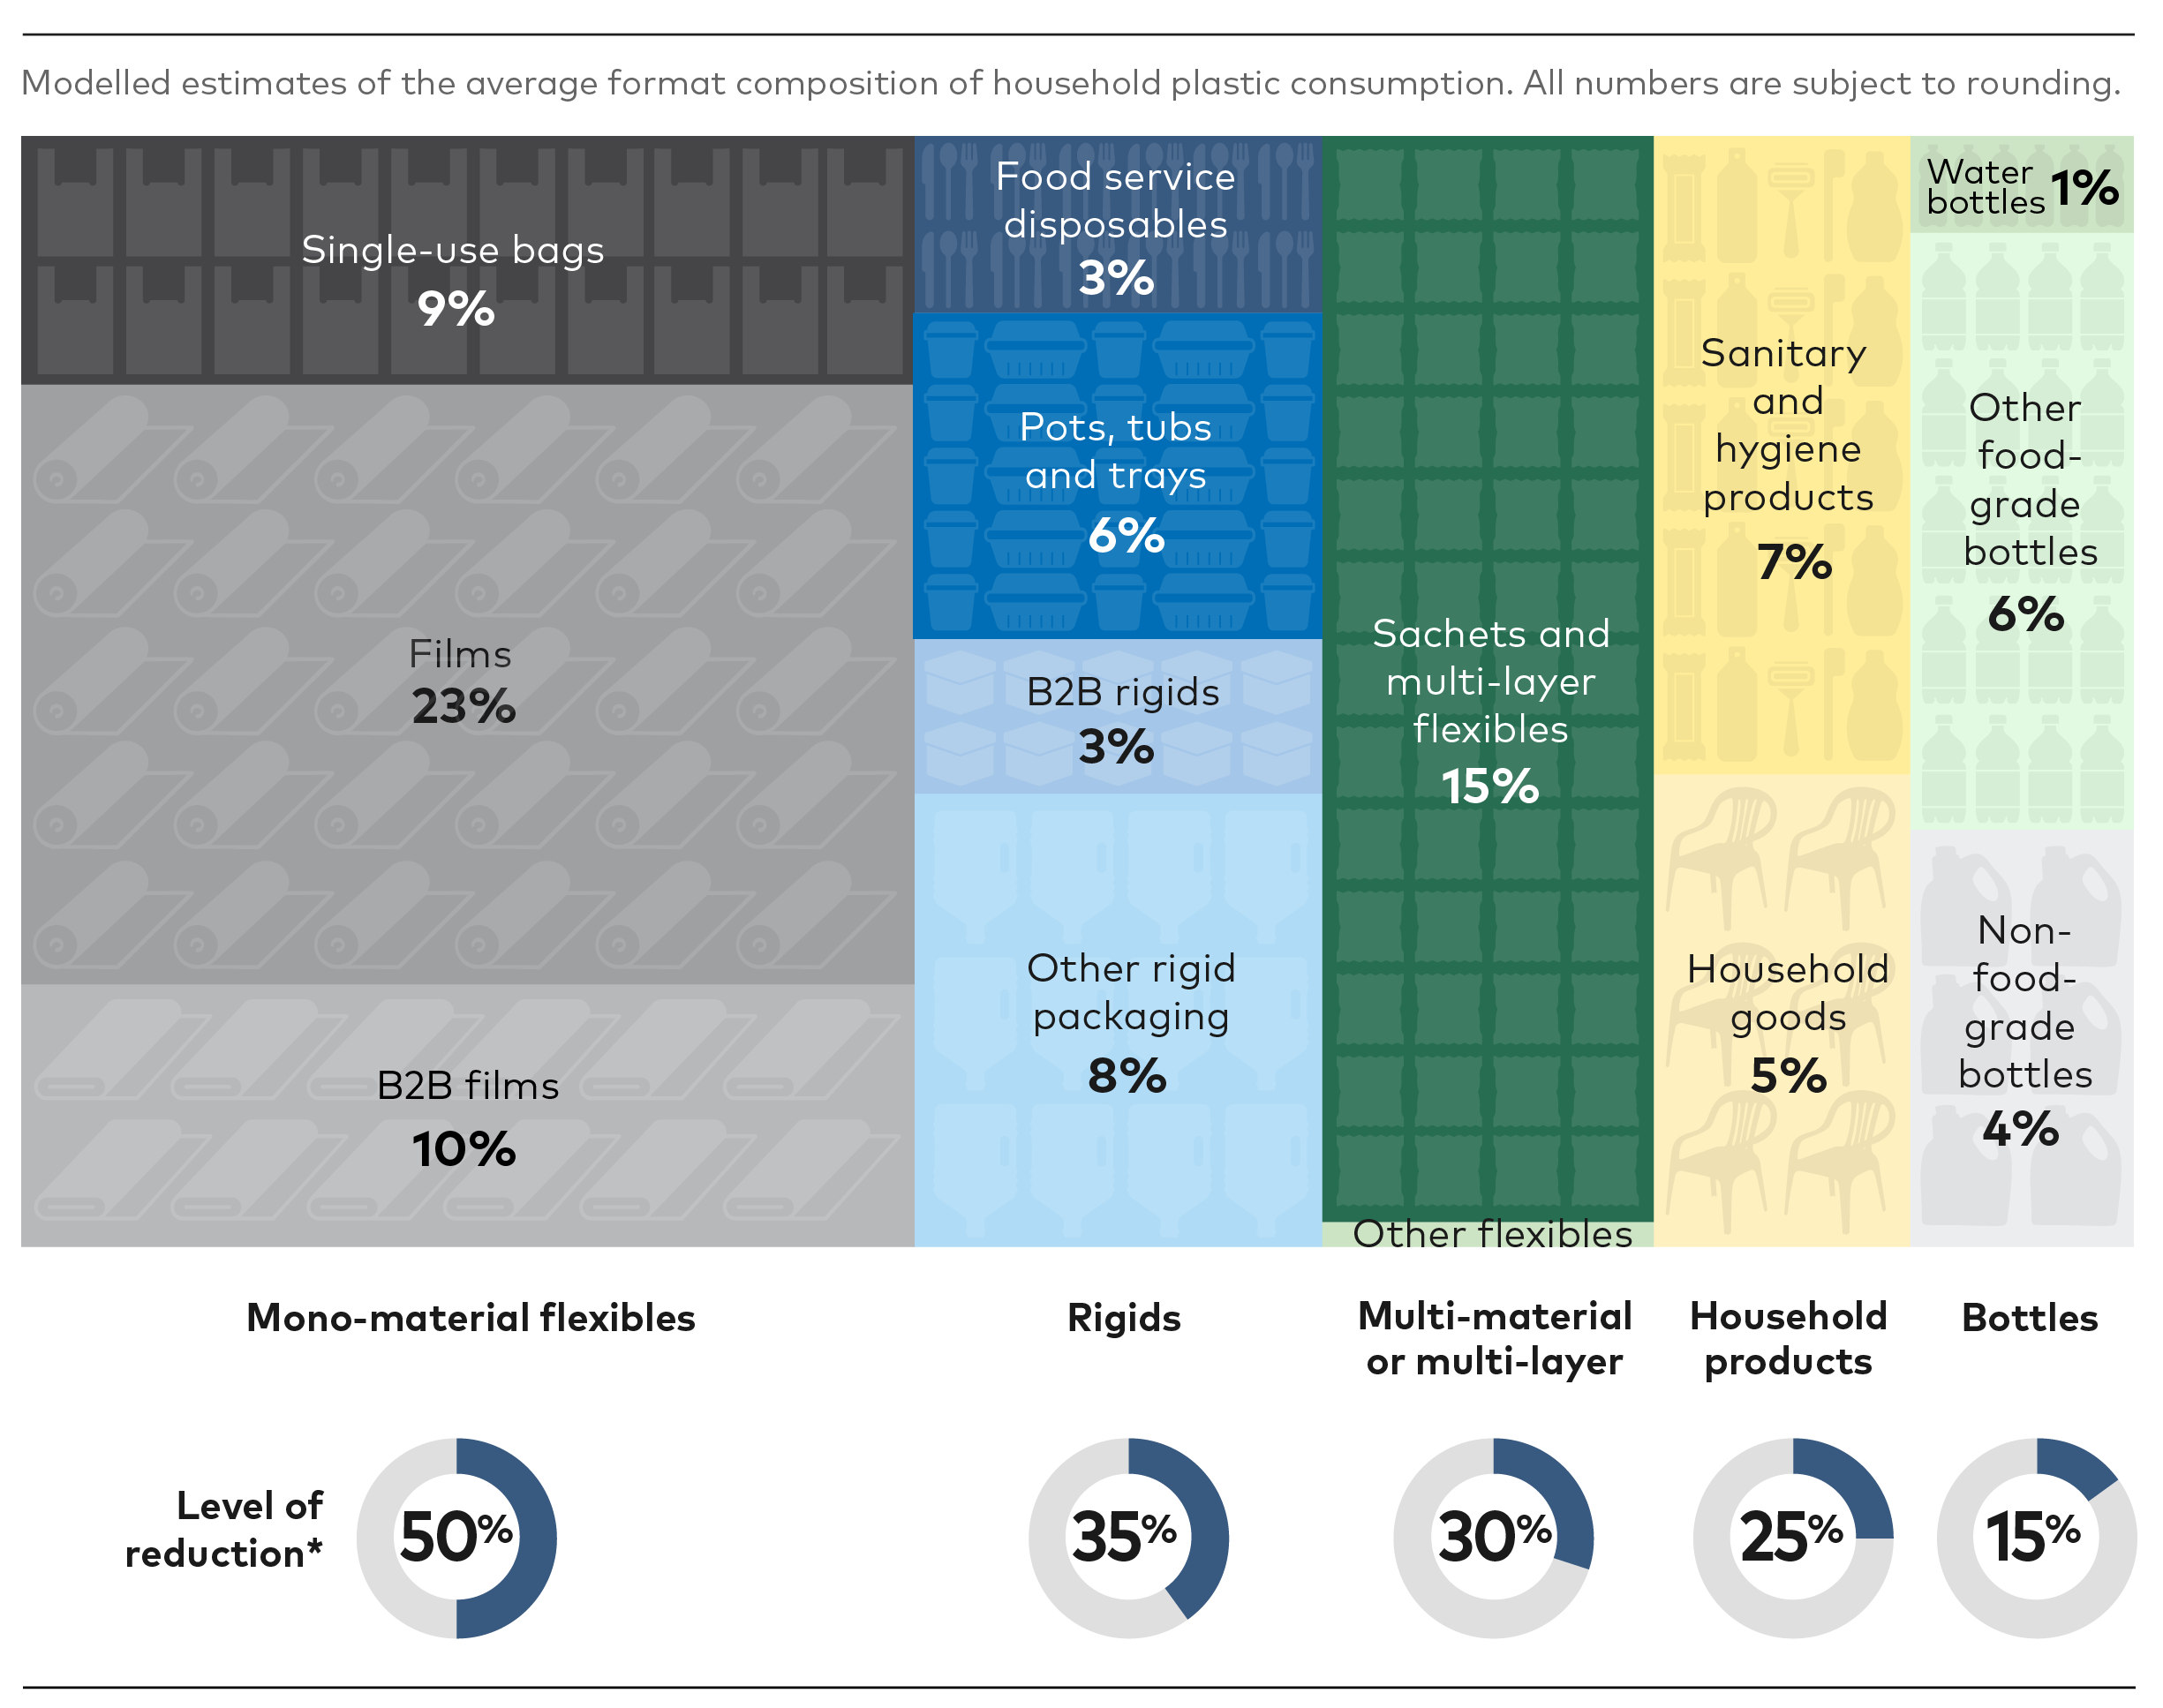
*Global Rules Scenario relative to Business-as-Usual Scenario by 2040.
B2B plastics: Plastics in logistics and single-use applications (eg, films to wrap pallets, single-use crates for beverages).
B2B plastics: Plastics in logistics and single-use applications (eg, films to wrap pallets, single-use crates for beverages).

Policy Intervention 6
Phaseout criteria for problematic plastics, polymer applications and chemicals of concern
including bans and moving to ‘safe lists’ progressively
Global common criteria and the phaseout of problematic plastic products, polymer applications and chemicals of concern have not been quantified; instead, they are addressed qualitatively (see ‘Objective and scope’).
This policy intervention would aim to eliminate plastics that are considered problematic. As mentioned in Box 3, problematic plastics include those that contain hazardous chemicals, create hazardous conditions that pose a significant risk to human health or the environment, and/or hinder reusability or recyclability. Studies and publications have developed insights on potential criteria to assess problematic plastics.
The Global Governance of Plastics and Associated Chemicals; Troubling Toxics.
BRS (2023). Global governance of plastics and associated chemicals. Secretariat of the Basel, Rotterdam and Stockholm Conventions, United Nations Environment Programme, Geneva. Karen Raubenheimer, Niko Urho.
IPEN. (2023). Troubling Toxics: Eliminating Harmful Plastic Chemicals Through The Plastics Treaty.
BRS (2023). Global governance of plastics and associated chemicals. Secretariat of the Basel, Rotterdam and Stockholm Conventions, United Nations Environment Programme, Geneva. Karen Raubenheimer, Niko Urho.
Plastics Pact initiatives have created lists of problematic plastics that should be banned in different local contexts, with a focus on packaging applications.
USA Plastic Pact. (2021). Problematic and Unnecessary Materials Report.
Kenya Plastic Pact. (2022). Problematic & Unnecessary Plastics Items List.
BRS (2023). Global governance of plastics and associated chemicals. Secretariat of the Basel, Rotterdam and Stockholm Conventions, United Nations Environment Programme, Geneva. Karen Raubenheimer, Niko Urho.
Endocrine Society and International Pollutants Elimination Network (IPEN). (2020). Plastics, EDCs & Health: A Guide For Public Interest Organizations And Policy-Makers On Endocrine Disrupting Chemicals & Plastics.
IPEN. (2023). Troubling Toxics: Eliminating Harmful Plastic Chemicals Through The Plastics Treaty.
Moving forward, these lists should be expanded to cover other applications, informed by guidance and research from the scientific community. However, it is possible that the molecular structure of banned substances could be changed in order to circumvent a ban. Therefore, establishing criteria for categorising certain categories and groupings of polymer applications and chemicals of concern as ‘safe’ could be the optimal approach in the long term.
In this report, ‘safe’ would mean no risks to health and biodiversity, and no hindering of circularity.
As an example, the Tiered Protocol for Endocrine Disruption provides a method to identify endocrine-disrupting chemicals.
Schug et al. (2013) Designing endocrine disruption out of the next generation of chemicals. Published in (Green Chem., 2013,15, 181-198)
Phasing out problematic plastics and chemicals would reduce health and environmental risks
PILLAR C
Expand safe circularity
Expand safe circularity via reuse, durability and recycling
After reducing the volume of plastics in the system, with a focus on virgin plastics (Pillar A), and eliminating avoidable and problematic plastics (Pillar B), the Global Rules Scenario prioritises the expansion of circularity in those plastics that remain. Circularity is essential in preventing the release of plastics into the environment, replacing linear disposal models (Pillar D) and reducing demand for virgin plastic through safe reuse and recycling. To this end, the Global Rules Scenario estimates the impact of improved product design on reusability, recyclability and product lifespans; sets formal waste collection targets for local authorities; designates revenues raised from EPR fees for investment in infrastructure; and controls for a just transition for vulnerable communities that could be affected.
The Global Rules Scenario assumes important changes in product design, resulting, for example, in the phaseout of a large proportion of multi-layered / multi-material flexible packaging; a shift from flexible to rigid packaging; and the expansion of the lifespans of certain types of plastic fishing gear by 2040. The Global Rules Scenario would also result in the scaling of waste collection rates to above 95% by 2040 across all regions for municipal solid waste, as well as waste streams from construction, fishing and aquaculture, transportation and agriculture. Recycling rates would increase to between 15% and 67% for specific plastic applications such as packaging and consumer goods, transportation, fishing and aquaculture, and agriculture. EPR fees of between US$300 per tonne and US$1,000 per tonne, depending on the product and region, would raise revenues to support the development of the solutions described in Policy Interventions #7 and #8. As these policies – especially EPR, deposit return schemes and formalised waste management systems – could disrupt the livelihoods of waste pickers and other informal workers, the Global Rules Scenario would require controls and financing to ensure a just transition.
The expansion of collection infrastructure would mainly be needed in low and middle-income countries, as in high-income regions rates have already reached over 95%. In the Global Rules Scenario, improved recycling capacity would yield 201 Mt globally by 2040, compared to 29 Mt in 2019 – a sevenfold increase. The Global Rules Scenario would result in collection rates above 95% in all regions and a global recycling rate of 43% by 2040, compared to a global recycling rate of below 10% in 2019.
The elimination of problematic plastics and better product designs would enable higher reuse and recycling rates

Policy Intervention 7
Design rules for safe reuse, repair, durability and cost-effective recycling in local context
calibrated by application and by local context
The Global Rules Scenario would mandate a shift from multi-material packaging to mono-material packaging; impose bans on materials and additives that impede safe recycling; and introduce sector-specific design requirements. These design rules would ensure that plastic products in all sectors of the economy are designed to reduce volumes, to promote safe reuse and to allow for cost effective recycling in local contexts. Achieving high rates of circularity would require global rules on design standards, to facilitate industry adoption and enable governments to develop the right infrastructure.
When setting rules on the replacement of plastics with alternative materials, it would be necessary to run a case-by-case analysis that takes into account the local context to avoid unintended consequences or regrettable substitutions – for example, via product LCAs. These assessments should demonstrate that the alternatives would enhance overall environmental, health and social impacts.

The Global Rules Scenario assumes that design rules would be introduced across all regions, differentiated by local contexts that reflect differences in systems and infrastructure, with the aim of increasing recycling rates and shifting away from multi-material and multi-layer designs. Initiatives such as the Golden Design Rules,
CGF, Consumer Goods Forum. (2021). Golden Design Rules For optimal plastic design, production and recycling.
Central governments would establish appropriate labelling and claims requirements and definitions to help consumers make the right choices and factor sustainability into their purchases. Regulations would preclude the use of claims that could confuse or potentially mislead consumers, while also specifying how labels could assist consumers in their efforts to sort and recycle plastic products.
While definitions should be harmonised, labelling should ensure that a product can be appropriately segregated at home or in sorting centres. Indeed, ambiguous definitions (eg, ‘compostable’, ‘biodegradable’, ‘bio-based’) can misleadingly suggest to consumers that a product has certain properties, when in reality these can be realised only under special conditions and/or may interfere with recycling processes.
Raubenheimer, K., Urho, N. (2020). Possible elements of a new global agreement to prevent plastic pollution. Nordic Council of Ministers, Denmark, Copenhagen.

Better designs could not only expand product lifespans and durability, but also improve sorting and recycling yields, since the blending of different plastic fibres (eg, PET with elastane or nylon), and the mixture of plastic fibres with cellulosic fibres such as cotton or protein fibres such as wool, introduce further complexity into separation and recycling processes.
The impact of better textile design, particularly in relation to apparel, is interlinked to Policy Intervention #3, as the Global Rules Scenario assumes that governments would introduce similar rules to those set out in EU guidelines
European Commission. (2022). EU Strategy for Sustainable and Circular Textiles.

Fishers would benefit from more durable and high-specification gear designs which – albeit more expensive to purchase – could increase the recycling potential of gear and reduce the economic and environmental impact of shorter lifespans. The average lifespan of fisheries gear could quadruple globally, while the lifespan of aquaculture gear could be at least doubled when compared with the Norwegian average.
These numbers diverge considerably between types of fisheries and aquaculture methods and gear types (eg, collar, feeding pipes, nets).
Systemiq, Handelens Miljøfond, and Mepex. (2023). Achieving Circularity – Synthesis Report – a low-emissions circular plastic economy in Norway.
Currently, fishing gear presents recycling challenges due to gear composition, degradation and biofouling. To enhance recycling, clear and harmonised design rules could simplify gear structure and composition. Fishing gear is often comprised of multiple materials – such as plastic mixed with lead or copper, or with other plastics such as PVC, polystyrene or ultra-high molecular weight polyethylene – which makes it difficult to recycle. Fishing gear producers should adhere to clear recycling rules, focused on maximising the creation of mono-material and single-polymer gear, especially using highly recyclable and durable polymers. The design should also be fit for end-of-life disassembly and recycling, which is especially relevant for aquaculture.
European Commission. (2020). Study on Circular Design of the Fishing Gear for Reduction of Environmental Impacts.
FAO (upcoming report in 2023). Background study on fishing gear recycling.
By 2024, the European Committee for Standardisation will have developed a circular design standard for fishing and aquaculture gear in the EU (CEN/ TC466) that could be used as the basis for a global standard,
European Committee for Electrotechnical Standardization. (2020). A new CEN TC will develop standards for Life Cycle Management and Circular Design of fishing gear.

The ODI’s Phasing Out Plastics report suggests that 60% of plastics could be reduced by 2050 compared with the ODI’s business-as-usual scenario.
ODI. (2020). Phasing out plastics: The electrical and electronic equipment sector.
To reduce plastic consumption in electronics, governments could incentivise or introduce policies such as the Right to Repair;
USA Government. (2021). Fact Sheet: Executive Order on Promoting Competition in the American Economy.
European Commission. (2023). Proposal for a Directive on common rules promoting the repair of goods.
Ellen MacArthur Foundation. (2021). France’s Antiwaste and Circular Economy Law: eliminating waste and promoting social inclusion.
European Parliament. (2023). Parliament wants to make EU textiles and clothing industry greener.
European Environmental Bureau. (2021). Belgian, French and German initiatives to end product destruction must be upscaled at the single-market level.
European Commission. (2022). About the energy label and ecodesign.

The Global Rules Scenario assumes that design rules would extend the lifespans of certain plastic applications in agriculture, with the aim of reducing demand. Plastics in agriculture pose high potential for dispersion and contamination in soil. Products that present the greatest risks include polymer-coated fertilisers, mulching films, pesticide containers, bale films and nets, and irrigation drip tapes.
FAO. (2021). Assessment of agricultural plastics and their sustainability. A call for action.
EIA. (2023). Cultivating Plastic Part 3 - Agriplastic waste mismanagement and criminality.
One solution could be to increase the thickness of mulching films. Thin films are more prone to tearing and can thus become single use. The Global Rules Scenario assumes that governments will enact standards on agricultural products such as mulching films. In 2017, for example, China introduced standards imposing a minimum thickness for mulching films which could enable reusability and increase lifespans. China is also promoting the management of agricultural plastic film waste to improve soil conservation in its Human Rights Action Plan.
State Council Information Office of the People's Republic of China. (2021). Full Text: Human Rights Action Plan of China (2021-2025).
In addition, natural or biodegradable alternatives to agricultural plastics and standards could be explored for products that are likely to be left in fields, such as coatings for fertilisers and seeds, or mulching films.
FAO. (2021). Assessment of agricultural plastics and their sustainability. A call for action.
European Commission. (2021). Conventional and Biodegradable Plastics in Agriculture.
EIA. (2023). Cultivating Plastic Part 4 - Caution with regards to the adoption of potential agriplastic alternatives.
Policy Intervention 8
Targets for collection and recycling rates
including segregated collection for plastics
The system should expand waste collection, segregated collection of plastics and recycling infrastructure to reduce mismanagement and increase recycling rates and recycled content in all regions. Most high-income regions (eg, Europe, the USA, Japan) already have waste collection rates above 95% for municipal solid waste.
World Bank. (2019). What a Waste 2.0: A Global Snapshot of Solid Waste Management to 2050 - Database.
Other policy interventions would also have a critical impact on waste collection and recycling. Reductions in problematic materials (Policy Intervention #6) and simplified and improved plastic product designs (Policy Intervention #7), in particular, would improve the economics of recycling and therefore incentivise collection and recycling infrastructure. By strictly adhering to design rules for recyclability and coupling them with segregated collection, the economic viability of recycling would be enhanced and the quality of recycled content improved.
FIGURE 12
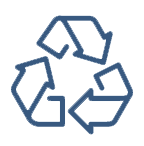
Collection rates of municipal solid waste in 2019
The model leverages estimates of collection rates of municipal solid waste from the World Bank’s What a Waste 2.0.
The Global Rules Scenario would result in waste collection rates of more than 95% across all regions for all sectors considered. Currently, these collection levels are achieved only in high-income countries which have the resources to develop the necessary infrastructure. In low and middle-income countries, this represents a substantial challenge, as they lack the resources and innovation needed to reach these levels. Targets adopted by all regions would send an important signal to mobilise central governments, municipalities and the private sector. To support the expansion of efficient collection and sorting systems, modulated EPR fees and revenues from virgin plastic fees would be deployed simultaneously to cover the cost of collection and sorting and the necessary infrastructure investment across different geographies.
In addition to expanding waste collection, the segregated collection of plastics (sometimes referred to as ‘collection for recycling’) would be critical in facilitating recycling. This would include models for segregating waste at home, segregated kerbside collection and deposit return schemes. The main objective of these schemes is to collect plastics separated from other waste, to prevent contamination and increase feedstock quality for recycling. For example, the EU has already set targets for mandatory segregated collection for most plastic products, including 90% for plastic beverage bottles by 2029.
European Parliament. (2019). Directive (EU) 2019/904 of the European Parliament and of the Council of 5 June 2019 on the reduction of the impact of certain plastic products on the environment.
Eunomia. (2023). Mixed Waste Sorting to meet the EU’s Circular Economy Objectives.

Textiles collection has been proven to work in various formats, such as kerbside collection, in-store collection and drop-off textile containers located across cities. Germany and Switzerland have achieved high collection rates of up to 65%, mostly through textile containers.
Ellen MacArthur Foundation. (2017). A new textiles economy: Redesigning fashion’s future.
Fashion For Good. (2022). Wealth In Waste: India’s Potential To Bring Textile Waste Back Into The Supply Chain.

In addition to disincentivising the abandonment of fishing gear, a global gear passport with mandatory gear marking could incentivise collection and support sorting. Gear marking and tracking applied in all countries at the point of sale could be linked to a fishing licence system for owners and vessels to facilitate inventory control, reporting of fishing gear losses, gear recovery and the traceability of materials composition for recycling.
FAO. (2019). Voluntary Guidelines on the Marking of Fishing Gear.
European Commission. (2011). Commission Implementing Regulation (EU) No 404/2011 of 8 April 2011 laying down detailed rules for the implementation of Council Regulation (EC) No 1224/2009 establishing a Community control system for ensuring compliance with the rules of the Common Fisheries Policy.
International Union for Conservation of Nature (2021). Advocating Extended Producer Responsibility for fishing gear.

Electronics are attractive for collection, as they contain valuable metals; this can be done through central municipal waste collection points or retail outlets. Electronics are mostly collected only for the valuable metals they contain; the plastics that they incorporate are often discarded or burned. Many countries, including Nigeria and South Africa, are starting to implement policies to support the management of e-waste.
United Nations Institute for Training and Research (UNITAR). (2020). Global E-waste Monitor 2020.
UNITAR. (2022). The Global Transboundary E-waste Flows Monitor 2022.
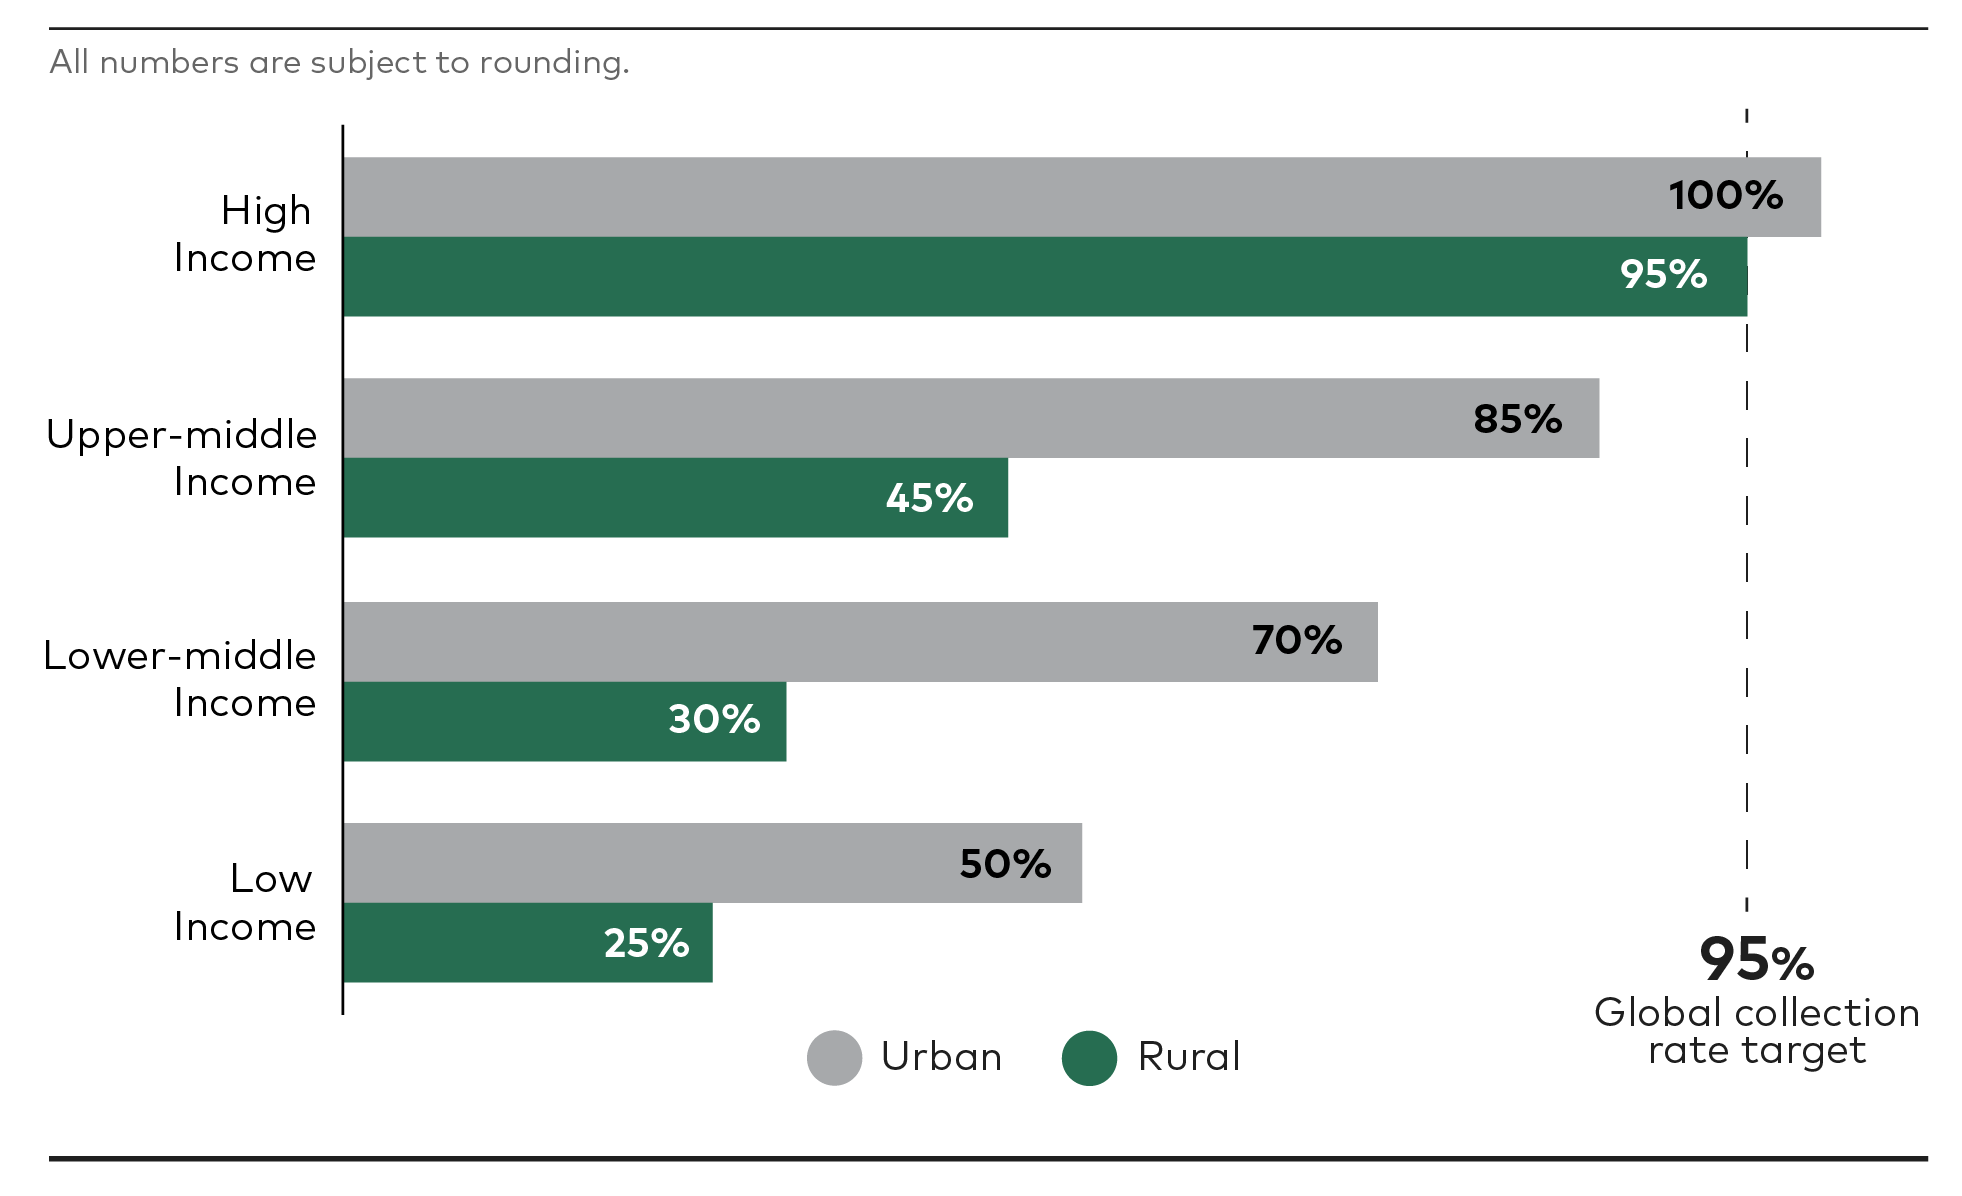
FIGURE 13
Plastic recycling rates by sector in 2019 and under the Global Rules Scenario in 2040
The Global Rules Scenario would require a substantial increase in the recycling rates of all plastic applications.
In the Global Rules Scenario, mechanical recycling would be prioritised over chemical recycling. Of the total recycling output in 2040 under this scenario, >90% would be mechanical recycling. The rest would be chemical recycling for certain types of plastic waste that mechanical recycling cannot process. All numbers are subject to rounding.
The Global Rules Scenario would result in a global plastic recycling rate of 43% by 2040, compared to a rate of under 10% in 2019. This rate would vary by sector (see Figure 13 above) due to multiple factors, including the resins used, product design and the levels of contaminants and additives in products. Policy interventions such as bans on problematic additives and pigments, rules on improved design, segregated collection schemes and deposit return schemes would be critical to increase safe recycling, and especially closed-loop recycling. The EU has set a plastic packaging recycling target of 55% by 2030 in its Packaging and Packaging Waste Directive; while the Global Rules Scenario would result in a 67% plastic packaging recycling rate by 2040 globally. The Global Rules Scenario would expand mechanical recycling infrastructure to reach 187 Mt of output globally, compared with 29 Mt in 2019 – a roughly sevenfold increase.
Targets for increasing collection and sorting aim to provide feedstock towards recycling
The Global Rules Scenario focuses on mechanical recycling over chemical recycling, as mechanical recycling results in lower GHG emissions and better cost performance than chemical recycling.
The Pew Charitable Trusts and Systemiq. (2020). Breaking the Plastic Wave: A Comprehensive Assessment of Pathways Towards Stopping Ocean Plastic Pollution.
‘Closed loops’, in the context of this model, refers to mechanical recycling where the recycled content is used towards the same application; compared with open loops, where the recycled content is used in other applications.
Food Safety Works. (2022). FSSAI Approves Of Recycled Plastic For Food Packaging.
Textile Exchange. (2022). Preferred Fiber & Materials Market Report
Collection and recycling targets could increase the supply of recycled plastics, while minimum recycled content targets would motivate demand from industry, simultaneously incentivising supply and demand to create a market for recycled plastics. For example, the Global Rules Scenario would result in ranges of recycled content in bottles and rigid packaging between 30% and 80%, and ranges of recycled content in flexible packaging between 30% and 60%, depending on the region. Policy examples are already underway – for example, the European Union is expected to mandate recycled content targets of 65% for all plastic beverage bottles and 50% for contact sensitive plastic packaging by 2040.
European Commission. (2022). Proposal for a regulation of the European Parliament and of the Council on packaging and packaging waste, amending Regulation (EU) 2019/1020 and Directive (EU) 2019/904, and repealing Directive 94/62/EC.
Box 4:
Chemical recycling in the Global Rules Scenario
Chemical recycling
Plastics Europe. (2021). European plastics manufacturers plan 8 billion euros of investment in chemical recycling
In this report, ‘chemical recycling’ refers to the plastic-to-plastic output of technologies such as pyrolysis, gasification and depolymerisation
European plastics manufacturers have announced investments of €7.2 billion in chemical recycling by 2030.
Plastics Europe. (2021). European plastics manufacturers plan 8 billion euros of investment in chemical recycling
BRS (2023). Global governance of plastics and associated chemicals. Secretariat of the Basel, Rotterdam and Stockholm Conventions, United Nations Environment Programme, Geneva. Karen Raubenheimer, Niko Urho.
Chemical recycling technologies are still under development and have certain drawbacks. One concern often raised is the output of these technologies is not only plastic-to-plastic conversion, but also the production of fuel and chemicals from plastics (in this report, only plastic-to-plastic yields are counted as ‘chemical recycling’). Some chemical recycling technologies result in in higher energy consumption and GHG emissions per tonne recycled relative to mechanical recycling. They also require more investment,
The Pew Charitable Trusts and Systemiq. (2020). Breaking the Plastic Wave: A Comprehensive Assessment of Pathways Towards Stopping Ocean Plastic Pollution.
On the other hand, mechanical recycling has technical limitations in terms of the feedstock it can process, the number of loops it can recycle and the quality of its output (which in many cases is inferior to virgin plastic and is not usually certified as food grade, except for specific cases).
CGF. (2022). Guiding Principles for the Ecomodulation of EPR Fees for Packaging.
The Global Rules Scenario applies chemical recycling to a few of the plastic waste types mentioned above, to prevent these volumes from ending up in landfill or incineration, and to reduce the production of virgin plastic. In the Global Rules Scenario, the output of chemical recycling in 2040 would be 14 Mt, representing 3% of the 462 Mt of plastic waste generated annually.
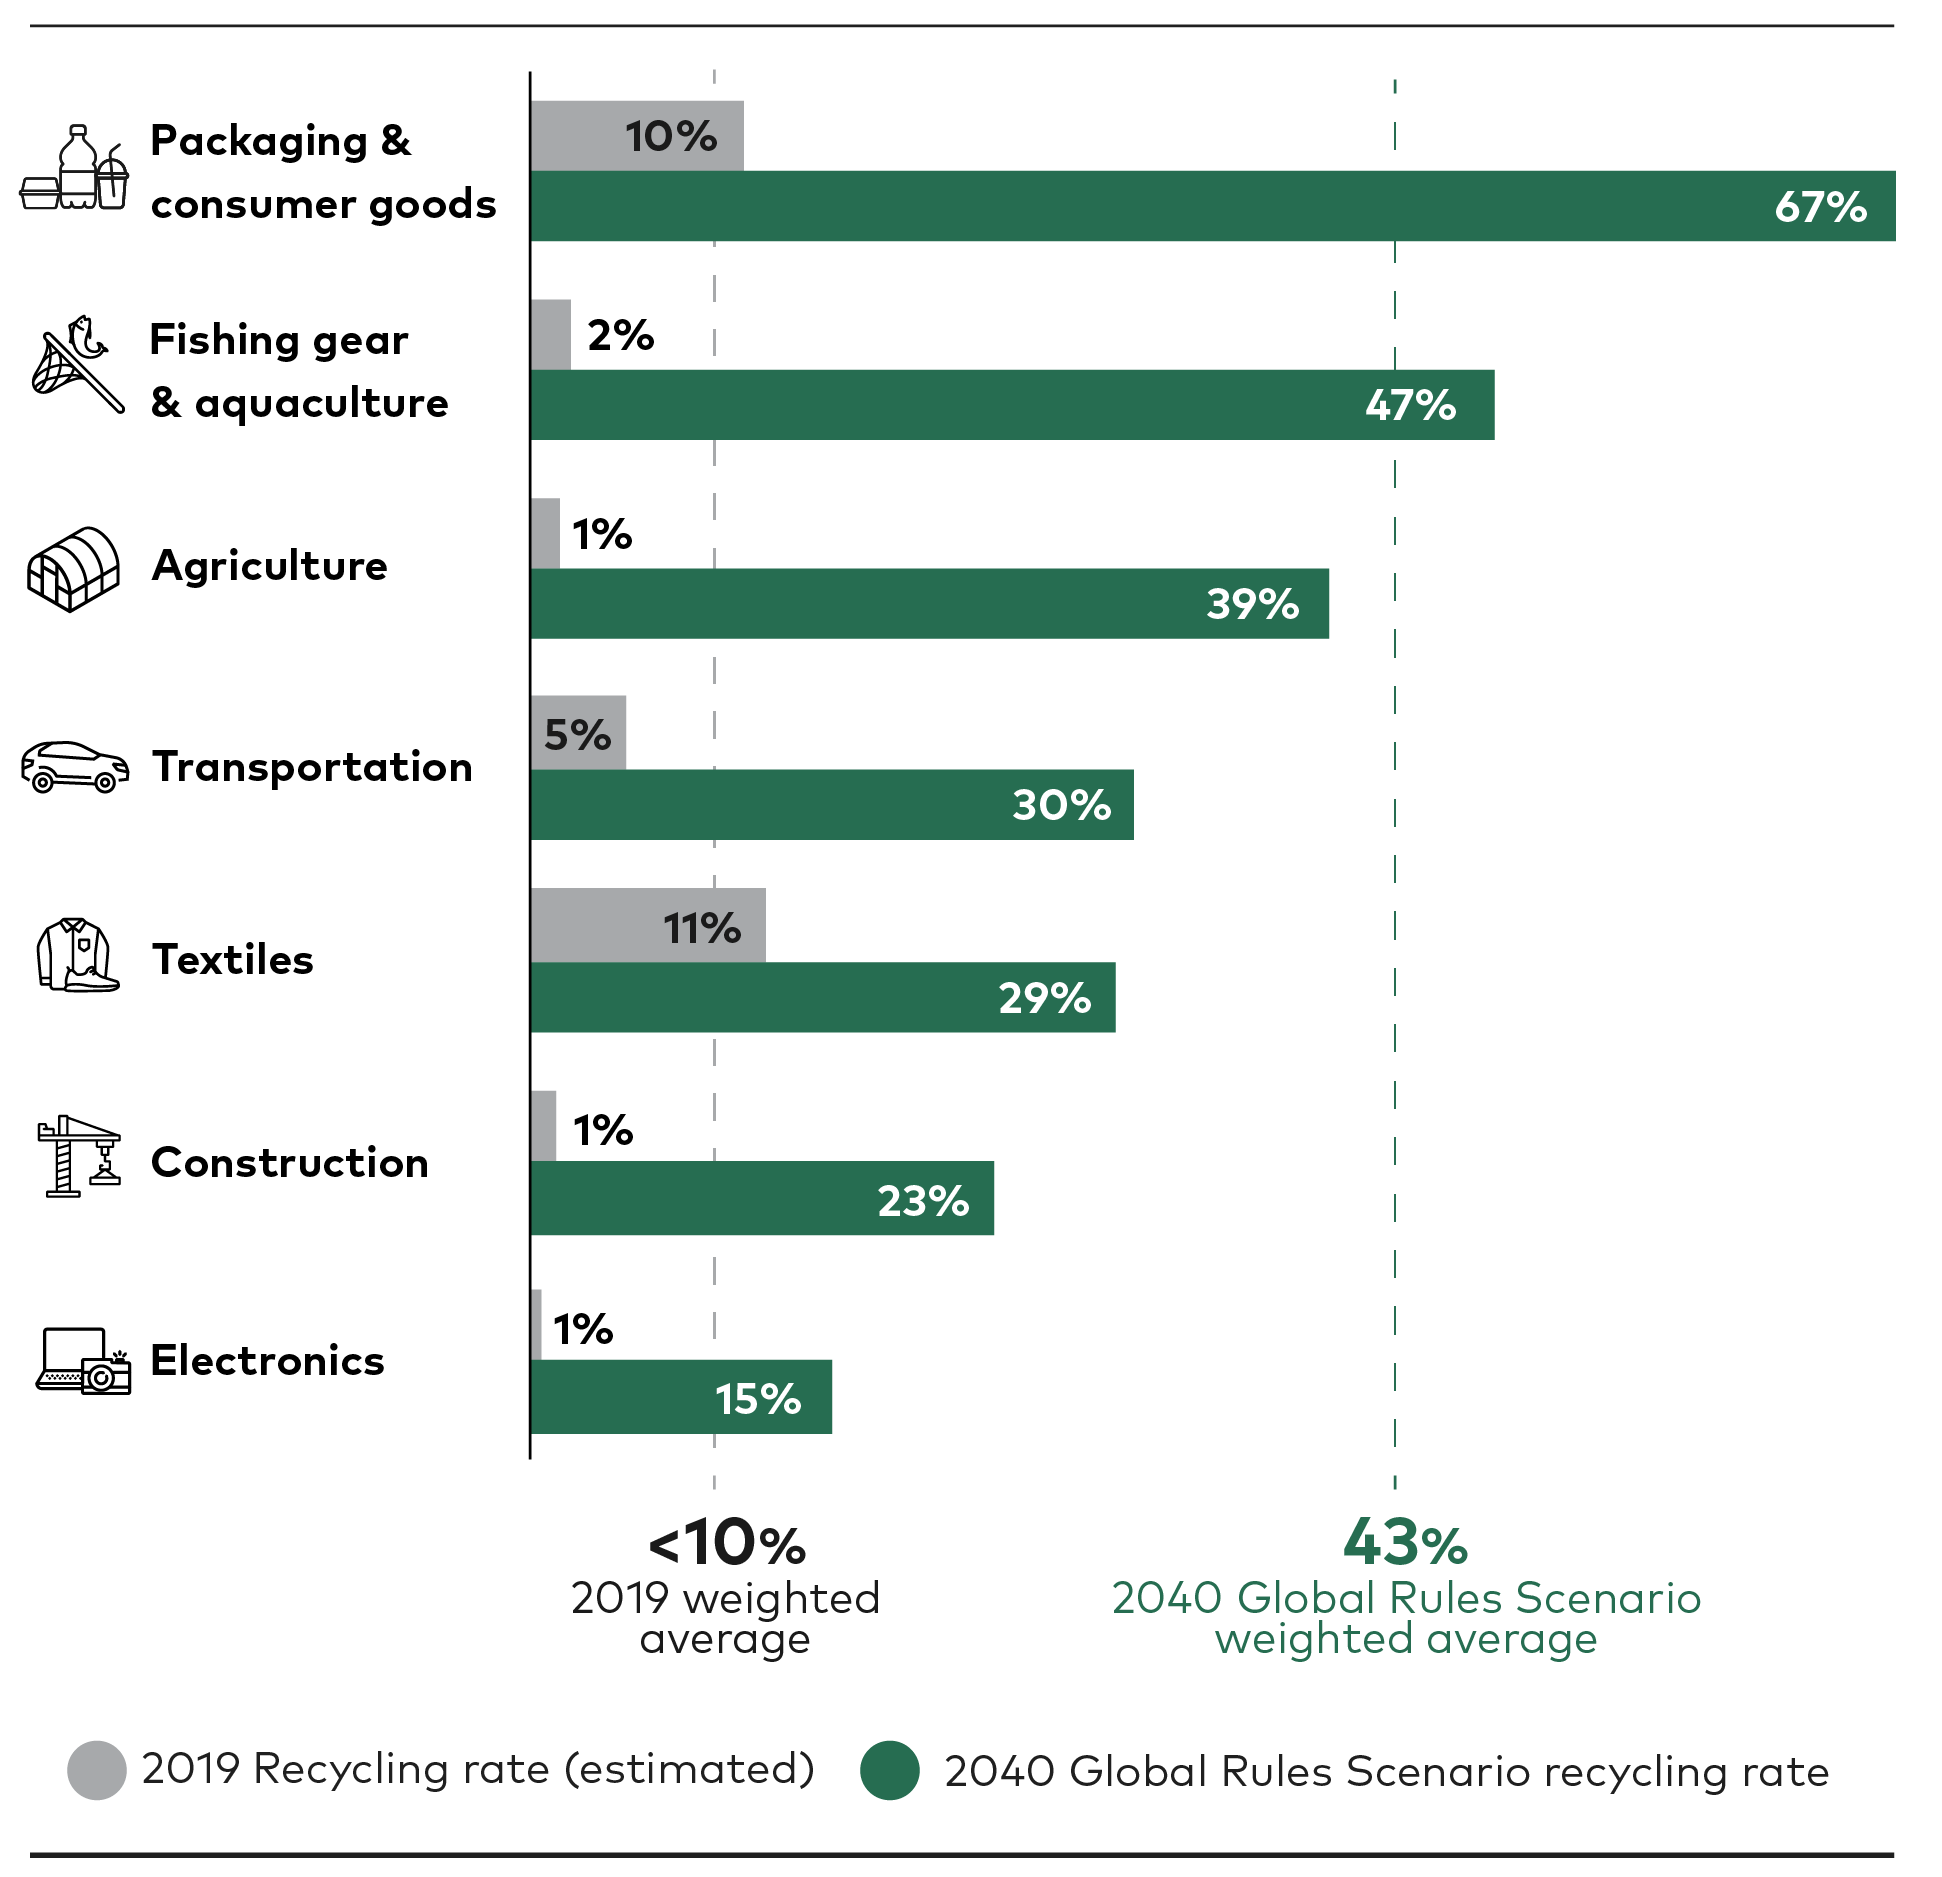
Because of the risks (see Box 2) and uncertainty associated with chemical recycling, a Global Rules Scenario without any chemical recycling was also modelled (see Figure 14). The results show that if the Global Rules Scenario were to exclude chemical recycling altogether, these volumes would probably end up in controlled disposal through incineration with energy recovery and/or landfill. Of the 14 Mt that are chemically recycled in the Global Rules Scenario, the analysis suggests that an estimated 11 Mt could end up in landfill and 3 Mt in incinerators if chemical recycling were excluded. Not using chemical recycling would decrease the recycling rate by 2%, increase virgin plastic production by 14 Mt and negatively impact GHG emissions. However, these impacts may be worthwhile if the risks associated with chemical recycling are proven and cannot be mitigated through R&D and/or the use of different technologies.
FIGURE 14
Because of the risks and uncertainty associated with chemical recycling, a Global Rules Scenario without any chemical recycling was also modelled.
Taking chemical recycling out of the Global Rules Scenario would result in a limited increase in annual virgin plastic production, GHG emissions and volumes landing in controlled disposal, as well as a minor decrease in recycling rates.

Policy Intervention 9
Modulated EPR schemes applied across sectors
with fees of $300 - $1000 /tonne calibrated by region and product
EPR schemes require industry players that place products containing plastics on the market to pay a fee which is then used to fund the collection, sorting, recycling or disposal of waste plastic materials, as well as solutions to scale new delivery models, such as reuse. EPR schemes are often considered as a practical implementation of the ‘polluter pays’ principle.
UNEP. (2023). Turning off the tap: How the world can end plastic pollution and create a circular economy.
In the Global Rules Scenario, EPR fees would be applied across all sectors, not only packaging. Regional calibration of EPR fees would make it easier for companies to design their products to meet the requirements of multiple markets. It is assumed that fees would be collected and invested at the national level, and would also cover the administration costs of the EPR scheme itself. The levels of effectiveness are differentiated by region to account for the management of EPR schemes and the less advanced infrastructure of low and middle-income countries. In the Global Rules Scenario, fees would increase over time and would be calibrated across regions, depending on income levels. It is assumed that in high-income regions, fees would be invested in expanding sorting and recycling capacity; while in low, middle and upper-middle-income regions, fees would be invested in developing collection, sorting, recycling and disposal infrastructure. The share of investment that each part of the value chain would receive under the model is in direct proportion to its cost. It is assumed that investments in recycling infrastructure and reuse models would mainly be made by the private sector, as private sector players would generate profits from such investments. However, the revenues from these fees could be used to support the expansion of reuse models, to de-risk investment and accelerate adoption. The Global Rules Scenario assumes that regions that already have deposit return schemes – particularly for bottles – would also introduce EPR schemes.
A position paper published by the Ellen MacArthur Foundation and endorsed by dozens of organisations across the value chain indicates that the benefit of EPR funding is that it is ‘dedicated, ongoing and sufficient’ – which is what makes it so effective. This allows governments to rely on this revenue and use it to fund infrastructure at scale over time. For more information, see the Ellen MacArthur Foundation’s paper on EPR.
Ellen MacArthur Foundation. (2021). Extended Producer Responsibility: a necessary part of the solution to packaging waste and pollution.
To set the right EPR fees, specific studies should be conducted for each given local context. For the purpose of the Global Rules Scenario, the analysis models fees of US$300 to US$1,000 per tonne of plastic by 2040, increasing gradually from 2025. These fees would vary both by region, depending on income levels and affordability; and by application, penalising those designs that are difficult to recycle. Please see the Technical Annex for full details.
In practice, the implementation of EPR schemes would require central governments to establish systems to administer the funds and set concrete targets for collection, recycling and recycled content. The EPR fees would be paid by economic actors that place plastic products on the market – most likely manufacturers and importers. The fees would be raised and invested by local municipalities through producer responsibility organisations to cover the collection, sorting and disposal of plastic waste. EPR fees should be set at a level that accounts for the costs of infrastructure in the local context; should be calibrated by application; and should operate on a net cost basis.
Net cost basis, in this context, suggests that EPR policies should set EPR fees at a level that would fully fund the net cost of collecting, sorting and recycling plastic waste.
UNEP. (2023). Turning off the tap: How the world can end plastic pollution and create a circular economy.
The Consumer Goods Forum sets out practical principles for modulation for plastic packaging that could be followed in this context. An modulation system should be designed 1) as simply and practically as possible; 2) with clear objectives and criteria to show which improvements in the waste management and recycling system it is targeting; 3) with a focus on net cost to include the ‘net cost’ of collection, sorting and recycling of a material stream to provide the optimal set of incentives for design and production; 4) with investment in systems improvement to expand the development of infrastructure, technology and consumer education to enable recycling of such materials; 5) with full transparency and consultation of all stakeholders through dialogue with industry; and 6) with harmonised and consistent criteria implemented across markets and jurisdictions for a level playing field wherever possible. For more details, see the report entitled Guiding Principles for the Eco-modulation of EPR Fees for Packaging.
CGF. (2022). Chemical Recycling in a Circular Economy for Plastics: A Vision and Principles Paper.
Existing EPR schemes can serve as examples for expanding this policy into new regions. The EU has mandated that all member states deploy EPR schemes for plastic packaging.
European Parliament. (2019). Directive (EU) 2019/904 of the European Parliament and of the Council of 5 June 2019 on the reduction of the impact of certain plastic products on the environment.
Citeo. (2021). Le tarif 2021 pour le recyclage des emballages ménagers.
Ministère de l'Écologie, France. (2023). La réglementation de la filière REP des déchets textiles ("TLC").
EPR schemes have been well established in some European countries for decades and the adoption of such schemes is increasing worldwide. For example, the Republic of Korea, Vietnam, the Philippines, India, Chile and South Africa have implemented various mandatory EPR schemes.
Modulated EPR schemes can incentivise better product designs and fund infrastructure

Policy Intervention 10
Controls for a just transition for the informal sector
enhancing their labour and human rights
Controls for a just transition and protections for waste pickers have not been quantified in the modelling exercise; they are rather addressed qualitatively (see ‘Objective and scope’).
Waste pickers in the informal sector are reliant on this activity for their livelihoods. These communities of workers operate in informal set-ups and play a crucial role in the recycling system by collecting, sorting and selling recyclable material waste. However, working conditions are often hazardous and waste pickers regularly face social stigma and discrimination. Earnings are low, and waste pickers have limited bargaining power in the market and are generally excluded from formal waste management operations and decision-making.
International Labour Office. (2019). Waste pickers’ cooperatives and social and solidarity economy.
Waste pickers play a crucial role in recycling efforts, but are generally excluded from formal waste management operations and decision-making
Policies such as EPR schemes, segregated collection targets and deposit return schemes on recyclable products such as bottles would directly impact the livelihoods of communities in the informal sector. In the modelling exercise behind this report, the share of plastic waste collected by the informal sector is kept constant; however, this would be under the assumption that controls to enhance the labour and human rights of these communities would be in place. Otherwise, the implementation of these policies would present risks to a just transition. Governments could ensure a just and inclusive transition by protecting labour and human rights in the informal sector
International Alliance of Waste Pickers. (2023). Recommendations for potential core obligations options for the plastics treaty.
- including the informal sector in policy and decision-making processes and discussions on waste management or which would otherwise impact on their livelihoods;
- integrating their activities within the broader waste management system, including EPR schemes, by facilitating the purchase of plastic waste collected by the informal sector at a fair price (including a ‘service fee’ for the environmental service they provide by collecting this waste, in addition to the material value of the recyclables);
- establishing and enforcing specific regulations to safeguard the health and safety of waste pickers, including rules on the handling of hazardous waste, the provision of protective equipment and training in occupational hazards;
- providing legal recognition to informal workers to improve their incomes, working conditions and ability to organise, and establishing social welfare programmes to mitigate the economic risks and vulnerabilities faced by these communities; and
- supporting informal workers and waste pickers in moving up the value chain by enabling access to finance and providing training programmes and capacity-building initiatives. These programmes could enhance their skills, productivity and competitiveness, enabling them to access better employment opportunities and potentially to transition to more formalised sectors.
The important contribution of the informal sector to the global plastic recycling system is largely unrecognised and underpaid. An increase in the value of plastic material through design for recycling and the integration of the informal sector within the broader waste management system would significantly increase the retained value for waste pickers and help to promote social justice.
Specific policies and approaches would vary based on the local context and the needs of individual communities. Governments should work closely with relevant stakeholders, including community representatives and civil society organisations, to design and implement effective policies that would protect the health and human rights of the informal sector and waste picker communities. The impact of the policies outlined in this section has not been estimated as part of the modelling exercise for this report.

PILLAR D
Controlled disposal
Ensure the controlled disposal of waste that cannot be prevented or safely recycled
Once Pillars A, B and C have been deployed to their feasible limits, policies are needed to ensure that all remaining plastic is managed through controlled disposal methods. While controlled disposal is not a desirable outcome, it can be a last resort option to prevent plastic waste from being mismanaged.
The Global Rules Scenario would result in a 46% decrease in volumes of plastic waste managed via landfill or incineration in Europe, the USA, Canada, Japan, the Republic of Korea and Oceania by 2040 relative to 2019 levels. However, in the rest of the world, despite all efforts, there would still be large volumes of plastic waste to be managed through controlled disposal (see Figure 15). In these regions, the Global Rules Scenario would result in a 74% increase in volumes managed via landfill or incineration by 2040 relative to 2019 levels. This means that globally, the volumes of waste ending up in controlled disposal in 2040 would be similar to the figures for 2019.
After maximising reduction, elimination and circularity, controlled disposal is the last resort to prevent mismanagement
The main reasons for this are that low and middle-income regions already lack the necessary infrastructure to manage the waste that is generated today, and have higher forecasted growth in population and consumption per capita; and the reduction and circularity proposed in the Global Rules Scenario would not be enough to address all applications by 2040. For instance, the plastics used in construction, transportation, textiles and electronics have long lifespans (five to 30 years, depending on the application), and can include complex designs (eg, the blending of different polymers/materials) and formulations (eg, fire retardants and other additives) that hinder recycling. In these cases, controlled disposal is the next best available solution, as a final alternative to mismanagement.
To ensure that disposal would be controlled and managed according to the best available environmental practices, the Global Rules Scenario assumes the imposition of restrictions on the export of plastic waste and global application of controlled disposal standards. The Global Rules Scenario primarily focuses on preventing annual mismanagement of plastic rather than removal and management of legacy mismanaged plastics.
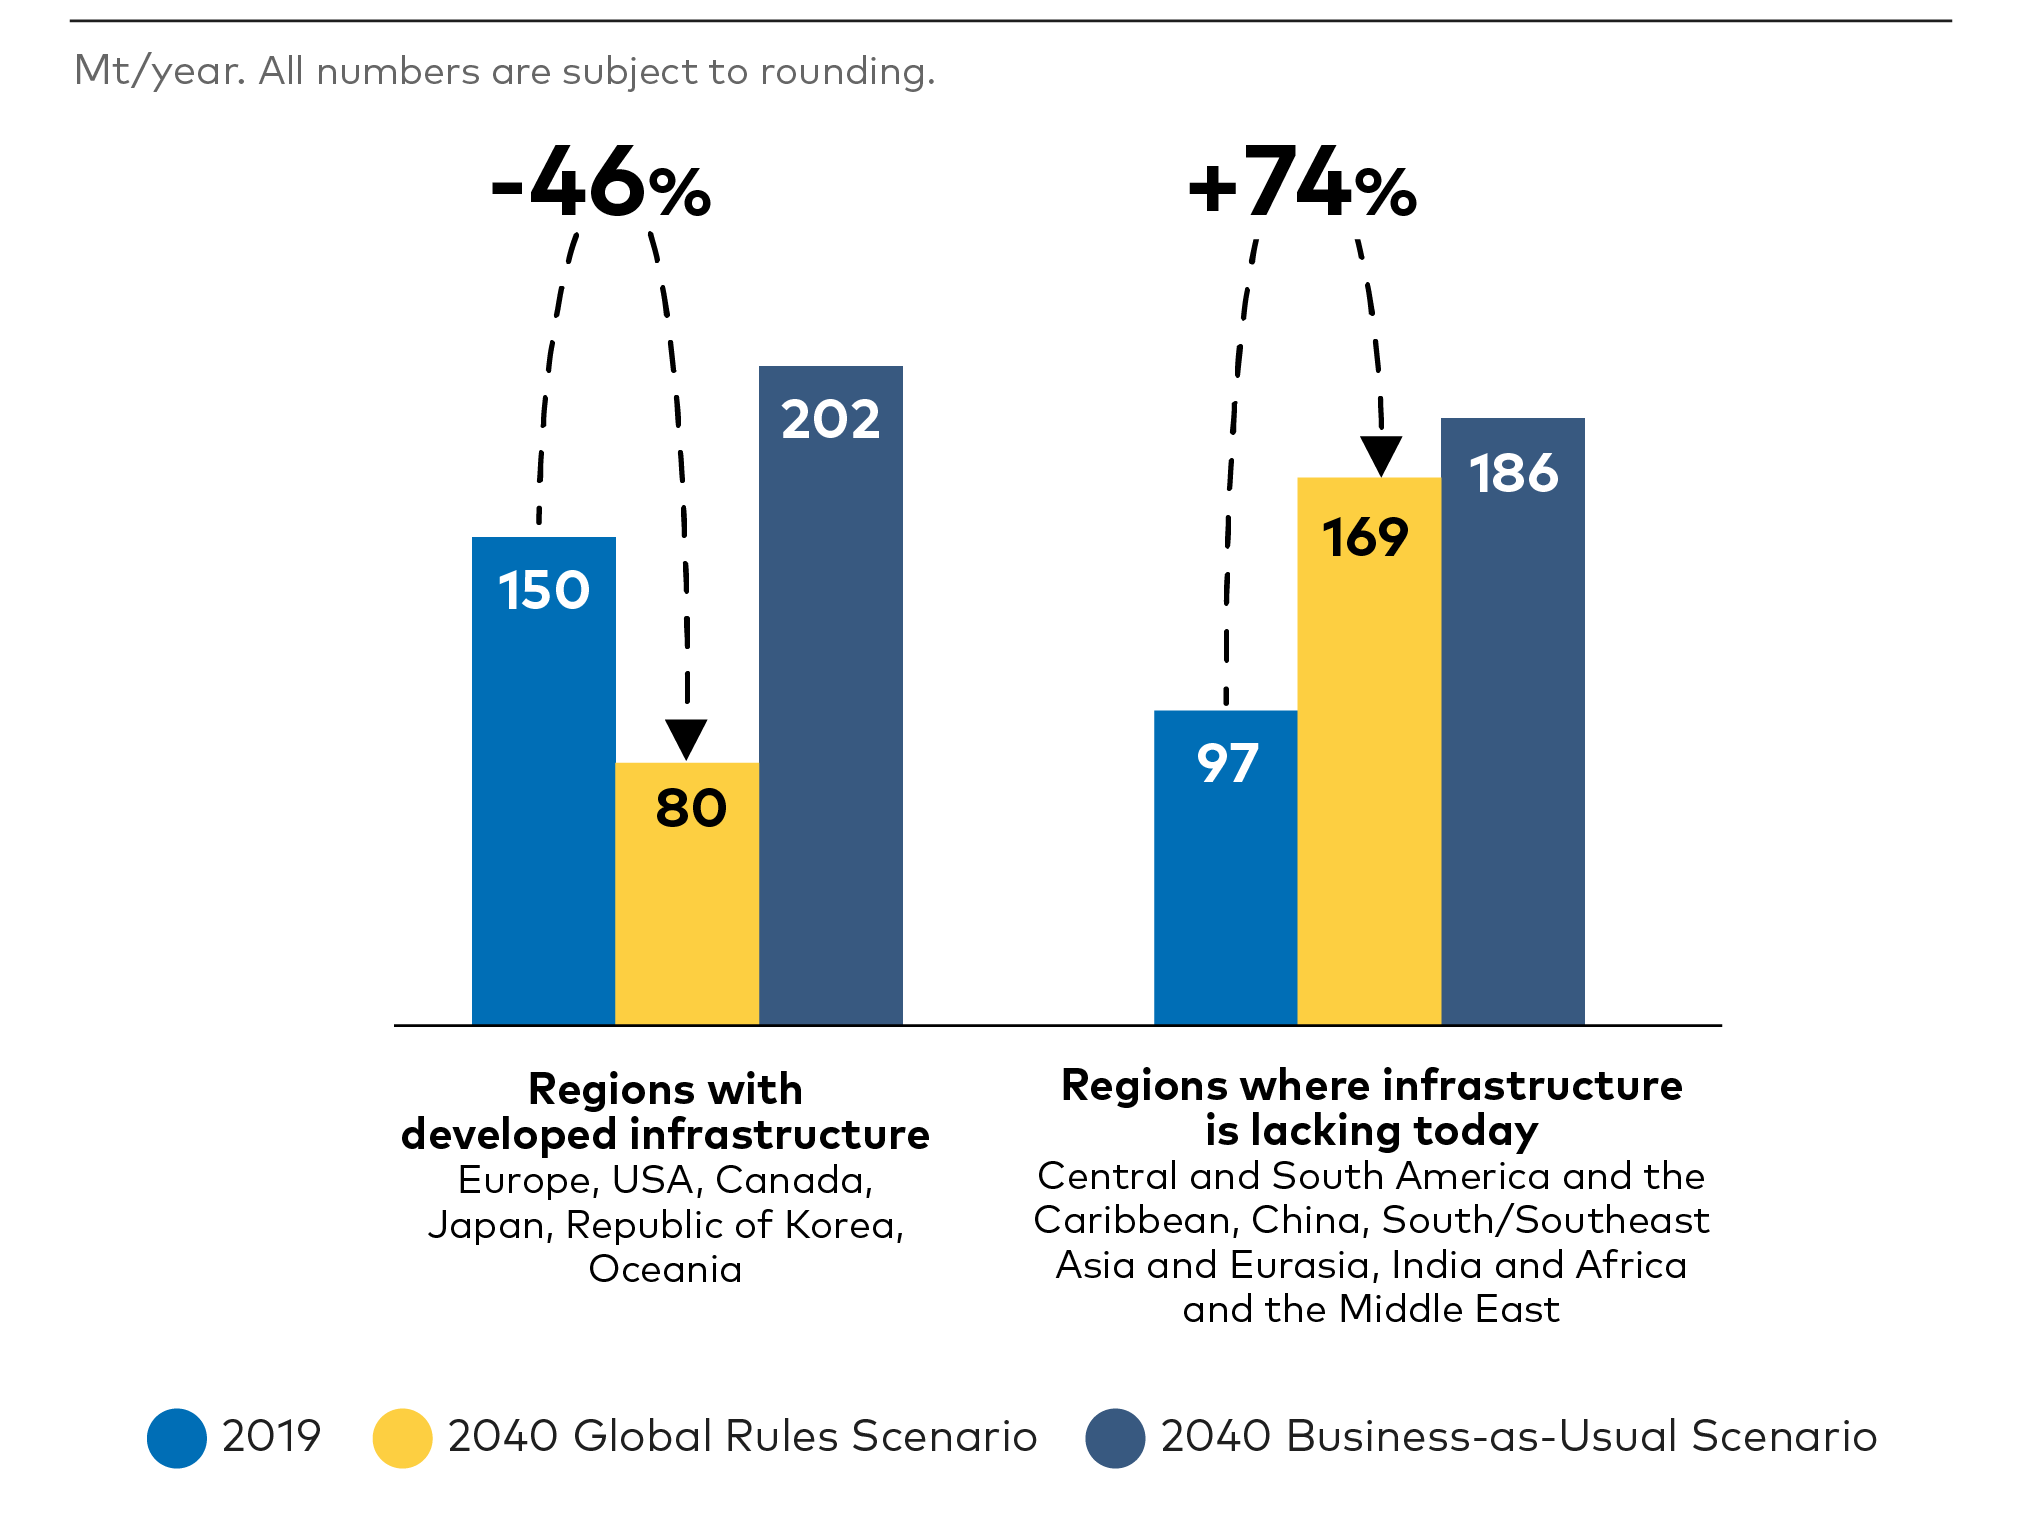
FIGURE 15
Plastic waste volumes ending in controlled disposal
The Global Rules Scenario would result in a 46% decrease in controlled disposal by 2040 relative to 2019 levels in regions that have advanced infrastructure today. However, in regions that lack such infrastructure, despite all e˙orts, there would be a 74% increase in controlled disposal by 2040 relative to 2019 levels.
Disposal volume changes between 2019 and the 2040 Global Rules Scenario in geographies balance globally:
The volumes of plastic waste ending in controlled disposal in the Global Rules Scenario entail a reduction in countries with existing waste management infrastructure, and an increase in those lacking infrastructure today. However, in global terms, the volumes ending in controlled disposal by 2040 result in similar levels to 2019 but changing in geographies.
Disposal type Mt / year | 2019 | 2040 Global Rules Scenario | 2040 Business-as-usual Scenario |
|---|---|---|---|
Engineered landfill | 172 | 178 | 254 |
Incineration with Energy Recovery | 75 | 71 | 134 |
Total | 247M | 249M | 388M |

Policy Intervention 11
Restrictions on plastic waste trade
to prevent exports to areas with limited capacity
In the Global Rules Scenario, countries would manage their own waste by developing local infrastructure. Plastic waste exports from high-income regions to low, middle and upper-middle-income regions can result in the transfer of responsibility from advanced waste management systems to developing waste management systems. Although China’s waste import ban
China’s waste import ban entered into force in 2018 as part of the Chinese National Sword Regulation.
Brooks et al. (2018). The Chinese import ban and its impact on global plastic waste trade.
EIA. (2023). Plastic Waste Power Play: The offshoring and recycling displacement involved in trying to recycle EU plastic waste.
EIA. (2021). The Truth Behind Trash: The scale and impact of the international trade in plastic waste.
Restrictions on plastic waste trade would prevent the export of waste to regions with limited capacity or resources
Controls are already in place through the Basel Convention, which regulates the movement of plastic waste across international borders, particularly of any waste deemed hazardous. Through the Basel Convention Plastic Waste Amendments, its controls are also expanding. The Global Rules Scenario assumes that these restrictions would be extended to apply globally to all plastic waste exports, while acknowledging that there could be exemptions – for example, in the case of shared agreements between countries (eg, the EU Single Market) on joint infrastructure; or in the case of small countries or islands that do not have the space or critical scale to develop infrastructure. The Global Rules Scenario assumes this policy intervention so that recycling and waste management capacity would increase where consumption and waste is generated.

Policy Intervention 12
Standards on the controlled disposal of waste that cannot be prevented or safely recycled
As last resort option to prevent plastic mismanaged
The Global Rules Scenario assumes global implementation of standards on the controlled disposal of waste in all geographies. For plastic waste sent to controlled disposal through landfill or incineration, the analysis assumes the split between these technologies that each region has today. This means that in regions which currently do not have incineration, the Global Rules Scenario would rely on engineering landfills when new disposal capacity was required.
This is because incineration with energy recovery can produce higher GHG emissions per tonne of plastic waste managed, as well as incurring higher costs relative to landfill.
The Pew Charitable Trusts and Systemiq. (2020). Breaking the Plastic Wave: A Comprehensive Assessment of Pathways Towards Stopping Ocean Plastic Pollution.
In the case of landfill, environmental standards are also important – for example, to ensure the establishment of impervious top and bottom layers, and reinforcements against toxic liquids that could contaminate groundwater
Conserve Energy Future. (2023). What is Sanitary Landfill and Difference Between Sanitary Landfill and Open Dumping.
The Global Rules Scenario requires enforcement of environmentally sound controlled disposal of plastic not prevented or not recycled

Policy Intervention 13
Mitigation and removal programmes for legacy plastics in the environment
although still prioritising solutions that prevent releases in the first place
Mitigation and removal programmes for legacy plastics have not been modelled quantitatively (see ‘Objective and scope’).
The Global Rules Scenario primarily focuses on preventing incoming annual mismanagement of plastics volumes rather than removal and management of legacy mismanaged plastics. It does so in order to address the root causes of this mismanagement, aiming to prevent the Business-as-Usual Scenario estimate of annual plastics released to land and water environments growing from 28 Mt in 2019 to 49 Mt by 2040. The Global Rules Scenario focuses on minimising mismanagement and releases, assuming that the allocation of resources and capital towards such activities would have the greatest impact. The reasons for this focus include the substantial costs associated with some clean-up programmes for legacy plastics and the inability of current clean-up technologies to remove small particles from oceans.
Cordier M. & Uehara, T. (2019). How much innovation is needed to protect the ocean from plastic contamination?
Given the cost of removing legacy plastics, the Global Rules Scenario would focus on preventing the release of new plastic volumes
Notwithstanding this priority, however, removal programmes for legacy plastics could still have a role to play, even where the root problem has not yet been resolved. For example, beach clean-ups are an effective way to raise awareness and may be an enabler for prevention. Data obtained from clean-ups can identify the items that are most likely to end up as mismanaged and inform policy accordingly.
UNEP. (2018). Mapping of Global Plastics Value Chain and Plastics Losses to the Environment: With a Particular Focus on Marine Environment.

TRANSVERSAL PILLAR E
Microplastics
Prevent the use of microplastics and reduce microplastics releases into the environment
The analysis in this report includes primary microplastics from personal care products, pellets, tyre abrasion, paints and textiles, as these are regarded as the main sources of primary microplastics.150,151,152 Secondary microplastics were excluded from the analysis, as they originate from the breakdown of macroplastics, already addressed in Pillars A to D. Research and data on microplastics is limited, and direct evidence of the efficacy of some of the suggested policies is lacking. The analysis estimates the theoretical potential of policy interventions depicted in table 2, based on best available data and expert interviews. However, further evidence and learnings from actual implementations are required. Other potential sources of microplastics, such as plastics used in agriculture, were not included due to a lack of available data.
Microplastics are a complex group of mismanaged plastics, for which solutions are currently lacking
Annual primary microplastics emissions were estimated at 9 Mt in 2019; and without effective policy measures, these could increase to 16 Mt by 2040 under the Business-as-Usual Scenario.
These results build on analysis from previous reports such as Breaking the Plastic Wave153, while expanding the scope to encompass microplastics from paints.
Microplastics are challenging to collect and capture, given their size, the diversity of sources from which they originate and their ubiquity. Some microplastics emissions result from the intentional incorporation of microplastics within specific products (eg, microbeads added to personal care products); others from product mishandling (eg, pellets emissions throughout the supply chain). By comparison, microplastics emissions from paint, tyres and textiles are more complex to prevent or control, as they are largely driven by abrasion and wear and tear during the use and/or washing of plastic products.
TABLE 2
Policies to explore for microplastics
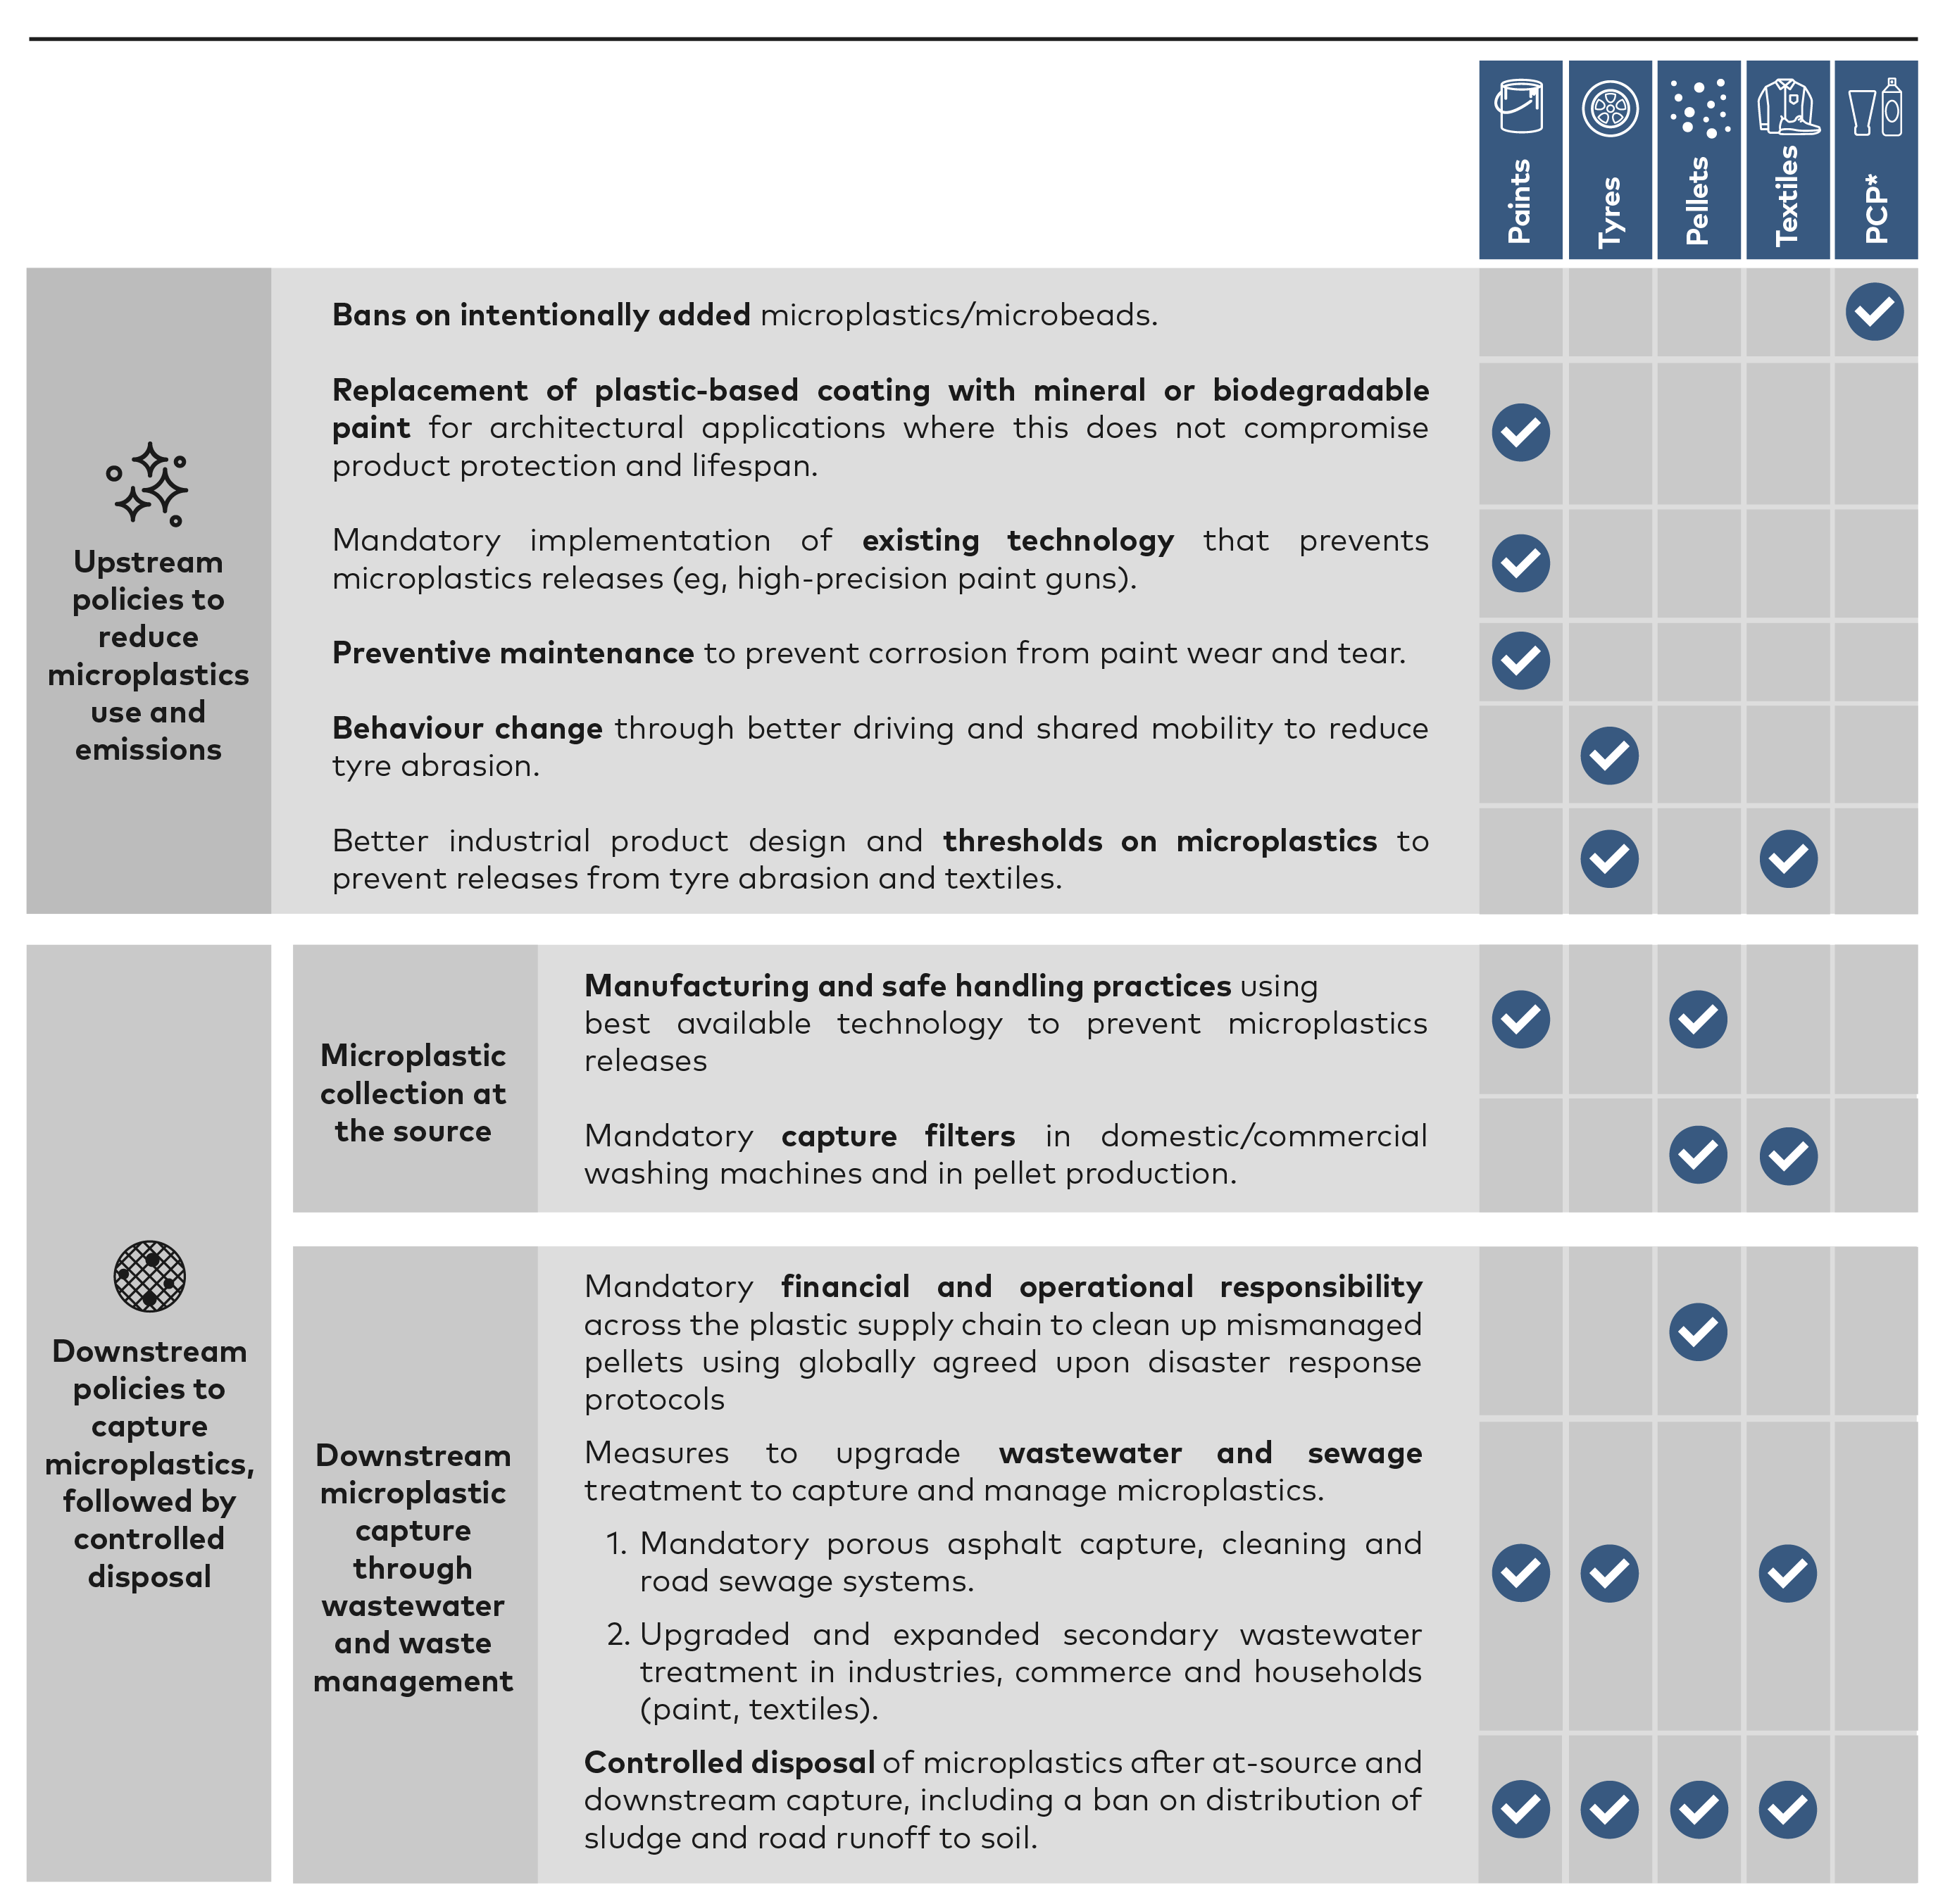
*PCP = Personal Care Products
Microplastics emissions are expected to increase by 2040 due to higher consumption of products that generate them. Tyres and paints alone accounted for more than 90% of microplastics emissions in 2019. Although today high-income countries produce more microplastics, the growing consumption forecast in upper and lower-middle-income countries by 2040 is expected to lead to increased pellet handling, increased use of tyres and increased use of paint for infrastructure. Hence, microplastics emissions are estimated to grow from 9 Mt in 2019 to 16 Mt by 2040 under the Business-as-Usual Scenario. Figure 16 compares the volumes of microplastics emissions from each of the five sources of microplastics included in the analysis, in 2019 and in 2040 for the Business-as-Usual Scenario and the Global Rules Scenario.
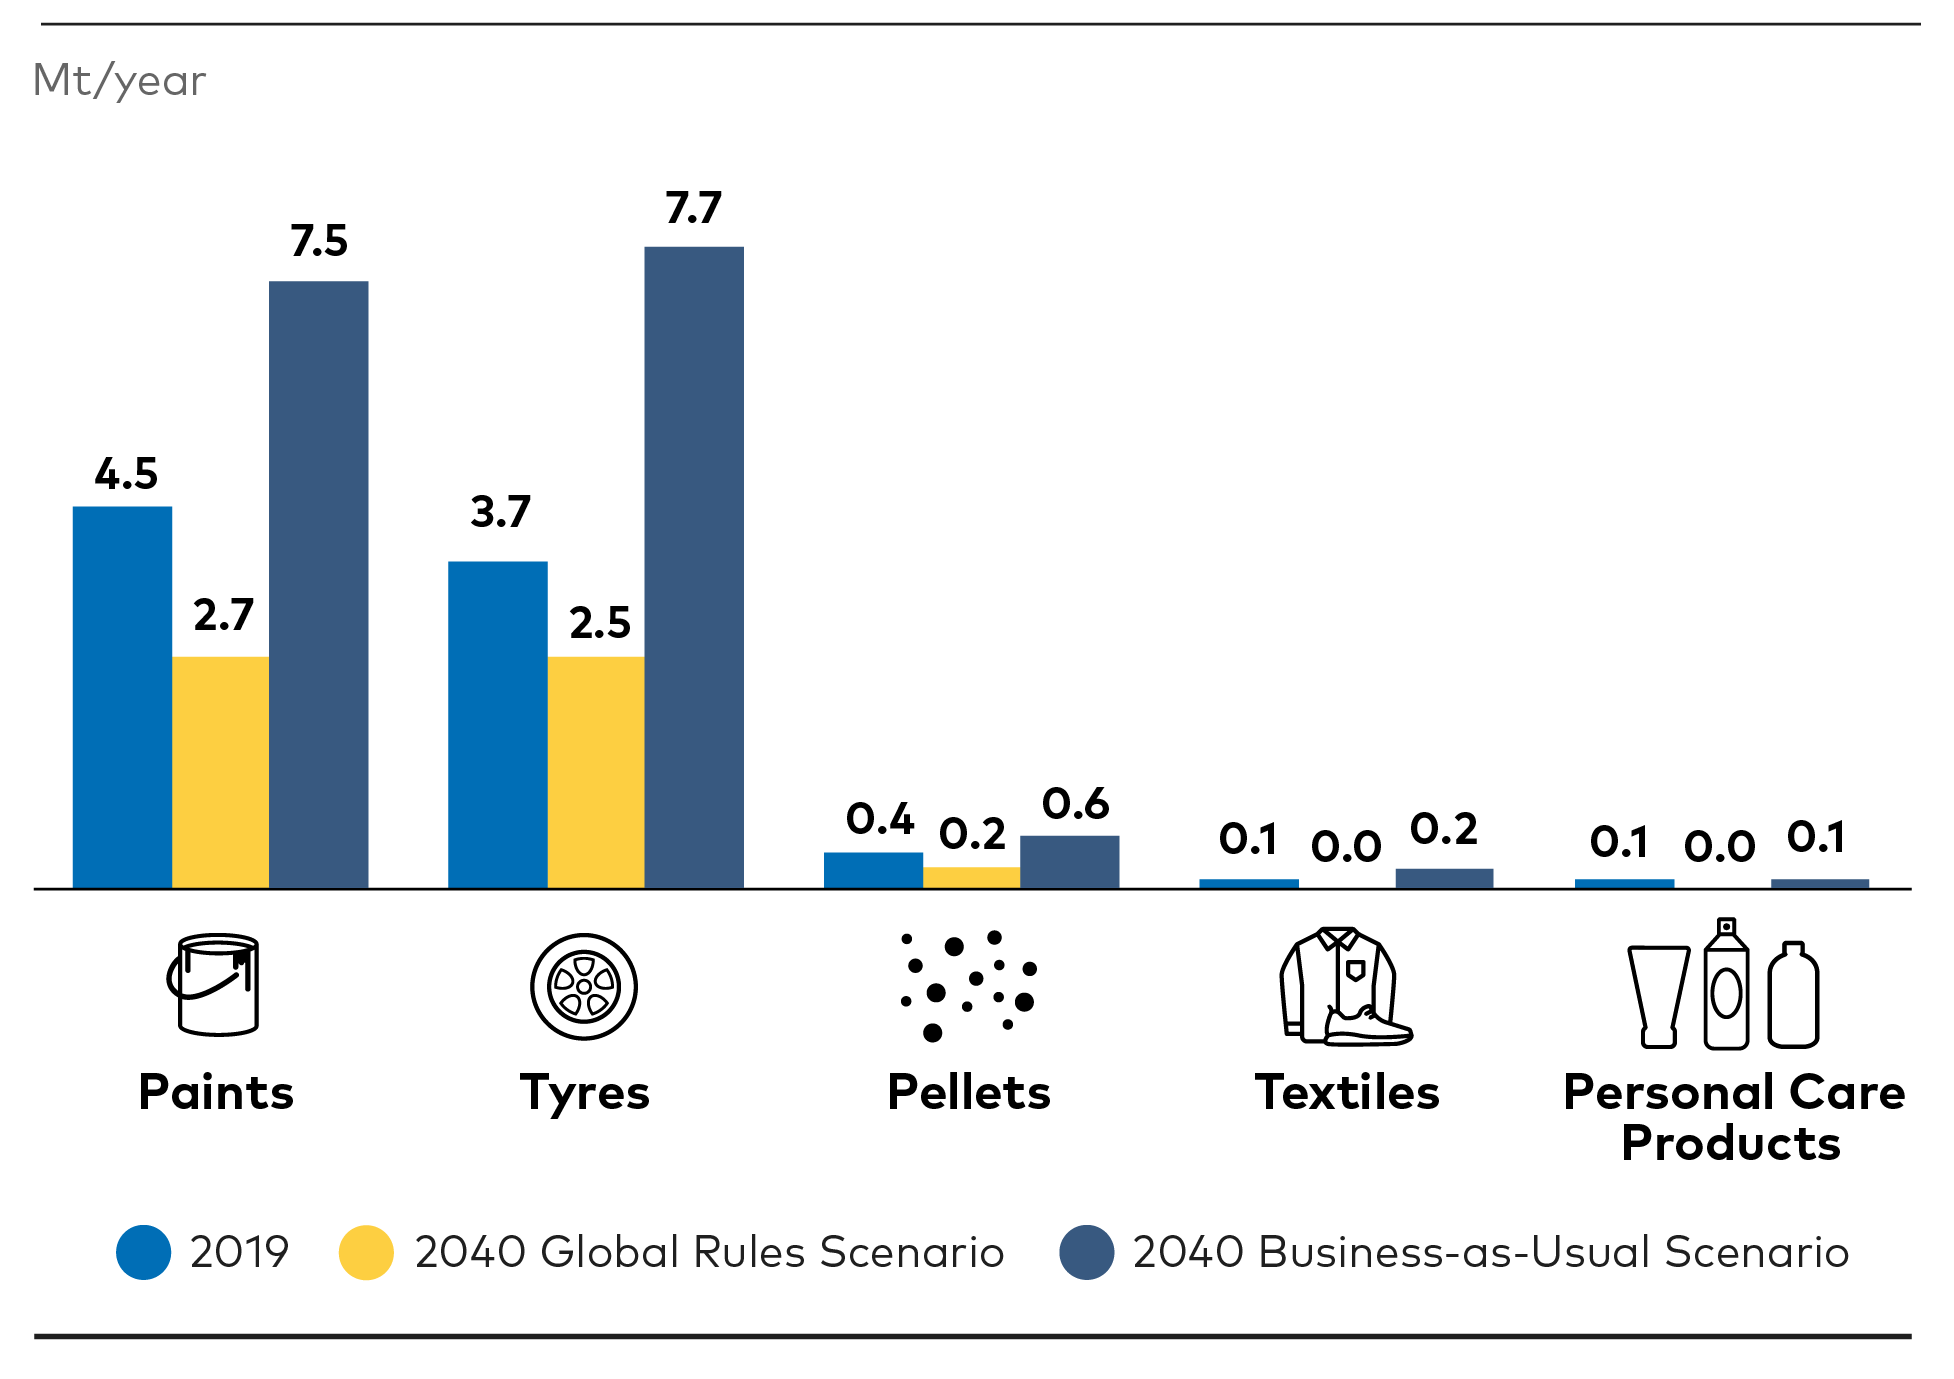
FIGURE 16
Microplastic releases into the environment by source
The Global Rules Scenario would not fully solve the problem of microplastic releases by 2040, despite the policies considered; 5 Mt would still be released into the environment annually.
Under the Global Rules Scenario, 5 Mt of microplastics would still be released into the environment annually by 2040. While this figure is lower than the 9 Mt in 2019 and the 16 Mt projected under the Business-as-Usual Scenario, this is still an area that requires further solutions.
The reduction in microplastics emissions under the Global Rules Scenario would be achieved through:
- prevention of the use of microplastics at source and interventions to reduce microplastics emissions through policies that incentivise elimination, design improvement and behaviour change; and
- policies to capture microplastics both at the point of emission and through downstream wastewater management.
The 5 Mt of microplastics that would still end up being released into the environment would be mainly due to wear and tear of paint and tyre abrasion.

Policy Intervention #14
Upstream policies to reduce microplastics use and emissions
trough bans, substitution, better product designs, preventive maintenance and behavioural change
Upstream policies to reduce the production of microplastics would involve a large range of policies, such as bans on intentionally added microplastics, substitution, better product design, preventive maintenance, new technologies and behaviour change.

Although these represent a small proportion of overall microplastics emissions, the Global Rules Scenario assumes a global ban on intentionally added primary microplastics. Many countries have already taken this step: full or partial bans on microplastics in personal care products have been introduced in the USA, Canada, the EU, the UK, New Zealand, the Republic of Korea, China and Taiwan, among others. A global ban on intentionally added primary microplastics in personal care products would have little impact on the functionality of these products.
Guerranti C., et al. (2019). Microplastics in cosmetics: Environmental issues and needs for global bans.
Anagnosti L., et al. (2021). Worldwide actions against plastic pollution from microbeads and microplastics in cosmetics focusing on European policies. Has the issue been handled effectively?
Boucher, J. and Friot D. (2017). Primary Microplastics in the Oceans: A Global Evaluation of Sources.
The EU has adopted the REACH Committee’s proposal to impose restrictions on a broader range of products containing intentionally added microplastics, such as fertilisers, detergents and medical devices.
European Chemicals Agency. (2021). Registry of restriction intentions until outcome.

The largest range of interventions are aimed at reducing microplastics emissions from paint at source, due to the broad range of applications for paint (eg, architectural, marine, industrial, road markings) – most of which are essential to protect and increase the lifespan of building and materials.
Paruta P. et al., Environmental Action. (2022). Plastic Paints the Environment.
A proportion of microplastics emissions from paint could be eliminated through a shift from plastic-based to non-plastic-based paint. This could apply to a large majority of architectural paint applications, where it would have less impact on products, protection and lifespans.
Paruta P. et al., Environmental Action. (2022). Plastic Paints the Environment.
Beyond elimination, reducing microplastics emissions from paint would involve solutions to prevent releases both during application and from wear and tear. While better industrial technology and practices (eg, the use of high-precision spray guns) could help to reduce releases during application, solutions are lacking for releases from wear and tear – by far the main source of microplastics emissions.
Although there is little evidence of the potential of these interventions, the adoption of maintenance and prevention measures in paint applications (architectural, marine, industrial, transportation, road markings) could help to prevent wear and tear. For industrial applications in particular, nascent preventive technologies can detect small corrosions, enabling a restricted area to be maintained instead of the corrosion spreading and causing further wear and tear, necessitating the removal and reapplication of paint.
However, paint wear and tear are hard to control and will remain the primary challenge in reducing microplastics emissions.

In addition to the transition towards sustainable fashion highlighted in previous sections, clear design rules for textiles and better production practices (eg, cutting methods) are important interventions to address microplastics emissions from textiles. These could significantly reduce the release of microplastics during production,
Cai Y., et al. (2020). The origin of microplastic fiber in polyester textiles: The textile production process matters.
De Falco F., Cocca M., Avella M., Thompson R.C. (2020) Microfiber Release to Water, Via Laundering, and to Air, via Everyday Use: A Comparison between Polyester Clothing with Differing Textile Parameters.
Quantis and Environmental Action. (2020). The Plastic Leak Project Guidelines.
Napper I., Thompson, R.C. (2016) Release of synthetic microplastic plastic fibres from domestic washing machines: Effects of fabric type and washing conditions

The Global Rules Scenario accounts for reductions associated with better driving behaviour,
Better driving behaviour involves the adoption of environmentally friendly practices such as driving at lower speeds, maintaining the recommended air pressure in tyres and avoiding abrupt acceleration and braking to reduce fuel consumption and tyre abrasion.
Allgemeiner Deutscher Automobil Club (ADAC). (2022). Tyre abrasion or road test.
Johannesson M., Lithner D. (2022). Potential policy instruments and measures against microplastics from tyre and road wear.
Quantis and Environmental Action. (2020). The Plastic Leak Project Guidelines.

Policy Intervention 15
Downstream policies to capture microplastics, followed by controlled disposal
prioritising capture at source over capture through wastewater treatment systems
Where microplastic prevention is not possible and microplastics are emitted, their capture at the point of emission should be prioritised over downstream capture through waste and wastewater systems, which would require substantial infrastructure and investment. The captured microplastics should then be disposed of in a controlled manner. Together, these two sets of policy interventions applied in the Global Rules Scenario would lead to 49% of microplastics emissions ending up in controlled disposal, compared to 11% in 2019.
Downstream policies to capture microplastics at the point of emission

Although a reduction in virgin plastic consumption (see Pillar A) would automatically result in a reduction in pellet production – and, by extension, in the risk of plastic pellet releases – an increase in recycling could increase the risk of releases during the recycling process unless clear actions are taken.
Brown E. et al. (2023). The potential for a plastic recycling facility to release microplastic pollution and possible filtration remediation effectiveness.
Operation Clean Sweep (n.d.) Homepage.

Microplastics emissions during paint removal could be reduced through the mandatory adoption of vacuum assist sanding technology in combination with dust extraction systems for indoor removal.
Liverseed D. et al. (2012). Comparative Emissions of Random Orbital Sanding between Conventional and Self-Generated Vacuum Systems.

While improvements in textile design should be the priority, the implementation of filters and capture systems in washing machines could help to mitigate microplastics emissions from textiles.
Quantis and Environmental Action. (2020). The Plastic Leak Project Guidelines.
Ministère de l'Écologie, France. (2020). The Anti Waste Law In The Daily lives of the French people - What Does That Mean In Practice?
Downstream policies to capture microplastics through wastewater management
If microplastics cannot be captured at source – which is commonly the case for microplastics from wear and tear of tyres, textiles and paint – capture through waste and wastewater systems followed by controlled disposal remains a last resort option. However, this would require significant infrastructure and investment, and is less realistic and feasible in terms of implementation.

In the unfortunate event of a pellet transport accident or industrial mishandling, it is essential that producers and their supply chains are held financially and operationally responsible for cleaning up the pellet release using globally agreed disaster response protocols. As international frameworks and national policies have not yet sufficiently addressed this problem,
Karlsson T. et al. (2018). The unaccountability case of plastic pellet pollution.

The capture of microplastics from tyre abrasion through porous asphalt roads and their collection through bi-yearly road vacuuming or water cleaning is one of the few ideas proposed in this space.
Verschoor A., et al. (2016). Emission of microplastics and potential mitigation measures: Abrasive cleaning agents, paints and tyre wear.
Rasmussen L. (2023). Permeable pavements: A possible sink for tyre wear particles and other microplastics?
Kole P. et al. (2017). Wear and Tear of Tyres: A Stealthy Source of Microplastics in the Environment.


In addition to broader positive health benefits, upgraded wastewater systems would improve the management of microplastics emissions from paints and textiles in particular. Even with the extensive policy measures described above, a relevant share of microplastics would still end up in the wastewater system (eg, from areas that are not connected to the wastewater system), where the volumes that can be captured vary between primary, secondary and tertiary systems.
Wastewater systems are classified based on the effectiveness of their treatment and filtering levels, with primary systems (often found in lower-income or rural areas) being the least efficient at capturing microplastics and tertiary systems (most common in higher-income, urban areas) the most efficient.
Eunomia. (2018). Investigating Options for Reducing Releases in the Aquatic Environment of Microplastics Emitted by Products.
Finally, sewage sludge containing microplastics captured through wastewater systems should be prevented from re-entering the environment through land applications (eg, agriculture).
European Chemicals Agency (ECHA). (2018). Intentionally added microplastics likely to accumulate in terrestrial and freshwater environments.
Despite these policy interventions, the Global Rules Scenario would not fully eliminate microplastics releases. An estimated 5 Mt of microplastics would still be released annually into the environment by 2040 – primarily from tyre abrasion and paint wear and tear – making microplastics a main source of plastic releases into the environment for which insufficient technical solutions exist.
While the Global Rules Scenario would dramatically reduce plastic mismanagement, further solutions would be required for those microplastics that still end up being released into the environment by 2040 – primarily from paint and tyre wear and tear, but also from textiles, especially due to open-water handwashing (in areas where washing machine ownership rate is low) and in areas with limited wastewater systems.
Laitala L., Klepp I.G., Henry B.K. (2018). Use phase of apparel: A literature review for Life Cycle Assessment with focus on wool.
Such actions would be particularly important as the scientific evidence confirms that microplastics and environmental toxicants can have a negative impact on wildlife through ingestion, on plant growth and on human health through the food chain (see Box 2). While further research is required to precisely estimate the extent of their impact on human health, the precautionary principle should nonetheless be applied.
Box 5
This report’s approach to determining the scale of each pillar
When determining the optimal scale and priority of different solutions across the plastic lifecycle, a number of constraints and trade-offs must be considered with regard to their economic, environmental and social impacts.

PILLAR A
Reduce virgin plastic production and consumption
Reduce virgin plastic production and consumption
Why is this pillar included?
Past studies
The Pew Charitable Trusts and Systemiq. (2020). Breaking the Plastic Wave: A Comprehensive Assessment of Pathways Towards Stopping Ocean Plastic Pollution.
OECD. (2022). Global Plastics Outlook: Economic Drivers, Environmental Impacts and Policy Options.
What are the limitations when scaling this pillar?
These solutions would result in the elimination of plastic, a shift to less consumption-intensive models or the replacement of plastic with other materials of equivalent utility.
Options to reduce virgin plastics can be limited by their technical and economic feasibility. For instance, the ramping up of reuse models can be limited by the economics and the pace of deploying reverse logistics infrastructure at scale. If other materials replace plastics, better environmental, health and social performance should be ensured – for example through case-by-case LCAs. If this is overlooked, there is a risk of forcing regrettable substitutions and unintended consequences (eg, higher GHG emissions, food waste, and land or water use). Finally, limitations can also be social or behavioural if affordability, safety or convenience is compromised; or if livelihoods are negatively impacted.
Approach in this report
Reduction of virgin plastic volumes should be maximised as long as regrettable substitutions are avoided and a just transition is ensured.

PILLAR B
Eliminate avoidable and problematic plastics and chemicals
Eliminate avoidable and problematic plastics and chemicals
Why is this pillar included?
In addition to posing direct risks to human health and the environment, avoidable and problematic plastics and chemicals can hinder circularity and have a higher likelihood of being mismanaged. If plastic production increased as projected in the Business-as-Usual Scenario, these impacts would heighten.
What are the limitations when scaling this pillar?
The elimination of avoidable plastics has similar constraints to those outlined in Pillar A, requiring that regrettable substitutions be avoided and a just transition ensured.
The phaseout of problematic plastics and chemicals should also ensure product safety (eg, performance of fire retardants or tyres); and time and resources would be required to test substances through a scientific process to identify which should be classified as problematic and phased out.
Approach in this report
The Global Rules Scenario calls for the introduction of common global criteria and the phaseout of avoidable and problematic plastics.

PILLAR C
Expand safe circularity via reuse, durability, and recycling
Expand safe circularity via reuse, durability, and recycling
Why is this pillar included?
Expanding a product’s use phase through reuse models or durable designs prevents plastic waste. Once a product has become waste, the alternatives are either collection and recycling or controlled disposal through engineered landfills or incinerators. Recycling is preferred over controlled disposal as it prevents the production of new virgin plastic, emits less GHG and requires less capital and operational costs.
What are the limitations when scaling this pillar?
The main constraint to scaling circularity is inadequate product design, which often hinders reuse or recyclability. Another constraint is the speed at which collection and sorting systems can grow and recycling capacities scale, driven by investment and the viability of the recycled plastic market (today only certain polymers in some markets are economically recyclable).
Approach in this report
Collection, sorting and recycling should be maximised for all plastics not prevented, to minimise controlled disposal and reduce virgin plastic volumes.

PILLAR D
Ensure the controlled disposal of waste that cannot be prevented or safely recycled
Ensure the controlled disposal of waste that cannot be prevented or safely recycled
Why is this pillar included?
Controlled disposal methods (engineered landfill and incineration with energy recovery) are linear solutions that lead to higher resource use and worse environmental impacts (eg, GHG emissions, land use, risk of water/land contamination if improperly managed) and health impacts. However, for waste that cannot be prevented or recycled, controlled disposal would remain the last resort to prevent mismanaged plastic waste.
What are the limitations when scaling this pillar?
The pace at which collection and controlled disposal infrastructure can scale limits control disposal. Trade-offs between incineration with energy recovery (GHG emissions, cost, “lock-in” effects) and engineered landfills (land utilisation) are presented in Policy Intervention #12.
Approach in this report
Controlled disposal would be used only for plastic waste that cannot be prevented or recycled, assuming the same split between landfill and incineration for each region as of today. Regions without incineration would rely on engineering landfill for any incremental capacity needed.

TRANSVERSAL PILLAR E
Prevent the use of microplastics and reduce microplastics releases into the environment
Prevent the use of microplastics and reduce microplastics releases into the environment
Why is this pillar included?
Microplastics present hazards and risks to humans and wildlife, as well as a high probability of being released into the environment.
What are the limitations when scaling this pillar?
There is a lack of available solutions to prevent microplastics releases, or at least to maximise capture, as well as enough data and research.
Approach in this report
The priority is on preventing the use of microplastics and reducing microplastic releases. Where microplastic emissions cannot be reduced, capture at source is considered the most efficient and less costly option, leaving capture through downstream wastewater management systems as a last resort.