Business-as-Usual Scenario
Without global action, annual levels of mismanaged plastic volumes will continue to rise and could almost double from 110 Mt in 2019 to 205 Mt by 2040. Annual production of virgin plastics would increase from 430 Mt in 2019 to 712 Mt by 2040. Meanwhile, GHG emissions from plastic could increase from 1.9 GtCO2e in 2019 to 3.1 GtCO2e in 2040.
Plastic delivers high versatility, durability and convenience for thousands of applications at low cost. Its use started to gather pace in the 1950s and since then consumption has grown significantly year on year.
The model segments the analysis by eight geographic regions: 1) Europe, including Türkiye; 2) the USA and Canada; 3) Japan, the Republic of Korea, New Zealand and Australia; 4) Central and South America and the Caribbean; 5) China; 6) South/Southeast Asia and Eurasia (excluding countries in other groups); 7) India; and 8) Africa and the Middle East.
OECD. (2022). Global Plastics Outlook: Economic Drivers, Environmental Impacts and Policy Options
Food and Agriculture Organization (FAO). (2023). FishStat Database.
Paruta, P. et al., Environmental Action. (2022). Plastic Paints the Environment.
The Pew Charitable Trusts and Systemiq. (2020). Breaking the Plastic Wave: A Comprehensive Assessment of Pathways Towards Stopping Ocean Plastic Pollution.
The Pew Charitable Trusts and Systemiq. (2020). Breaking the Plastic Wave: A Comprehensive Assessment of Pathways Towards Stopping Ocean Plastic Pollution.
The Business-as-Usual Scenario models the plastic system today and estimates the impact by 2040 of maintaining the current trajectory (as population and consumption per capita grow) on plastic stocks and flows across the value chain, including production and consumption; plastic waste; mismanaged plastic volumes; plastic releases into air, land or water; and GHG emissions.
The model segments the analysis both by region
The model segments the analysis by eight geographic regions: 1) Europe, including Türkiye; 2) the USA and Canada; 3) Japan, the Republic of Korea, New Zealand and Australia; 4) Central and South America and the Caribbean; 5) China; 6) South/Southeast Asia and Eurasia (excluding countries in other groups); 7) India; and 8) Africa and the Middle East.
FIGURE 3
Breakdown of plastic consumption in 2019
Plastic is used across a broad variety of economic sectors and applications around the world
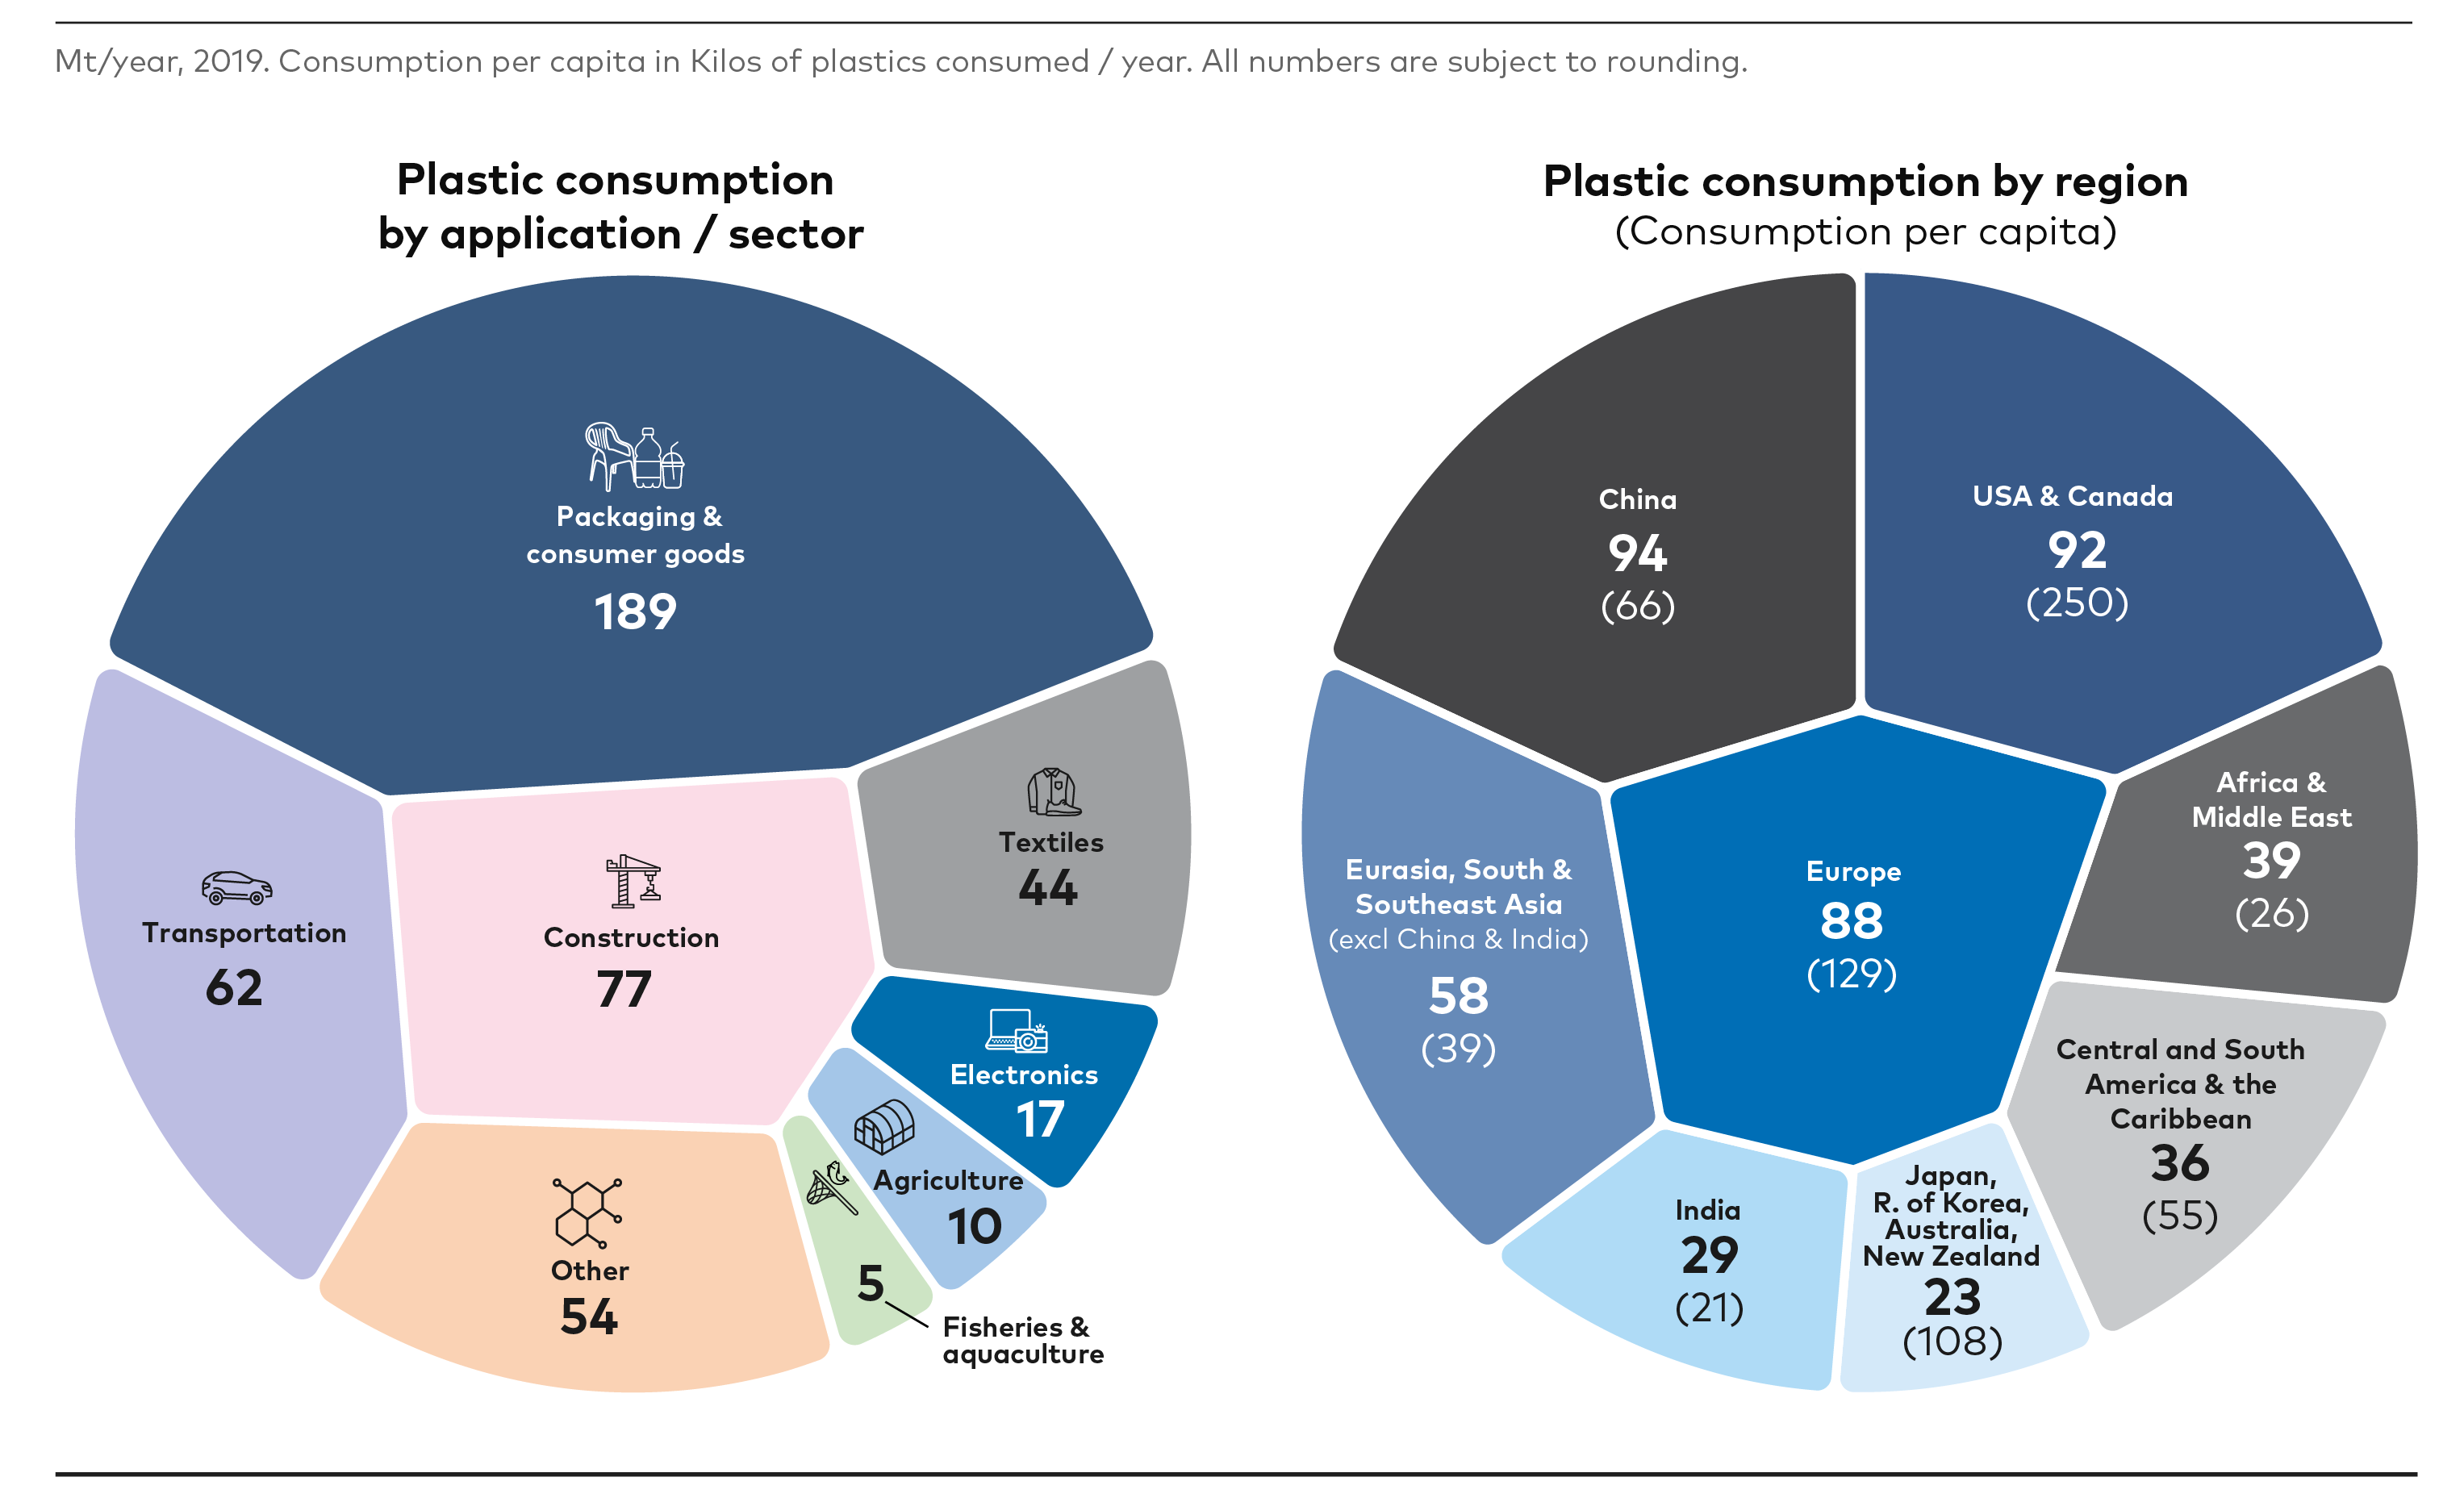
Plastic consumption per capita estimates for the modelling include all plastics consumed in a given region, including those from industry. Source: OECD Global Plastic Outlook, FAO, Environmental Action, UN population data, Systemiq analysis.
The analysis applies product lifespans across applications to estimate when material will become waste. From the annual waste volumes, the model estimates end-of-life fate by modelling the stocks and flows of plastic across the plastic lifecycle, using available data on collection, sorting, recycling etc. Of the estimated 385 Mt of plastic waste generated in 2019, 29 Mt were recycled; 246 Mt ended up in controlled disposal through incineration with energy recovery or landfill; and 110 Mt ( 28%) were mismanaged. Of the total mismanaged volume, it is estimated that 43 Mt ended up in dumpsites, 39 Mt were burned in the open and 28 Mt were released into land or water environments.
Circularity was marginal, with reuse and recycling rates of below 10% globally. This was driven by multiple factors, including product designs that do not account for end of life; the complexity and variety of polymers and their applications; a lack of collection and recycling infrastructure; and the absence of economic incentives to accelerate solutions. Most managed waste ends up in controlled disposal, via incineration with energy recovery and landfill. Figure 4 summarises the estimates for 2019.
FIGURE 4
End-of-life fate of plastic waste in 2019 by sector
Out of the 385m Mt of plastic waste generated, less than 10% was recycled and 28% was mismanaged.
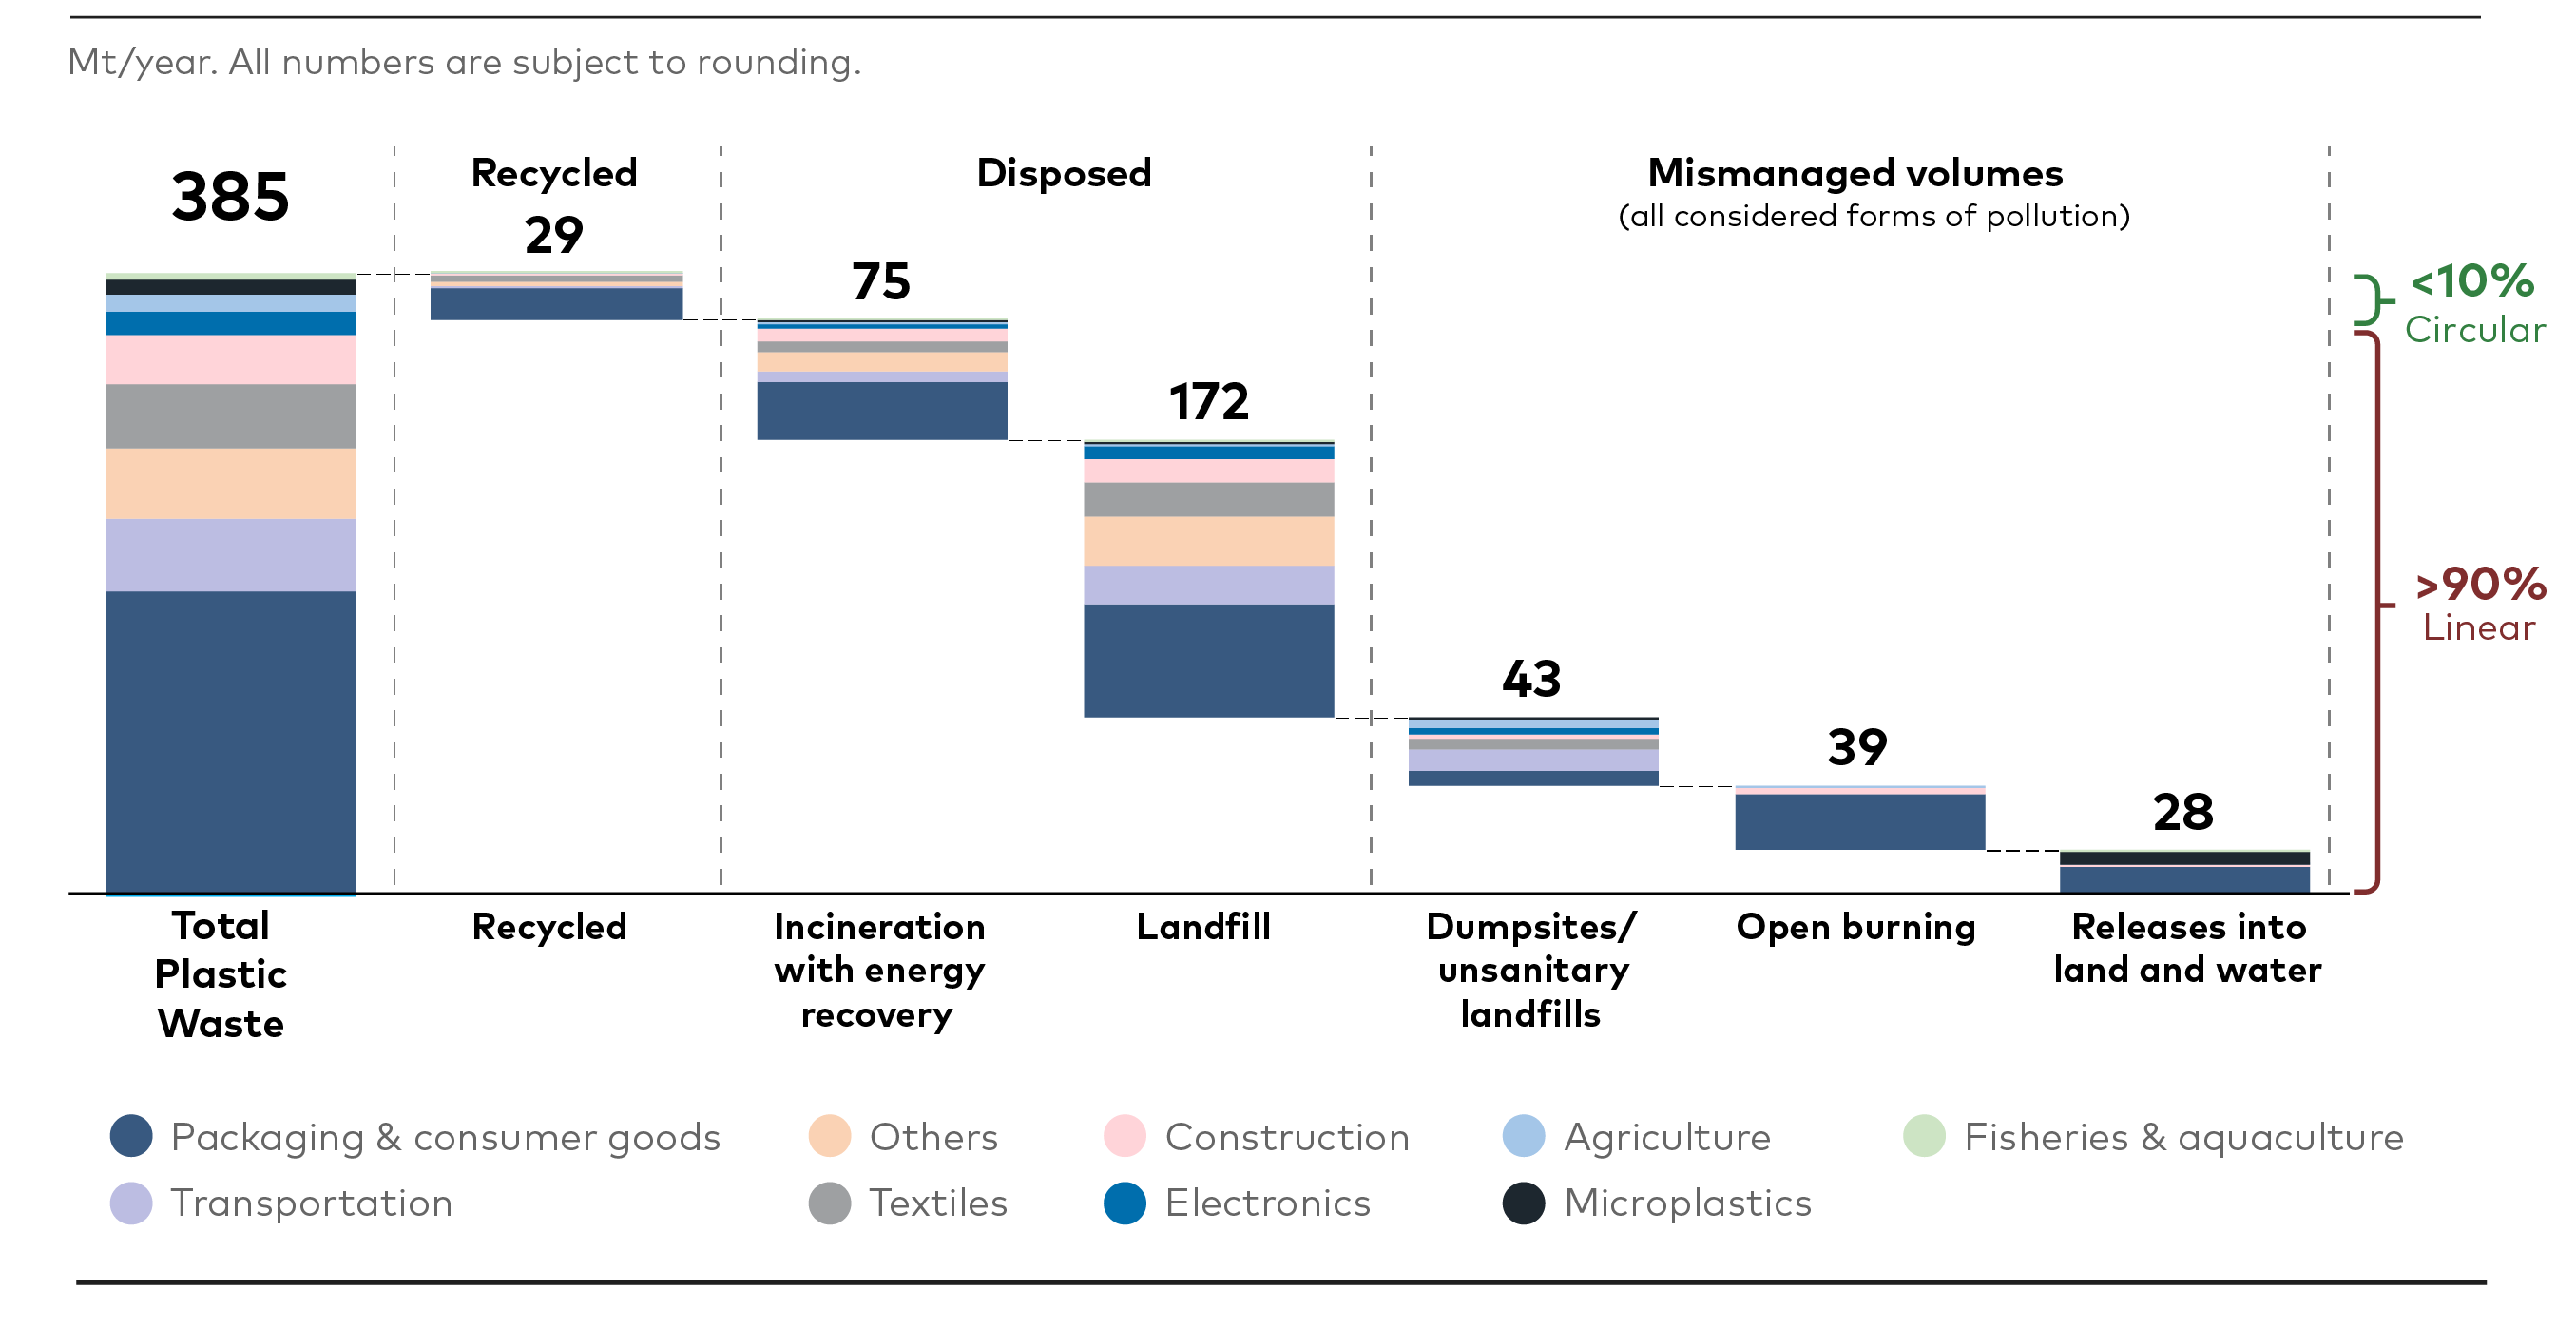
The main sources of mismanaged plastic are packaging and consumer goods, microplastics and fishing gear. Most open burning is estimated to come from plastic waste from packaging and consumer goods. Of the estimated 28 Mt of plastic released into land and water environments in 2019, packaging and consumer products accounted for 17 Mt, microplastics for 8–9 Mt and fishing and aquaculture plastics for 1–2 Mt. Other critical sources include textiles and agricultural applications, although the available data is generally limited.24
All these volumes would increase substantially if the current trajectory continues. The analysis suggests that the annual production of plastics would increase from ~460 Mt in 2019 (430 Mt estimated to be virgin and 29 Mt recycled) to 764 Mt by 2040 (712 Mt virgin and 52 Mt recycled). Annual volumes of plastic waste would increase from 385 Mt in 2019 to 646 Mt by 2040 and annual volumes of mismanaged plastic would almost double, from 110 Mt in 2019 to 205 Mt by 2040. Annual GHG emissions from the plastic system would rise from 1.9 GtCO2e in 2019 to 3.1 GtCO2e in 2040.
The Business-as-Usual Scenario considers forecasts on demographics and economic growth (and hence consumption per capita growth) to estimate future plastic demand by region and sector. Regions such as Europe, the USA, Canada, Japan, the Republic of Korea, New Zealand and Australia have high consumption per capita, but limited forecasted population growth. In regions such as India and African countries, both population and economic development – and thus consumption per capita – are projected to increase. In China, it is expected that the population will remain relatively stable by 2040, but consumption per capita will increase.
The regions where demographic and relative economic growth is higher also tend to lack infrastructure and have less resources to manage waste generated today. This would exacerbate the consequences of an already flawed plastic system over time.
The Business-as-Usual Scenario would see annual volumes of plastic waste generation reach 646 Mt by 2040 (see figure 5). Policies to reduce or eliminate plastics would not be implemented, including no scaling of new delivery models such as reuse. Recycling growth would be limited, increasing from 29 Mt per year in 2019 to 52 Mt per year by 2040, as systems to collect, sort and recycle plastics would not develop significantly. The increase in plastic waste would also lead to higher volumes ending up in incineration (from 75 Mt in 2019 to 134 Mt in 2040) and landfills (from 172 Mt in 2019 to 254 Mt in 2040). Finally, as plastic volumes increase in regions that lack the infrastructure or resources to develop management systems, volumes of mismanaged plastic would rise from 110 Mt in 2019 to 205 Mt in 2040.
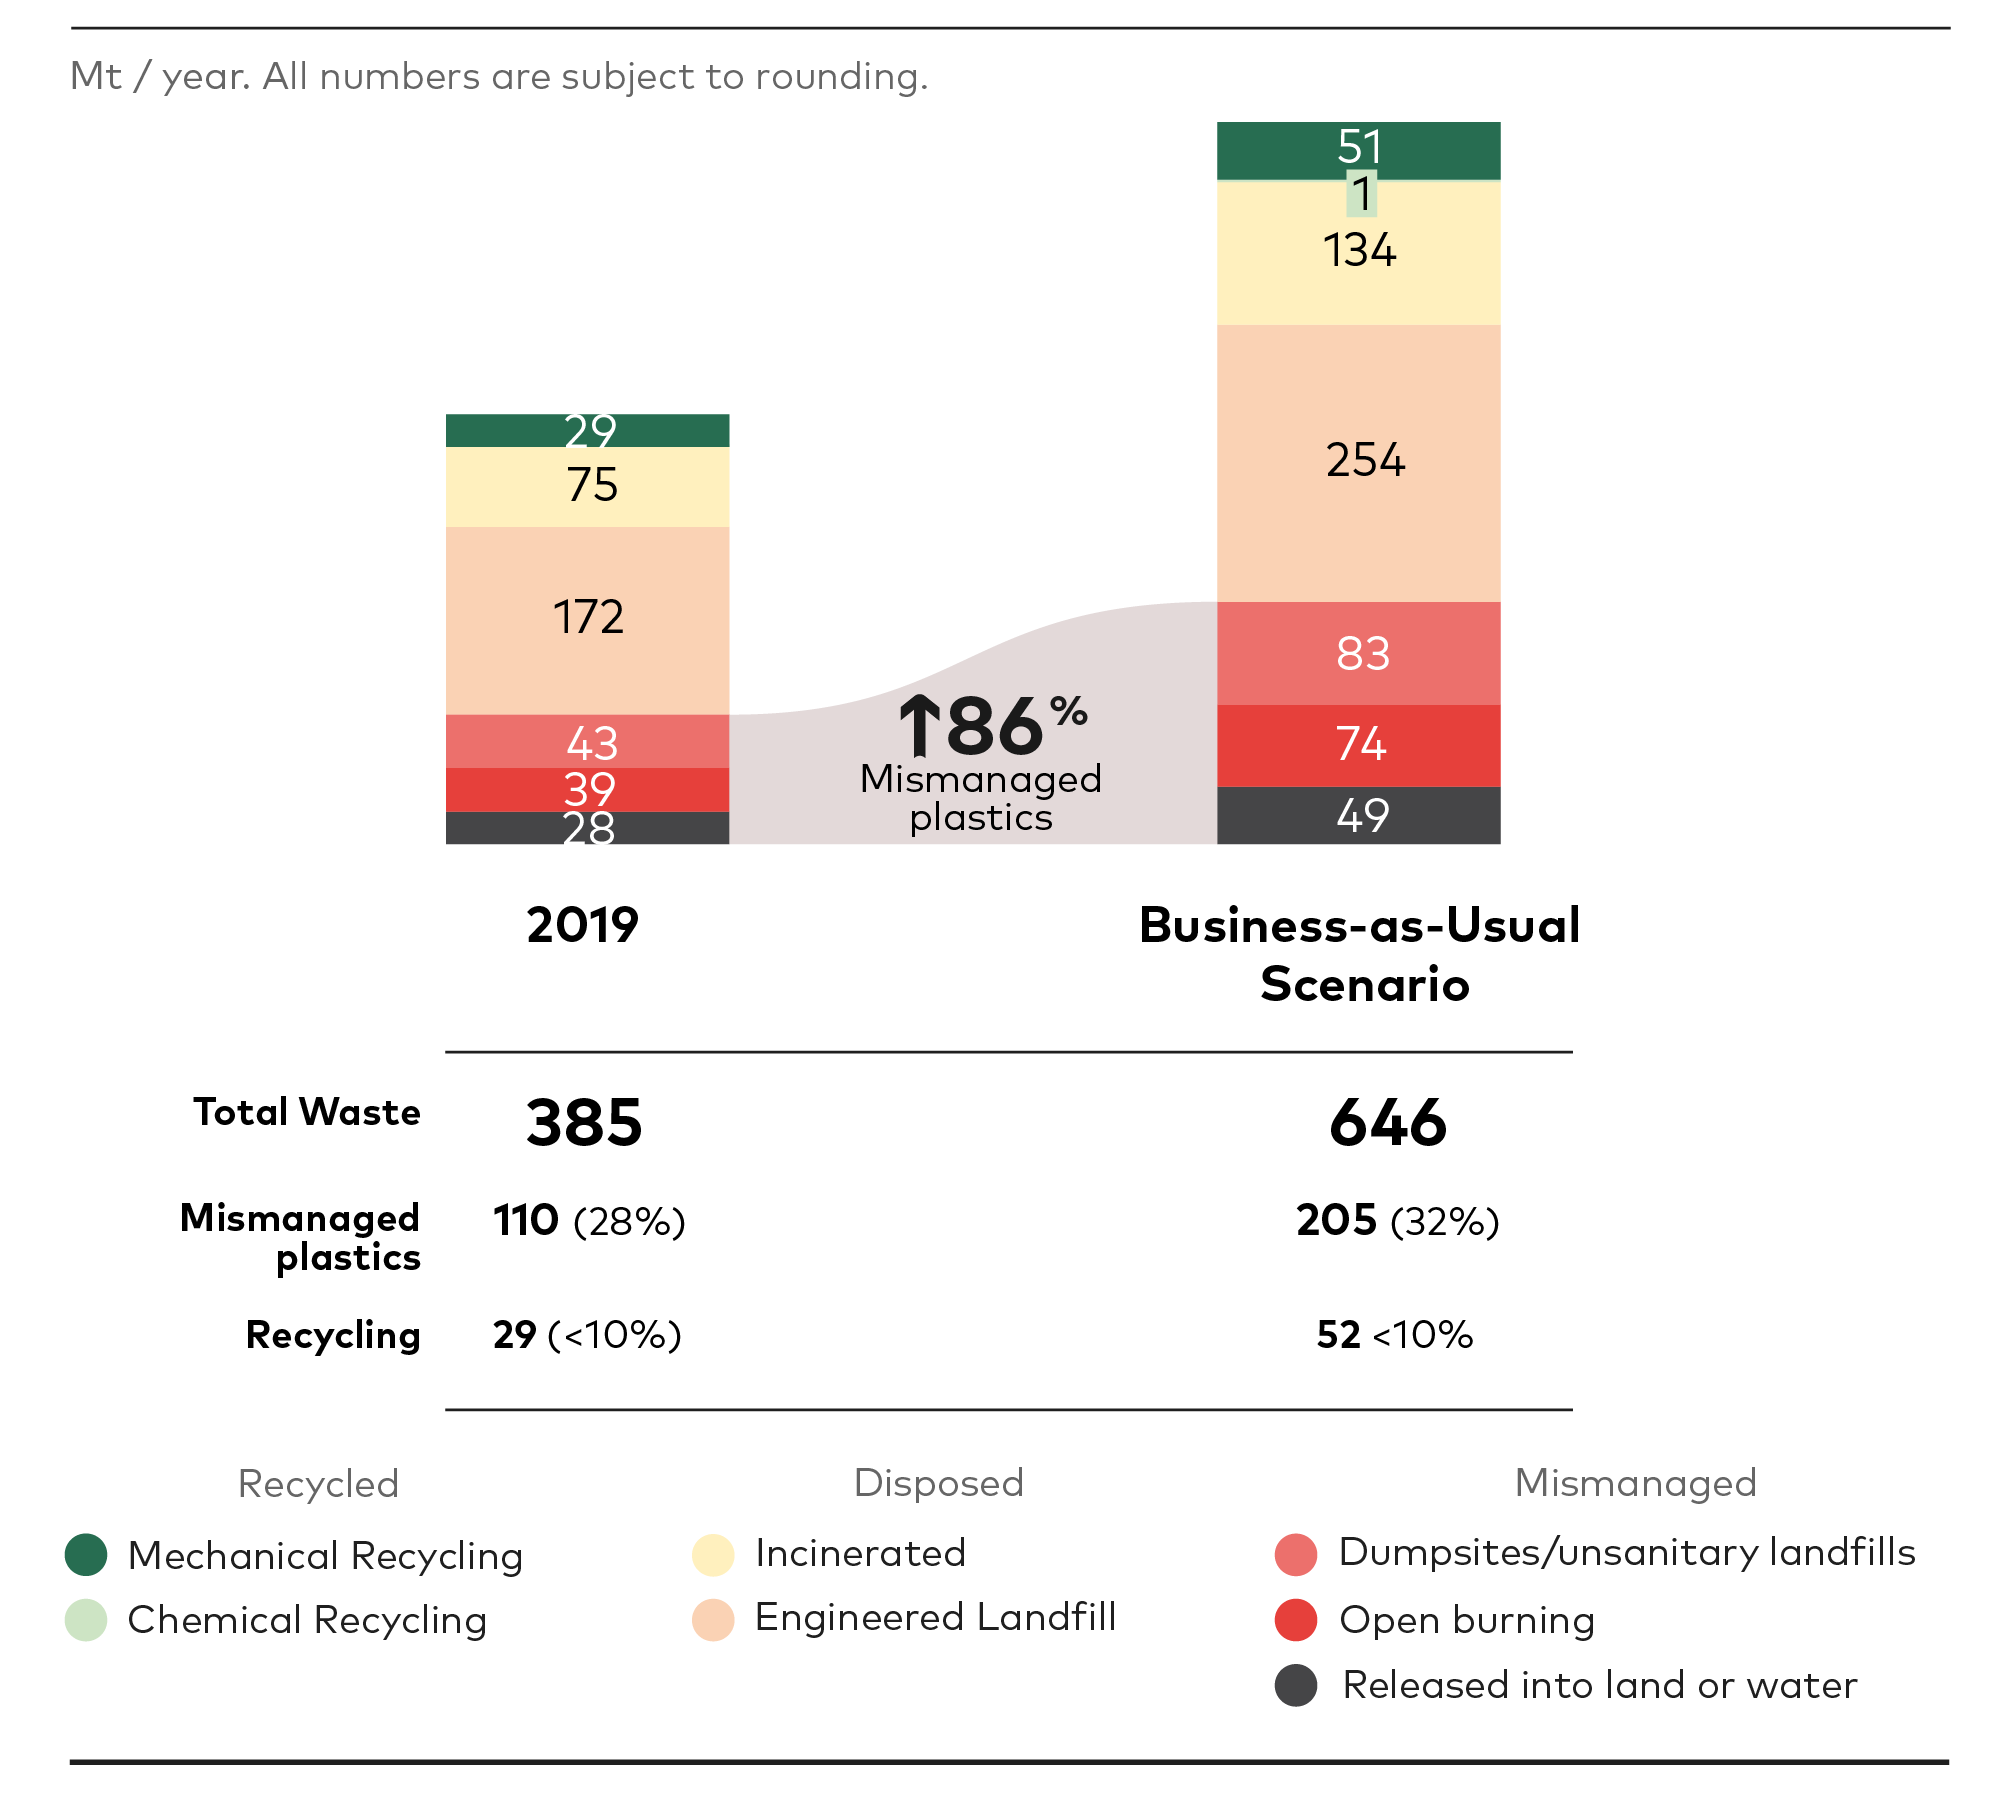
FIGURE 5
End-of-life fate of plastic waste in 2019 and in 2040 under the Business-as-Usual Scenario
The current trajectory could see annual volumes of mismanaged plastic almost double by 2040 relative to 2019 levels
Production and conversion of virgin plastics is the main driver for GHG emissions in the Business-as-Usual Scenario
GHG emissions in the Business-as-Usual Scenario would be mainly driven (more than 80%) by the production and conversion of virgin plastics.
This estimate does not account for emissions from the extraction of fossil fuels, which would further increase the weight of production in overall plastic emissions.
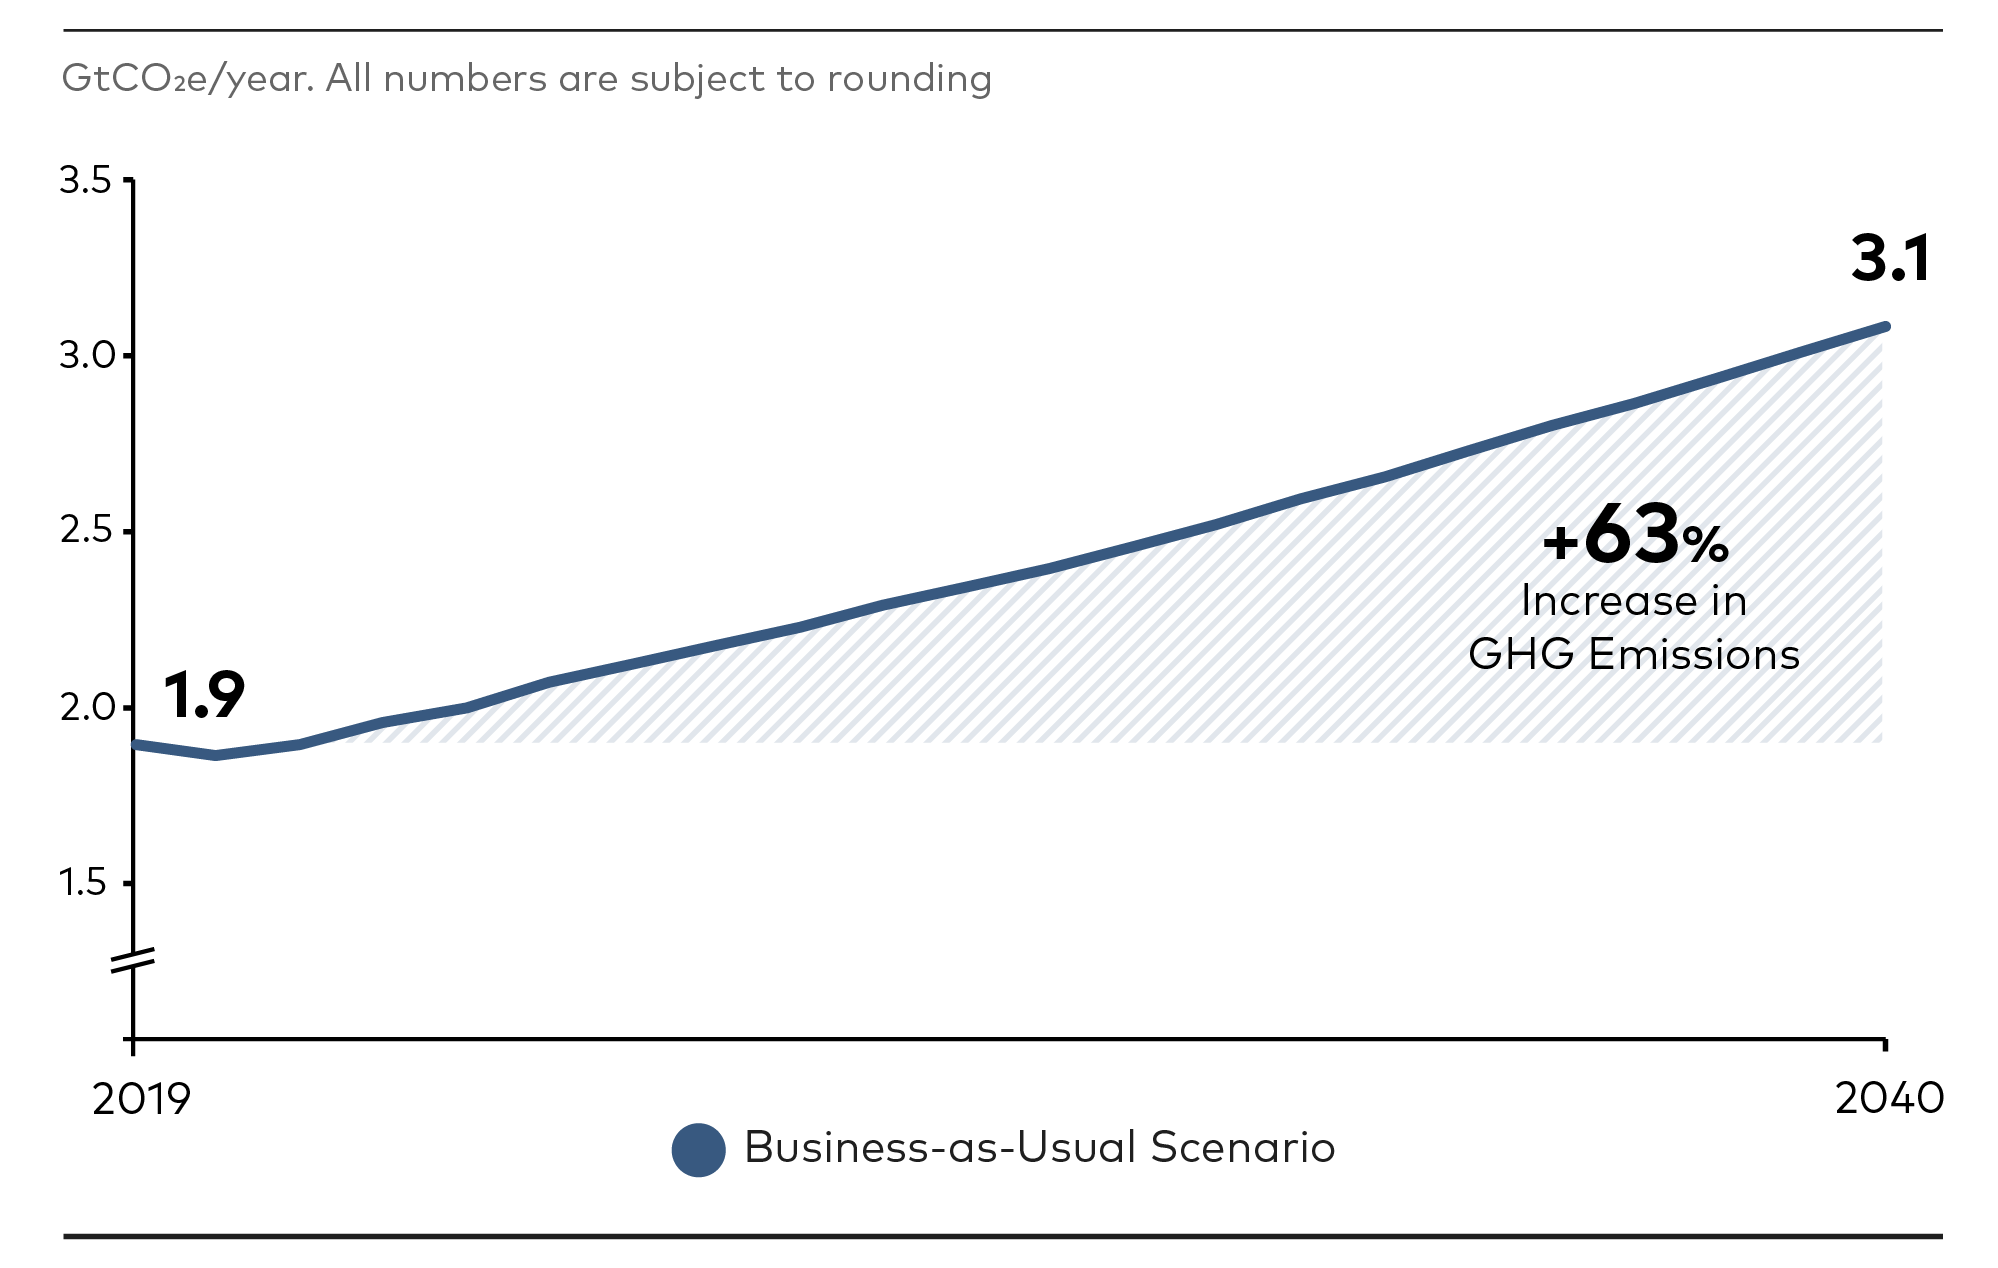
FIGURE 6
GHG emissions from the plastic system under the Business-as-Usual Scenario
The current trajectory could lead to a 63% increase in annual emissions from the plastic system
In addition to mismanaged plastic volumes and GHG emissions, hazards to health and biodiversity are a serious concern across the plastic lifecycle. While the health and environmental impacts of plastic have not been quantified in the model underlining this report, and are not the report’s main focus, Box 2 below summarises some of the known hazards and risks on human health and on the environment qualitatively, at different stages of the plastic lifecycle.
Box 2:
Health and environmental hazards, risks and impacts of plastics and associated chemicals in the Business-as-Usual Scenario
Overall, more than 13,000 chemicals associated with plastics and plastic production have been identified to date. Of these, 7,000 have been analysed for hazardous properties, with over 3,200 identified as chemicals of concern. Hazardous properties in this context include associated effects such as cancer risks, mutagenicity, reproductive toxicity, endocrine disruption and ecotoxicity to aquatic organisms, impacting both human health and biodiversity.
UNEP and Secretariat of the Basel, Rotterdam and Stockholm Conventions. (2023). Chemicals in plastics: a technical report.
Plastic production: Virtually all plastic is made from fossil sources such as crude oil, natural gas and coal. The environmental concerns associated with these industries are thus closely linked to plastic production – for example, negative impacts on workers exposed to hazardous substances; and on biodiversity through contaminated water from fossil fuel extraction and spillage, and through the release of toxins during production. There is also evidence of production plants exposing surrounding communities to hazardous substances and possibly causing adverse health effects.
UNEP and Secretariat of the Basel, Rotterdam and Stockholm Conventions. (2023). Chemicals in plastics: a technical report.
Plastic Use: Consumers are continuously exposed to plastics and plastic-associated chemicals. For example, of 419 chemicals found in children’s plastic toys, 126 were identified as of potential concern; also, over 1,000 chemicals have been found to migrate into food.
UNEP and Secretariat of the Basel, Rotterdam and Stockholm Conventions. (2023). Chemicals in plastics: a technical report.
Mechanical recycling: Studies underline the need for further research on the possible negative impacts of mechanical recycling on human health and biodiversity, including the risk of reintroducing chemicals of concern as unwanted contaminants during the sorting and recycling process.
UNEP and Secretariat of the Basel, Rotterdam and Stockholm Conventions. (2023). Chemicals in plastics: a technical report.
Brown, E. et al (2023). The potential for a plastic recycling facility to release microplastic pollution and possible filtration remediation effectiveness.
Chemical recycling:
In this report, ‘chemical recycling’ refers to plastic-to-plastic conversion technologies such as pyrolysis, gasification and depolymerisation.
UNEP. (2023). Turning off the Tap: How the world can end plastic pollution and create a circular economy.
Incineration: Historically, there is evidence that incinerators contribute to environmental impacts due to inadequate emission controls.
Giusti, L. (2009). A review of waste management practices and their impact on human health.
Tait. P. et al. (2020). The health impacts of waste incineration: a systematic review.
Landfill: Although macroplastics are unlikely to breach landfill liners, microplastics may pass through; and even the most modern sanitary landfills carry the risk of leachate contaminating groundwater. The long-term stability of landfill liners is unknown, but they are unlikely to fully function beyond 100 or 200 years.
Christensen, T. et al (2011). Landfilling: Concepts and Challenges.
Plastic alternatives: Plastic alternatives are not without risk. Therefore, if plastics are to be substituted with other materials, a case-by-case analysis to prevent unintended consequences in each local context would be required.
Zimmermann. L. et al. (2020). Are bioplastics and plant-based materials safer than conventional plastics? In vitro toxicity and chemical composition.
Microplastics: Microplastics also present a health risk, and have been detected within human placentas, blood and breast milk.
Ragusa, A. et al. (2022). Microspectroscopy Detection and Characterisation of Microplastics in Human Breastmilk.
Ragusa, A. et al. (2021). Plasticenta: First evidence of microplastics in human placenta.
Plastic particles which are smaller than microplastics, usually within a size range of 1 nanometre to 1 micrometre.
BRS (2023). Global governance of plastics and associated chemicals. Secretariat of the Basel, Rotterdam and Stockholm Conventions, United Nations Environment Programme, Geneva. Karen Raubenheimer, Niko Urho.
UNEP and Secretariat of the Basel, Rotterdam and Stockholm Conventions. (2023). Chemicals in plastics: a technical report.
In addition, extensive accumulation of plastic in the oceans and land poses threats to biodiversity. Marine plastic pollution is reported to negatively affect over 800 species.
Duncan E., et al. (2018). Microplastic ingestion ubiquitous in marine turtles.
Science Advice for Policy by European Academies. (2019). A Scientific Perspective on Microplastics.
If plastic pollution continues at current levels and production continues to grow as per the Business-as-Usual Scenario, the negative impacts on health and biodiversity could increase. Given the existing evidence – and the lack of transparency in, and limited regulation of, the plastic industry – policies to address plastic pollution should take into account these risks throughout the plastics value chain.