↑ Photos: Energinet and Fingrid Oyj
2. Setting the scene: Context and rationale for CRM and NFFSS in the Nordic Region
This chapter sets the scene for the rest of the report, providing essential background on the growing interest in exploring new market mechanisms to support the green transition in the Nordic region. It offers key insights into the Nordic energy landscape and explores potential shortcomings of energy-only market designs. The regulatory framework is outlined, followed by an examination of country-specific challenges and the definition of likely scarcity events. The analysis also highlights the substantial costs associated with addressing these challenges if not managed effectively. Finally, it considers the technologies and capabilities required to respond to emerging issues, identifying both constraints and opportunities for future market design.
2.1 Summary
The green transition and the electrification of society require substantial investments to support increasing electricity demand. Simultaneously, the recent energy crisis and geopolitical tensions have underscored the importance of energy security for the Nordic countries. Historically, the Nordic electricity market has largely relied on an energy-only market model to ensure sufficient capacity, with limited exceptions. However, growing uncertainty regarding future electricity price developments has led stakeholders to question whether market signals alone will be sufficient to drive investment in the necessary assets.
This evolving market landscape raises the critical question of whether some form of capacity or flexibility mechanism is required to maintain adequate levels of firm capacity and flexibility, ensuring a secure electricity supply. While there is a clear need to guarantee system adequacy and flexibility, any intervention must be carefully weighed against its associated costs. CRM payments have expanded significantly across continental Europe in recent years. According to ACER, annual capacity payments for market-wide CRMs range from approximately €20,000 to €60,000 per MW. Applying this range to the Nordic region’s peak demand of approximately 65 GW in 2023 suggests that such payments could amount to €1.3–3.9 billion per year. Of course, different assumptions—such as not covering the full peak demand—could lower this cost, but ACER’s figures highlight that CRMs come with a significant price tag.
Additionally, the availability of emerging technologies must be considered to ensure that any potential CRM design does not inadvertently hinder their future contributions to system adequacy and flexibility. The design of mechanisms in the Nordic context must therefore strike a balance between ensuring security of supply and minimising costs while maintaining technological neutrality, to the extent possible, to facilitate innovation and long-term sustainability.
2.2 The Nordic energy-only market
The Nordic energy market is a pioneering example of a liberalised electricity market in Europe, encompassing Denmark, Finland, Norway, and Sweden. This market operates on the principles of competition and transparency, allowing various market participants, including producers, consumers, and traders, to engage in the buying and selling of electricity. Notably, the Nordic market was highly integrated even before the wider EU integration seen in recent history, demonstrating a strong tradition of regional cooperation and shared infrastructure.
In the Nordic context, an energy-only market refers to a market design in which investors must rely on market price signals alone to justify investment in a sufficient volume of assets to ensure security of supply. Legislation requires that electricity market reforms are taken into account before the possible introduction of a capacity mechanism. This study recognises that the Nordic markets can be improved in their efficiency and in their ability to provide security of supply, but a discussion of electricity market reform within the concept of the energy-only market was not within the scope of this study.
2.2.1 Marketplaces for electricity
The Nordic energy market is structured around several key marketplaces, including the Single Day-Ahead Coupling (SDAC) and the Single Intraday Coupling (SIDC). These marketplaces, commonly referred to as the day-ahead and the intraday markets, respectively, are essential for maintaining the instantaneous physical balance between electricity supply and demand.
The SDAC market allows participants to plan their production and consumption for the next day, providing a reference price for electricity trading across the region. This market is vital for ensuring that supply meets demand in a cost-effective manner, as it enables market participants to optimise their operations based on forecasted conditions. Additionally, it allows Transmission System Operators (TSOs) to plan for the operation of the electricity system the next day, ensuring that they can manage grid stability and reliability effectively.
The SIDC market, on the other hand, serves as a correction mechanism, allowing participants to adjust their positions closer to real-time as more accurate information becomes available. The market consists of both continuous trading as well as three daily intraday auctions (IDAs). The intraday market is crucial for addressing any discrepancies between forecasted and actual conditions, ensuring that the system remains balanced.
Additionally, the balancing markets, managed by the TSOs, plays a critical role in maintaining real-time balance. The TSOs use this market to procure automatic and manual reserves, which are necessary to address any imbalances that occur during the operational hour. This ensures that the electricity system can respond to unexpected changes in supply or demand, maintaining overall system stability.
These marketplaces are designed to provide clear price signals and incentives for market participants, encouraging efficient resource allocation and investment in capacity when needed from a system perspective. These markets are essential for ensuring a reliable and secure electricity supply, while also facilitating the integration of renewable energy sources and supporting the overall goals of the energy transition.
Exhibit 2.1 illustrates the timeline of the key marketplaces within the Nordic wholesale electricity market.
Exhibit 2.1 – Overview of the Nordic wholesale electricity market
The physical wholesale electricity market operates from the day-ahead stage to the real-time
The physical wholesale electricity market operates from the day-ahead stage to the real-time
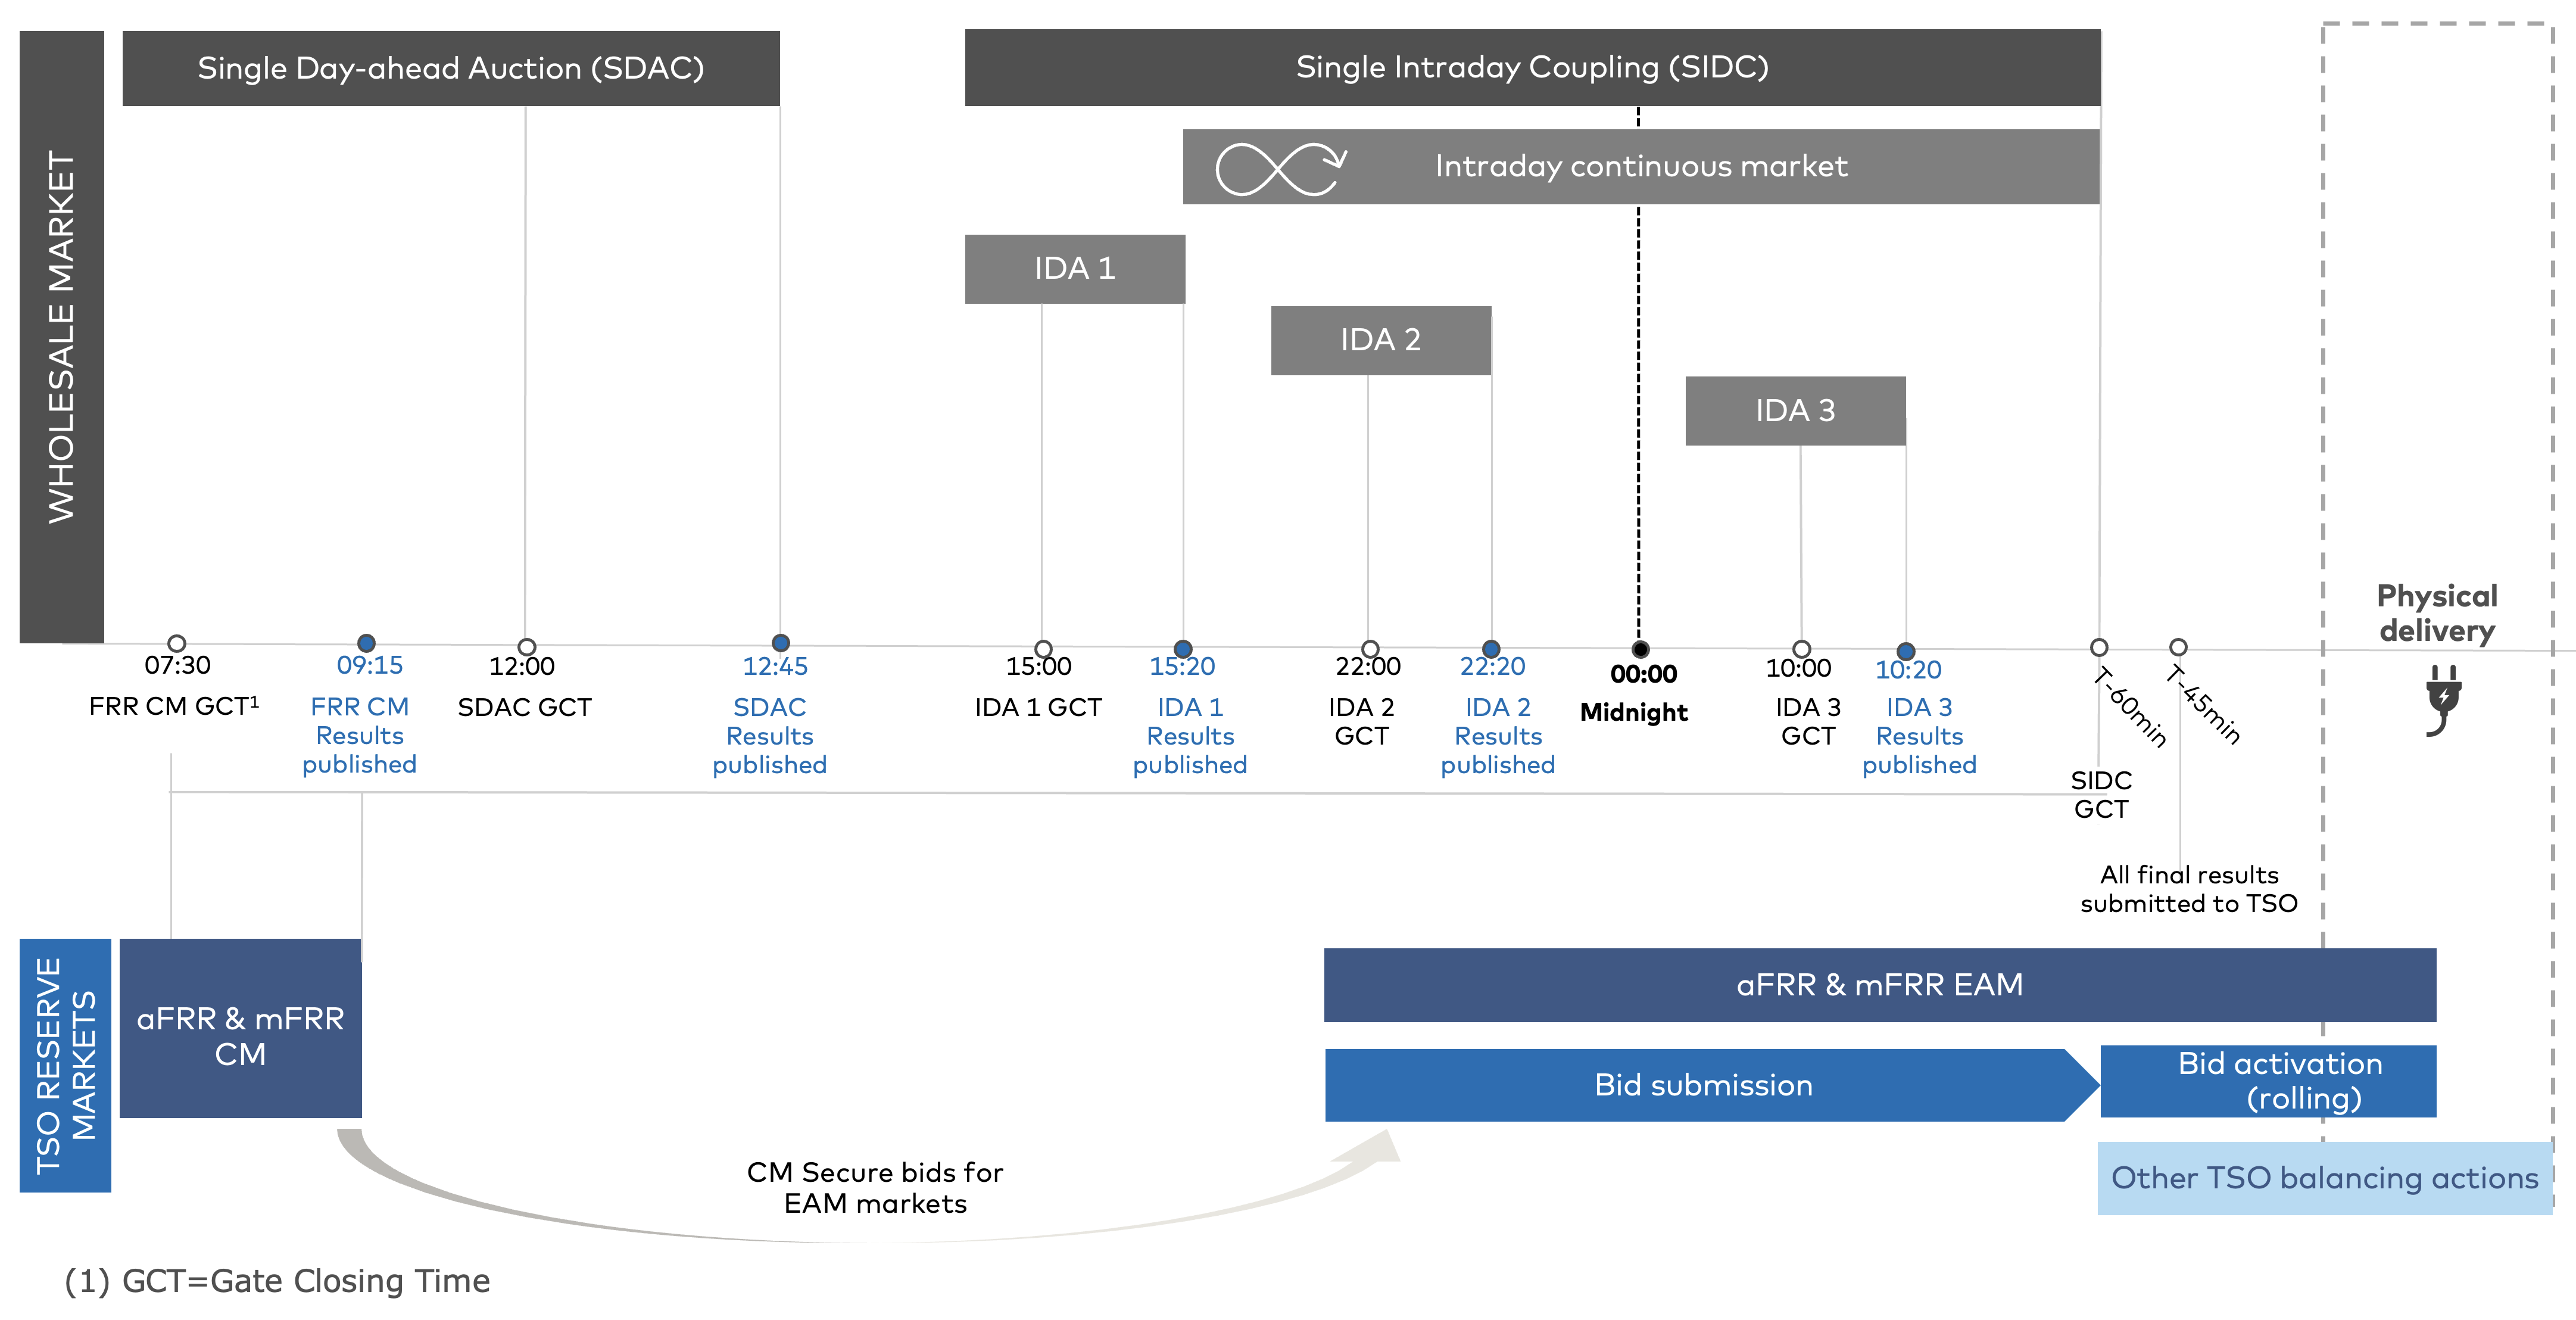
Source: AFRY
The figure includes Automatic Frequency Restoration Reserves (aFRR) and Manual Frequency Restoration Reserves (mFRR), covering both the Capacity Market (CM) and the Energy Activation Market (EAM), which are most relevant for this report. In addition to these, the main ancillary services in the Nordics also comprise Fast Frequency Reserve (FFR) and Frequency Containment Reserve (FCR). Exhibit 2.2 illustrates how these markets interact to manage disturbances in the power grid, highlighting the roles of FCR, aFRR, and mFRR in maintaining system stability. Further details on each individual market are provided below the figure.
Exhibit 2.2 – Balancing reserves in the Nordic Region
Balancing reserve markets ensure that the frequency is restored to the acceptable range
Balancing reserve markets ensure that the frequency is restored to the acceptable range
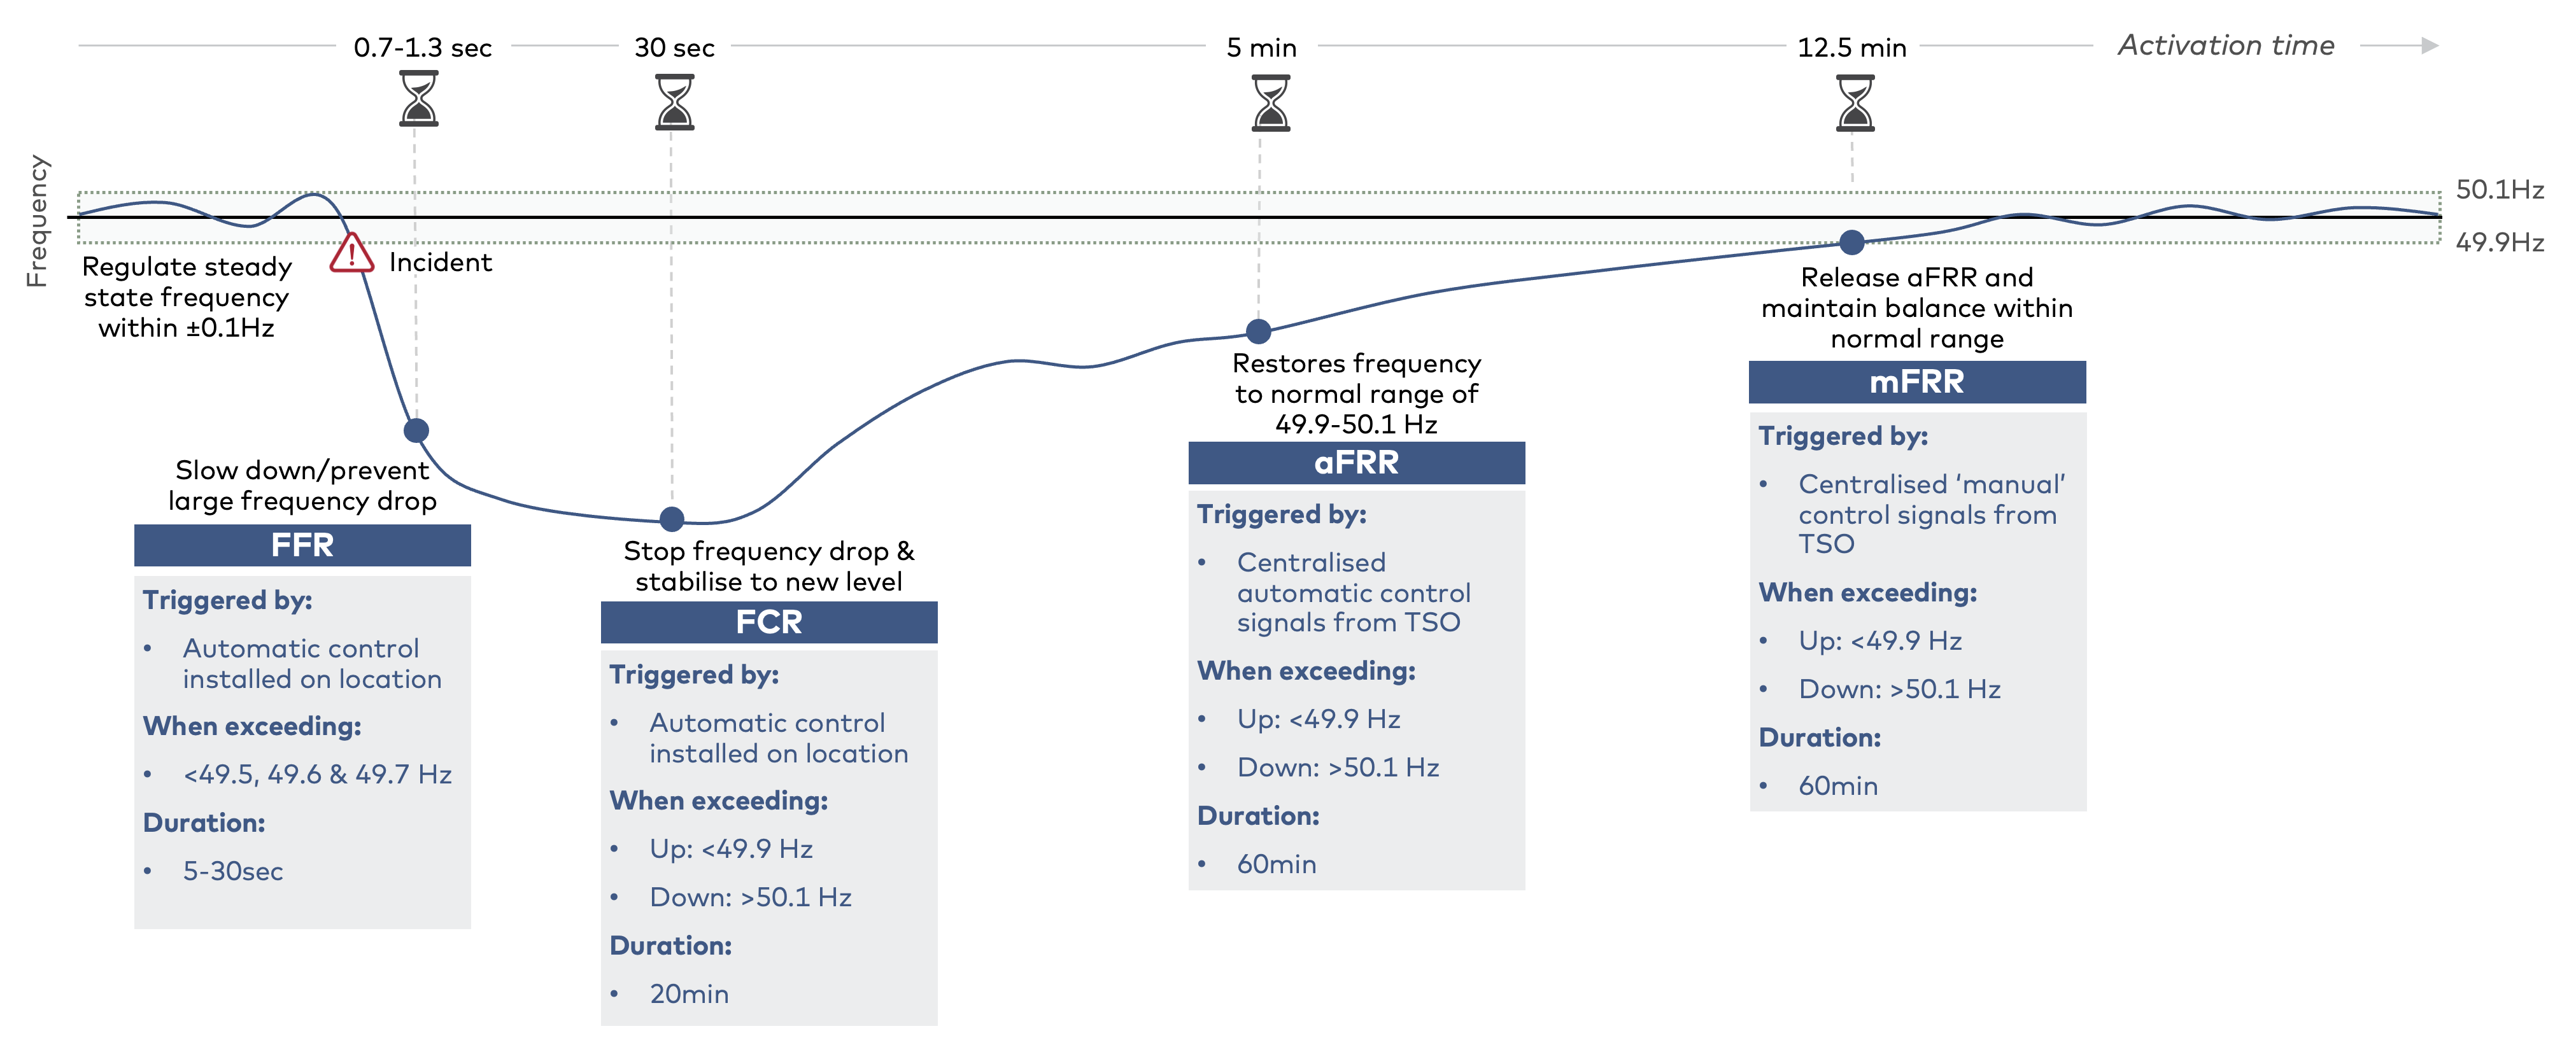
Source: AFRY
Fast frequency reserves (FFR) helps maintain grid stability by quickly responding to sudden changes in frequency. This rapid response is typically required for a short period until other reserves can take over. Participants, such as batteries and DSR entities, submit bids in annual auctions and are compensated by the TSO.
Frequency containment reserves (FCR), or primary reserves, are used for constant control of the system frequency, regulating it at 50Hz. FCR-N stabilises the frequency of small production and consumption changes, while FCR-D stabilises the frequency if it deviates significantly from the defined range.
Automatic frequency restoration reserves (aFRR), or secondary reserves, are activated to replace FCR and restore frequency to the normal range. An automatic signal from the TSO adjusts the production or consumption of providers.
Manual frequency restoration reserves (mFRR), or tertiary reserves, has the purpose to take over from aFRR and maintain balance until the power market restores balance. It is the main balancing resource of the Nordic power system due to the limited availability of aFRR and grid congestions.
Both aFRR and mFRR consist of a capacity market and an energy activation market, which can generally be described in the following manner:
- aFRR/mFRR capacity market (CM): Participants bid their available capacity to adjust energy up or down each hour. Accepted capacity bids are remunerated independently of whether bids in the subsequent EAM are activated or not. Each Nordic TSO is responsible for procuring a quantity corresponding to the dimensioning error in their system plus quantities needed for congestion management.
- aFRR/mFRR energy activation market (EAM): Accepted CM bids are transferred to EAM. New participants can also bid in the EAM regardless of being accepted in the CM. Energy activation is compensated according to the clearing price per hour for each price zone. Upward regulation occurs when additional generation is required to balance the system, while downward regulation occurs when generation needs to be decreased, or consumption increased.
2.3 Missing money problem
The business case for new firm and flexible capacity is often challenging due to the infrequent operation of 'backup' capacity, which is primarily needed during rare weather conditions or when the electricity systems is experiencing major outages. This infrequency leads to significant price and volume risks, which is the core of the missing money problem. The energy-only market can, among investors, be perceived as unable to provide sufficient price signals to attract investments in supply security, making new firm and flexible investments appear unattractive solely on merchant market operations. The result is inadequate financial incentives to secure enough capacity to manage supply shortages during these critical periods.
To solve the missing money problem, different types of capacity and/or flexibility mechanisms can be implemented to address various challenges. These mechanisms can support not only generation but also demand-side flexibility and storage solutions. Since different mechanisms will attract different types of investments, it is essential to design them carefully to target the appropriate forms of capacity that can effectively mitigate the identified issues and ensure a reliable electricity supply. By offering additional revenue streams, such mechanisms can help secure sufficient firm and flexible capacity.
However, the implementation of any such mechanism should be considered a measure of last resort, as further discussed in Chapter 2.4.
2.4 Regulatory background
This section examines the regulatory framework underpinning Capacity Remuneration Mechanisms (CRMs) and Non-Fossil Flexibility Support Schemes (NFFSS). This includes the amendments to Regulation (EU) 2019/943.
It is important to note that, before implementing a mechanism, a thorough resource adequacy assessment must be conducted
For CRMs this methodology already exists, while for NFFSS it is currently under development.
Only as a measure of last resort, where it is clearly demonstrated that improvements to the energy-only market are insufficient to resolve the problem, should a capacity mechanism be introduced
European Union (2019), Regulation (EU) 2019/943, Art. 21(1); European Commission (n.d.), Capacity mechanisms, available at: https://energy.ec.europa.eu/topics/markets-and-consumers/capacity-mechanisms_en
2.4.1 Capacity remuneration mechanisms (CRMs)
As described by ACER in the 2024 Security of EU electricity supply report, “Capacity mechanisms are support schemes that remunerate capacity resources (e.g. generators, demand-response or storage units) to be available in return of providing security of supply services”.
The regulatory framework for CRMs is primarily governed by Regulation (EU) 2019/943 on the internal market for electricity. To implement a CRM, several key steps must be followed to ensure compliance:
- Resource adequacy assessment: Conduct a thorough resource adequacy assessment as part of the European Resource Adequacy Assessment (ERAA) and national reports. This assessment should be updated annually to identify potential adequacy concerns.
- Market reform plan: Develop a market reform plan to address identified adequacy issues and improve the wholesale market design. This plan should aim to resolve issues within the energy-only market before considering a CRM.
- Notification and approval from the European commission: Notify the European Commission of the intention to implement a CRM and obtain approval. This notification should include the results of the resource adequacy assessment and the market reform plan, ensuring the CRM design meets all regulatory criteria (see below).
- Implementation and monitoring: Implement the CRM and establish mechanisms for regular monitoring and evaluation to assess its impact and effectiveness.
CRMs must adhere to several key design principles:
- Transparency and non-discrimination: Ensuring clear rules and procedures for participation, including open access to all capacity providers, including cross-border participants.
- Competitiveness: Selecting capacity through auctions or other market-based mechanisms to ensure cost-effectiveness. Therefore, price-based designs are practically excluded.
- Proportionality: Addressing only the identified adequacy concerns without exceeding what is necessary.
- Avoiding undue market distortions: Ensuring CRMs do not limit cross-zonal trade and maintain a level playing field.
- Monitoring and evaluation: Implementing mechanisms to regularly assess the impact and effectiveness of CRMs.
Other important regulatory aspects to consider include ensuring that CRMs support the integration of renewable energy sources and contribute to the EU's climate goals. It is also crucial to design CRMs in a way that minimises costs to consumers while ensuring security of supply. Furthermore, the CRM should be technologically neutral, allowing for a diverse range of capacity providers without favouring specific technologies.
2.4.2 Strategic reserves
The implementation of a strategic reserve follows the same steps as for CRMs, including conducting a resource adequacy assessment, developing a market reform plan, notifying and obtaining approval from the European Commission, designing the reserve, and establishing mechanisms for monitoring and evaluation. However, strategic reserves differ from CRMs in several ways:
- Market participation: Strategic reserves are kept outside the electricity market and are only used when market participants do not offer enough generation to meet demand. In contrast, CRMs are integrated into the market and provide payments to capacity providers to ensure availability.
- Activation: Strategic reserves are activated only in emergency situations or when there is a significant shortfall in generation. CRMs, on the other hand, provide regular payments to capacity providers to ensure they are available when needed.
- Control: Strategic reserves are typically controlled by the TSO, while CRMs involve market-based mechanisms and competitive auctions.
2.4.3 Non-Fossil Flexibility Support Schemes (NFFSS)
The Non-Fossil Support Scheme (NFFSS) is a new tool which aims to support roll-out of renewable energy by securing sufficient flexible, green capacity in the grid, by open up for new and greener approaches to supporting investment in flexible resources. It is not only a tool, but also an obligation on member states to assess the need for flexibility and set national targets for flexibility. The process for implementing these provisions involves several key steps, as showing in Exhibit 2.3.
Exhibit 2.3 – Key steps in implementation of amendments to Regulation (EU) 2019/943 with regard to NFFSS
First likely implementation of NFFSS in 2027
First likely implementation of NFFSS in 2027
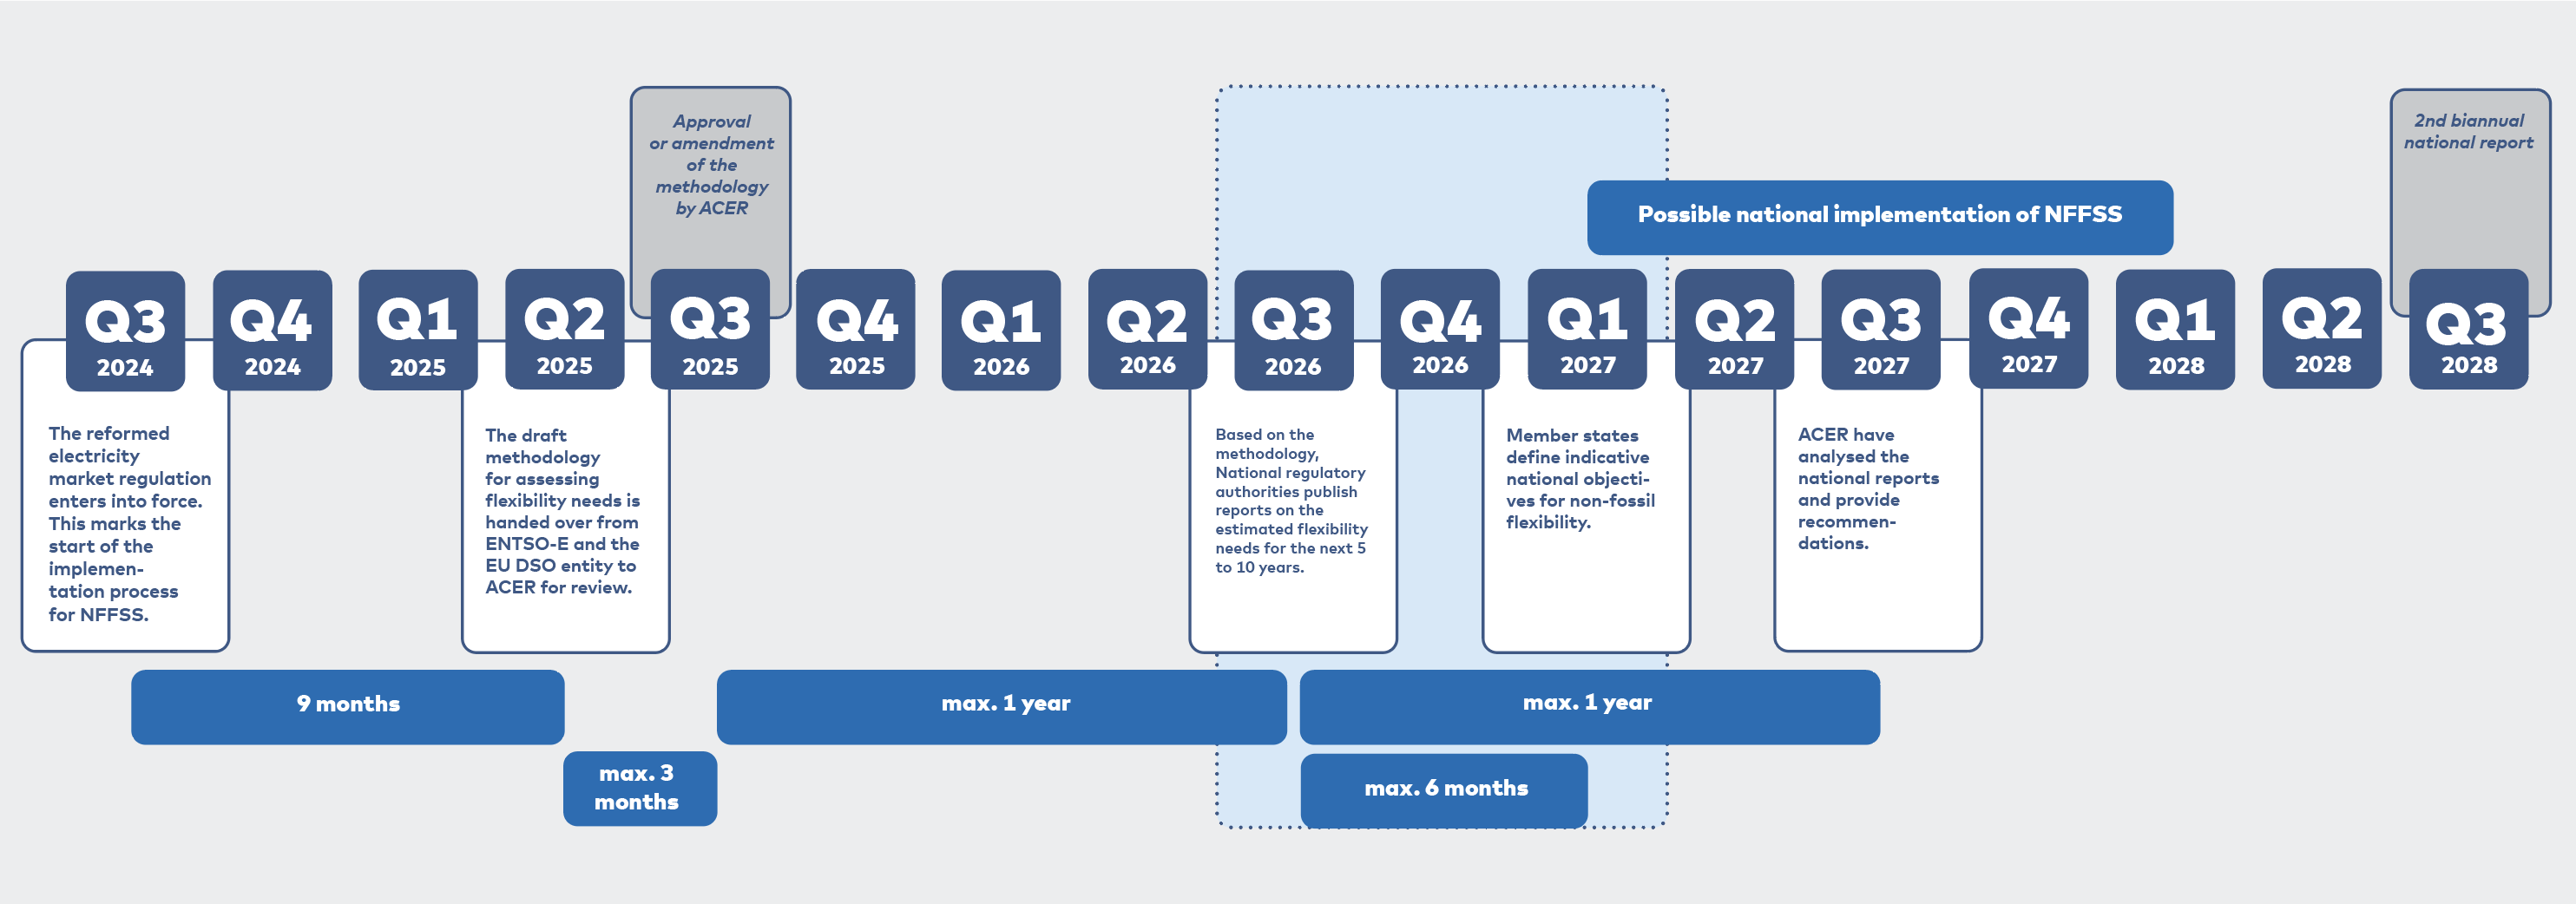
Source: AFRY, Regulation (EU) 2019/943.
The key distinction between conventional CRMs and the NFFSS is its targeted approach, rather than a market-wide application. The NFFSS is designed to promote new, non-fossil, flexible resources. As shown in Exhibit 2.4, its main design principles provide a framework, but the regulation allows Member States the flexibility to tailor and implement support schemes based on national circumstances. However, the overall design guideline is to ensure a market-based scheme that promotes competition and avoids distorting the electricity market. If capacity mechanisms are already in place, it should be adjusted to incentivise non-fossil flexibility.
Exhibit 2.4 – Design principles for NFFSS
Regulation (EU) 2019/943 lays down a range of design principles for NFFSS
Regulation (EU) 2019/943 lays down a range of design principles for NFFSS
 |  | ||
 |  | ||
 |  | ||
 |  | ||
 |  |
Source: AFRY, Regulation (EU) 2019/943.
The wording in Article 19(h)(b) of the amended Regulation (EU) 2019/943 states that non-fossil flexibility support schemes must be "limited to new investment in non-fossil flexibility resources such as demand-side response and energy storage." In our view, the phrase "such as" suggests that DSR and energy storage are examples rather than an exhaustive list, meaning other non-fossil flexibility resources could potentially be eligible.
The key criterion is "flexibility." The regulation is specifically designed to support resources that enhance the power system’s ability to respond dynamically to fluctuations in supply and demand. Which technologies that can receive support therefore would depend on their demonstrated ability to provide short-term flexibility, but also on the final methodology for assessing flexibility and how the rules are implemented nationally.
2.4.4 State aid
All capacity and flexibility mechanisms must comply with General Block Exemption Regulation (GBER)
European Commission (n.d.), State aid regulations, available at: https://competition-policy.ec.europa.eu/state-aid/legislation/regulations_en
Firstly, the aid must address a genuine market failure or achieve an objective of common interest, such as ensuring security of supply or integrating renewable energy sources. The measure should be necessary and proportionate, meaning it should not exceed what is required to achieve its objective and should be the least distortive alternative available. In the context of capacity mechanisms, they must be designed to address specific adequacy concerns.
Secondly, the aid must have a limited impact on competition and trade within the EU. The Commission evaluates whether the measure provides undue advantages to certain companies or sectors, potentially harming competitors and affecting trade between Member States. For example, capacity mechanisms must be open to all capacity providers, including cross-border participation, to prevent market fragmentation.
Lastly, transparency and monitoring are crucial components of the approval process. Member States must ensure that the aid measure is transparent, with clear rules and procedures for granting aid, and must regularly monitor and report on its implementation and impact. This helps the Commission verify that the aid remains compatible with EU rules over time and allows for adjustments if necessary. Additionally, the aid measure should include mechanisms to prevent overcompensation and ensure that beneficiaries do not receive more aid than needed to achieve the intended objectives.
The Temporary Crisis and Transition Framework for State Aid was introduced in response to the exceptional circumstances caused by the energy crisis, particularly the disruptions in energy supplies stemming from geopolitical tensions (e.g., the war in Ukraine). The framework, which is set to expire on 31 December 2025, allows for more flexible and faster state aid procedures to support investments in the energy sector, including the development of technologies like Battery Energy Storage Systems (BESS). This framework enables governments to grant state aid for projects that enhance energy security and contribute to the transition towards greener and more resilient energy systems.
After the expiration of the Temporary Crisis and Transition Framework in December 2025, the rules for granting state aid will revert to the regular framework, which typically have stricter conditions regarding direct investment support.
2.5 Country and area specific challenges
TSOs conduct detailed analyses to forecast future resource adequacy, identifying potential gaps between supply and demand. The European Resource Adequacy Assessment (ERAA) is a Europe-wide yearly report conducted by ENTSOE. The ERAA provides valuable insights into the anticipated needs and challenges that TSOs foresee, helping to inform strategic decisions and policy measures to secure the electricity supply in the coming years. In addition, the Nordic TSOs publish country specific reports where they analyse the future resource adequacy.
In the next sub-chapter, a high-level overview of the Nordic Region is presented. Chapter 2.5.3-2.5.6 contains more country specific details.
2.5.1 Nordic context
The Nordic electricity grid is facing an increasingly complex set of challenges as each country, Denmark, Norway, Sweden, and Finland, navigates the need for enhanced flexibility and capacity to ensure grid stability and reliability. Denmark, for instance, is grappling with the phase-out of Combined Heat and Power (CHP) plants in favour of renewables, raising concerns about the adequacy of flexibility to manage future system operations. In Norway, dry years can trigger adequacy risks, particularly in southern Norway, where the reliance on hydropower faces seasonal limitations. Sweden's energy-only market currently struggles to provide the necessary flexibility to meet reliability standards, with southern Sweden being particularly vulnerable to adequacy risks under dry conditions and facing persistent bottlenecks in power transmission from the north. Meanwhile, Finland's challenges are primarily centred around maintaining electricity adequacy during prolonged cold periods with low wind conditions or disruptions in generation or imports.
Each nation has defined a reliability standard to measure if measures are needed to improve the resource adequacy. This is typically stated in terms of how many hours per year they expect loss of load and is referred to as Loss of Load Expectation (LOLE). The ERAA 2023 report indicate that under normal weather conditions (scenario A, the Central Reference) the LOLE remains modest for the Nordic region, but the 2023 Security of EU electricity Supply report shows that Denmark, Sweden and Finland may have adequacy concerns during any of the next 10 years.
ACER (2023), Security of EU electricity supply 2023, Figure 2, p. 30. Available at: https://acer.europa.eu/sites/default/files/documents/Publications/Security_of_EU_electricity_supply_2023.pdf
Exhibit 2.5 – LOLE expectations in the ERAA 2023
Some areas have higher LOLE expectations, like Sweden and Denmark
Some areas have higher LOLE expectations, like Sweden and Denmark
Source: ENTSO-E.
To explore the resource adequacy situation further, all of the Nordic TSO have conducted their own analysis on top of the ERAA. In essence, the country specific situation can in short be summaries in the following bullets:
- Denmark: Heavily impacted by RES fluctuations and limited domestic adjustable supply. High dependency on interconnectors to solve real-time and within-day fluctuations.
- Sweden: In dry years, internal grid bottlenecks may create dependency on cross-border interconnectors to supply sufficient energy in southern Sweden.
- Finland: Strong internal grid, but dependent on interconnectors to adjacent markets under certain conditions.
- Norway: Abundant capacity from hydropower. In dry years, internal grid bottlenecks may create dependency on interconnectors to supply sufficient energy in some regions.
Drawing on the reports referenced in this chapter, as well as feedback from Nordic Energy Research, Exhibit 2.6, has been developed to illustrate the high-level characteristics of the Nordic region towards 2030 in the context of resource adequacy. The illustration distinguishes between Nordic connected capabilities—representing conditions when all interconnectors are operational—and national capabilities, to demonstrate how risk profiles change when only domestic resources are considered.
The temporal dimension is defined in the following manner:
- Real-time: Ability to adjust within seconds/minutes to support system balancing.
- Within-day: Manage fluctuations in supply and demand that occur within-day, including morning and evening peaks, as well as day-night differences in RES.
- Multi-day: Adapt to changes in demand & supply over several days, incl. weekdays/weekends differences, weather-driven fluctuations in RES, and interconnector outages.
- Seasonal: Adjust to differences in seasonal demand shifts and differences in RES generation driven by seasonal weather patterns. Must also account for dry seasons.
Exhibit 2.6 – High-level characteristics of the Nordic region towards 2030 in the context of adequacy
The Nordic connected capabilities are overall fair, but the risk increases when only considering national resources
The Nordic connected capabilities are overall fair, but the risk increases when only considering national resources
Nordic connected apabilities | Notopnal capabilities (disconnected) | |||||||
|---|---|---|---|---|---|---|---|---|
Real-time | Within-day | Multi-day | Seasonal | Real-time | Within-day | Multi-day | Seasonal | |
FI | Fair | Fair | Fair | Fair | Risk | Risk | Risk | Fair |
DK | Risk | Risk | Fair | Fair | Risk | Risk | Risk | Fair |
SE | Fair | Fair | Fair | Fair | Fair | Fair | Fair | Fair |
NO | Good | Good | Fair | Fair | Good | Good | Fair | Risk |
Source: AFRY
In the ERAA 2023 report, ENTSOE writes that “Being an inherently complex study, ERAA is characterised by a significant degree of uncertainty and computational constraints” and that “(…) assumption for a same given target year can evolve fast from one edition to another, due to the ongoing accelerating energy transition”
ENTSO-E (2023), European Resource Adequacy Assessment (ERAA) 2023, available at: entsoe.eu
Given this uncertainty, it is more appropriate to develop a flexible toolbox of mechanisms that can be adapted to shifting needs over time. As designing a truly technology-neutral, one-size-fits-all market mechanism is not feasible, this report aims to recommend the mechanism(s) best suited to promote the technologies most capable of addressing the identified adequacy challenges.
2.5.2 Issues causing scarcity events
Drawing on existing research and published reports, it is assumed that scarcity events are primarily a concern in scenarios where multiple conditions arise simultaneously. The identified events include:
Cold winters: As a large share of the Nordic space heating demand is covered by electricity, cold weather gives an increase in demand. This can result in:
- a day-to-day peak in demand, causing a capacity problem; or
- a large increase in demand from one week or month to the next, or even from one winter to the next, potentially giving rise to an energy problem.
Dry years: As a substantial share of the Nordic electricity generation capacity stems from hydropower, years with low participation will see substantially lower generation. This may give rise to an energy problem.
Low intermittent RES output: This may give rise to different challenges, among them:
- to balance the electricity system within-day during high short-term fluctuations, giving rise to a flexibility problem; or
- a day-to-day capacity problem; or
- an energy problem during dunkelflaute events.
Supply outages: The unavailability of one or more large generation units, for example nuclear units running baseload, may lead to:
- a capacity problem if the outage is short; or
- an energy problem if the outage is long.
Interconnector outages: Some Nordic price areas rely on interconnectors for resource adequacy, and their outage have a similar impact as supply disruptions described above. In recent years, the risks associated with interconnector failures have become more apparent, as incidents such as accidents or possibly sabotage have led to prolonged outages of underwater HVDC lines, lasting several months.
One of the five events above may not necessarily cause a problem on its own. Scarcity is more likely to occur when multiple events coincide. The probability of scarcity decreases as more events must align to create such a situation. The likelihood of individual events and their correlation with each other should guide the choice of solutions, keeping in mind that historical patterns may not reliably indicate future needs.
Furthermore, anticipated scarcity events should inform the eligibility criteria of the mechanism. The type of technology needed (being storage, DSR, capacity, and/or energy) to cover the shortfall, each requires specific considerations when designing the mechanism to make sure it effectively solves the issue.
All these aspects needs to be considered when designing a potential new mechanism for the Nordic market.
2.5.3 Denmark
The Danish electricity grid is currently facing significant challenges as, over time, there has been a growing risk that the available generation capacity will not be sufficient to meet the electricity demand. This issue is exacerbated by the decline in controllable thermal capacity and an expected rise in electricity consumption, both within Denmark and across Europe.
According to “Redgjørelse for elforsyningssikkerhed 2023”, a report published by Energinet, there is a growing risk of insufficient capacity in the day-ahead market to meet electricity demand, as well as a potential shortage of balancing reserves. This is threatening the overall adequacy of the electricity supply.
Energinet (2023), Redegørelse for elforsyningssikkerhed 2023, available at: https://energinet.dk/om-publikationer/publikationer/redegorelse-for-elforsyningssikkerhed-2023/
Energinet’s analysis suggests that the issue is best mitigated through new controllable production capacity or DSR. While strong interconnection have historically been a cornerstone of Danish supply security, new capacity on these connectors will only partially alleviate the problem as the problem of capacity shortages may arises at the same time across Europe. Typically, this will happen during periods of low solar and wind production. Energinet also anticipates a need for more system services and balancing reserves to manage larger and more frequent imbalances in the future electricity system.
One potential solution to the risk of capacity shortfalls is the introduction of a capacity mechanism. Energinet, in collaboration with the Danish Energy Agency, is conducting a detailed analysis of the prerequisites and possibilities for establishing a capacity mechanism in Denmark. This analysis will explore the advantages and disadvantages of various capacity mechanism models, considering their impact on other markets.
Energinet’s initiative, “New ways of balancing the electricity grid of the future,” address the complex challenge of balancing a grid based on 100% renewable energy resources (RES). This initiative identifies three main challenges: scarcity situations due to a lack of adjustable capacity during low renewable production periods, insufficient participation and liquidity in normal periods, and outages of large plants due to extreme weather. Energinet is exploring five opportunity spaces to find specific solutions to these problems.
2.5.4 Sweden
Sweden is facing increasing challenges with resource adequacy in the electricity market, leading to periods of high electricity prices and a heightened risk of power shortages and subsequent load shedding. Recent national and European analyses by Svenska kraftnät (Svk) indicate that Sweden may soon fail to meet the established reliability standard of one hour. The anticipated electrification is driving up electricity demand, but there are significant uncertainties regarding future electricity usage. This creates substantial risks for investors, negatively impacting decisions on new production capacity investments.
The energy transition is expected to result in a significant increase in electricity consumption and a shift in the production mix towards a higher share of renewable and weather-dependent electricity generation, however, not matched by a corresponding increase in production capacity to meet demand during peak hours. Svk assesses that the current energy-only market cannot deliver all the necessary flexibility to meet the reliability standard under these circumstances.
Northern Sweden (SE1 and SE2) currently has a surplus of electricity production, which is exported to the consumption-dominated deficit areas in southern Sweden (SE3 and SE4). The rapid expansion of renewable electricity production, particularly in northern Sweden, makes it difficult to eliminate transmission constraints in the grid at the required pace. By 2027, the additional capacity needed to maintain power balance in southern Sweden could reach between 2,500 and 3,000 MW to meet the reliability standard.
Svenska kraftnät (2023), Framtidens kapacitetsmekanism för att säkerställa resurstillräcklighet på elmarknaden, available at: svk.se
Existing flexibility and capacity mechanisms
To ensure a stable power supply, especially during unexpected outages or high-demand periods, Sweden has two additional reserves beyond the energy only market:
- Strategic Reserve (effektreserv): From 2020 to 2025, Sweden’s strategic reserve stood at 562 MW, with availability requirement from 16 November to 15 March. This capacity was provided by Karlshamnsverket, an oil-fired power plant, located in SE
- The Strategic Reserve is considered temporary and needs to go through a new EC approval process, with a potential extension for three more years
- Disturbance Reserve (störningsreserven) – not a capacity mechanism, but rather providing additional flexibility: Used for short-term imbalances in the power system, primarily consisting of old gas turbines on long contracts. Additional reserves are, as a temporally solution
Challenges with existing mechanisms
While the two reserves have been effective in maintaining system reliability, they face significant challenges. The Strategic Power Reserve, with its temporary nature and limited capacity, may not be sufficient to address prolonged or severe power shortages, especially as it is set to be phased out by March 2025. On the other hand, the Disturbance Reserve, while effective for handling imbalances, relies heavily on gas turbines, which may not align with long-term sustainability goals.
2.5.5 Norway
Currently, Norway enjoys a slight power surplus, even during the tightest hours. However, Norway is moving towards a tighter power balance, and by 2030, there may be hours with a national power deficit. Norway’s power system continues to benefit from significant flexibility provided by hydropower plants with reservoirs. The increasing share of new, unregulated, and stochastic production from wind and solar power will not necessarily be available during demand peaks. This variability poses substantial challenges in balancing consumption and production. Hydropower will increasingly shift from full production during high-price periods to minimal production when prices are low.
Norway currently benefits from substantial import capacity, providing a important safety net. However, as the Nordic and European power systems become increasingly reliant on weather-dependent generation, the availability of back-up capacity via interconnectors is expected to decrease. This shift could result in periods of high prices. According to the NVE and Statnett report “Norsk og nordisk effektbalanse fram mot 2030“, enhancing flexibility on the consumption and/or production side could offer a buffer during instances when Norway faces a tight power situation concurrently with high prices or capacity shortages across the Nordic or Northern European regions.
Norges vassdrags- og energidirektorat (2022), Norsk og nordisk effektbalanse fram mot 2030, NVE Rapport nr. 20/2022, available at: https://publikasjoner.nve.no/rapport/2022/rapport2022_20.pdf
In Statnett’s “Et effektivt markedsdesign for fremtidens kraftsystem” report, their assessment indicates no immediate need for a capacity market in Norway’s electricity sector for the next 10-15 years. Key factors in this evaluation include the continued operation of existing hydropower, investments in flexible hydropower is sufficiently supported by the energy-only market, and the expectation that new consumption will be more flexible than current levels, driven by higher price variations.
Statnett (2023), Anbefalinger om fremtidens kraftmarked, published 8 December 2023. Available at: statnett.no
2.5.6 Finland
The Finnish electricity system has maintained an acceptable level of resource adequacy, largely due to significant hydropower capacity and the recent commissioning of Olkiluoto 3 nuclear power plant. Before 2022, electricity imports from Russia played a crucial role, especially during cold winter days. However, these imports have now been mostly replaced by imports from Sweden and increased domestic generation, primarily from wind and nuclear capacity.
In Finland, a challenging weather year is characterised by prolonged periods of high demand coupled with low wind power output. During such years, the power deficit cannot be mitigated by energy storage, DSR, or imports alone. Combined with a growing electricity demand and an increasing share of intermittent wind power, the need for firm and flexible capacity during windless periods becomes more critical. Resource adequacy during these periods can only be achieved with resources that offer long duration or have no energy limitations. In other words, firm and flexible capacity.
In April 2024, Wärtsilä and AFRY published the report “How firm and flexible capacity supports Finland to become a green superpower”. It shows that as the Finnish power system evolves, the retirement of older thermal units and the rise in electricity demand from new industries, further stress the importance of reliable capacity. The report highlights that while energy storage and DSR play vital roles, they alone cannot guarantee security of supply during dunkelflaute. The study emphasises that the time to act is now, advocating for the swift implementation of a capacity or flexibility mechanism that is future-proof and capable of adapting to the dynamic needs of the Finnish electricity market.
Existing flexibility and capacity mechanisms
Finland operates an energy-only market theoretically supported by a strategic reserve. From 2020 to 2022, Finland maintained a strategic reserve capacity of 611 MW. However, from July 2022 onward, Finland discontinued its strategic reserve procurement due to the commissioning of the Olkiluoto 3 nuclear power plant and updated resource adequacy assessments indicating no need for additional reserves at the time. Finland currently has a strategic reserve measure in place until 2032, but no capacity is contracted
ENTSO-E (2023), European Resource Adequacy Assessment 2023 Edition – Annex 4: Country Comments, updated April 2024. Available at: https://www.entsoe.eu/eraa/2023/report/ERAA_2023_Annex_4_Country_Comments.pdf
The energy-only market has facilitated the provision of DSR, which is expected to increase significantly. DSR is utilised to address short-term supply and demand mismatches.
Challenges with existing mechanisms
As the existing thermal units gradually retire, the system is becoming increasingly weather-dependent. Firm and flexible capacity is not sufficiently supported given the current market design, as it is expected to operate infrequently, which introduces price and volume risks. Consequently, the business case for such investments is challenging when relying solely on the energy-only market.
2.6 Cost of CRMs in a Nordic context
The financial stakes surrounding capacity mechanisms are significant. ACER reports that annual capacity payments for market-wide CRMs in Europe range from ~€20-60k per MW
ACER (2023), Security of EU Electricity Supply 2023, European Union Agency for the Cooperation of Energy Regulators, available at: https://acer.europa.eu/sites/default/files/documents/Publications/Security_of_EU_electricity_supply_2023.pdf
Based on ACER’s data, the following analysis aims to provide readers with an understanding of the scale of capacity payments. Many factors influence both the volume of MW procured and the cost per MW, meaning this is not a comprehensive cost analysis of potential mechanisms in the Nordic region. Rather, it serves as an illustration of the substantial financial risks associated with implementing mechanisms beyond the energy-only market.
Furthermore, this analysis relies on European statistics rather than detailed modelling, which would provide a more precise picture. Modelling is also the only way to account for the benefits of capacity mechanisms, such as lower wholesale prices. The aim, therefore, is not to pinpoint one exact figure, but rather to offer a general understanding of the cost landscape.
Great Britain is not included in this overview, as it is no longer part of the EU and therefore not included in ACER’s study. Belgium is also excluded, as its first capacity auction took place in 2021 for the delivery year 2025–2026, meaning relevant data is not yet available in the statistics.
2.6.1 Difference between market-wide CRM and strategic reserve
Market-wide CRM and strategic reserve operate under fundamentally different principles, making a direct comparison of their total capacity procurement costs somewhat misleading. Market-wide CRMs are designed not only to ensure resource adequacy but also to drive down wholesale electricity prices, which helps justify their higher costs. In contrast, strategic reserves are targeted at paying only for the additional capacity required, intervening only when needed, leading to significantly lower procurement costs.
To illustrate the financial implications of these mechanisms, it is useful to compare them. As seen in Exhibit 2.7, compensating the entire market under a market-wide CRM require substantial financial commitments, whereas payments for Strategic Reserves appear minimal in comparison. In this graph, the market-wide CRM costs are scaled to reflect the total Nordic peak demand in 2023, while the strategic reserves costs are standardised to a capacity of 600 MW.
This reflects the broader coverage, which inherently require larger payments, while strategic reserves function as a last-resort measure, minimising overall expenditure.
Exhibit 2.7 – Average cost of market-wide and strategic reserves, scaled (million euros)
The graph illustrates that compensating the entire market under a market-wide CRM require substantial financial commitments, whereas payments for strategic reserves appear minimal in comparison.
The graph illustrates that compensating the entire market under a market-wide CRM require substantial financial commitments, whereas payments for strategic reserves appear minimal in comparison.
Notes: This graph compares the average costs of market-wide CRM and strategic reserves, expressed in million euros. The market-wide CRM costs are scaled to reflect the total Nordic peak demand in 2023, while the strategic reserves costs are standardised to a capacity of 600 MW. The data is based on historical records from 2020 to 2024 from ACER.
Source: ACER.
Source: ACER.
2.6.2 Cost per MW
Exhibit 2.8 presents the cost per MW, providing a basis for assessing efficiency to some extent. However, it is crucial to recognise the fundamental differences between market-wide and targeted mechanisms. In this context, the mechanisms in Germany (DE), Sweden (SE), and Finland (FI) involve targeted payments, resulting in significantly lower overall costs when considering the total MW procured. By contrast, market-wide mechanisms require substantially larger procurement volumes, leading to higher costs.
The costs of Sweden’s and Finland’s strategic reserves have remained relatively low, even on a per-MW basis. Both countries have successfully maintained older fossil fuel power plants in operation at comparatively low costs. Notably, Finland’s strategic reserve costs for 2023 and 2024 are zero, as no reserves were procured during this period.
In contrast, Germany’s strategic reserve had a higher cost per MW due to its reliance on more expensive resources, including newer or less depreciated power plants.
There is also a visible variation in costs between market-wide CRMs over the period shown in the graph. The average annual costs were as follows:
- Ireland: €48.9k/MW
- France: €31.4k/MW
- Poland: €48.9k/MW
- Italy: €33.7k/MW
The variations in costs per MW between different market-wide CRMs can be attributed to differences in design and implementation across each country. Factors such as auction formats, price caps, and the specific requirements of each CRM play a key role for overall costs. Additionally, fundamental differences in the cost of existing and new resources further contribute to the disparities in costs per MW observed.
Exhibit 2.8 – Costs of CRMs per MW of total procured capacity (2020–2024, thousand euros/MW)
Market-wide mechanisms require substantially larger procurement volumes, leading to higher costs, than targeted mechanisms like strategic reserves
Market-wide mechanisms require substantially larger procurement volumes, leading to higher costs, than targeted mechanisms like strategic reserves
IE: Ireland (centralised reliability option)
FR: France (decentralised availability obligation)
PL: Poland (centralised availability obligation)
IT: Italy (centralised reliability option)
DE: Germany (strategic reserve)
SE: Sweden (strategic reserve)
FI: Finland (strategic reserve)
FR: France (decentralised availability obligation)
PL: Poland (centralised availability obligation)
IT: Italy (centralised reliability option)
DE: Germany (strategic reserve)
SE: Sweden (strategic reserve)
FI: Finland (strategic reserve)
Source: ACER
2.6.3 Cost of market-wide mechanism to meet Nordic peak demand
To contextualise the potential impacts of market-wide CRMs, historical CRM costs from various markets are examined and scaled to a Nordic context that show the cost of covering the 2023 peak demand of each country
Source: Entso-E, Danish Energy Agency, NVE, Finnish Energy, Svenska Kratnät.
Finland:
€326.9 million

Sweden:
€594.5 million

Denmark:
€155.8 million

Norway:
€570.4 million

Annex B contains more comprehensive insights, showing the scaled data for each market and over the four-year periods.
2.7 Who can deliver capacity and flexibility?
2.7.1 Technical capabilities
Ensuring a secure, flexible, and decarbonised electricity system requires a diverse mix of technologies, each contributing distinct capabilities across different timeframes. The ability to provide real-time balancing, within-day flexibility, multi-day resilience, and seasonal storage (as defined in Chapter 2.5.1) varies significantly between technologies, shaping their role in maintaining system security and reliability. Ultimately, the key question is whether the energy-only market can deliver the right combination of capabilities on its own or if an additional mechanism is needed to guide development in a specific direction to address potential gaps.
This section presents an overview of the capabilities offered by various technologies, supporting informed decision-making on which solutions to prioritise in addressing future adequacy and flexibility challenges. To facilitate this analysis, two key exhibits are included:
- A capability table summarising the role of each technology in delivering flexibility across different timeframes (Exhibit 2.9).
- A time-to-market table outlining deployment timelines, essential when designing a potential mechanism since it gives indication on required lead-time and frequency of procurement (Exhibit 2.10).
For clarity and analytical structure, technologies are categorised based on functionality and flexibility potential. These categories comprise dispatchable generation, intermittent renewable energy sources, short- to long-duration storage, DSR, and grid infrastructure. A detailed description of each category is provided in Annex C.
Exhibit 2.9 – Technology capability table
A summary of each technology’s role in delivering flexibility across different timeframes
A summary of each technology’s role in delivering flexibility across different timeframes
Category level #2 | Technology | Maturity | Solves capacity (MW) or energy (MWh)? | Capabilities | Non-fossil | |||
Category level #1: Generation technologies | ||||||||
Dispatchable power plants w/storage capability | Hydropower (with reservoir) | Mature | MW1, MWh2 | Real-time | Within-day | Multi-day | Seasonal | Yes |
Pumped hydro storage | Mature | MW1, MWh2 | Real-time | Within-day | Multi-day | Seasonal | Yes | |
Bioenergy (biomass, biogas, biofuels) | Mature | MW3, MWh4 | Within-day | Multi-day | Seasonal | Yes | ||
Gas-fired power plants (natural gas) | Mature | MW3, MW4 | Real-time | Within-day | Multi-day | Seasonal | No | |
Gas-fired power plants (hydrogen, biogas) | Mature | MW3, MWh4 | Real-time | Within-day | Multi-day | Seasonal | Yes | |
Nuclear power | Mature | MW5 | Within-day | Multi-day | Yes | |||
Dispatchable power plants | Hydropower (run-of-river) | Mature | MW | Real-time | Within-day | Yes | ||
Geothermal power | Mature | MW5 | Within-day | Multi-day | Yes | |||
Intermittent RES | Onshore wind | Mature | MW | Yes | ||||
Offshore wind | Mature | MW | Yes | |||||
Solar PV | Mature | MW | Yes | |||||
Category level #2: Energy storage technologies | ||||||||
Short-duration storage | Lithium-ion batteries | Mature | MW, MWh | Real-time | Within-day | Yes | ||
Medium-to long duration storage | Flow batteries | Emerging | MWh | Within-day | Multi-day | Yes | ||
Sodium-Sulphur (NaS) batteries | Mature | MWh | Within-day | Multi-day | Yes | |||
Liquid metal batteries | Emerging | MWh | Within-day | Multi-day | Yes | |||
Iron-air batteries | Emerging | MWh | Multi-day | Yes | ||||
Zinc-air batteries | Developing | MWh | Multi-day | Yes | ||||
Long-duration and seasonal storage | Compressed air energy storage | Mature | MWh | Multi-day | Seasonal | Yes | ||
Hydrogen storage (power-to-gas-to-power) | Emerging | MWh | Multi-day | Seasonal | Yes | |||
| Thermal Energy Storage (TES) (stores excess energy in the form of heat or cold and releases it when needed) | Mature | MWh | Multi-day | Seasonal | Yes | ||
Category level #3: DSR | ||||||||
DSR | Industrial DSR (flexible factories, cold storage, electrolysis shutdowns, etc.) | Mature | MW | Real-time | Within-day | Multi-day | Yes | |
DSR | Households demand response (smart appliances, heating/cooling loads, etc.) | Mature | MW | Real-time | Within-day | Yes | ||
DSR with storage | Electric vehicles with vehicle-to-grid capability | Mature | MW, MWh | Real-time | Within-day | Yes | ||
DSR with storage | Electrified district heating (with TES or alternative fuels as backup) | Mature | MW6, MWh7 | Within-day | Multi-day | Seasonal | Yes | |
Category level #4: Grid infrastructure | ||||||||
Grid infrastructure | HVDC Interconnectors (cross-border energy sharing) | Mature | MW | Real-time | Within-day | Multi-day | Seasonal | Yes |
Grid infrastructure | Enhanced distribution networks (smart grids, reinforced transmission lines, digitalisation) | Mature | MW | Real-time | Within-day | Multi-day | Yes | |
Source: AFRY.
1 turbine upgrade
1 turbine upgrade
2 reservoir expansion
3 generator upgrade
4 fuel availability
5 plant upgrade
6 heat pump upgrade
7 TES expansion
2.7.2 Time to market
Capacity and flexibility mechanisms aim to ensure that sufficient resources are available to meet system demand at all times. However, different technologies have vastly different lead-times, which must be considered when designing incentives and procurement timelines:
- Short-term: Technologies with short lead-times, such as DSR and battery storage, can be deployed rapidly to fill immediate capacity gaps.
- Medium-term: Technologies with moderate lead-times, such as hydrogen electrolysers, require careful planning to ensure they are available when needed.
- Long-term: Large-scale infrastructure projects, such as nuclear power plants, new hydropower power plants, or new technologies that need to mature to become feasible solutions, have extended lead-times and require long-term policy certainty to attract investment.
If lead-times are not properly accounted for, a capacity mechanism or flexibility support scheme may fail to deliver the right resources when they are needed, potentially resulting in supply shortfalls or inefficient over procurement.
Exhibit 2.10 below summarises the estimated lead-times for key technologies supporting system adequacy and flexibility. These estimates encompass the time required for project development, permitting, construction, and commissioning, though actual durations may vary depending on regulatory frameworks, grid connection availability, and supply chain constraints. Most of the data is sourced from the IEA’s Energy Technology Perspectives report (2023) and similar studies. However, conditions in the Nordic region may differ, and a region-specific analysis is recommended to ensure more accurate assessments.
Exhibit 2.10 – A time-to-market (build time) table
Deployment timelines, crucial for assessing short- and long-term investment needs
Deployment timelines, crucial for assessing short- and long-term investment needs
Technology | Lead-time (years) | Key considerations |
Hydro power w/ reservoir | 5-10 | The 5-10 years timeline reflects long permitting processes, environmental impact studies, and the complex engineering needed for hydropower facilities. |
Hydro power w/ pumped storage | 6-12 | Pumped hydro storage typically takes 6-12 years due to site-specific geographic requirements, long permitting processes, and high capital costs for infrastructure. |
Gas power plant (CHP, CCGT & OCGT) | 2-5 | The lead-times for gas power plants are primarily driven by regulatory approvals, complex design requirements, and supply chain dependencies for specialized equipment. |
Biomass / biogas power plants | 2-9 | Lead-times of 2-9 years are associated with the size of the plant, permitting, construction, and supply chain setup for biofuels, especially ensuring sustainability and compliance with regulations. |
DSR (households & EV) | 0.5-2 | The 0.5-2 years lead-time is based on the setup of necessary technology, consumer agreements, and regulatory processes. This asset requires minimal construction but more focus on agreements and technology readiness. |
DSR (industry) | 0.5-2 | The lead-time of 0.5-2 years for demand-side response in industry is primarily determined by the deployment of necessary technology, the establishment of agreements with industrial participants, and navigating regulatory requirements |
Batteries | 1-3 | Lead-times of 1-3 years are based on the shorter construction and installation period for battery systems, along with the need for grid integration and permitting. Studies suggest BESS can be installed quickly compared to other assets, typically within 1-3 years. |
E-fuels & H2 (X2P) | 4-8 | In the case of hydrogen lead-times of 4-8 years are common due to the development of electrolysers, storage facilities, and infrastructure. |
Thermal energy storage | 2-5 | Typically installed within 2-5 years, depending on system integration with existing heating and cooling networks, and the complexity of installation. |
Grid capacity/ICs | 8-12 | The 8–12 years lead-time for grid upgrades results from extensive planning, permitting, and construction, compounded by stakeholder engagement, supply chain constraints, and integration challenges. |
El. boilers/heat-pumps (w/ alternative fuels) | 1-3 | Expanding heat pump manufacturing typically takes 1–3 years, leveraging modular production and existing air-conditioning technology. |
Sources: IEA (2023) “Energy Technology Perspectives 2023”, UK Power Networks (2021) “DSR Flexibility Service Guide”, IEA (2019) “Average power generation construction time”, eFuel Alliance “eFuels production map”.