Thematic Session 3
Spatial tools to support decision and policymaking
Case presentations
1. Participatory mapping platform for ecological restoration of the Icelandic highlands
Benjamin David Hennig, Professor of Geography, University of Iceland
The Icelandic Highlands are one of Europe’s largest remaining wilderness areas and central to national debates about energy development, infrastructure, tourism and nature conservation. Within the EU Horizon 2020 project PHOENIX – The Rise of Citizen Voices for a Greener Europe – the Icelandic pilot study brought together two complementary participatory components to explore how democratic innovations and spatial tools can inform long-term land-use decisions in this contested landscape.
The first component is the Highland Game, a digital participatory mapping platform that allows citizens to allocate preferred land-use functions to specific parts of the Highlands. Participants explore trade-offs between conservation, recreation, energy infrastructure or transport routes under simple constraints. The game has been used in public events, enabling participants with no technical background to articulate spatial preferences in an intuitive way. The outputs are georeferenced datasets that reveal areas of agreement, conflict and shared priorities, which can be compared with existing environmental and planning data.
The second component is a Citizen Jury, a structured deliberative process in which a diverse group of residents learns about Highland land-use pressures, engages with experts and stakeholders, and jointly develops recommendations for the future governance of the area. The jury deliberations use the spatial products of the Highland Game as evidence to support discussion, allowing participants to reflect on public preferences, perceived conflicts and possible “no-regret” areas. The resulting recommendations are communicated to decision-makers and relevant institutions.
Together, these two elements demonstrate how participatory mapping and deliberative mini-publics can be valuable components in strengthening the knowledge base for land-use policy. The approach offers a transferable model for other contexts where large landscapes face competing sectoral claims, and where inclusive and evidence-informed participation is needed to support long-term planning and policymaking.
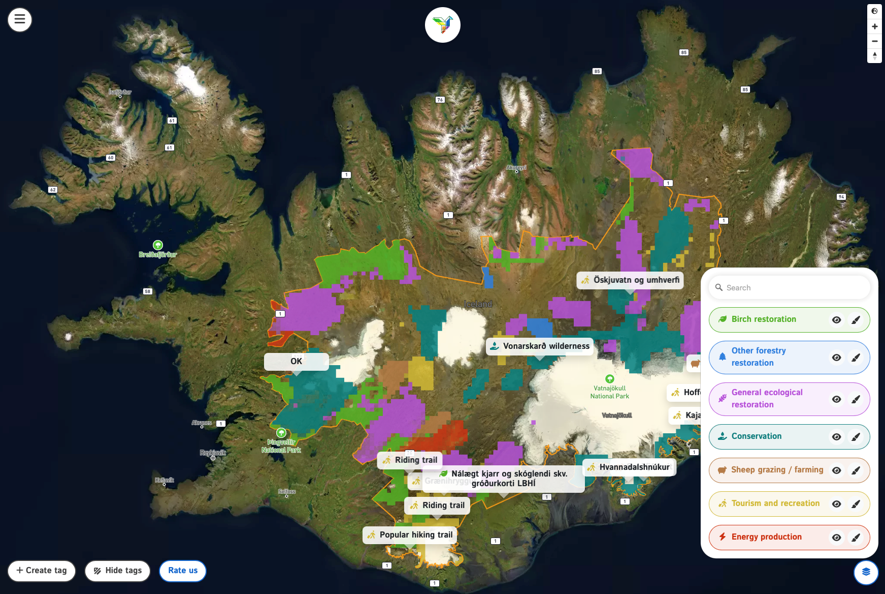
Image of the Highland Game from the Icelandic pilot study within the EU Horizon 2020 project PHOENIX – The Rise of Citizen Voices for a Greener Europe.
2. The European wetland map
Cosima Tegetmeyer, Moritz Kaiser, Alexandra Barthelmes, Michael Succow Foundation, Partner in the Greifswald Mire Centre
The European Wetland Map (EWM) improves the current state of knowledge on wetlands across Europe by locating, assessing and merging the latest geospatial data. This is important because wetlands, especially peatlands, play a key role for biodiversity and in climate change mitigation. If undisturbed, they provide crucial ecosystem services. However, many European wetlands have been damaged by drainage. Drained wetlands exacerbate or cause major environmental and socio-economic problems, including soil degradation, floods, droughts and biodiversity loss. In addition, drained peatlands are a strong source of greenhouse gas emissions.
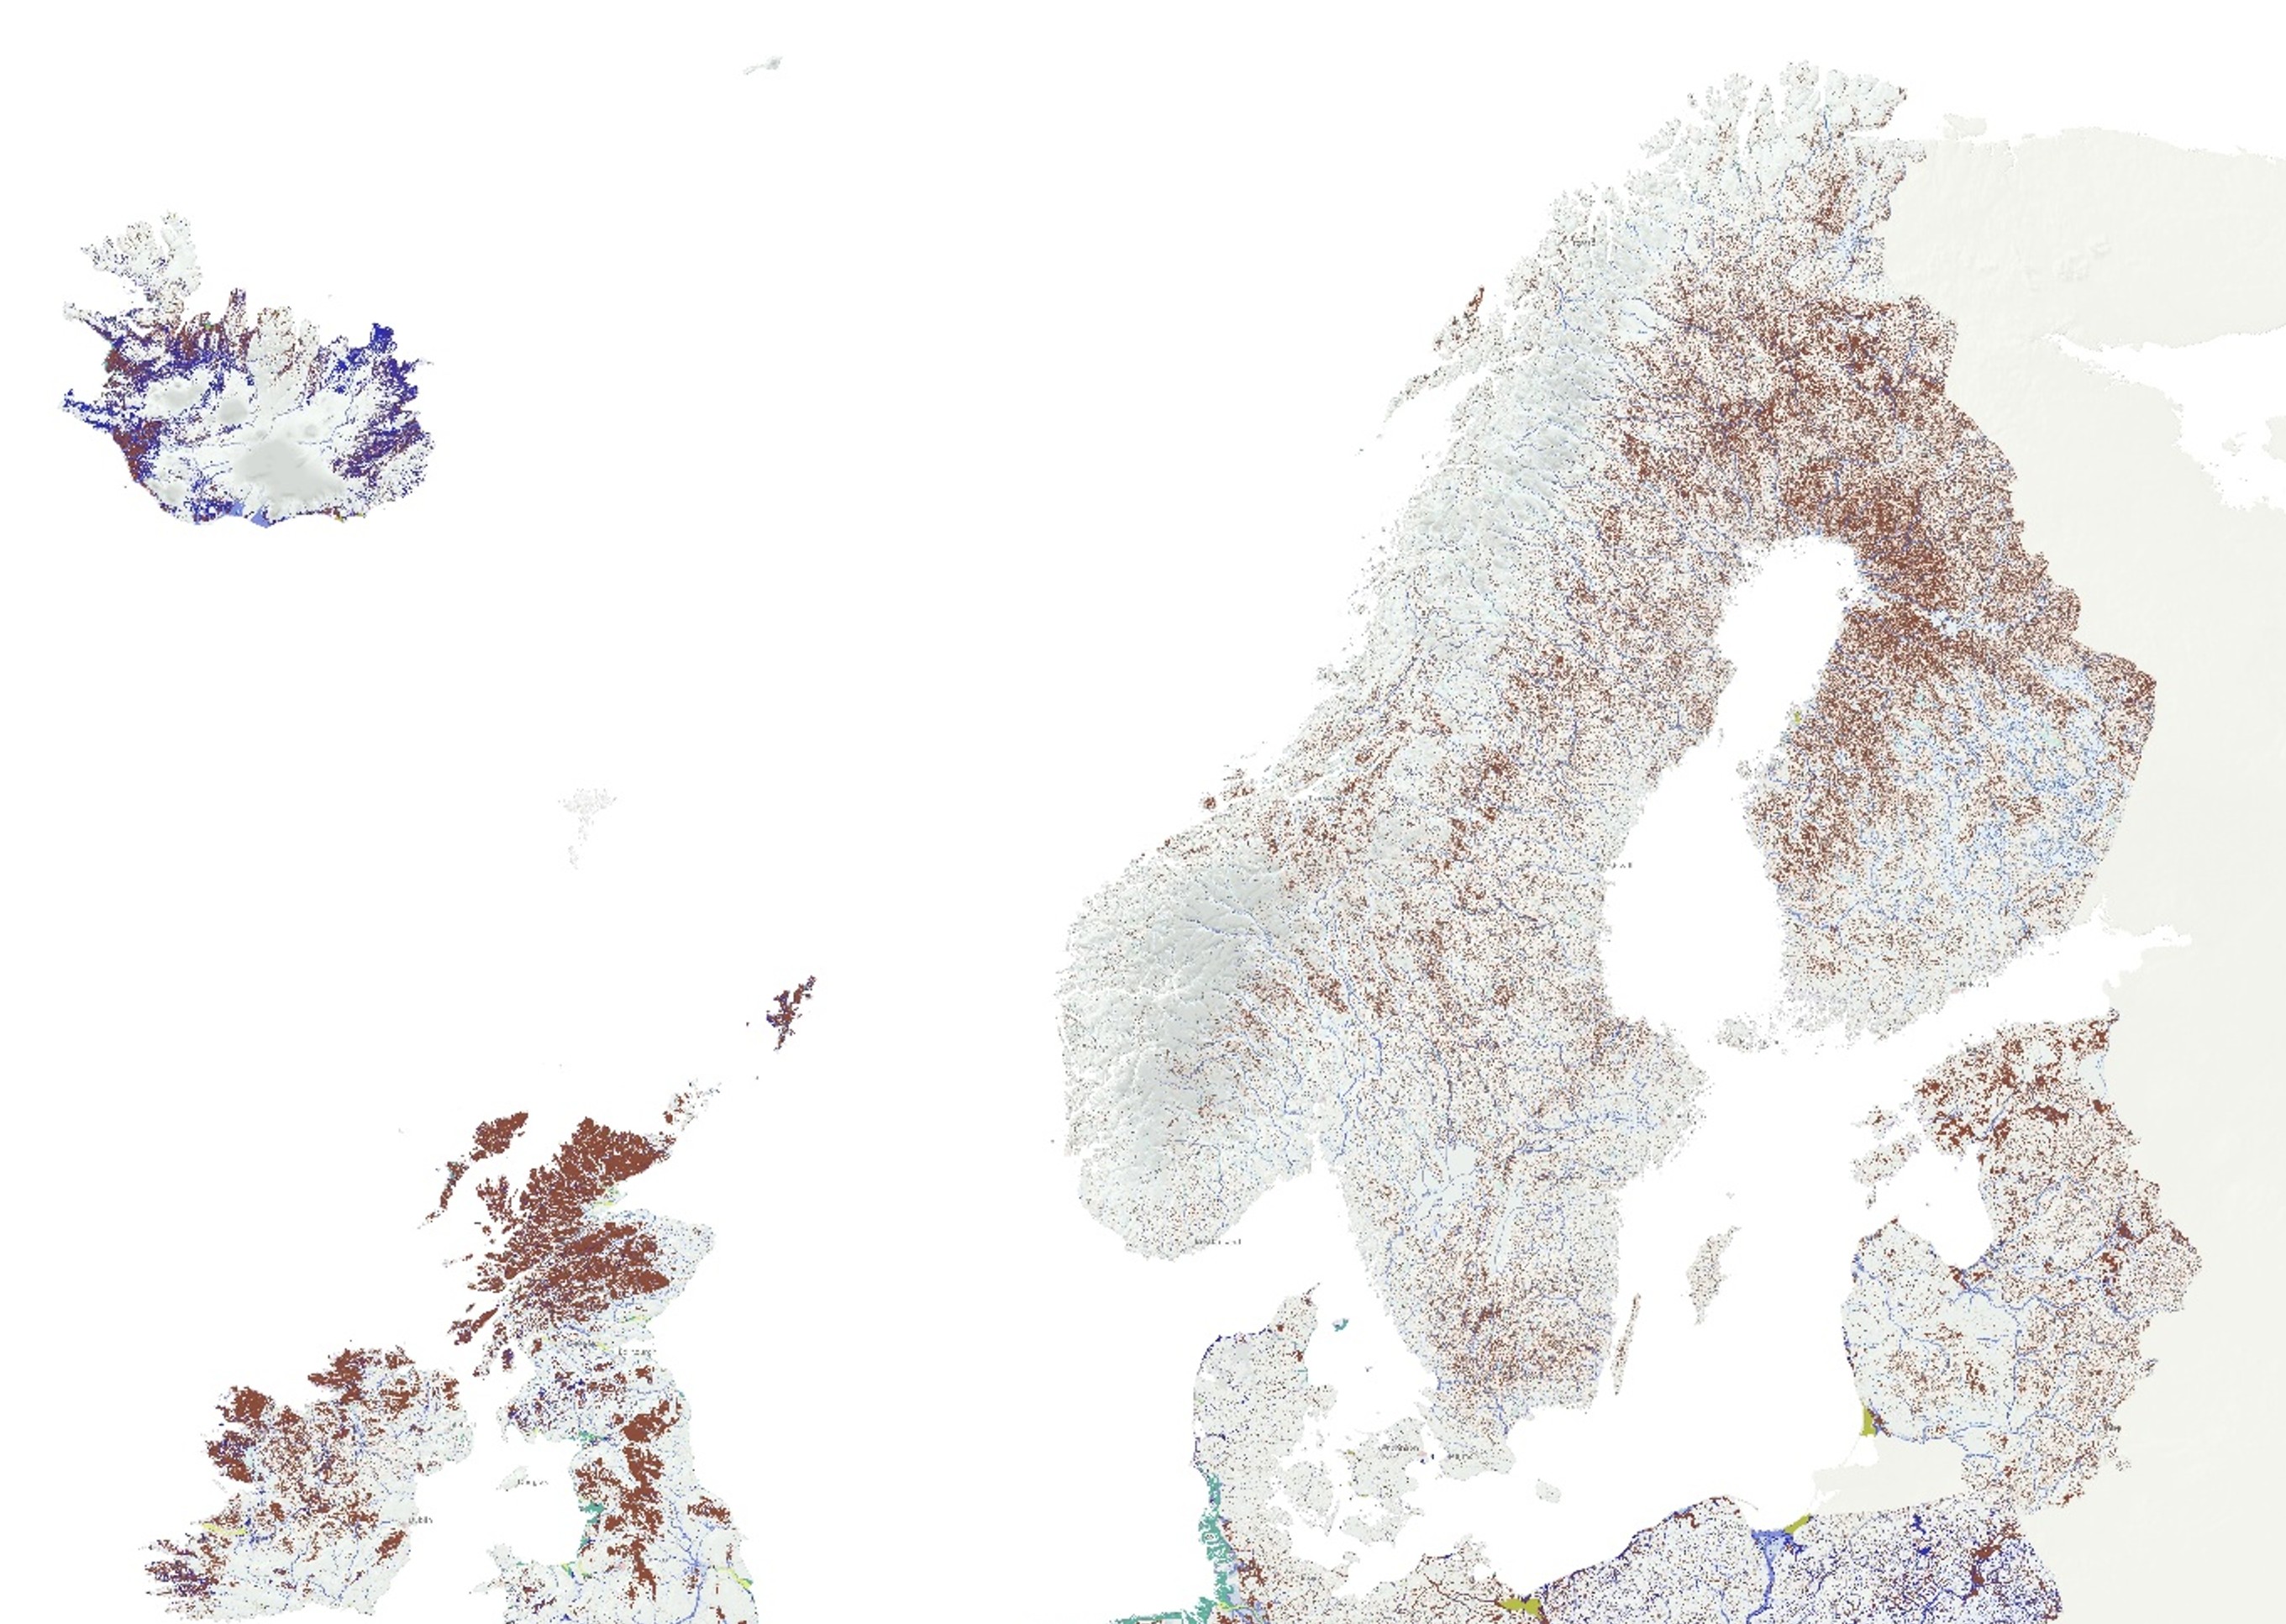
To halt wetland degradation and restore ecosystem functions by enabling adequate policies and management, a good understanding of wetland location and extent is necessary. Many regional, national, and some basic European datasets do exist, but the overall picture was missing. The specific objective of the EWM was thus to elaborate sound multiscale spatial wetland data, mainly by identifying, harmonizing, and integrating available information. The EWM includes data on the distribution and types of floodplains and wetlands – the latter being further distinguished as coastal wetlands, mineral wetlands and peatlands. To create the EWM, spatially explicit information on wetlands was mainly obtained from peatland and soil research publications and European, national and regional administrative databases. The EWM covers the European Union and many additional European countries, including Iceland and Norway.
The EWM brings together existing data into a comprehensive, easily accessible resource to make widespread European wetlands visible and enhance their analysis, understanding and management. The data is compiled per country and is freely available in a Geodatabase in highest spatial resolution and for easier processing as country-wise GeoTIFF collection in lower resolution. For more information, please refer to the technical description (EWM24_Technical_description_GMC_v5.pdf) and geodata download: https://doi.org/10.5281/zenodo.14505351
3. Map-based greenhouse gas calculator for spatial planning purposes
Gunnhild Søgaard, Head of Department, Forest and Climate, Norwegian Institute of Bioeconomy Research (NIBIO)
NIBIO has developed a map-based greenhouse gas calculator designed to estimate emissions and removals resulting from both current land use and planned land use changes.
The calculator aims to simplify and harmonize the calculation of these emissions and removals for municipalities, counties, consulting firms, developers, state agencies and directorates responsible for land use planning and infrastructure.
Using the calculator enables assessment of the impact of land use and land use changes on emissions and removals, in line with municipal and national goals for reducing greenhouse gas emissions. A key reference is the greenhouse gas accounts for municipalities and counties, prepared by NIBIO on behalf of the Norwegian Environment Agency (2024a).
The map base in this service describes current land use and is compiled from map data from various public data sources. Users can upload land use plans or manually draw and classify areas according to their intended purpose. The service then calculates the effects on emissions and removals resulting from both current land use and planned changes, such as new cultivation or afforestation. The calculator’s calculations follow IPCC guidelines and the methods used in Norway’s national and municipal greenhouse gas accounts for the land use, land-use change, and forestry (LULUCF) sector, as well as recommendations from the Norwegian Environment Agency’s Handbook for Impact Assessments (IPCC 2006, IPCC 2013, IPCC 2019, Norwegian Environment Agency 2024b).
The new national planning guidelines for climate and energy in Norway state that the government shall provide knowledge about emissions and removals of greenhouse gases from land use and land use changes. Counties and municipalities, in turn, must obtain knowledge and use it in land use planning. These guidelines increase focus on measures to reduce greenhouse gas emissions and enhance removals from land use and land use changes. This necessitates that knowledge, data, and calculation methods are readily accessible for decision-making processes.
The calculator is currently used by about 100 municipalities in Norway. From January 2026, the calculator will be implemented nationally and will become part of the toolkit used for climate and environmental impact assessments. Since autumn 2025, the service has been further developed through collaboration between NIBIO and the Norwegian Environment Agency.
Website for the service:
https://nibio.no/tjenester/kartbasert-klimagasskalkulator-for-arealbrukssektoren
https://nibio.no/tjenester/kartbasert-klimagasskalkulator-for-arealbrukssektoren
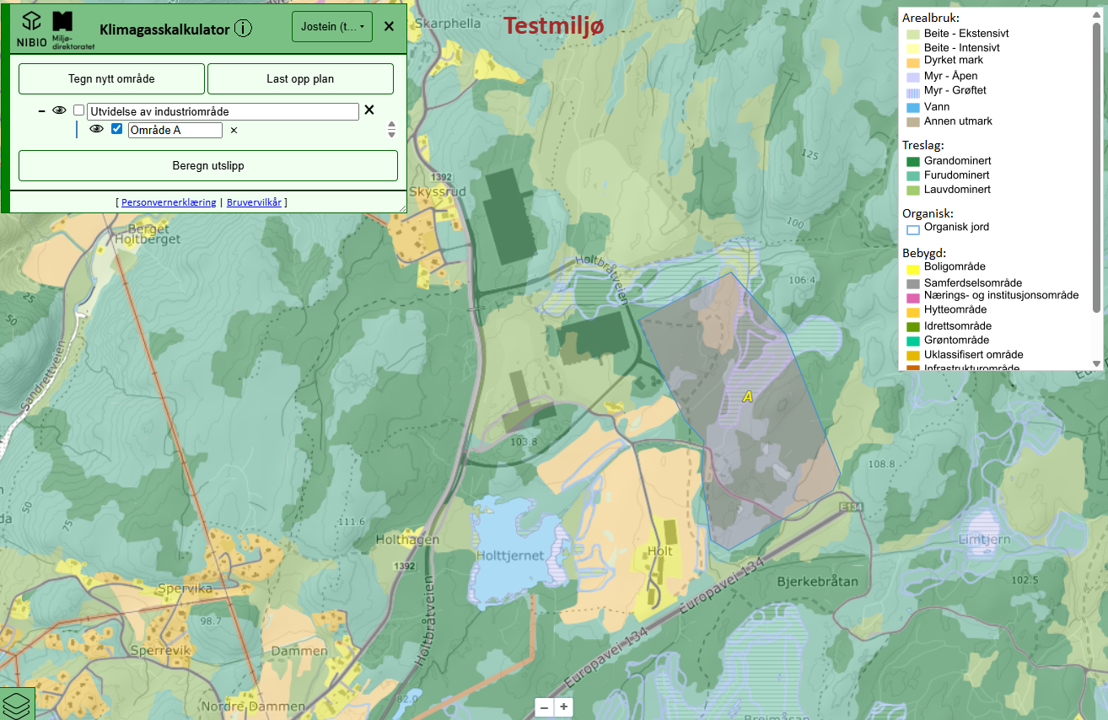
The calculator estimates emissions and removals associated with both current land use and planned land-use changes.
Group discussion summary
The recommendations presented in this chapter are based on the group discussions held during Thematic Session 3: Spatial Tools to Support Decision- and Policymaking
Core questions
What governance innovations could strengthen the legitimacy and use of spatial knowledge in policy processes? What is needed to ensure that spatial tools are scalable and comparable across regions? How can evaluation and learning be organised to improve the use of spatial knowledge in planning? What level of granularity is appropriate for spatial data when informing policy?
Policy recommendations
Discussion summary
Strengthen trust and legitimacy in the use of spatial knowledge
The discussion emphasised that the value of spatial tools in policy processes depends primarily on trust, legitimacy, and clarity about how data are used. While technical capacity to collect and visualise spatial data has expanded rapidly, participants stressed that maps only support decision-making when their purpose, assumptions, and uncertainties are clearly communicated. Strengthening transparency and guidance on appropriate use was seen as essential.Support local decision-makers as a key link between data and policy
Participants highlighted that municipal planners and local politicians often operate under strong pressure to prioritise short-term economic benefits over long-term land-use objectives. In this context, spatial tools can either support or weaken decision-making. Targeted capacity-building and training for local authorities were therefore identified as critical to enable informed use of spatial knowledge and to strengthen implementation of agreed plans and policies.Clarify when data harmonisation and comparability are needed
The discussion questioned the assumption that spatial data must always be fully harmonised and comparable across regions. Participants argued that comparability should be driven by policy needs rather than technical ideals. While harmonised data are essential for international commitments and shared Nordic reporting obligations, context-specific approaches may be more appropriate for national and local decision-making.Differentiate data needs across policy stages
A key conclusion was that different levels of data granularity are required at different stages of the policy process. Aggregated spatial information is often sufficient for strategic policy direction, while high-resolution and accurate data become critical during implementation. Inadequate data quality at this stage risks undermining both effectiveness and legitimacy.Balance scientific ambition with the need for action
Participants identified a tension between the pursuit of increasingly detailed data and the need for timely policy action. Excessive focus on data perfection can delay implementation and shift attention from policy direction to technical debate. Aligning data collection with clearly defined policy objectives was therefore seen as essential.Use spatial tools for learning and engagement
The discussion also highlighted the potential of spatial tools as learning and engagement instruments for both decision-makers and citizens. Participatory mapping and visual tools can strengthen understanding of land-use trade-offs, but participants noted the need to complement open participation with more structured and representative forms of engagement.