Chapter 2: Comparison of Reporting Practices on Recycled Municipal Waste
The following chapter includes two overall parts:
2.1 Comparison of the Participating Countries’ Calculation of Recycling
The countries are all aiming at measuring recycled MW according to the WFD and related delegated acts. However, there are differences in how the participating countries calculate recycled amounts of MW and estimate the recycling rate of it. Furthermore, there are also differences in whether each country is able to calculate the recycling rate of each MW-fraction. It is fruitful to compare recycling of MW and the MW-fractions between countries since it can provide insights on which improvements are possible in the various countries. It may possibly address whether the quality of waste collection and sorting can be improved or if a single country uses more efficient recycling technology. In order to clarify whether it is possible to compare the countries' recycling of MW and at what level it is possible, the countries' approach to estimate recycled MW will be explained in the following and compared in order to identify possible methodological differences.
2.1.1 Comparison of the Participating Countries’ Calculation of Recycling
The countries have different data points available in the waste flow for calculating recycling of MW. Figure 1 illustrates a simplified waste flow of waste management: The process starts when the waste is generated and disposed of in the bins by its producer, such as a household or a business. A collector then pics up these bins and transports the waste to sorting facilities. Finally, the sorted waste is sent to a treatment facility, where the waste is either recycled, incinerated etc.
The amount of produced MW consists of the sorted MW-fractions and the residual waste. The residents do not sort their waste perfectly, meaning that the residual waste consists of some of the fractions that should have been sorted out. By performing waste composition analysis, it is possible to estimate the amounts of missorted waste in the residual waste bin. However, not all countries do these waste compositional analyses, and without these, the generated amount of each MW-fraction cannot be known, only the separately collected amount of each MW-fraction. Consequently, it is not possible for all countries to report on the material breakdown of generated amounts of each fraction to Eurostat.
Figure 1: Data points (illustrated as dark blue boxes with country codes) in the waste flow. NO* indicates that Norway differs from the other countries in methodology to measure MW from households and MW from other sources (see Appendix C).
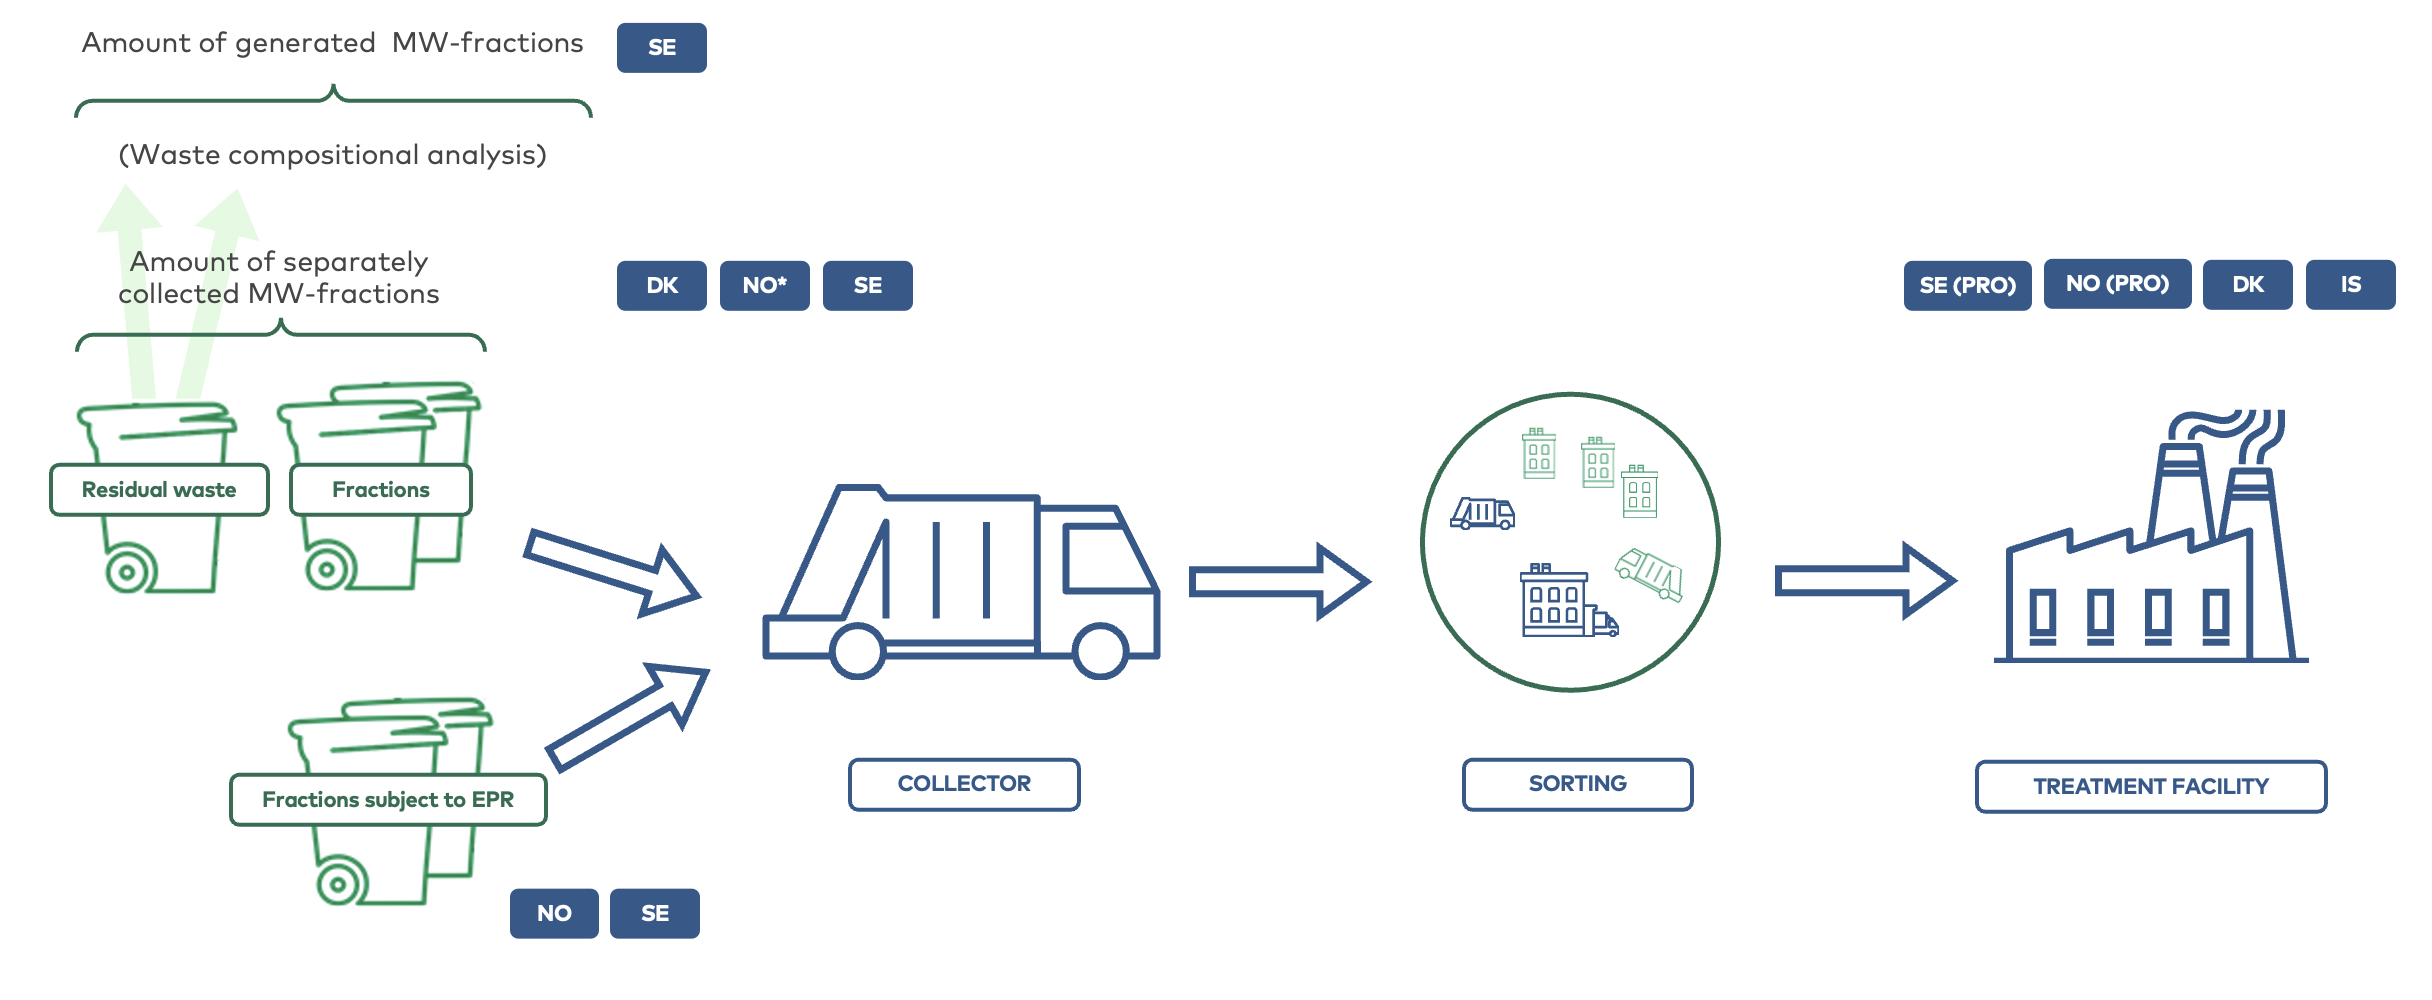
In Figure 1, the countries´ different data points are illustrated: In Denmark, Norway and Sweden, data exists on the separately collected amounts of the MW-fractions and the amount of residual waste. Sweden and Norway are also able to estimate the generated amount of each MW-fraction for material breakdown since the results from waste compositional analysis of the mixed waste is available. Sweden has implemented reporting on generated amounts already, while Norway only has reported separately collected amounts so far. In Denmark, private and municipal collectors report the separately collected amounts to the Danish Waste Data System. In Sweden and Norway, there are three reporting systems respectively for reporting the separately collected amounts to the authorities. The PROs report to one system and municipalities and collectors of MW report to two other systems. This implies a difference in received data in Norway and Sweden compared to Denmark, which depends on whether the waste is covered by an EPR scheme or not.
In contrast to the other participating countries, Iceland does not have data on neither generated nor separately collected amounts of MW. As Figure 1 illustrates Iceland only has one data point in the waste management flow, which is at the treatment facility. As described in Appendix B Iceland estimates generated amounts of MW based on data on treated amounts, and it is estimated/calculated as the sum of all reported treated amounts of MW.
Denmark and Iceland collect data on the waste received at the final treatment facilities, e.g. recycling facilities, incinerations plants etc., meaning that data for the received amounts to the final treatment facility exists both in Denmark and Iceland. This also applies to the fractions that are covered by EPR schemes in Sweden and Norway, as these amounts are registered and reported by the PROs.
2.1.2 Calculation of Recycling Rate
In the following, it will be explained how the calculation of the recycling rate of MW should be done in principle. This will be linked to the data points that each country is in possession of, which are explained in the waste flow in Figure 2.
In the WFD, targets are set on the recycling rate of the total amount of MW generated. The rate is calculated for each country by Eurostat, and is assumed to be calculated like this:
The same equation would in principle apply for a specific MW-fraction. For instance, the recycling rate for plastic in MW would be:
This type of calculation, which estimates the recycling rate of a specific MW-fraction, is in practice only applicable to Sweden and Norway. The reason being that Sweden and Norway are the only countries, which possess the knowledge of the generated amounts of each MW-fraction due to compositional analysis on residual waste. Since, Sweden and Norway are the only countries able to calculate the recycling rate of each MW-fraction, another measure is introduced that enables comparisons between all the countries in the project group: recycling efficiency. The project group has identified that the measure recycling efficiency, should be available for most countries despite differences in data gathering and methodology. This assessment is based on the assumption that most countries report separately collected amounts as generated amounts, since reporting on generated amounts necessitates waste compositional analysis of the waste. Furthermore, the introduction of this term does not necessitate the submission of additional data to Eurostat beyond what the member states currently provide. This indicates that the recycling efficiency for each MW-fraction can be calculated for most EU member states.
Recycling efficiency is a measurement of the share of recycled amount out of the separate collected amounts. In contrast recycling rate is a measurement of the share of recycled amount out of the generated amount, which includes separately collected amounts and missorted waste in the residual waste. The amount of MW prepared for reuse is included in both rates.
For instance, the calculation of the recycling efficiency for plastic in MW reads:
For all MW-fractions in Denmark and for the MW-fractions subject to EPR in Norway and Sweden, the separately collected and actual recycled amounts received at the treatment facilities are known. See the illustration again in Figure 2 of the waste flow below.
Figure 2: Data points (illustrated as dark blue boxes with country codes) and estimation points (illustrated as light blue boxes with country codes) in the waste flow. NO* indicates that Norway has different ways to measure MW households and MW from other sources (see Appendix C).
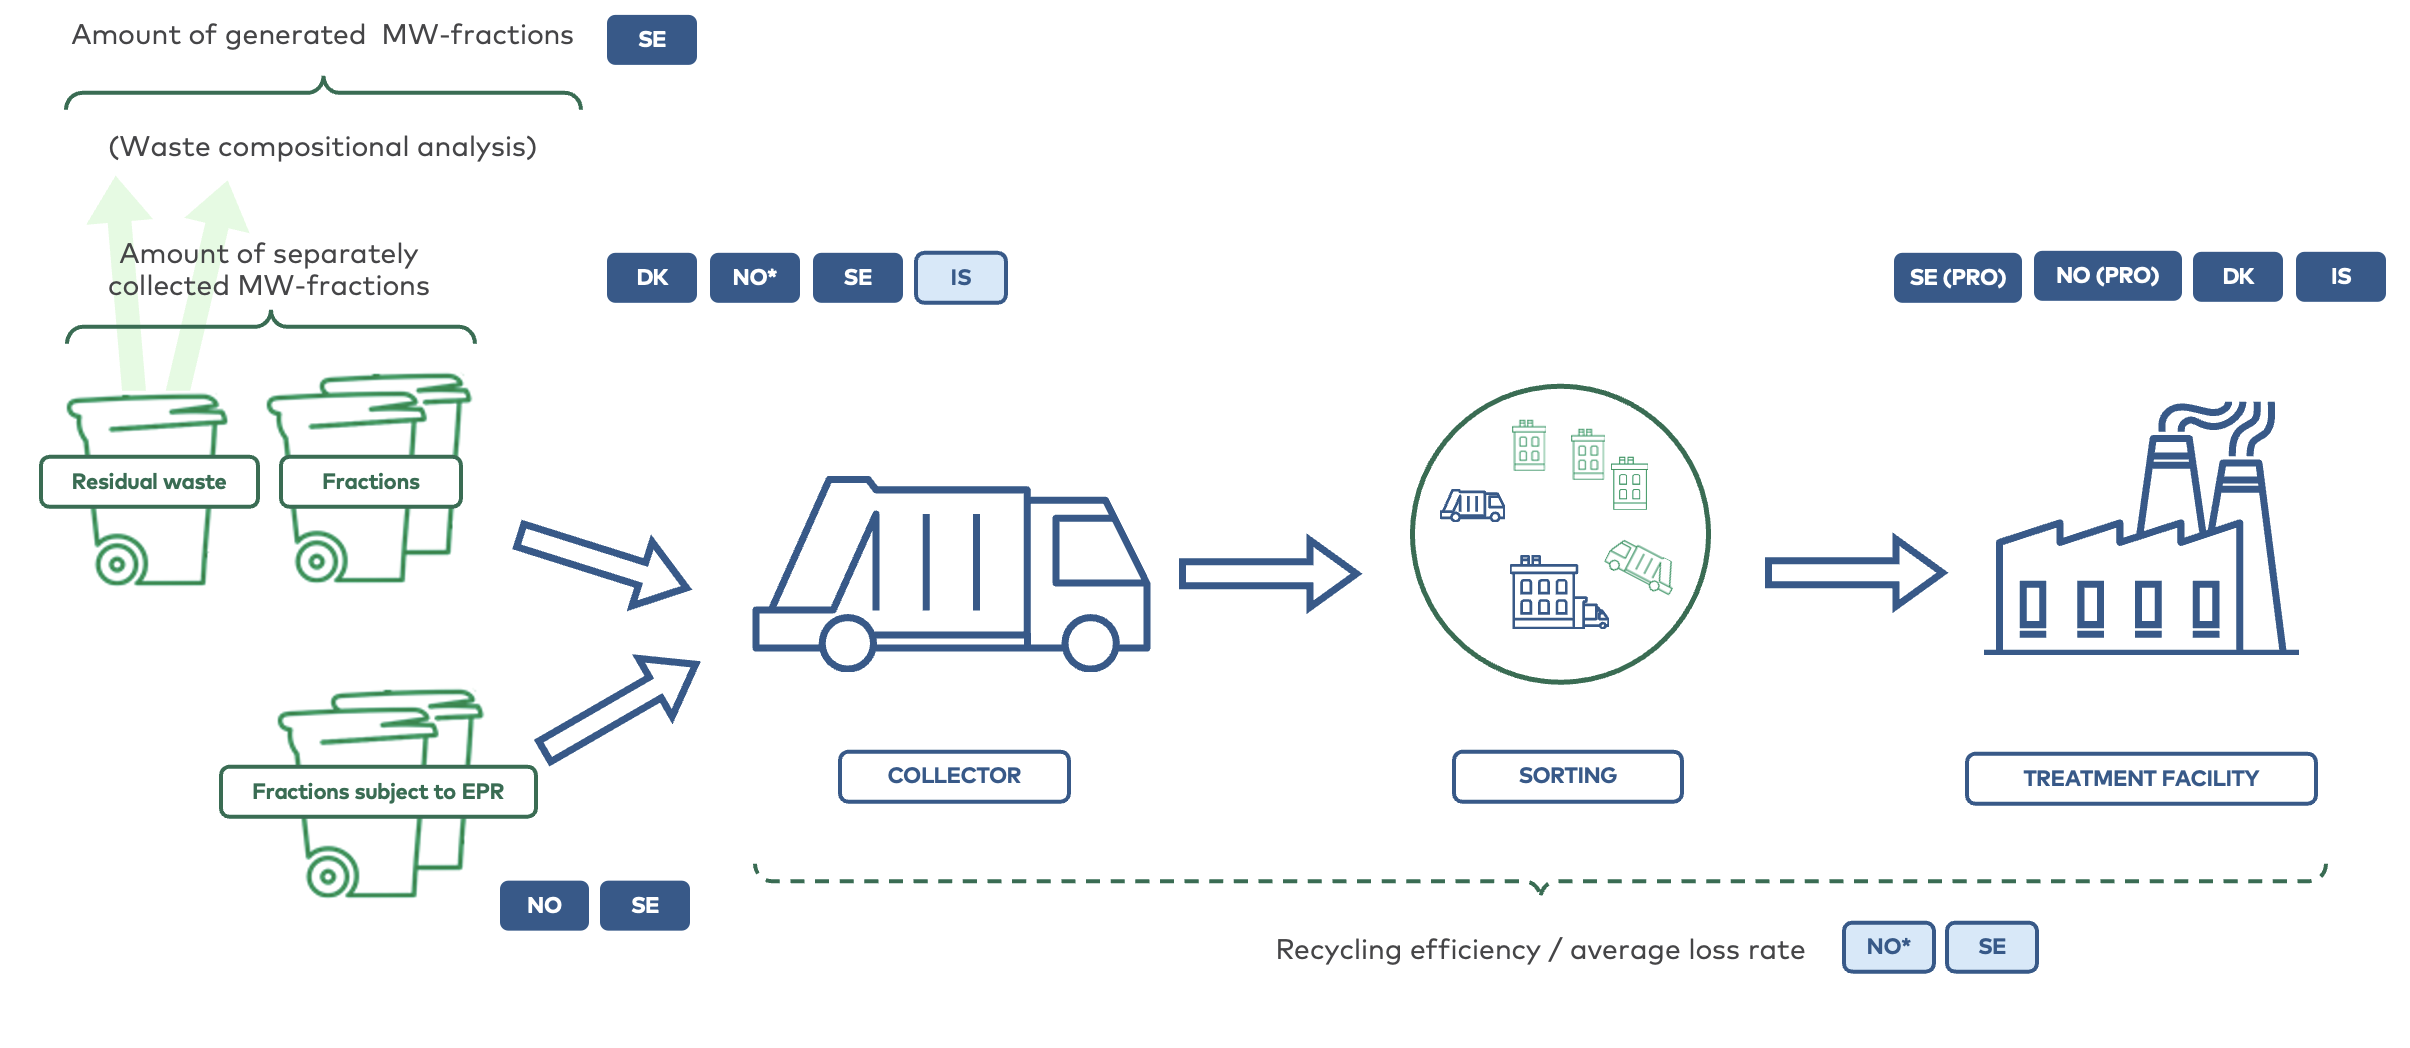
For the MW-fractions in Sweden and Norway that are not covered by EPR, the recycled MW amount at the final recycling facility is not reported by the treatment facilities. Instead, the ALR is estimated by the respective authorities and consultants in each country for each waste fraction. The estimation in both countries is based on surveys and interviews conducted with various waste management actors and recycling facilities, who provide insights into their respective losses as described in detail in Appendices C and D. These losses are used for calculating the recycled amounts from what is collected and intended for recycling. The ALR states the share of waste intended for recycling that has been lost before it is actually recycled. The recycling efficiency states the share that is actually recycled from the separately collected amount. Thus, the same calculation point is used, the countries’ approach to estimating recycling of MW is done in different ways due to their different data points in the waste flow as illustrated in Figure 2.
Recycling efficiency – exemplification of the method
The project’s aim is to identify potential differences in methodology and reporting practices affecting data on MW. Thus, it is slightly out of scope of the project to analyze the recycling potential. However, the project group will in the following give a few examples of the recycling efficiency for the participating countries. This is in order to illustrate how estimating recycling efficiency can be a helpful tool to compare countries for identifying methodological differences and recycling potential. The following does not constitute an exhaustive study of the countries' recycled MW, therefore further investigation is needed for more conclusive results.
Indication of issues with the country’s used methodology
For instance, Iceland had a 100% recycling efficiency for multiple material fractions (Metal, paper and cardboard, batteries). It does not seem accurate and valid that 100% of the separately collected amounts are recycled. There will always be some loss during the process between collection and recycling. The project group assesses that this highlights two facts within the Icelandic approach to measure generated and treated amounts of MW, which are significant for the Icelandic outcome:
- Iceland uses data on treated amounts of waste to provide data on generated amounts.
- When waste is exported for treatment the total amount of exported waste is reported as being recycled without taking losses in the process into account.
Indication of potential improvement
In Table 2.1 below the recycling efficiencies of selected MW-fractions for the participating countries are shown.
Table 2.1: Recycling efficiencies of selected MW-fractions for the countries
Denmark | Iceland | Norway | Sweden | |
Paper and cardboard | 98% | 100% | 89% | 85% |
Wood | 86% | 16% | 14% | 0% |
Glass | 99% | 0% | 92% | 96% |
Among the countries in the project, excluding Iceland, Denmark has the highest recycling efficiency for paper and cardboard. This is likely due to Denmark’s dryer and cleaner sorting of this fraction, as they sort liquid packaging board like Tetra Pak together with plastic unlike Norway and Sweden, who sort it together with paper and cardboard. As described earlier, Iceland export paper and cardboard for treatment, which explains their recycling efficiency of 100%.
Denmark has a significant higher recycling efficiency for wood than the other participating countries. The other countries primarily utilize municipal wood waste for energy recovery or other recovery methods. This highlights, according to the project group’s assessment that these countries could potentially benefit from exploring the treatment methods employed by Denmark. However, a more detailed investigation is needed to clarify why the treatment methods used in Denmark are not currently adopted by the other Nordic countries.
All the participating countries, except for Iceland, have a remarkable high recycling efficiency for glass. This could therefore present a considerable opportunity for improving recycling in Iceland in light of the fact that Iceland does not recycle glass.
In order to calculate the recycling efficiency based on the Eurostat reporting it is essential that the cells “Municipal waste generated (tons)” and “Separate collection (tons)” are reported accurately by the countries in the Joint Questionnaire for Material Breakdown. It is now voluntary to provide data on separate collection in the Joint Questionnaire for Eurostat reporting. However, it is assessed that some countries report separately collected amounts in the material breakdown of generated amounts. This issue is elaborated in Chapter 3, Section 3.1.2 in which the project group presents its recommendation on modifying the reporting requirements for generated and separately collected MW.
2.2 Analysis of Changes due to the New EU methodology on Recycling
The following section refers to an “old” and a “new” EU methodology on recycling. The methodology and conceptualization of recycling changed with the revision of the WFD in 2018 and attendant Commission Implementing Decision (EU) 2019/1004. The “old methodology” refers to Article 11, 2(a) in the WFD, which specify the recycling target on 50% of household waste and waste from other sources. The target was already specified in the WFD from 2008 and the delegated act from the Commission Decision 2011/753/EU establishes the calculation rules for verifying compliance with the target. The old methodology on recycling was widely interpreted, as the amount collected for recycling (sometimes referred to as “input approach”). With the revision of the WDF in 2018 new recycling targets for 2025, 2030 and 2035 were formulated for MW in Article 11(2), points (c), (d) and (e). Furthermore, the definition of recycling can be found in Article 3 number 17 of the WFD. The calculation rules are stipulated in Article 11a(1) point (c), and 11a(2) of the WFD. Additionally, the calculation points are specified in Article 3(2) and Annex I of Decision (EU) 2019/1004. Collectively, these references establish a comprehensive definition of what is to be considered as recycling.
The calculation rules to verify compliance with the recycling targets for 2025, 2030 and 2035 are laid down in Article 11a, which was introduced in the same revision of the WFD. The calculation rules are further specified in the Commission Implementing Decision (EU) 2019/1004. With this “new methodology” the recycled amount is to be understood as the amount of sorted waste which, without further preparatory measures, is brought into the recycling process. This means that that the losses that occurs in the sorting and treatment process (before the “calculation point”) cannot be counted as recycled amounts, while eventual losses occurring after the calculation point, during the recycling process, are counted as recycled.
In accordance with the old EU methodology on recycling and the Commission Decision 2011/753/EU, it was optional to choose between four different methods, which meant that the recycling rate could be calculated on a selection of MW-fractions only, all MW from households or all MW from both households and other sources.
As it is now, the countries are obliged to report recycled amounts on all MW originating from both households and other sources according to the new methodology in table 1 and 2 of the Municipal Waste Joint Questionnaire, since the reporting must be based on the Implementing Decision (EU) 2019/1004. It is optional for the country to report according to the old methodology in Commission Decision 2011/753/EU in Table 3 from the then-current Joint Questionnaire, if the country wants to show compliance with the old recycling target for 2020. This target applies until the MW data for 2025 is submitted.
The following subsections analyze the data shifts due to the change of the EU methodology on recycling and reporting rules as of the revision of the WFD in 2018 and attendant decisions.
2.2.1 Main effects
The project identifies three changes (effects) related to the change in EU methodology on recycling:
- the calculation point for calculating recycling: overall a change from “collected aimed for recycling” to “actual recycled waste”;
- the definition of MW: overall all countries have expanded, what is included as MW, however also some restrictions has occurred (e.g. Sweden has excluded C&D-waste); and
- the change in the definition of MW also has a “side”-effect on the recycling rate since “new” included fractions of MW may have either a better or a worse recycling potential than before and thus influence the aggregated recycling rate significantly. This effect can explain the difference in size of the countries’ change in recycling rate since the recycling potential varies across materials varies; and
- the change to only allow calculating on all MW originating from households and other sources (previous method 4 according to the old methodology), meant a larger change for those countries using alternative methods (previous method 1–3 according to the old methodology) than for the countries who applied method 4 according to the old methodology.
The project concludes that changes in methodology on how to calculate recycling and, which MW-fractions to be included, influence the estimated recycling rates. Therefore, methodology has an impact on target attainment. For most of the Nordic countries in this project, the ambition of the new targets set in the revised WFD was especially difficult to attain with the new methodology.
The recycling rate for all the participating countries dropped with the change of the calculation method, but it is mainly a result of the change in methodology and not a major drop in the countries’ ability to recycle MW, so without considering the change in methodology the data can be misleading.
In Chapter 1 of the report, the project concluded that the countries differ in their delimitation and therefore also operationalization of MW. So, despite the countries being obligated to use the same method in the new EU methodology, their use of this method differs significantly causing different measurements. In the following, it is described that the countries also differ in their delimitation of MW and choice of method (1–4) according to the old methodology before the WFD revision in 2018.
In other words, the participating countries have all, except for Iceland, changed their operationalization of MW but what they have changed from and to are not, in practical terms, the same. So, neither their “starting point” nor their “ending point” of the conceptions of MW is similar. This is relevant to keep in mind when studying the following results.
2.2.2 Analysis of the Changes in Recycling Rate
Table 2.2 shows an overview of changes due to the new EU reporting obligations on recycling across the Nordic participating countries. The table presents a simplification of the countries’ “old” and “new” method and the change in recycling rates.
The project group concludes that for Denmark, Norway and Sweden the new methodology on recycling has resulted in a remarkable change in the countries’ method to delimit MW and calculate recycling which also has resulted in a drop-in the recycling rates compared to using the old methodology. Norway has experienced the lowest drop-in the recycling rate with 4%, Denmark a drop-in recycling rate with 6% and Sweden with the largest drop-in recycling rate with 23%. As should be noted Iceland has not found it necessary to change their method in order to apply to the new methodology, which explains why Iceland as the only country does not experience a change in recycling rate.
As can be seen in Table 2.2, the drop in the recycling rate differs in size across countries. This is partly because it differs across countries to what extent it was necessary to change their method in order to apply to the new method. This is most evident when looking at Sweden’s drop in its recycling rate, which also had to make the most significant changes to their methodology changing from method 2 (including only paper, metal, plastic, glass, bio-waste, batteries and WEEE from households and other sources) that is allowed due to the old methodology for calculating all MW from households and other sources.
However, as mentioned earlier in this section, changes to the delimitation of MW, are changing the material fractions included, and some “new” included fractions may have better or worse recycling potential. Therefore, new included fractions may either increase or decrease the recycling rate and the change in recycling is an aggregation of this – see Table 2.2.
Table 2.2: Changes due to the new EU methodology on recycling – comparison across countries
Method for delimiting MW | Included MW- fractions | Calculation point | Recycling rate 2011/753/EU | Recycling rate (EU) 2019/1004 | Change in recycling rate | |
Denmark 2011/753/EU | 4 | All MW from household and the service industry | Collected aimed for recycling | 54% (2021) | -6% | |
Denmark (EU) 2019/1004 | All MW generated from households and other sources | Actual recycled waste | 48% (2021) | |||
Iceland 2011/753/EU | 4 | All MW (treated amounts instead of generated amounts) | Actual recycled but compared to treated instead of generated | 26% (2020) 27% (2021) 24% (2022) | N/A | N/A |
Norway 2011/753/EU | 3 | All MW from households | Collected aimed for recycling | 41% (2018), 42% (2019) | ~-4% | |
Norway (EU) 2019/1004 | All MW generated from households and other sources | Actual recycled waste (reported or estimated with ALRs) | 38% (2020) 37% (2021) | |||
Sweden 2011/753/EU | 2 | Paper, metal, plastic, glass, bio-waste, batteries and WEEE | Collected aimed for recycling | 61% (2020) | -23% | |
Sweden (EU) 2019/1004 | All MW generated from households and other sources | Actual recycled waste (reported or estimated with ALRs) | 38% (2020) |
Note: For an elaborative description of the countries application of the methodology according to 2019/1004/EU is referred to Appendices A–D. Available data is used to show change in recycling rate in order to compare. Thus, differences in the years during which the data originates from, will occur. The year is in parentheses.
2.2.3 Elaboration on the Individual Country
Sweden’s recycling rate dropped 23% when using the new methodology on recycling compared to the previous one. The drop can be explained as follows: Firstly, by the fact that Sweden used to only base their calculation on a subset of MW-fractions choosing method 2 and now, due to the new rules in place, is required to base data on all MW according to the previous method 4. Secondly, Sweden changed its method from an input-oriented approach (collected aimed for recycling) to an output approach, where losses (non-target material) in the recycling process are taken into account. Thirdly, since some waste flows with a poorer degree of separate collection and recycling efficiency were additionally included in the calculation of the recycling rate for MW, such as wood, textiles, hazardous waste and street cleaning waste, it also affected the recycling rate negatively. Similarly, waste that is highly source-sorted and recycled is no longer classified as MW, such as bulky metals considered to be C&D-waste. Sweden will continue to report according to method 2 in table 3 in the Joint Questionnaire, to comply with the recycling target for 2020.
Norway experienced a drop in its recycling rate after implementing the new EU methodology and calculation points on recycling. However, a greater reduction rate was expected.
Before 2020, Norway reported, due to method number 3, on recycling of only waste from households, and the recycling rate was based on waste collected as aimed for recycling. The method used to select the waste data that was included in the reporting was highly simplified. As for the reference year 2020 (reporting year 2022), the reporting also includes similar waste from other sources from the NACE-codes B–S. In addition, the methodology regarding calculating the relevant waste materials to be included in the reporting has undergone changes in order to meet the definitions and guidelines laid out. In addition, ALRs are used to calculate the losses that occur in the treatment processes to calculate the actually recycled amounts. Due to these significant changes in the methodology, and the reduction in the recycling rate due to the new calculation point, it was expected that the reduction of the recycling rate would be higher than what the results show. It seems that some of the changes must have resulted in an increased recycling rate that compensates the reduction due to the new calculation point. It has not been possible to explain the relatively lower drop in the recycling rate for Norway within this project. A speculation is that the net recycling potential in the included waste materials probably is higher in the recent reporting model, than in the previous.
Denmark used a different definition of MW before the revision of the WFD. Denmark only used their own national waste codes to calculate MW and only included waste from households and the service industry. The definition has since changed and now Denmark defines MW through a combination of LoW codes and the national waste codes. Consequently, Denmark, applying the new method, estimates the amount of MW stemming from all industries, instead of only the service industry (as was the case before the WFD from 2018). This is a significant change in delimitation of MW, so even though it appears from Table 2.2 like Denmark did not change methods, there has been a significant change in the Danish delimitation of what constitutes MW. The generated amount is calculated as the separately collected amounts including mixed waste and it applies for both the old and the new method (before and after the revision of the WFD in 2018).
Before the revision of the WFD in 2018, Denmark reported collected amounts aimed for recycling as this was interpreted as the recycled amount. The loss in the treatment process was not taken into account. These amounts ‘collected for recycling’ is still reported in table 3 in the Joint Questionnaire in order to comply with the recycling target for 2020, which is based on the previous methodology. To be able to report in table 1 and 2, which must be based on the new methodology on calculating recycling, Denmark makes use of a newly developed dynamic calculation model, which makes use of the reporting to the Danish Waste Data System. Simply put, the new method calculates the recycling rate as the recycled amount of MW reported to the Danish Waste Data System in a given year, as a proportion of the collected primary MW amount in the same year. This is further elaborated in Appendix A.
Iceland has not yet reviewed its methodology in relation to the changes made to the new methodology, and Iceland thus refers to the Commission Decision 2011/753/EU. Iceland is familiar with the changes and has done a brief review of its methodology. Generally, Iceland assesses that its collected data is in compliance with the changes in calculation points, since Iceland primarily collects its data at the end point for treatment (from final waste actors/treatment facilities) as described in Appendix B.