3. AS-IS:
This section and its visualizations are not intended to provide an exhaustive description of the challenges or the solutions to the burdens of climate reporting. Rather, it is a simplified and condensed version of how the working group has outlined the real-life climate data reporting work- and process data flows before and after the deployment of the recommendations outlined in this report. The figure is designed to be generic and applicable at a cross- Nordic and industry level, and therefore it does not consider the variances in complexity and requirements for various company sizes and industries. For this reason, the illustration can serve as a communication tool that can enable alignment and add value to existing initiatives. One example is the Danish Automatic Business Reporting initiative which aims to increase the digitization and automation of all business reporting (incl. ESG) in Denmark. The overview can be leveraged to secure a shared understanding of the short-term challenges and needs for climate reporting, as well a basis for an integrated and actionable plan of action. Alternatively, the overview can be modified to include additional details relevant to a specific industry and/or company, thus enabling the mapping of specific challenges, actors, and solutions.
3.1 Burdens and Context (challenges):
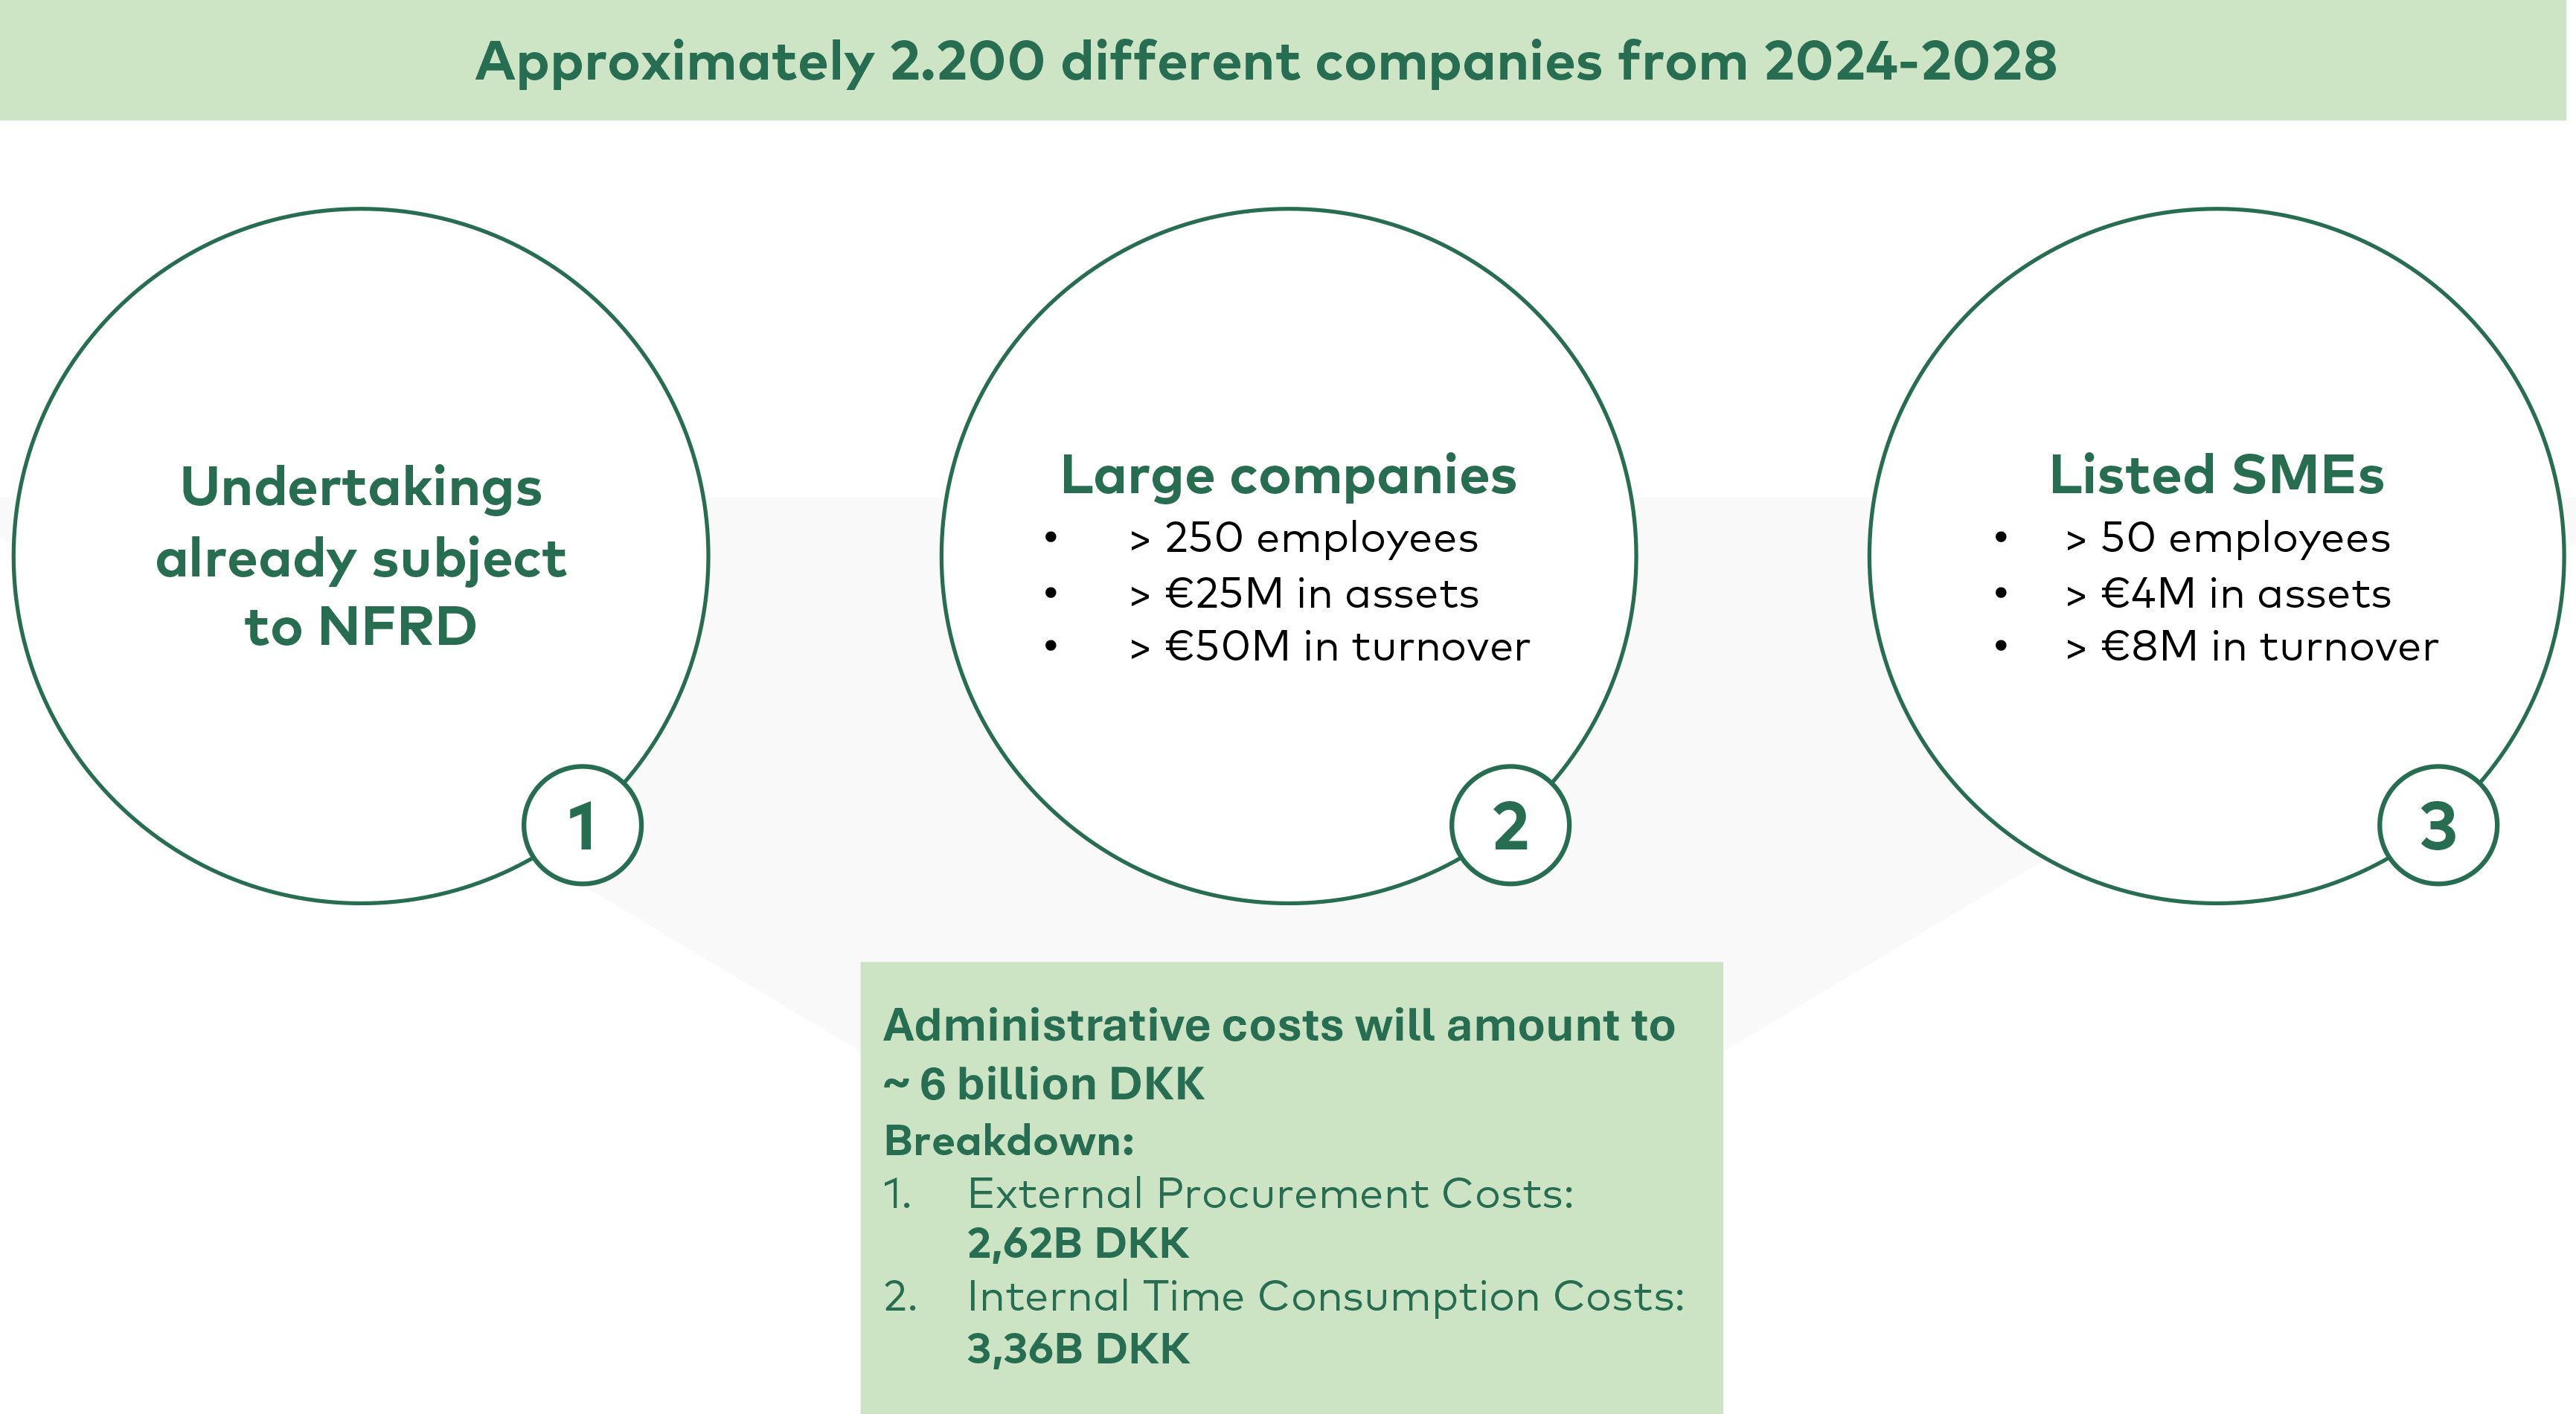
The Danish Business Authority has conducted an “Activity-based measurement of companies” administrative burdens” (AMVAB) analysis of the implementation of CSRD and the administrative burdens posed on the companies as a result of the requirements associated with sustainability reporting. NB: This analysis only considers Danish companies subject to CSRD. It is assumed that similar costs will occur in the other Nordic countries. The analysis shows that CSRD and the non-sector-specific ESRS standards will impose a total transition cost at approximately 6 billion DKK on Danish companies. Figure 2 illustrates which companies will be subject to CSRD now and in the future, and a breakdown of the “administrative costs” in the transition / implementation phase of CSRD (COWI & Danish Business Authorities, 2024).
The AMVAB analysis further shows the annual cost of complying with CSRD to be at approximately 5.1 billion DKK, based on how ESG data is currently handled. This includes activities, such as collecting ESG data, data management and complying with the directives’ requirements (COWI & Danish Business Authorities, 2024). In relation to this, it has been examined how companies are managing their ESG data, today. Approximately 90% of companies are planning to use or are currently using spreadsheets for sustainability reporting (Lange, Picard, & O'Connel, 2024). The reason for using spreadsheets at present is their attractive functionality, as they are flexible, cheap and easy to use, when it comes to manipulating and organizing data.
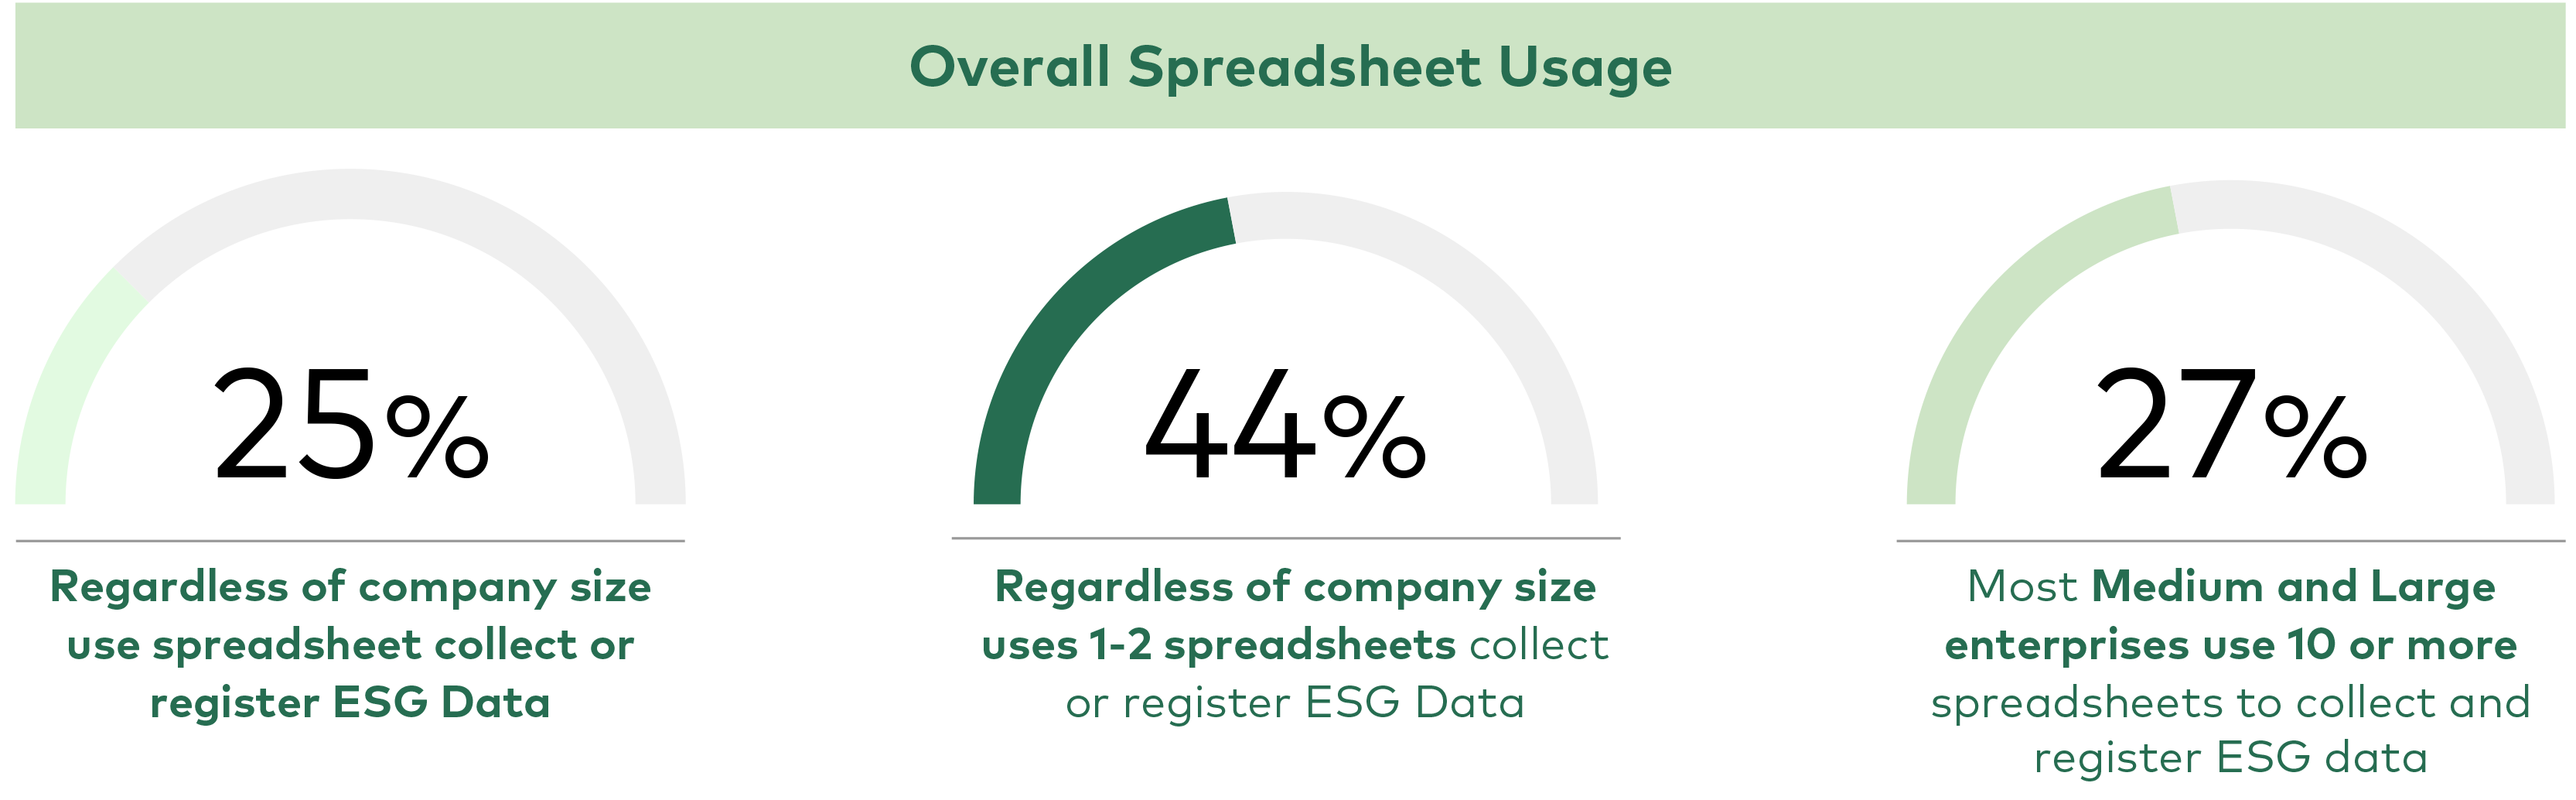
Figure 3 indicates that 25% use spreadsheets regardless of company size to collect or register ESG data. While 44% of all enterprises use 1-2 spreadsheets and 27% of medium and large enterprises use 10 or more spreadsheet to collect and register their ESG data. Whereas 74% of all small enterprises do not collect or register any ESG data (Danish Business Authorities & Deloitte, 2023). Considering the use of spreadsheets, it indicates that the sharing, collecting, processing and reporting of ESG data are highly manual. Nevertheless, with the new directive in place, it will require a considerable amount of time to manage and cope with the new disclosure requirements, assuming the businesses will continue to use spreadsheets to deal with ESG data to a high extend. In addition to this, there are multiple reasons why businesses continue to use spreadsheets and manual practices. This is due to:
- Slow adoption of necessary digital tools to cope with the ESG agenda. Some of the reasons for this are that available systems are relatively immature, expensive to acquire, maintain and costly in terms of change management.
- Businesses have, to a limited extent, not been dealing with this kind of data before. Hence, many businesses have limited knowledge and experience on what it takes to comply with such directive.
- The previous “Non-Financial Reporting Directive” only required large publicly listed enterprises to report on a limited set of datapoints, allowing companies to “easily” comply with the directive.
To further illustrate current practices for handling ESG, a process flow and a user-journey have been included below.
3.2 Overview of current processes
The AS-IS figure 4 illustrates the current state of how ESG Managers and companies interact with relevant stakeholders throughout the supply-chain, to collect and report on ESG (climate) Data. The illustration consists of 4 columns in total, which together make up a process flow where an ESG Manager collects, cleans, structures, calculates, analyses, optimizes and reports on ESG Data. The figure also illustrates the stakeholders involved in the data collection process and the recipients (users) of the ESG data. The flows go from left to right, starting in the column “Data In (Collection)” and moves towards “Destination / Users”.
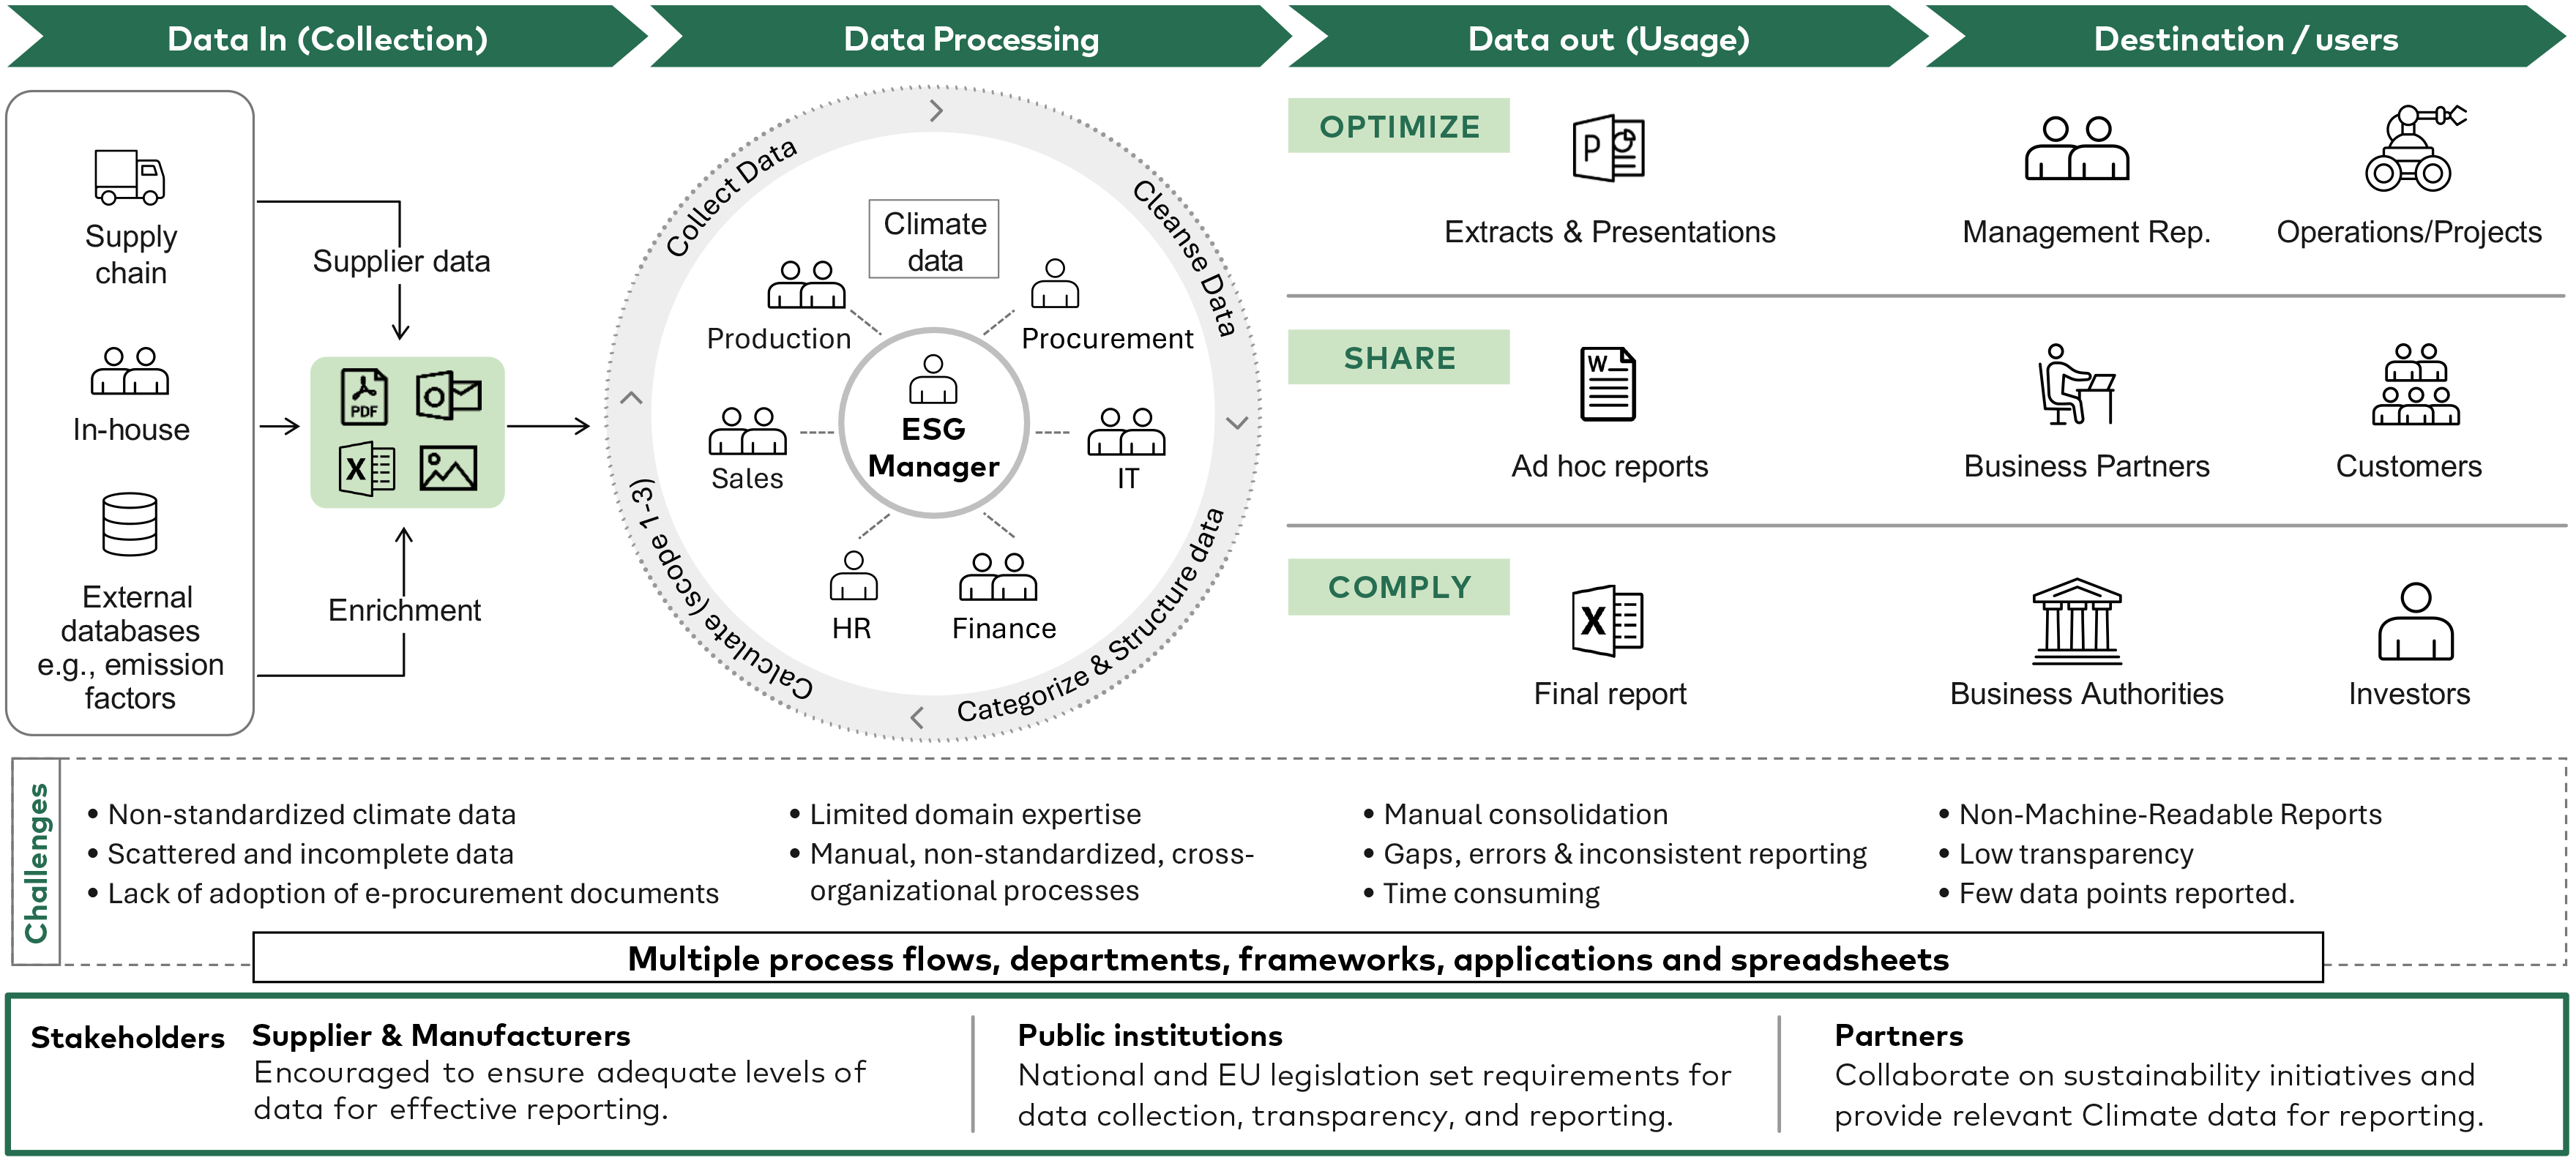
As illustrated in figure 4, the current collection, structuring, calculation and reporting processes of ESG data are, in most companies, mainly handled manually by either one ESG manager or a smaller ESG team. Moreover, from a collecting point of view the ESG data exists in silos, meaning data throughout the supply chain comes in different formats and structures. This non-standardized data is difficult to integrate and validate across IT-systems. As a result, the majority of ESG data is exchanged via emails (attachments). These attachments can be PDF-files, spreadsheets, pictures of invoices etc., which makes it difficult to share the data efficiently, as these often comes in a “non-machine-readable” format.
To exemplify the ESG inherent reporting challenges illustrated in the “AS-IS” overview, a generic “user-journey”, has been outlined in figure 4. The user journey is a product of discussions within the working group and is based on a “fictional” wholesale company. The company is defined as a publicly listed medium-sized company, and therefore not subject to the previous “Non-Financial Reporting Directive” (NFRD), but will become subject to CSRD in 2027, and need to publish their first report in January 2028. However, the focus on sustainability and the pressure from business partners for greater transparency and insight into products have been priorities for many businesses in recent years. As a result, the company has some experience in collecting, processing, and sharing ESG data. Additionally, as stated in the introduction, larger companies subject to CSRD must meet their compliance obligations immediately. This, in turn, compels SMEs to align with the requirements imposed by the directive – the wholesale company falls into this category.
Through research and careful considerations, it has been established that the company must go through six overall steps during a financial year – these are indicated in the user-journey and are as follows:
- Step 1: Identify the correct sources for data collection.
- Step 2: Request and collect relevant data from suppliers.
- Step 3: Organize and store data.
- Step 4: Verify and do quality controls.
- Step 5: Routine updates - to ensure data reflect any changes.
- Step 6: Consolidate data for integrated ESG reporting.
- Step 7: Submit the report for auditing and publication (optional in this case).
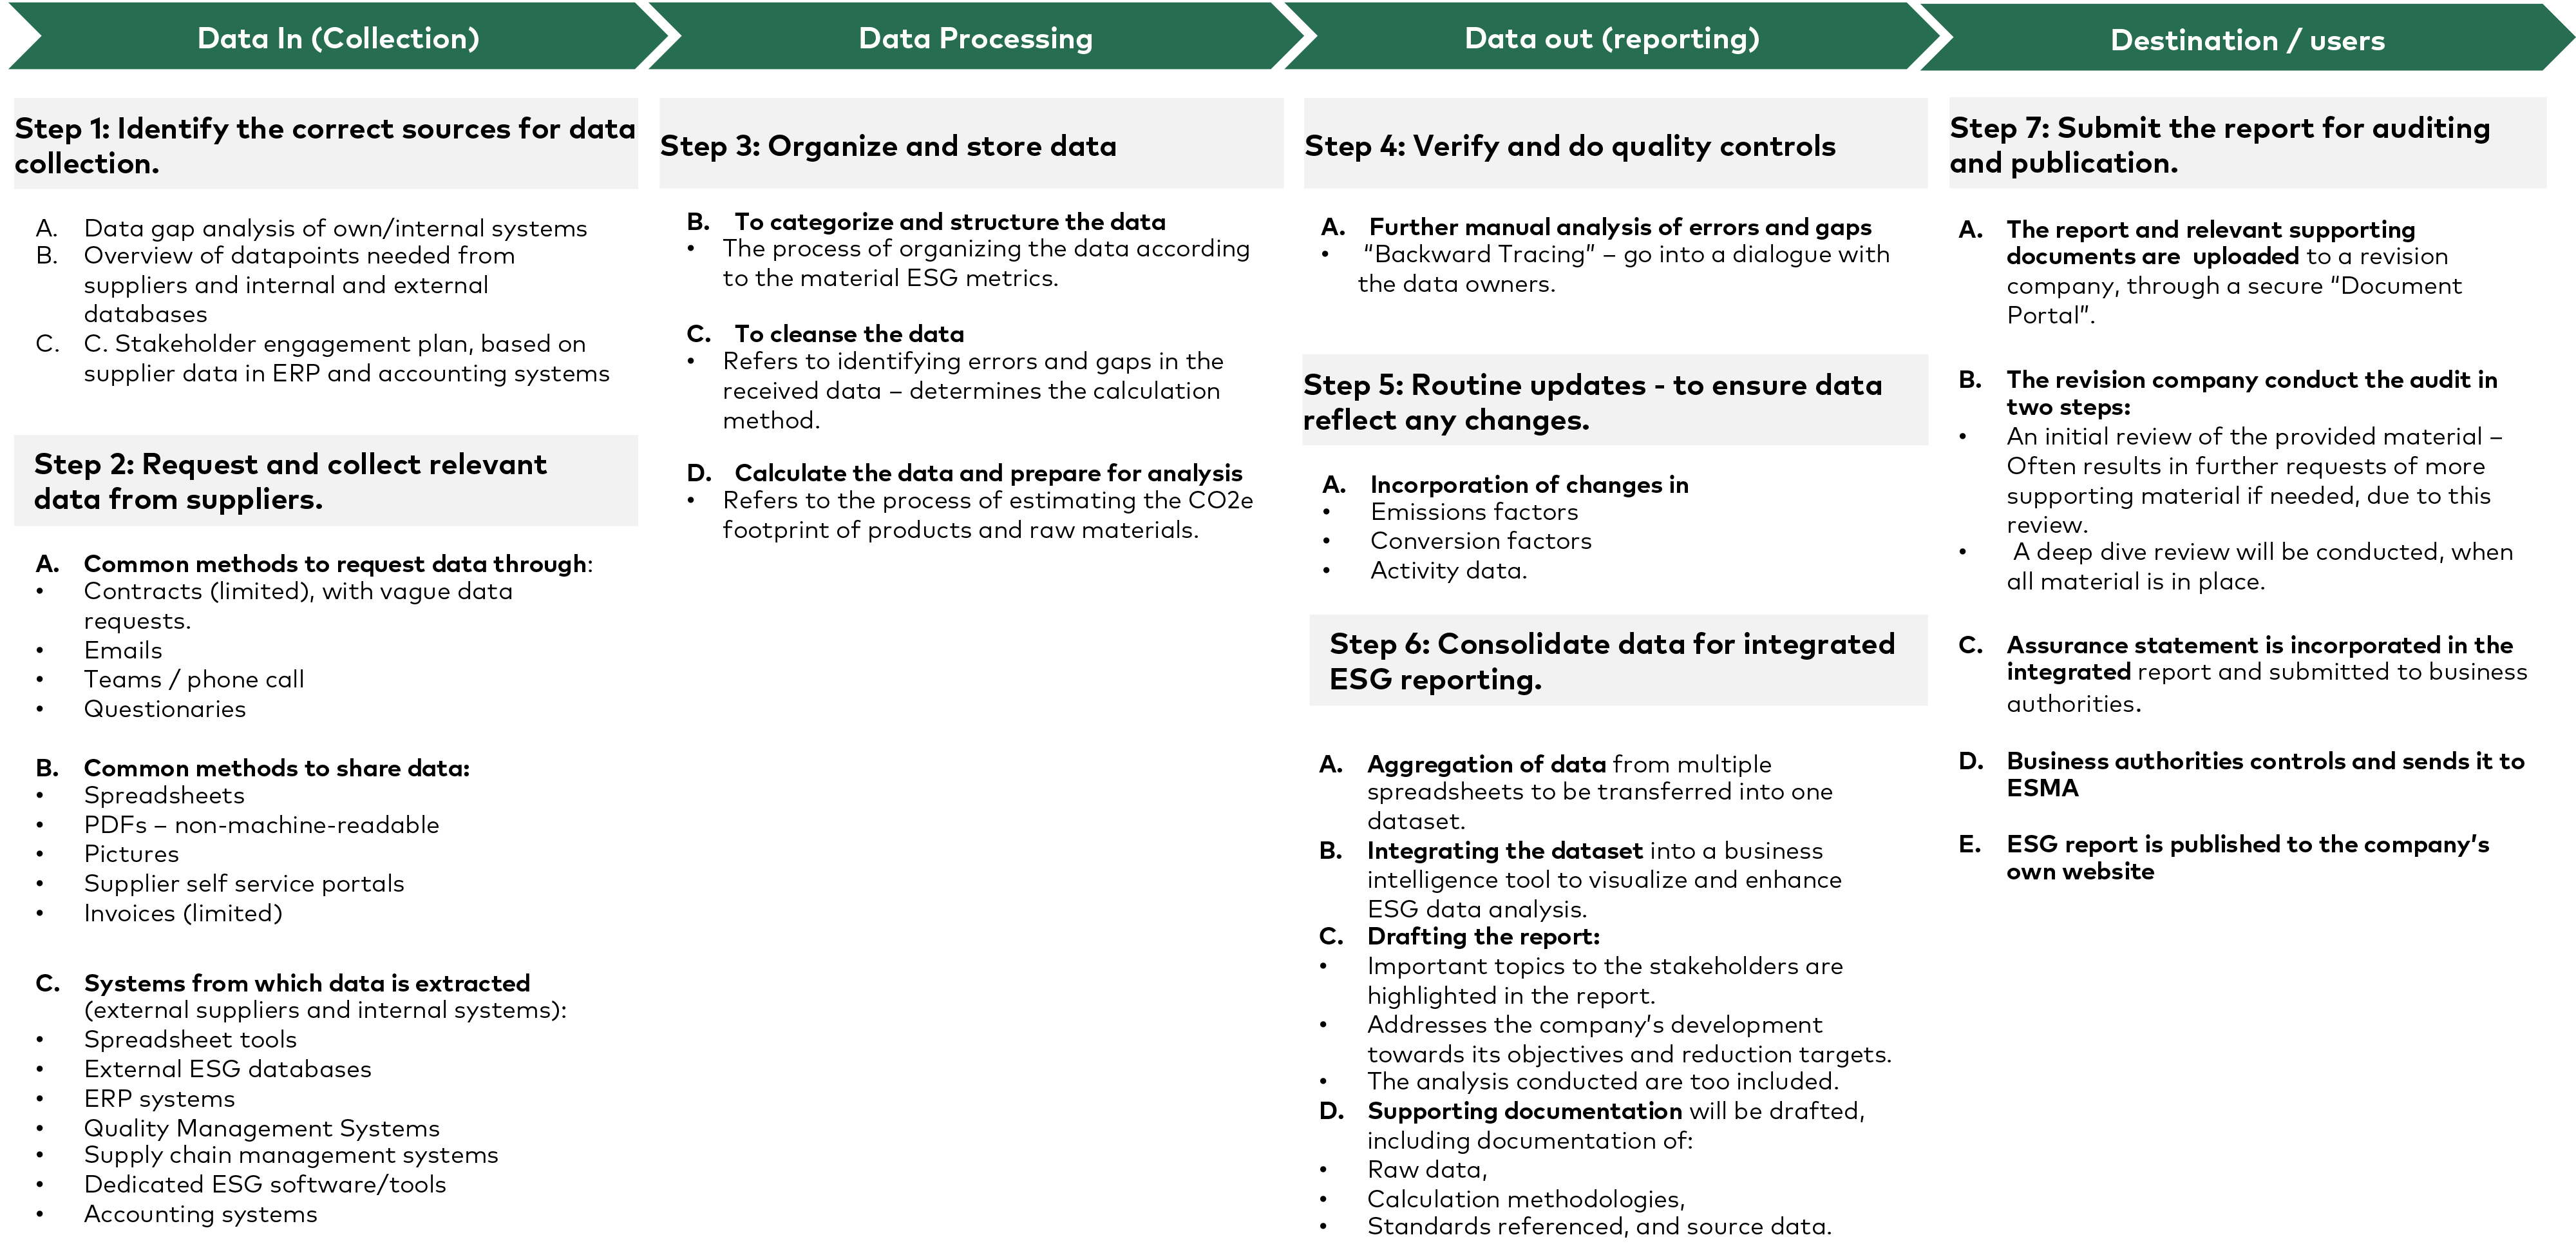
Each phase in the user-journey figure represents the high-level activities that are necessary for the ESG manager and the ESG team to go through, in order for the professionals to report on the ESG data.
These activities are disrupted or hindered by the aforementioned, unfortunate combination of manual processes, immature stand-alone tools (often emails and spreadsheets), and challenges with ESG data storing (multiple data formats and systems). While the manual workarounds employed by many companies may work in the short term, they will become increasingly inefficient, as the amount of mandatory (CSRD) datapoints increase. Therefore, businesses will need integrated and automated solutions to exchange ESG information more efficiently.
When it comes to data collection, large enterprises have started to mandate, through contractual agreements, their suppliers to provide required ESG data, e.g., through digital supplier platforms. This is a positive trend and done with good intentions, however, the specifications and requirements of which datapoints they should deliver and how, are vaguely described. One reason may be that since even large enterprises are at the early stages of understanding CSRD, they are also just now trying to establish the ideal systems and processes to meet the disclosure requirements.
To better understand the motivation and challenges, it is important to consider the stakeholder perspective on the reporting activities themselves. The role of stakeholders will be elaborated in the section below, “Stakeholder Involvement”.
3.3 Stakeholder Involvement
To better understand the stakeholders’ level of maturity in sharing ESG data, it is crucial to identify the types of stakeholders involved in the supply chain. Figure 6 takes its starting point in the user-journey (see figure 5). The figure illustrates the stakeholders from which data is collected, cf. the objective and focus of this report.
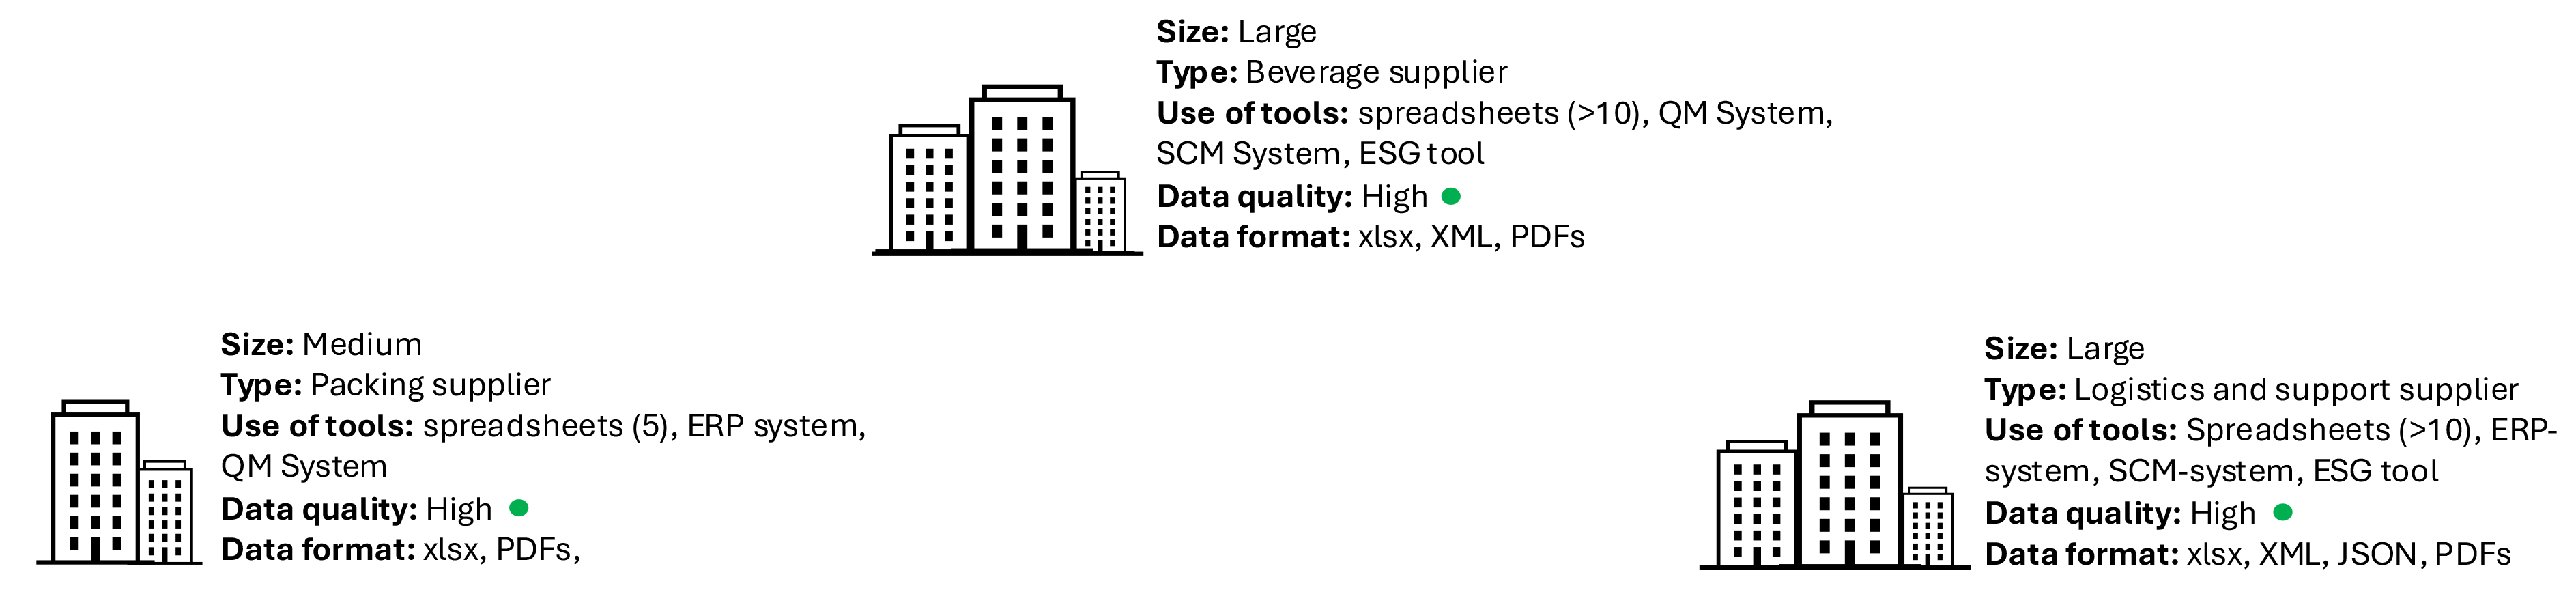
Stakeholders – Data owners
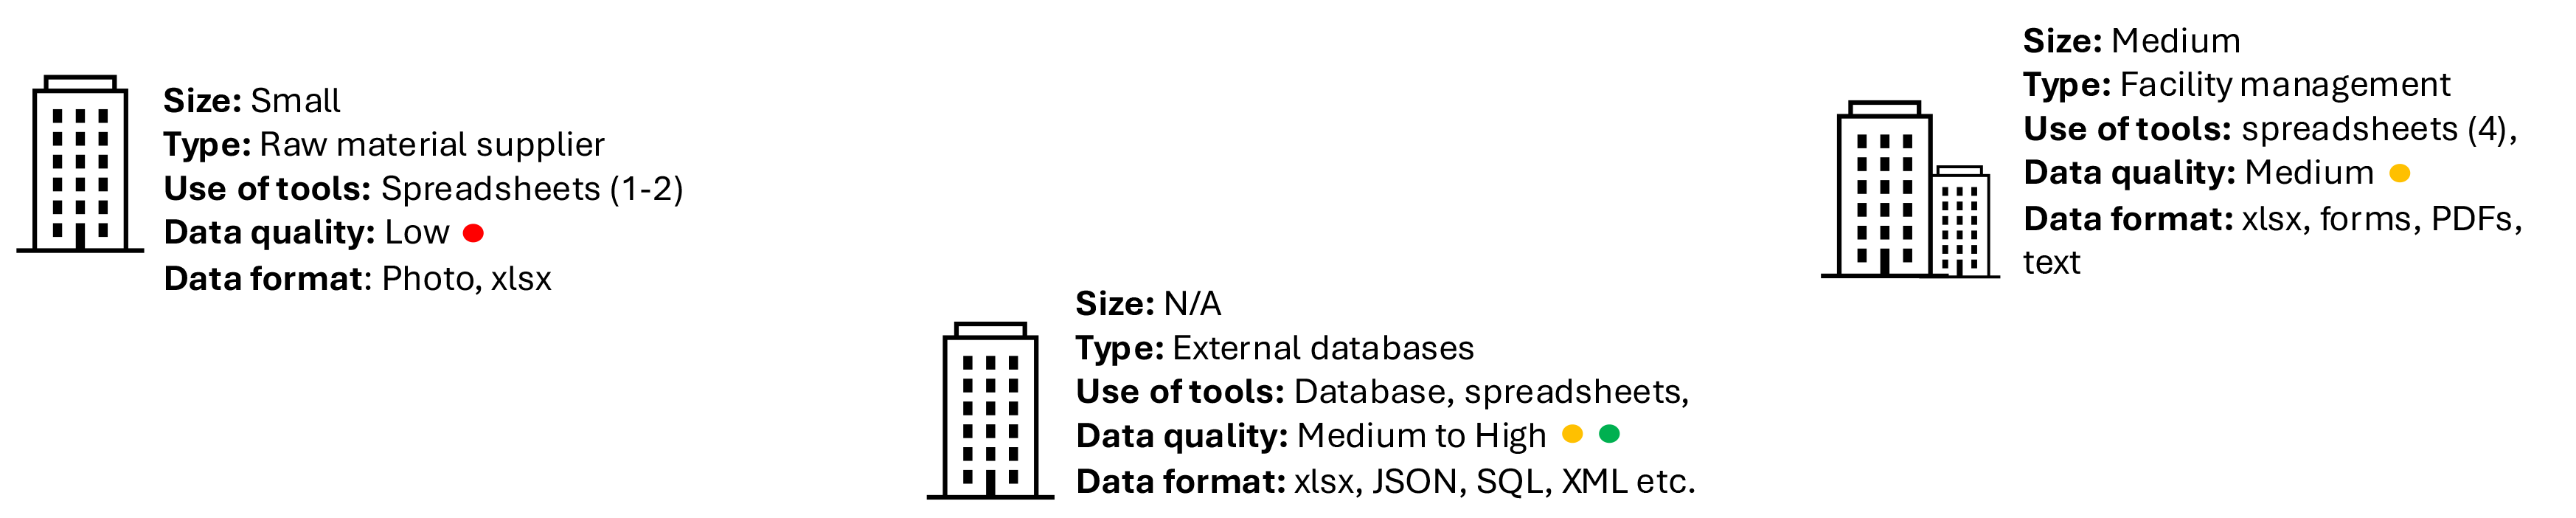
The example in figure 6 is, of course, a conceptual archetype although based on specific “real-world” constellations. The example contains six stakeholders, but the number of actual stakeholders will vary greatly, depending on the type of company and industry. The same is true when it comes to the tools used to collect and register ESG data, and the sample types of data formats (xlsx, forms, PDFs, text, photos, XML).
The level of manual work required for ESG managers to convert datapoints into a common structure aligned with their organization's ESG metrics is dependent on the number of different data formats and datapoints, as well as the quality of the data supplied. Data quality is influenced by various factors, including the reliability of internally and externally generated data. Companies rely on the quality of data received from suppliers in their supply chain, but also the company’s own ability to generate and capture data across various systems. Therefore, all stakeholders are dependent on each other’s ability to share valid data. This underpins the need for standardizing data formats, such as using the data standard inline eXtensible Business Reporting Language (iXBRL) with the data format “Extensive Markup Language” (XML), to ensure companies receive data in a single, consistent format.
3.4 Reflection of current state
As mentioned, the highly manual processes may have worked for companies till now, but with the new regulations in place, emails and spreadsheets will not be sufficient. Besides the increasing administrative burdens, there are several other catalysts that will push for the use of more advanced tools. Especially two stand out:
1 European Single Electronic Format (ESEF)
ESEF is a regulatory requirement introduced by ESMA for listed companies in the EU to prepare their annual management reports in a standardized electronic format, iXBRL, and publish it in a XHTML format (ESMA, 2024). The iXBRL data standard uses the data format “XML”, which allows for machine-readable data.
2 The assurance aspects
Assurance aspects refer to CSRD are mandating companies to undergo limited assurance no later than 2026, and potentially reasonable assurance no later than 2028 (IAASB, 2023).
Limited assurance refers to a type of assurance, which is less comprehensive reasonable assurance (financial audits). The procedures carried out to validate the content in the ESG report is less comprehensive, with less detailed tests of the data and statement provided (Shannon, 2024).
The pressure this exerts on companies to digitize processes and pursue new solutions to support sustainability reporting constitutes yet another potential risk of the SME’s to be left behind in the green transition.
This naturally ties into other potential pain points companies may face when complying with the CSRD, which will be elaborated on in the following section.
3.5 Pain points
Taking the above-described processes and practices in handling ESG into account, the pain points of the current state (AS-IS scenario) can be boiled down to (Danish Business Authorities & Deloitte, 2023):
- Manual processes, including manual management and collection of ESG data.
- Difficulties in obtaining data.
- Non-standardized data – data exists in silos throughout the supply chain, often in poor quality.
- Current data formats and structures makes it difficult to integrate data across systems.
- Solutions are expensive to acquire, maintain and costly in terms of change management.
- Limited experience, knowledge and collection of ESG data in many businesses – lack the correct competencies and resources.
If the pain points are not mitigated, a range of potential risks exist for the SME’s. For example, companies that are unable to provide the requested data to stakeholders may face economic consequences (Danish Business Authorities & Deloitte, 2023), such as:
A. Missing out on business opportunities: For example if, as is already seen across many industries, businesses include ESG data deliverables as a requirement in their contractual agreements between trading partners. Companies not able to deliver the requested data might lose competitive ground.
B. Reputational damage: Investors, consumers, and business partners may perceive companies that fail to meet ESG disclosure requirements as polluting, lacking transparency or clarity in their sustainability commitments. Consequently, stakeholders might withhold investments or refrain from purchasing their products.
C. Penalties for non-compliance: SME’s subject to CSRD (in 2027), even though the reporting requirements for SMEs will be lower than larger enterprises, will potentially be facing fines or legal consequences – if not able to report on the mandated disclosure requirements, due to lack of resources.
D. Increased loan costs: Companies not able to deliver on ESG data, will forgo the opportunity to pursue “green bonds”. Companies lacking ESG data might face higher taxes and interest rates, compared to those who can deliver on ESG data.
Having analyzed these pain points, the next step is to consider how they can be mitigated, i.e., an optimal end state. This will be explored in the following section “TO-BE”.