2. Methodology
2.1 Approach
The methodology section of this report serves as a directional guide for the reader, to understand how information has been collected and generated throughout the project. This section guides the reader through how objectives have been examined during the project in Q3 and Q4 of 2024, providing transparency into the methods and processes used. The project has used both firsthand and secondhand data, leveraging qualitative methods for firsthand data and additional research and publications for secondhand data. The workshops were structured after a 3-step approach: 1) Align on challenges and current state, 2) Define the objectives for change in accordance with the project’s overall ambition, and 3) Conduct exercises and discussions designed to develop recommendations and suggested next steps. To ensure consistency, the 3-step approach was supplemented with a focus on “why” (alignment on the criticality, value and challenges), “what” (alignment on scope and focus), “how” (alignment on feasible actions), and “next steps” (prioritization of action and creation of recommendations).
The identified next steps make up the recommendations of this report. In order to summarize and visualize how this project has addressed the identified challenges and reached the recommendations of this report, a gap overview (THE CHASM) has been created. Figure 1 illustrates the AS-IS Scenario, the Chasm (TO-DO) and TO-BE Scenario. The “why”, “what”, “how” and “next steps” were addressed before, during and after the workshops. The AS-IS Scenario or the “why” column reflects the current conditions that most ESG Managers are working under and the challenges they encounter, but also why these challenges have arisen, e.g. due to new regulations and demands from the market.
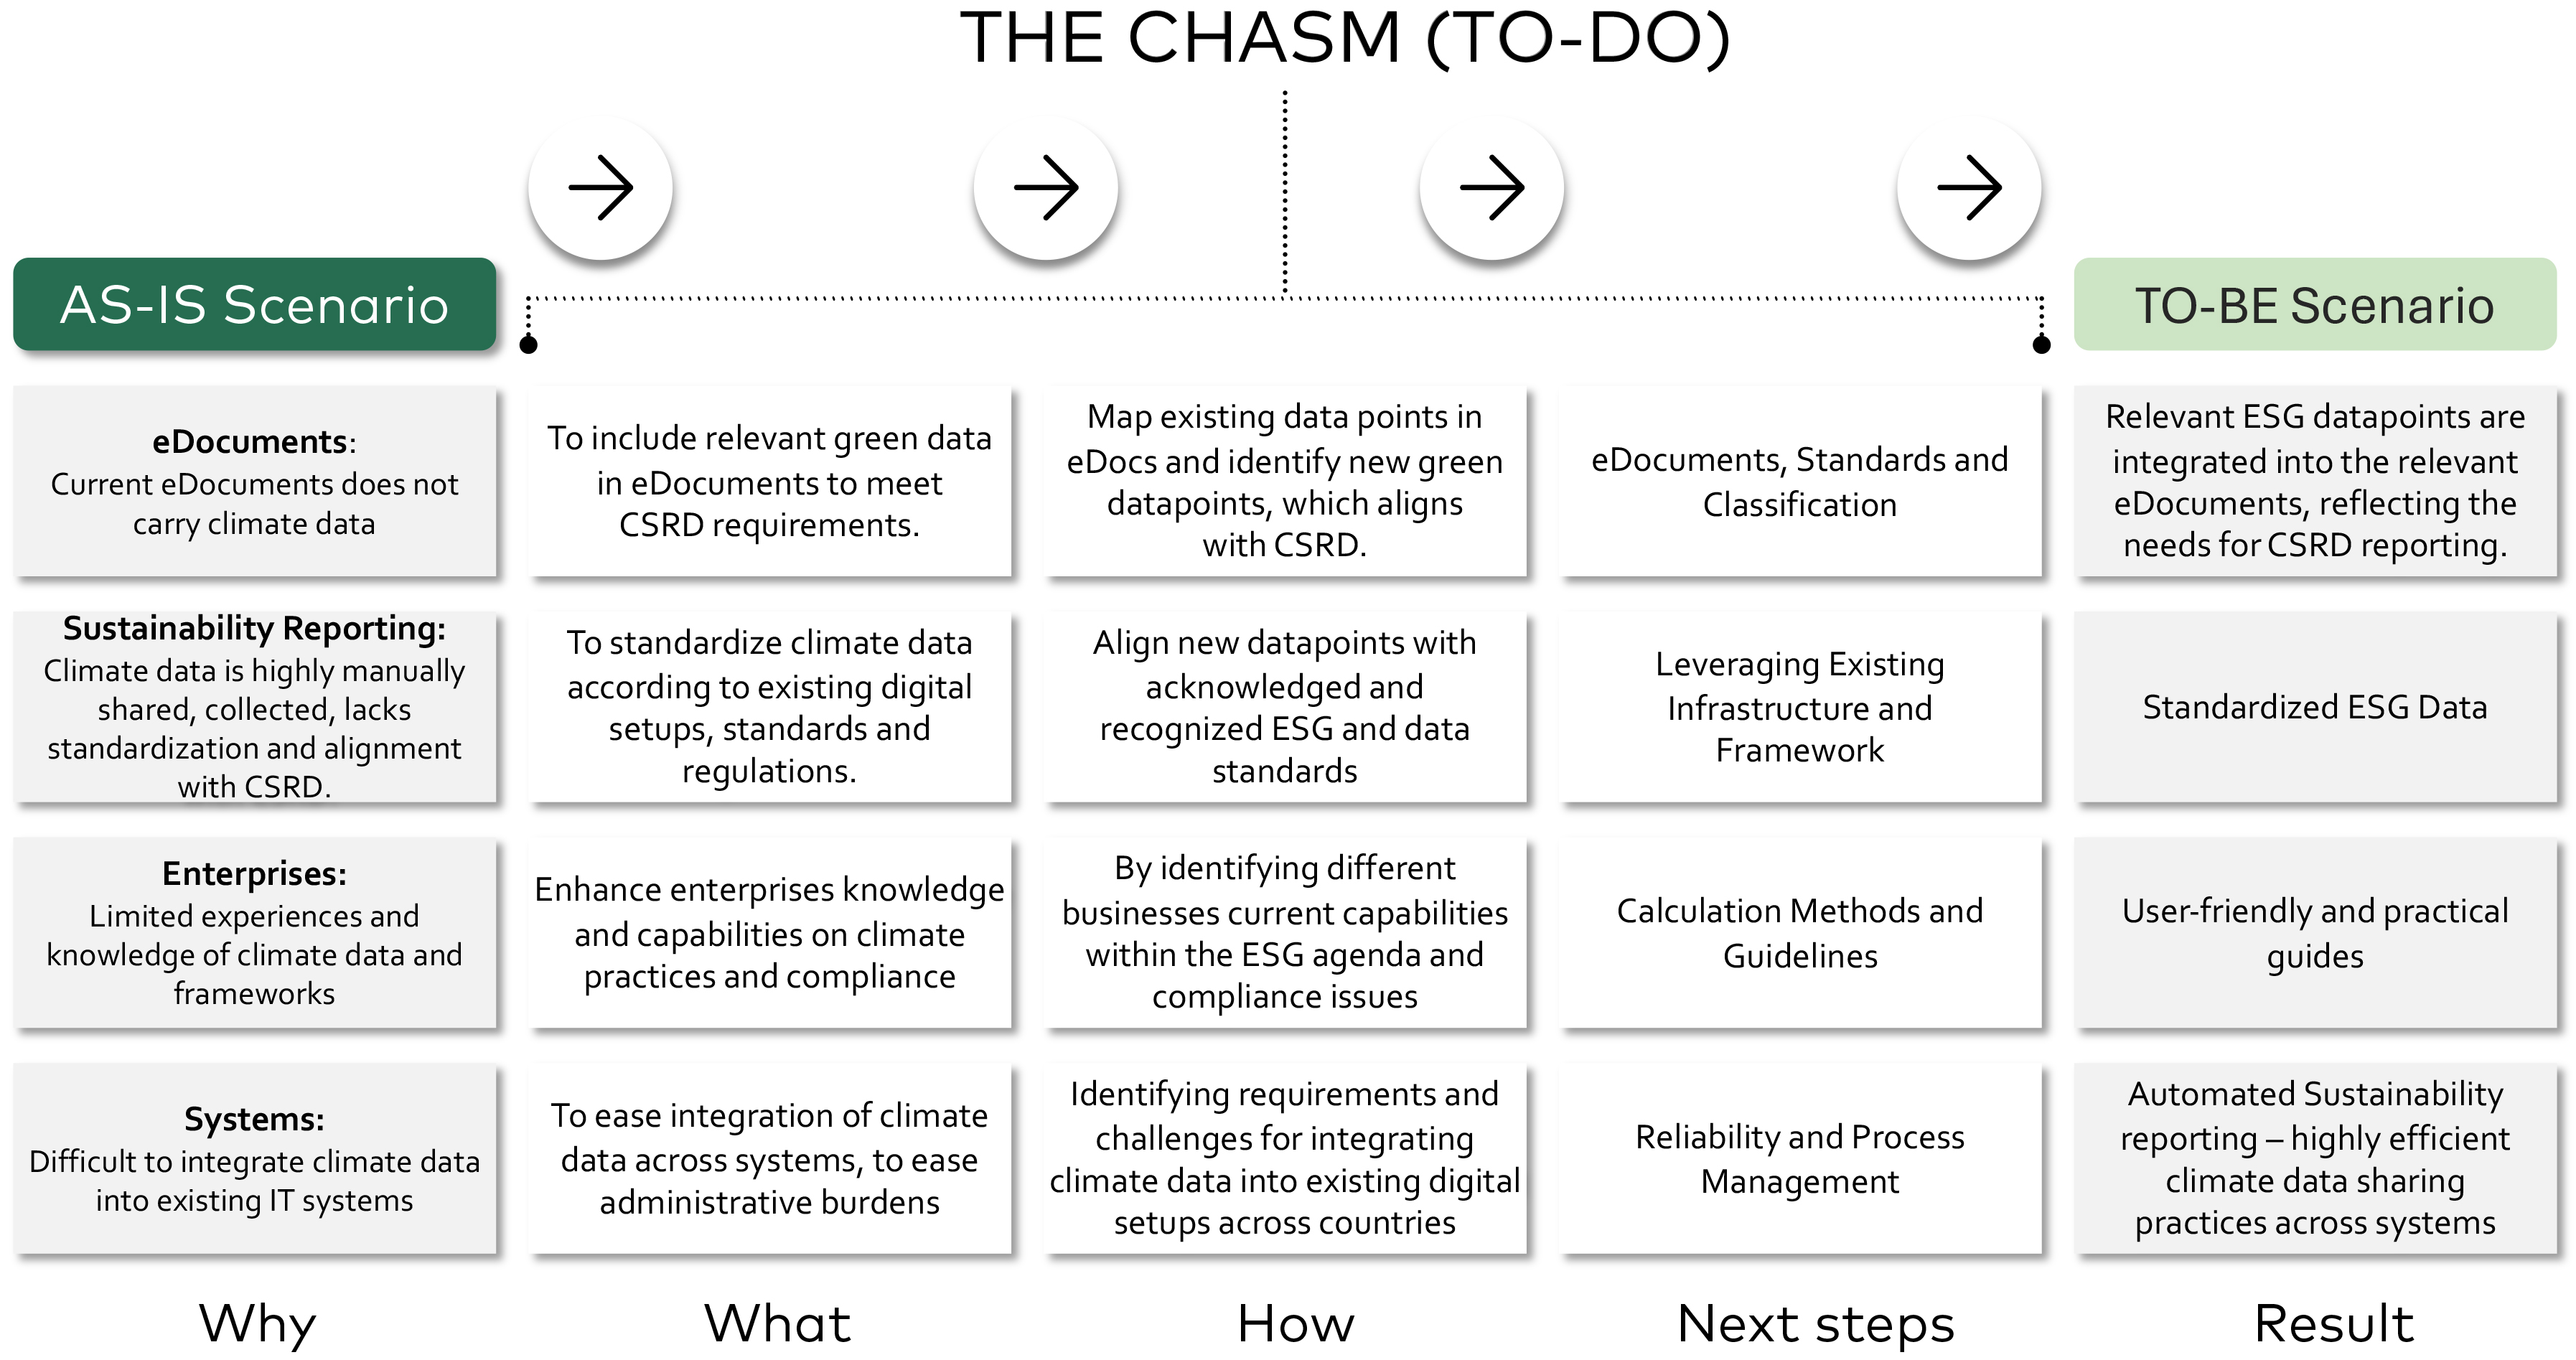
The “The Chasm (TO-DO)” illustrates the objectives, work and outcomes for this project. Additionally, the "what" column highlights the problem statements and objectives addressed in the workshops. These were explored through specific activities and exercises to tackle the identified challenges of the “AS-IS” scenario. The “How” column highlights the approach and outcomes of the activities from the “what”-column during the workshops. The “next steps” column are the recommendations for how to proceed, to leverage the knowledge and experiences gained during the project and move towards the “TO-BE” scenario, which represents the desired future state of “Climate reporting”. The next steps in figure 1 represents 4 categories, in which 13 recommendations have been grouped into – all 13 recommendations can be assessed in section 9.
The “TO-BE” state is characterized by low administrative burdens of sharing climate data among stakeholders in the private sector (B2B) and public sector (B2G). The individual “AS-IS”
AS-IS represents the current state of how processes operate before changes has been made.
TO-BE represents the desired state of the processes - when changes have been made to the AS-IS process.
2.2 Firsthand data
This section will shortly explain how first-hand data was collected and processed during the project period.
2.2.1 Workshops:
Three workshops were held, during which, a focus group was established, consisting of experts from Norway, Sweden, Iceland, Finland, and Denmark (see Appendix 2). The intention of the focus group was to draw on the participants’ relevant experiences within their field, to gain the right perspective on the challenges and objectives stated in the introduction section of this report and figure 1, and to leverage this same expertise to devise feasible and actionable recommendations for improvements. The participants’ areas of expertise lie within the areas of; data-standards, classification, specifications, formats, structures, automation, legislation and sustainability (see Appendix 2). All experts who participated in the workshops, are also “eDocument experts”. As stated above, each workshop was structured around the principles of "The Why," "The What," "The How," and focused on working towards the "Next Steps" and the "TO-BE" scenario.
2.2.2 Summary of Workshop 1 (WS1) – Identifying relevant Green Datapoints:
Objective (what):
The objective of this workshop was for experts to identify and define the key (ESRS) datapoints essential for calculating the climate footprint of purchased products. Furthermore, the focus was also on automation, with the goal of creating a more efficient process that minimizes manual effort, improves accuracy, and ensures scalability in tracking climate impacts.
The objective of this workshop was for experts to identify and define the key (ESRS) datapoints essential for calculating the climate footprint of purchased products. Furthermore, the focus was also on automation, with the goal of creating a more efficient process that minimizes manual effort, improves accuracy, and ensures scalability in tracking climate impacts.
Knowledge enhancement (why):
Regarding the objective, the expert groups were introduced to CSRD and its associated ESRS E1 standard and current practices, to expand their understanding. Additionally, they were introduced to current initiatives and solutions in Denmark, Norway, Sweden, and Finland from the perspective of public institutions, focusing on how they are addressing sustainability and climate calculations.
Regarding the objective, the expert groups were introduced to CSRD and its associated ESRS E1 standard and current practices, to expand their understanding. Additionally, they were introduced to current initiatives and solutions in Denmark, Norway, Sweden, and Finland from the perspective of public institutions, focusing on how they are addressing sustainability and climate calculations.
Exercise (how):
The experts were tasked with identifying, elaborating, and prioritizing individual datapoints, relevant to eDocuments and the demands from CSRD (see appendix 4). This will be elaborated further in the section “The Green Datapoints”.
The experts were tasked with identifying, elaborating, and prioritizing individual datapoints, relevant to eDocuments and the demands from CSRD (see appendix 4). This will be elaborated further in the section “The Green Datapoints”.
2.2.3 Summary of Workshop 2 (WS2) – Building Mockups & Integrations:
Objective (what):
The objective for this workshop was for the experts to continue the effort of easing cross-border administrative burdens for the exchange of climate data but focusing on creating mockups for standardized green product data in eDocuments and integrating these with existing digital systems, based on company practices and Nordic experiences.
The objective for this workshop was for the experts to continue the effort of easing cross-border administrative burdens for the exchange of climate data but focusing on creating mockups for standardized green product data in eDocuments and integrating these with existing digital systems, based on company practices and Nordic experiences.
Knowledge enhancement (why):
Regarding the objective, the experts were introduced to a real-world company “Better World” (BEWO) who is a startup company that has specialized in calculating scope 1, 2 & 3, mostly through AI to extract the relevant information from eInvoices, line by line. They were introduced to BEWO, to increase their understanding of how a private company is trying to solve the challenges that come with CSRD. Furthermore, a short presentation was made, which entailed a presentation of the datapoints that was scored as mature and feasible datapoints in WS1, and how the datapoints in between the workshops have been processed and analyzed.
Regarding the objective, the experts were introduced to a real-world company “Better World” (BEWO) who is a startup company that has specialized in calculating scope 1, 2 & 3, mostly through AI to extract the relevant information from eInvoices, line by line. They were introduced to BEWO, to increase their understanding of how a private company is trying to solve the challenges that come with CSRD. Furthermore, a short presentation was made, which entailed a presentation of the datapoints that was scored as mature and feasible datapoints in WS1, and how the datapoints in between the workshops have been processed and analyzed.
Exercise (how):
The experts were presented with three mockup levels (high, medium, and low), showcasing the most relevant datapoints at each level. The three mockup levels aimed to foster collective alignment and provided the foundation for developing the final mockups. The three mockup levels featured the most relevant datapoints required to deliver on the objectives and mitigate the challenges. Hence, the group were tasked with developing one mockup for each of the relevant eDocuments, with the most crucial and feasible datapoints. Finally, the next steps were evaluated in collaboration, in terms of potential initiatives, proof of concepts, success criteria, and what would be required to implement the mockups.
The experts were presented with three mockup levels (high, medium, and low), showcasing the most relevant datapoints at each level. The three mockup levels aimed to foster collective alignment and provided the foundation for developing the final mockups. The three mockup levels featured the most relevant datapoints required to deliver on the objectives and mitigate the challenges. Hence, the group were tasked with developing one mockup for each of the relevant eDocuments, with the most crucial and feasible datapoints. Finally, the next steps were evaluated in collaboration, in terms of potential initiatives, proof of concepts, success criteria, and what would be required to implement the mockups.
2.2.4 Summary of Workshop 3 (WS3) – Risk assessment and evaluation of prior results.
Objective (what):
The objective for this workshop was to ensure the final alignment on selected Datapoints and Mockups for climate data reporting in eDocuments, adapt the content and recommendations to fit national contexts, evaluate risks associated with the proposed recommendations, and outline actionable next steps for broader adoption.
The objective for this workshop was to ensure the final alignment on selected Datapoints and Mockups for climate data reporting in eDocuments, adapt the content and recommendations to fit national contexts, evaluate risks associated with the proposed recommendations, and outline actionable next steps for broader adoption.
Knowledge enhancement (why):
Regarding the objective of evaluating challenges and risks associated with the recommendations, the experts were introduced to a solution called CarbonKey, developed by KMD. In this context, KMD presented how they are working with GHG accounting, the current challenges they are facing, and the risks they foresee in the future regarding companies' compliance with the CSRD. Furthermore, KMD introduced how they are working with extracting line items from eInvoices, using sophisticated Artificial Intelligence (AI) and Machine Learning (ML)-models, to calculate the CO2e emissions associated with each product purchased.
Regarding the objective of evaluating challenges and risks associated with the recommendations, the experts were introduced to a solution called CarbonKey, developed by KMD. In this context, KMD presented how they are working with GHG accounting, the current challenges they are facing, and the risks they foresee in the future regarding companies' compliance with the CSRD. Furthermore, KMD introduced how they are working with extracting line items from eInvoices, using sophisticated Artificial Intelligence (AI) and Machine Learning (ML)-models, to calculate the CO2e emissions associated with each product purchased.
Exercise (how):
Between workshop 2 and 3, the AS-IS – TO-BE visualizations were created to summarize previous discussions and support the dialogue. The experts were tasked with evaluating the AS-IS and TO-BE scenarios to ensure alignment among all stakeholders involved in this project. Furthermore, all recommendations based on the previous workshops were evaluated to reflect the needs, context, regulations, and other factors of each country, ensuring that the recommendations are representative of all countries involved. Lastly, the experts were divided into country-specific groups to reflect on the challenges and risks associated with the recommendations. They assessed the likelihood of these risks occurring and evaluated the severity of their potential impact if not mitigated.
Between workshop 2 and 3, the AS-IS – TO-BE visualizations were created to summarize previous discussions and support the dialogue. The experts were tasked with evaluating the AS-IS and TO-BE scenarios to ensure alignment among all stakeholders involved in this project. Furthermore, all recommendations based on the previous workshops were evaluated to reflect the needs, context, regulations, and other factors of each country, ensuring that the recommendations are representative of all countries involved. Lastly, the experts were divided into country-specific groups to reflect on the challenges and risks associated with the recommendations. They assessed the likelihood of these risks occurring and evaluated the severity of their potential impact if not mitigated.
1.3 Additional research and publications used (secondary data)
The secondary data used in this report are mainly drawn from public institutional reports, and websites of known organizations and public institutions. By doing so, it allows the report to leverage the expertise and experiences in the fields of sustainability reporting, as well as the integration of the specific eDocuments such as eCatalogue and eInvoices across both the public and private sector in the Nordic countries. By using these sources, the report also aims to provide an extensive view of current developments and practices.