Chapter 2. An evaluation of fish stocks lacking quantitative assessments in Skagerrak
Summary
The Skagerrak region, a basin connecting the North Sea and Kattegat, is a diverse and unique marine ecosystem characterized by a rich assemblage of fish species. Despite its ecological and commercial importance, many species in this area remain unassessed and understudied. This report evaluates the trends of fish species in the region that lack quantitative assessments. Using decades of commercial landings and scientific survey data, the study makes an inventory of observed species, highlights significant knowledge and data gaps, particularly for deep-water species in underrepresented habitats like the Norwegian Trench, and analyze trends in landings and abundance indices. Of the 92 species analyzed, 45 exhibited reliable abundance trends, with a mix of population increases and declines. While species like ling and anglerfish show signs of recovery, others, such as pollack and Atlantic wolffish show declining abundance trends, calling for further investigations. The report also underscores the growing economic role of cephalopods in fisheries, despite their unregulated and poorly understood stock status. Recommendations emphasize the need for enhanced monitoring, region-specific management strategies, and international collaboration to ensure sustainable use and conservation of Skagerrak’s fish resources. By integrating fishery-dependent and -independent data sources and refining spatiotemporal modeling methodologies, this study and its findings provide a critical foundation for addressing the challenges of data-limited fisheries and achieving sustainable management goals in the Skagerrak.
Background
The Skagerrak basin, located between the North Sea and Kattegat on the European continental shelf, serves as a gateway for water exchange with the Baltic Sea, shaping the oceanographic processes in this region (Bendtsen et al., 2009). This location creates a unique combination of habitats, water masses, and depth gradients, establishing the region as a biodiversity hotspot. However, its ecological complexity, combined with governance challenges stemming from its location between three nations - Denmark, Norway, and Sweden - hinders effective resource management and conservation. While Denmark and Sweden are part of the European Union (EU) and governed by the Common Fisheries Policy (CFP), Norway operates outside the EU framework, adding complexity to coordination efforts.
In the relatively well-studied Skagerrak region, a diverse fleet of fisheries operate (Hornborg et al., 2020). Yet, most studies have focused on its shallow waters, leaving the deeper areas, such as the Norwegian Trench understudied. This gap is partly attributed to the design of the International Bottom Trawl Survey (IBTS), which only monitors depths up to 200 meters (few observations between 200 and 300m), leaving critical habitats in the deeper regions poorly represented. This local limitation reflects a broader global scenario, where most deep-water stocks are considered data-limited, lacking data to conduct a quantitative assessment and to estimate reference points, such as the maximum sustainable yield (MSY; Costello et al., 2012). Therefore, unassessed but harvested stocks are often associated with low biomass and unsustainable fishing pressure, as highlighted in previous studies (Costello et al., 2012; Hilborn et al., 2020).
The International Council for the Exploration of the Sea (ICES) is an intergovernmental marine science organization that primarily provides advice on fish stocks in the Northeast Atlantic. In its most recent annual advice, ICES evaluated 185 fish stocks in this region, encompassing over 60 species (López and Perry, 2022). Although the Northeast Atlantic is one of the best-studied marine regions, nearly 50% of its fish stocks remain without quantitative assessments, due to data limitation (ICES, 2024). This issue is particularly pronounced for non-target species or those inhabiting deeper habitats that are challenging to monitor, such as the Norwegian Tench in Skagerrak. Effective monitoring and science-based management are crucial for achieving the United Nations Sustainable Development Goal 14 (SDG 14; "Conserve and sustainably use the oceans, seas, and marine resources"), which aims for sustainable oceans by 2030.
In this study, more than 50 fish species in Skagerrak that lack quantitative stock assessments and management frameworks were identified. For each species, trends in commercial landings (if available) by Denmark, Norway, and Sweden, and fishery-independent catch rates were examined based on a novel combination of two scientific surveys. These findings provide a foundation for developing stock assessment models, improving red list status assessments, and prioritizing future monitoring and management efforts to ensure the sustainable exploitation and conservation of this exceptional and diverse marine ecosystem. Our research further underscores the need for collaborative, region-specific management approaches to safeguard the biodiversity and fisheries of the Skagerrak.
Scientific surveys
Two demersal scientific surveys provide comprehensive coverage of the Skagerrak area: the North Sea International Bottom Trawl Survey (NS-IBTS) and the Norwegian Shrimp Survey (NOSS). The NS-IBTS is one of the oldest surveys in the Northeast Atlantic that has operated in the first quarter (Q1) of the year since 1967. Initially designed to monitor juvenile herring abundance, its scope later expanded to include recruitment indices for many gadoid species. Since 1986, the sampling has employed standardized methods, including the use of the GOV bottom trawl as the main fishing gear, as well as protocol for identifications and records of species. The survey spans over a wide area of the North Sea, including the Skagerrak, at depths of 10–300 meters. The NOSS, established in 1984, focuses on providing a fishery-independent abundance index for northern shrimp (Pandalus borealis) in the deeper areas of the Skagerrak and North Sea. Since 2006, the survey employs a standardized design using a Campelen 1800 bottom trawl with rockhopper gear and operating in the first quarter. The survey covers the deeper areas of the Norwegian trench, with depths ranging from 111 to 552 meters. Although the NS-IBTS also conducts surveys in the third quarter (Q3), these data are excluded from this study to mitigate the effect of seasonal changes in species distribution and focus on the overlapping season between the two surveys.
Selection of species
From a total of 236 taxonomic entities recorded in the NS-IBTS Q1 and NOSS surveys between 1986 and 2023, 126 species of bony fish (Actinopterygii) and cartilaginous fish belonging to the class Holocephali were selected as a starting point for identifying fish species in the Skagerrak relevant for the analysis. Other Chondrichthyes species (Elasmobranchii), although present in the area, were excluded due to species identification challenges. These species will be investigated in a future study. Other species not identified to the species level were also removed to avoid conflating trends for species with potentially different abundance and distribution patterns for different species, leaving 111 species. Further filtering excluded species not classified as demersal, bathy-demersal, or benthopelagic based on FishBase (Froese and Pauly, 2024), as the survey gear is unlikely to adequately capture pelagic species (Berg et al., 2024). Nevertheless, bathypelagic species, such as roundnose grenadier (Coryphaenoides rupestris) and pearlsides (Maurolicus muelleri), were included as little is known about many of these species and the majority of Skagerrak consist of suitable deep-water habitat for these species. This process resulted in a final list of 92 species. From these 92 species, only 10 had quantitative stock assessments and advice by ICES (i.e. ICES stock category 1 or 2) that included Skagerrak (ICES area 3a or 3a.20; Supplementary Table S1). The remaining 82 species, caught in one or both surveys from 1986-2023, lack specific quantitative stock assessments and associated advice, or are not assessed and considered as any stock in ICES, making this species list the focus of this analysis (Supplementary Table S2). Note, that a data-limited stock assessment (i.e. ICES stock category 3-6) was found for 12 out of these 82 species (Supplementary Table S2).
Estimating relative abundance of fish species in Skagerrak
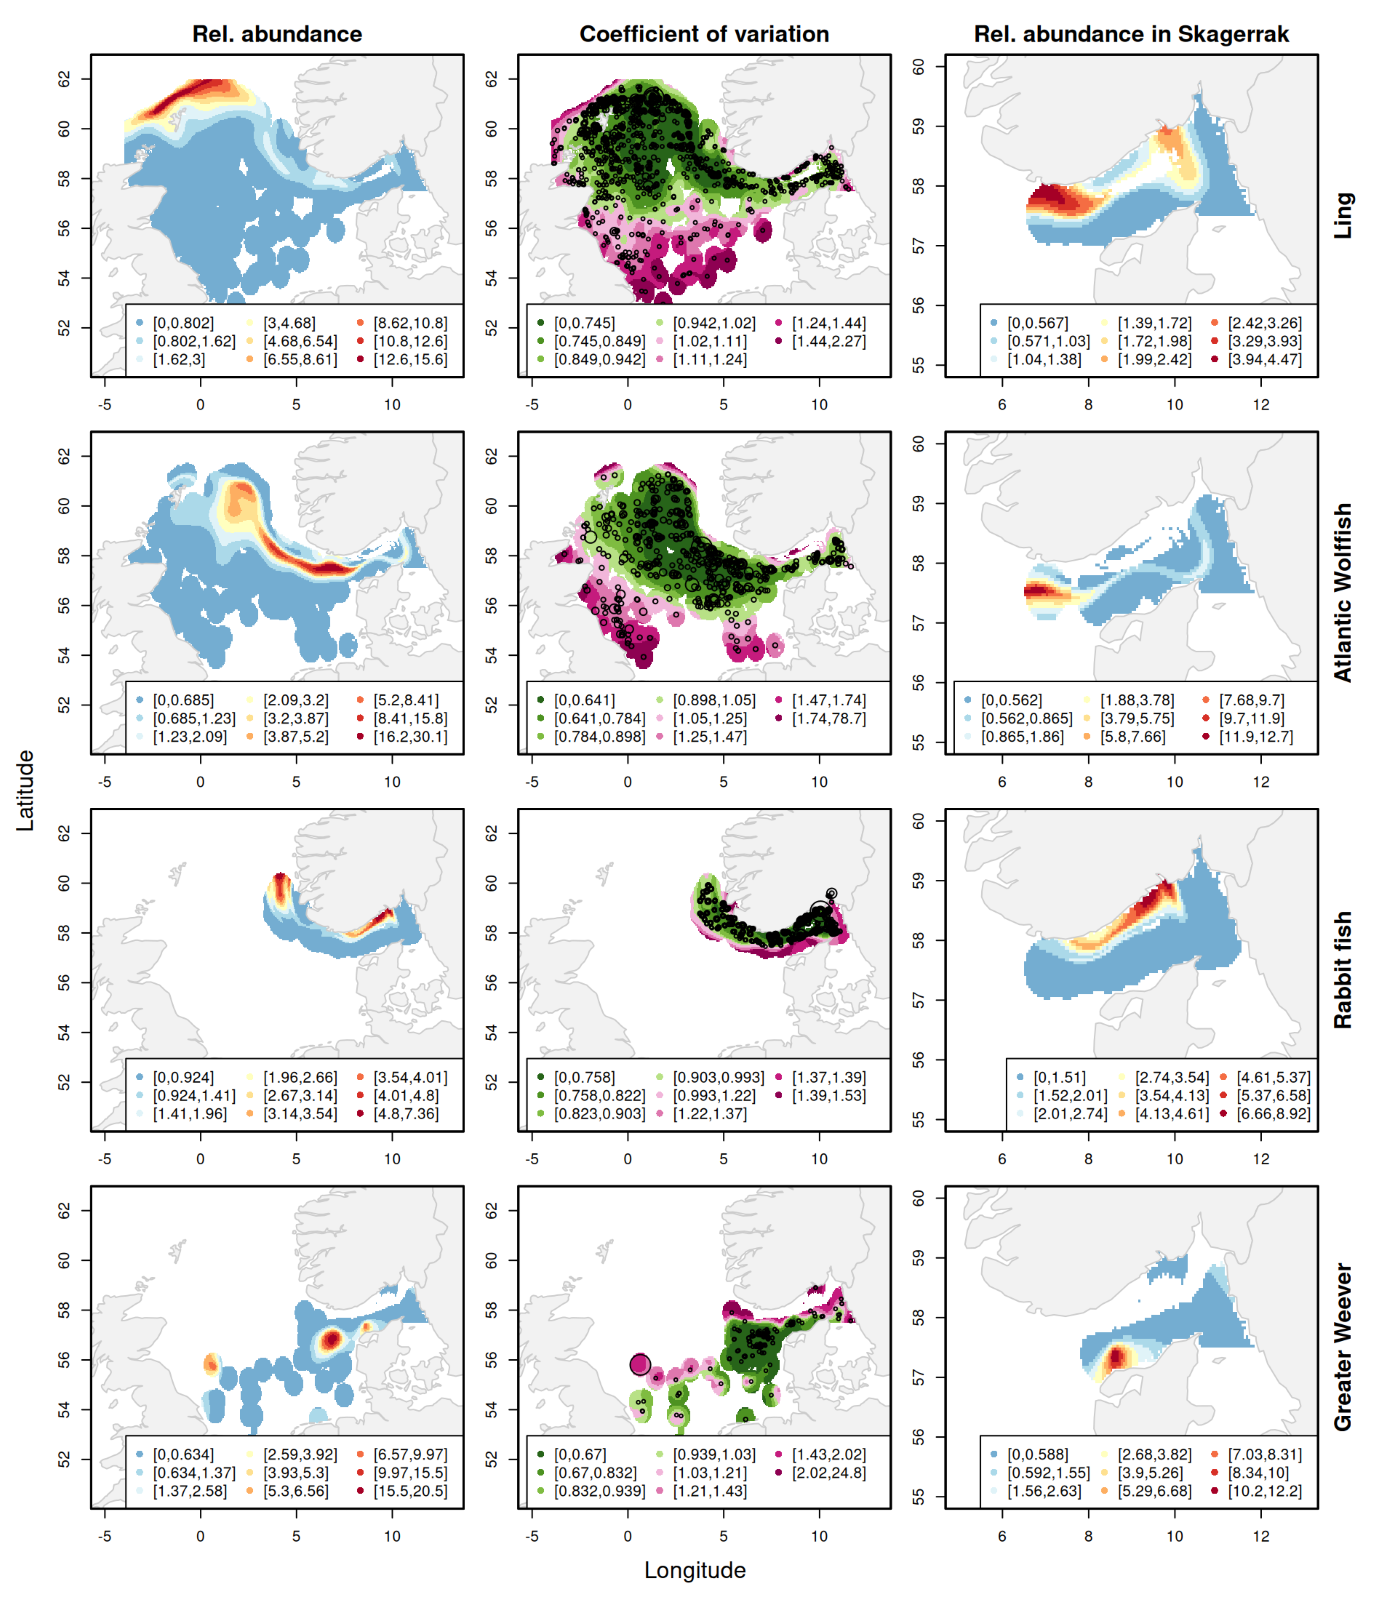
The survey data was cleaned and processed according to ICES (2023) guidelines. Duplicate haul IDs and entries with missing values were removed. Only valid hauls with complete species records from 1986–2023 in Q1 and the North Sea and Skagerrak were retained. Categories with less than 2 hauls with positive observations were excluded. The final dataset categorized gear as either one of the two bottom trawl gear types, GOV and Campelen. To combine the two surveys, species were grouped according to their morphological features and association with the seabed (on the seabed vs. above the seabed). Gear efficiency estimation was restricted to 2006–2023, within specific geographical and depth ranges. The temporal and spatial trends in abundance of the species were explored by means of spatiotemporal modelling, fitting Generalised additive models (GAMs) to survey catch rates for each species following the procedure described in Berg et al. (2014). Based on the converged models for each species, the abundance in a fine spatial grid for the Skagerrak area was predicted using fine-scale depth information from bathymetric maps (Pante et al. 2023). For more details on the methodology and spatiotemporal models, please refer to Supplementary Section 2. The models converged for 62 species. However, 17 out of these 62 species showed large uncertainty (coefficient of variation (CV) > 150%) or sparse data scattered over many years. The results for these species were deemed unreliable and excluded from further analysis, leaving 45 species with reliable abundance indices. The resulting abundance indices and spatial distribution and uncertainty for all 45 species are shown in Supplementary Figures S2-S10. Figure 2.1 shows the estimated temporal abundance trends for four example species: Ling (Molva molva), Atlantic wolffish (Anarhichas lupus), Rabbit fish (Chimaera monstrosa), and Greater weever (Trachinus draco), while Figure 2.2 shows the spatial patterns and associated uncertainty for these four species.
Commercial landings from Skagerrak
Not all of the 82 data-poor species (Supplementary Table S2) were caught in commercial landings, alternatively they weren caught but are not identified to species level. Norwegian, Swedish, and Danish experts together identified 19 species belonging to 12 different families for which reliable landings information is available on species level from all three countries. The absolute landings reveal significant variability over time, with Denmark consistently dominating the total landings In Skagerrak (Figure 2.3A). Swedish and Norwegian contributions remain smaller but show slight variations across the years. Landings declined sharply from the early 1990s to the mid-1990s, followed by a period of stability and occasional peaks, such as a notable increase around 2005. Since 2007, total landings have been at lower and stable levels around 3000 tonnes. The relative proportions of landings highlight Denmark's dominant role, with its contributions consistently accounting for 70% to nearly 100% of the total in most years (Figure 2.3B). Sweden and Norway have smaller shares, rarely exceeding 25% combined, though Norway’s relative contribution increased slightly after 2007. It should be noted that numbers from official landing statistics, such as those used here, may deviate from actual catches that include discards, particularly back in time.
Landings by year for six selected example species are presented in Figure 2.4. A general decline in landings is evident for several species, such as Atlantic wolffish (Anarhichas lupus) or pollack (Pollachius pollachius). Conversely, certain species exhibit stable or increasing trends. For example, anglerfish (Lophius piscatorius) shows increasing landings, particularly in Denmark, after the 2000s, while Atlantic halibut (Hippoglossus hippoglossus) shows fluctuations but no clear directional trend. Temporal shifts in landings are apparent for species such as whiting (Merlangius merlangus) and roundnose grenadier (Coryphaenoides rupestris), which experienced high landings in the 1990s but saw a sharp decline thereafter, particularly in Denmark.
Trend in landings and abundances
The trend in landings and relative abundance indices was estimated as the Pearson correlation coefficients over the period 2013 to 2022. Note that some species that show positive trends in the last decade, had considerably larger landings and/or relative abundance indices before 2013, such as Norway redfish (Sebastes viviparus). The estimated trends in landings and/or relative abundance over the last 10 years (2013-2022) for the 45 species are summarized in Table 2.1. Not all 45 species are of commercial interest, and therefore developing fisheries advice may not be so relevant for all, unless they appear in large numbers as bycatch. However, the predictions of changes in abundance over time can help red list status assessment and biodiversity conservation/restoration efforts. According to FishBase, 32 out of the 45 species in Table 2.1 are (or have been) of commercial interest somewhere within its distribution range.
Common name | Latin name | Trend in surveys | Trend in landings | Commercial interest | Coefficient of variation (CV) |
Hooknose | Agonus cataphractus | -0.84 | - | 0.25 | |
Atlantic Wolffish | Anarhichas lupus | -0.65 | 0.02 | + | 0.49 |
Greater Argentine | Argentina sphyraena | 0.31 | + | 0.45 | |
Scaldfish | Arnoglossus laterna | 0.24 | - | 1.1 | |
Tusk | Brosme brosme | -0.23 | -0.0036 | + | 0.92 |
Solenette | Buglossidium luteum | -0.45 | - | 1 | |
Common Dragonet* | Callionymus lyra | -0.22 | - | 0.39 | |
Spotted Dragonet* | Callionymus maculatus | -0.39 | (-) | 0.3 | |
Reticulated Dragonet* | Callionymus reticulatus | -0.38 | + | 0.74 | |
Tub Gurnard* | Chelidonichthys lucerna | 0.88 | + | 0.68 | |
Rabbit fish | Chimaera monstrosa | 0.41 | 0.015 | + | 0.21 |
Five-bearded Rockling* | Ciliata mustela | 0.39 | + | 1.1 | |
Roundnose Grenadier | Coryphaenoides rupestris | -0.25 | 0.57 | + | 0.49 |
Lumpsucker | Cyclopterus lumpus | -0.18 | -0.22 | + | 0.29 |
Four-bearded Rockling* | Enchelyopus cimbrius | -0.9 | + | 0.17 | |
Grey Gurnard* | Eutrigla gurnardus | -0.25 | -0.094 | + | 0.26 |
Blackbelly Rosefish | Helicolenus dactylopterus | 0.89 | + | 1.1 | |
American Plaice | Hippoglossoides platessoides | -0.68 | -0.1 | + | 0.17 |
Atlantic Halibut | Hippoglossus hippoglossus | 0.77 | 0.7 | + | 0.27 |
Great Sand Eel | Hyperoplus lanceolatus | -0.55 | + | 0.89 | |
Fries's Goby | Lesueurigobius friesii | 0.84 | - | 0.75 | |
Common Dab | Limanda limanda | -0.48 | -0.73 | + | 0.18 |
Common Seasnail | Liparis liparis | -0.86 | - | 1.3 | |
Anglerfish | Lophius piscatorius | 0.48 | 0.91 | + | 0.25 |
Snake Blenny | Lumpenus lampretaeformis | -0.072 | - | 0.49 | |
Slender Eelpout* | Lycodes gracilis | -0.77 | - | 0.23 | |
Vahl's Eelpout* | Lycodes vahlii | -0.4 | (-) | 0.4 | |
Pearlsides | Maurolicus muelleri | -0.1 | + | 0.53 | |
Whiting | Merlangius merlangus | 0.76 | 0.24 | + | 0.2 |
Lemon Sole | Microstomus kitt | -0.12 | -0.062 | + | 0.11 |
Blue Ling | Molva dypterygia | 0.73 | 0.8 | + | 0.36 |
Ling | Molva molva | 0.91 | 0.9 | + | 0.32 |
Shorthorn Sculpin | Myoxocephalus scorpius | 0.64 | + | 0.59 | |
Greater Forkbeard | Phycis blennoides | -0.065 | 0.93 | + | 0.29 |
European Flounder | Platichthys flesus | -0.38 | 0.35 | + | 0.5 |
Pollack | Pollachius pollachius | -0.4 | -0.91 | + | 0.55 |
Norway Goby* | Pomatoschistus norvegicus | 0.8 | - | 1.2 | |
Brill | Scophthalmus rhombus | -0.94 | -0.28 | + | 0.28 |
Norway Redfish | Sebastes viviparus | 0.82 | + | 0.5 | |
Nilsson's Pipefish | Syngnathus rostellatus | -0.3 | - | 0.81 | |
Greater Weever | Trachinus draco | 0.071 | + | 0.7 | |
Pouting* | Trisopterus luscus | -0.64 | + | 1.5 | |
Poor Cod* | Trisopterus minutus | 0.45 | + | 0.41 | |
Norwegian Topknot | Zeugopterus norvegicus | 0.23 | - | 0.89 | |
John Dory | Zeus faber | 0.26 | 0.79 | + | 0.61 |
For 19 species, both trends (survey and landings) are available, and the results can be presented graphically by contrasting the trend in the two time-series (Figure 2.5). The comparison of 10-year trends in survey and landings data for these 19 fish species provides an indication of the correlation of the trends in both data sources. For most species, the trends in survey-based abundance estimates and commercial landings are consistent, i.e. increasing, decreasing or flat trend in both data sources. For instance, species such as greater forkbeard (Phycis blennoides), anglerfish (Lophius piscatorius), ling (Molva molva), blue ling (Molva dypterygia), and whiting (Merlangius merlangus) show positive trends in both survey and landings data, suggesting population growth or recovery over the past decade. If these species are recovering from low numbers, careful regulation and monitoring may however still be needed to safeguard recovering populations. It is important to note that the trends presented here are based on the most recent ten-year period, and for many species landings and/or abundance were considerably larger before 2013, and for the deep-sea species (i.e. blue ling) estimating abundance before the introduction of the NOSS survey is not possible.
For other species, the trends between surveys and landings diverge. For example, roundnose grenadier and John Dory exhibit positive trends in landings while survey data suggest declines. These discrepancies may sometimes stem from differences in survey and fisheries coverage, but can also be the result of an increase in selective fishing activities that target these species, indicating population declines as a result of a higher fishing pressure. Such mismatches in trends emphasize the need to integrate multiple data sources to better understand and manage species with complex population dynamics and sparse data. Conversely, pollack, and common dab show consistent declines in both survey and landings data, which warrants further investigations. In case of substantial discards these should also be considered. For example, for common dab, discards are estimated by ICES to be up to 10 times higher than the landings.
Interestingly, no species is in the yellow quadrant, i.e. displaying positive trends in survey data but negative trends in landings, suggesting that an increase in abundance is always accompanied by an increase in catches. This underlines the importance of developing cross-national recovery plans for stocks that are increasing from very low numbers, to allow them to fully recover.
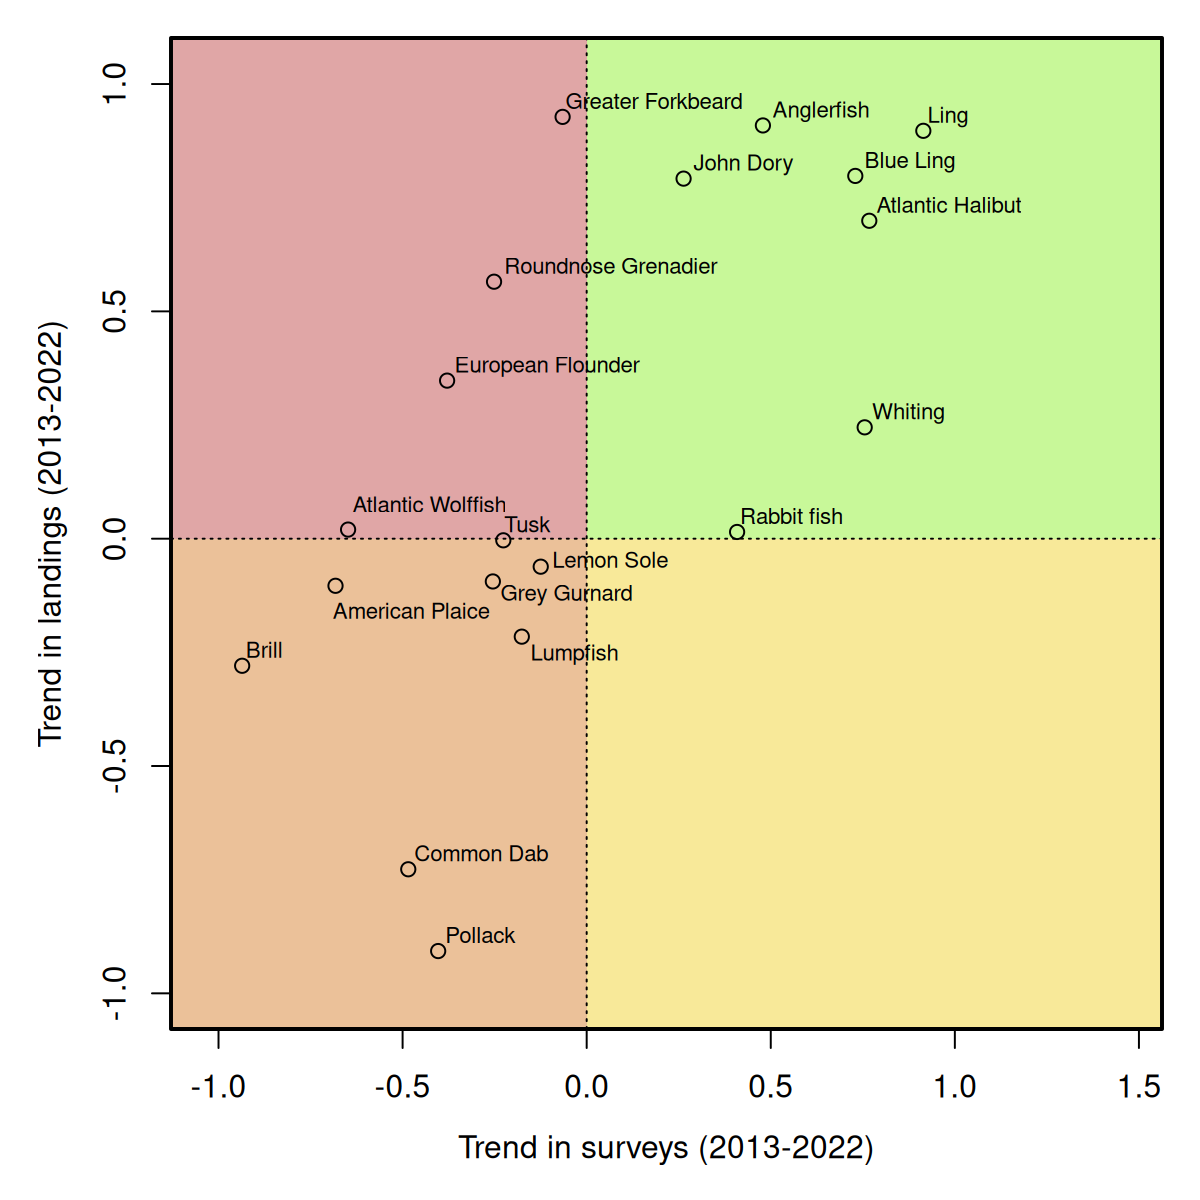
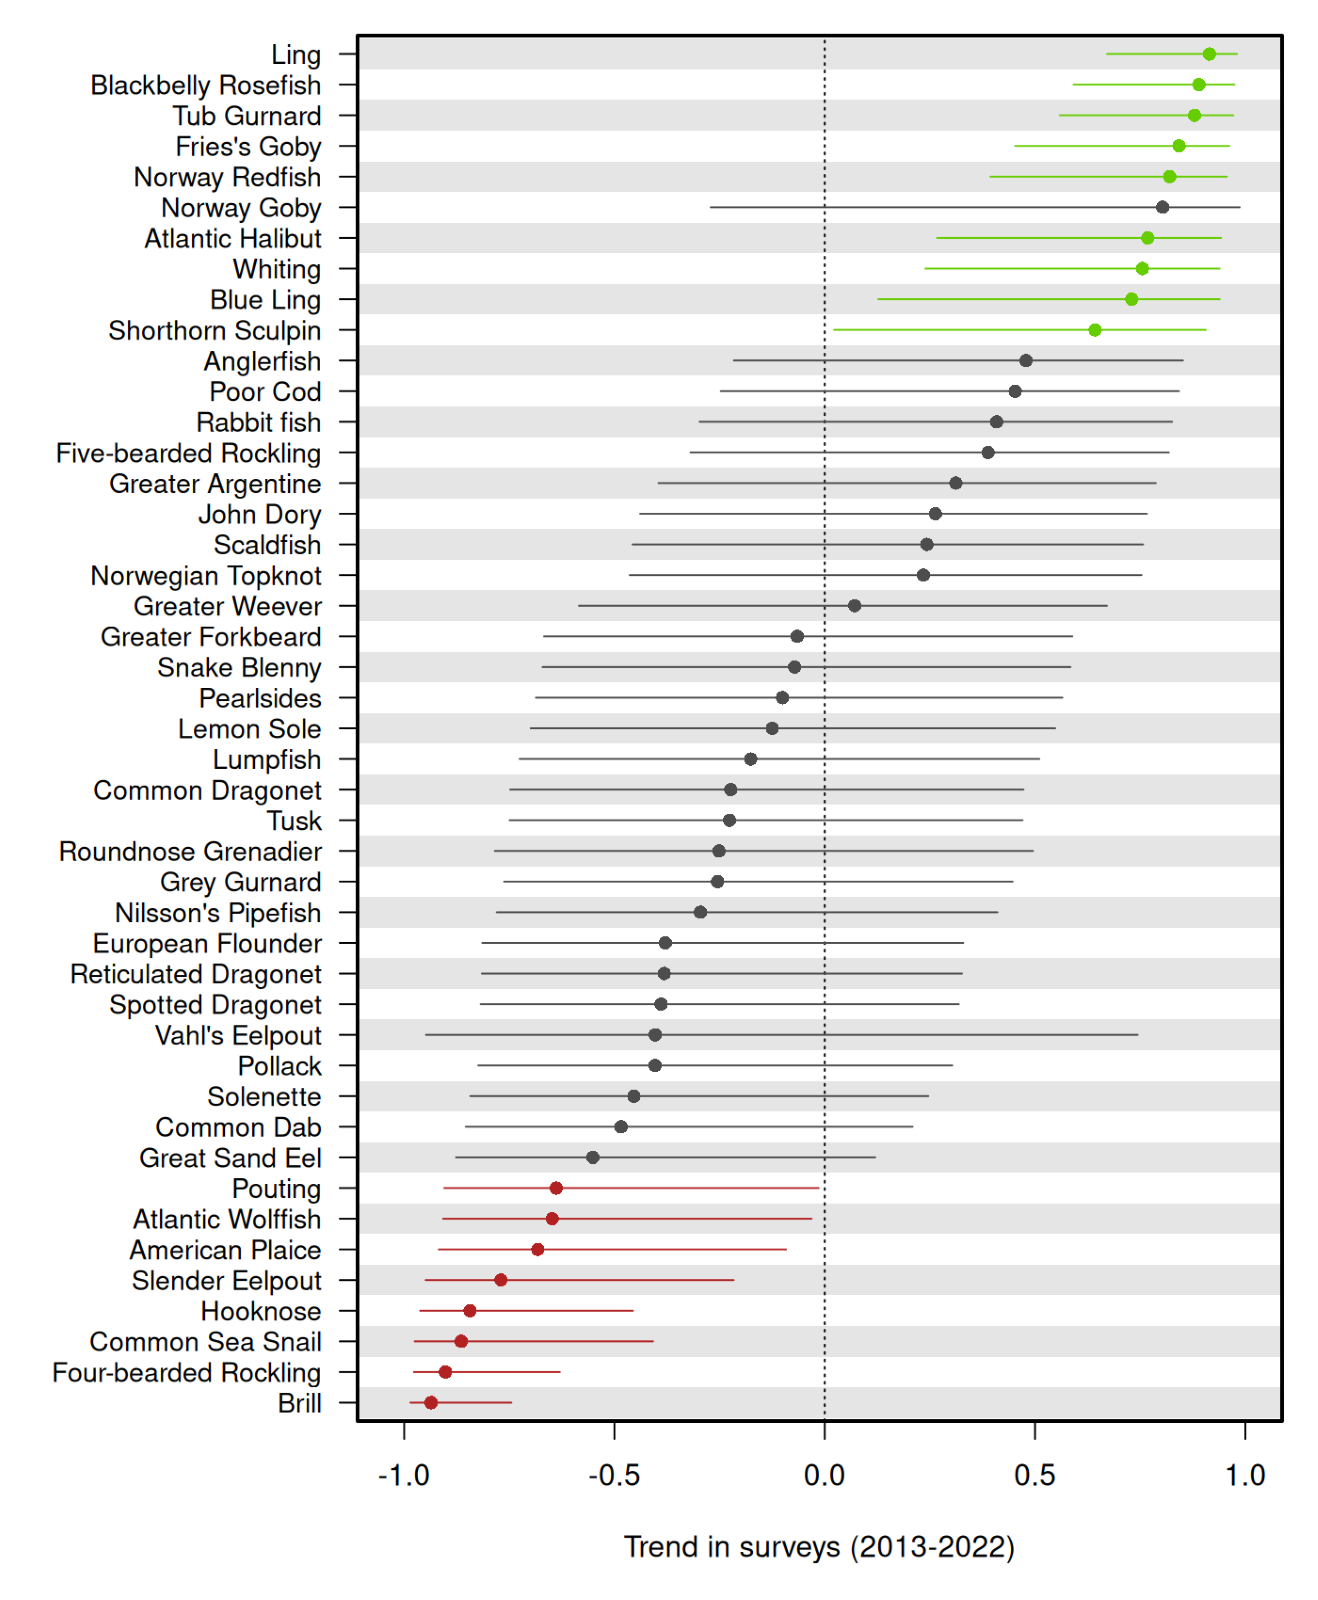
Figure 2.6 presents the 10-year survey trends for all 45 fish species, including species for which no reliable commercial landings data are available. The figure illustrates a full range of abundance changes based on survey data from –1 to 1. The x-axis represents the trend in survey data, with values greater than zero indicating increasing trends and values less than zero indicating declining trends. The y-axis lists the species, sorted by their trend values from most positive to most negative. At the top of the plot, species such as ling (Molva molva), blackbelly rosefish (Helicolenus dactylopterus), and tub gurnard (Chelidonichthys lucerna) exhibit strongly positive trends in the last 10 years, suggestive of populations that thrive under the current environmental regime or where changes in the fisheries have resulted in reduced fishing mortality. However, since the trends presented here are based on the most recent 10-year period, absolute abundances may still be low compared to periods before 2013 (i.e. whiting (Merlangius merlangus) and Norway redfish (Sebastes viviparus)), and/or reference levels. An increase from very low abundance calls for conservation measures until the stock is fully recovered. In contrast, several species at the bottom of the graph, including brill, four-bearded rockling (Enchelyopus cimbrius), and common sea snail (Liparis liparis), show strongly negative trends, highlighting significant declines in abundance over the last decade. These downward trends may reflect heightened vulnerability to environmental changes, overfishing, or other anthropogenic pressures. Steep declines are concerning and emphasize the need for targeted conservation measures to mitigate further population losses. However, not all species displaying steep declines are of commercial interest (i.e. common sea snail) and these are therefore more likely to be affected mainly by other factors besides fishing (unless they are common bycatch species). Most species fall between these two extremes, with trends closer to zero and not significantly different from zero, indicating relatively stable populations or minor fluctuations over the survey period. Species like roundnose grenadier, greater forkbeard, and anglerfish exhibit moderate trends, either slightly positive or slightly negative. However, despite roundnose grenadier exhibiting merely a weak negative trend, it appears to be already at a historic low level – a finding that is also supported by the landings (Figure 2.4).
Policy brief on fish stocks in Skagerrak with potential management shortcomings
As part of the SAMSKAG project, a policy brief was produced in which ten commercial fish species from the present study were selected for a closer examination (van Deurs et al., 2024). Additionally, one shark species was included, as well as skates and rays as a species group. This selection represents a range of potential management shortcomings from the perspective of Skagerrak. The selected species focus on high-value species with no stock assessment and therefore no biological advice (e.g., Atlantic halibut, Atlantic wolffish, and lumpsucker), and data-poor species for which biological advice is produced by ICES, but for which essentially very little about the stock status is known. The latter may be somewhat safeguarded by the precautionary approach, but this leaves little room for developing sustainable targeted fisheries, and bycatch overfishing occasionally occurs despite these measures. Moreover, stocks that are assumed to be distributed across vast areas extending far beyond the borders of Skagerrak (i.e., geographically wide stock units) were included. If Skagerrak is home to sub-populations or if distinct genetic gradients (as a function of distance) are present due to local homing behaviour or site fidelity, geographically wide stock units can lead to local depletion and loss of genetic diversity (e.g. Berkeley et al., 2004; Ciannelli et al., 2013).
For stocks that have recently moved from data-poor categories that utilize the precautionary approach to full analytical stock assessments and biological advice, a thorough understanding of the sub-stock structure, connectivity, and gene flow becomes pivotal (see also chapter 3 and the associated policy brief, André et al., 2024), particularly in light of potentially developing target fisheries for these stocks
In the policy brief, abundance trends, landing statistics, and international red list status (IUCN) as well as the national red list status ratings from Denmark, Norway, and Sweden, respectively, are described and contrasted. Overall, the results presented in the policy brief are consistent over a wide range of assumptions regarding gear efficiencies of the two surveys and model assumptions. However, note that the trend in the relative abundance index presented in the policy brief differs for three species from the here presented values that are based on an updated approach: The abundance trends for Atlantic wolffish (Anarhichas lupus), lumpsucker (Cyclopterus lumpus), and greater forkbeard (Phycis blennoides) were indicated as positive in the policy brief, whereas the updated analysis now suggests negative trends. These differences reflect advancements in our understanding and improvements in the estimation of gear coefficients between the two surveys, rather than contradictions in the underlying data. The NOSS operates in deeper areas, including depths of up to 600 m in the Norwegian Trench, while the NS-IBTS conducts only limited hauls below 200 m. The improved estimation of gear efficiency involves grouping species with similar habitats and body shapes, while focusing the analysis on a more geographically and depth-restricted area that is well-sampled by both surveys. This refined approach, to the best of our knowledge, represents the most reliable method currently available for estimating gear coefficients across surveys, offering greater consistency and precision compared to earlier methodologies that utilized the entire geographical extent of each survey and estimated effects for individual species.
Other unassessed marine groups: Cephalopods
Cephalopods, including squids, cuttlefish, and octopuses, are gaining increasing prominence in fisheries across the Northeast Atlantic (Hunsicker et al., 2010). Over recent decades, landings of cephalopods in this region have been steadily increasing (van der Kooij et al., 2016) as also indicated by a notable increase of Danish landings in Skagerrak over time (Figure 2.7A). However, these landings exhibit high interannual variability, reflecting the dynamic nature of cephalopod populations. Importantly, the species composition within the landings is not specified; the majority are categorized under the general group “Cephalopoda”. The lack of species-level identification in the landings underscores a critical knowledge gap. Cephalopods in the region are not subject to formal stock assessments, and their stock status remains unknown (ICES, 2023).
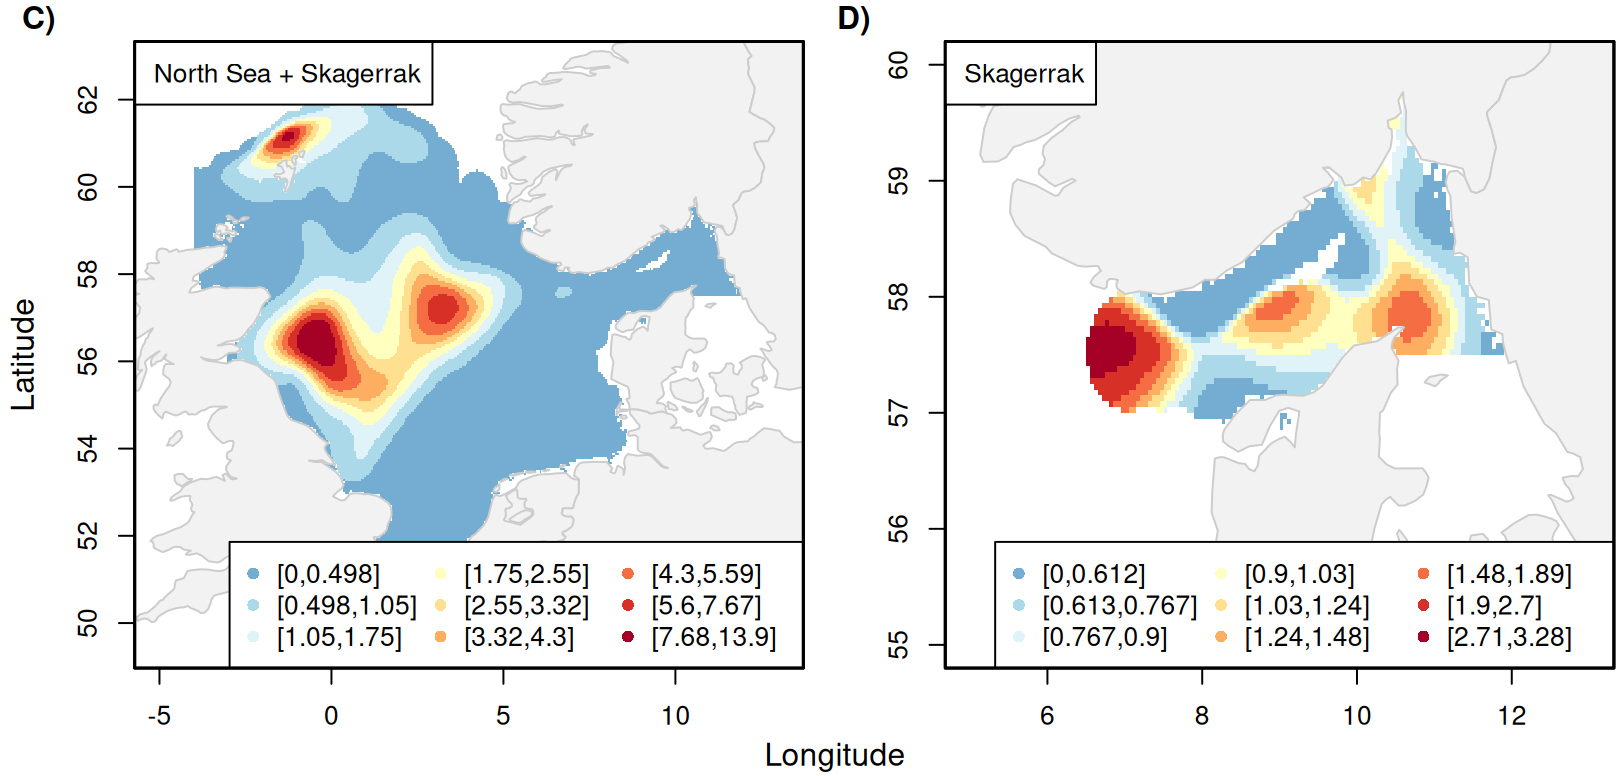
Despite this limitation, valuable insights are also gained from scientific surveys conducted in Skagerrak. Twenty-nine Aphia IDs belonging to the class Cephalopoda were observed in the two surveys with very differing taxonomic resolution, assigned to the overall class, families, genus or species (Supplementary Table S5). As a starting point, all cephalopod observations were aggregated into a single group and fitted a spatiotemporal model to the combined data from the two surveys. The estimated relative abundance index confirms the trend in the landings with an increasing trend since 2010 (Figure 2.7B). Not only does the overall trend of the abundance index align with the cephalopod landings, but also the pronounced peak in 2020 and 2021. The relative abundance index increased by 189 % from 2018 to 2019 and shows a similarly drastic decrease from 2020 to 2021. The distribution maps reveal that the main hotspot of the recorded cephalopods observations in the surveys is located in the northern and central North Sea (Figure 2.7C). Rescaling the abundance to the Skagerrak area reveals that within Skagerrak, the highest abundance of cephalopods is found in the west with less pronounced hotspots close to the deepest part of the trench in the central Skagerrak region and around Skagen. Available information from NOSS does not allow a spatiotemporal analysis of cephalopods on a finer taxonomic level than the overall class level as cephalopods have only been identified to finer taxonomic levels in recent years. Nevertheless, available information from NS-IBTS allows to investigate the spatiotemporal patterns of two cephalopods families, a family of octopuses (Eleodonidae) and pencil squids (Loliginidae), and four genuses, shortfin squids (Illex), squids of the genus Loligo, a genus of bobtail squids (Sepiola), and Lesser flying squid (Todaropsis eblanae). The estimated abundance indices for these groups show highly variable and uncertain patterns (Supplementary Figure S13).
Cephalopods are characterized by rapid growth, short lifespans (often less than one year), and highly variable population dynamics (Cady, 1983). Unlike many fish stocks, their abundance can fluctuate dramatically from year to year due to environmental conditions, such as temperature and food availability (Oesterwind et al., 2022). This inherent variability and short-lived life-history, makes traditional fish stock assessment models and fisheries management approaches, which often rely on multi-year stock assessments and fixed quotas, less suited to managing cephalopod populations effectively. Management procedures need to account for these short-term fluctuations to avoid overexploitation during low-abundance periods while allowing sustainable harvesting during high-abundance years. The current lack of targeted management for cephalopods in many parts of the Northeast Atlantic is a growing concern and in Europe, specifically, cephalopod fishing is not covered by the CFP, although many coastal small-scale fisheries for cephalopods are managed nationally or regionally (Arkhipkin et al., 2021). Furthermore, the limited priority assigned to these fisheries in Europe, combined with the difficulties of applying classic assessment methods and the data-poor nature for these stocks, presents a set of interrelated challenges (Boyle and Rodhouse, 2005). In most cases, cephalopod fisheries are unregulated, with no specific catch limits or effort controls. However, several countries, including Argentina, Australia, Canada, Chile, the Falkland Islands, Japan, Mexico, New Zealand, Peru, Russia, and South Africa, routinely assess and manage their cephalopod fisheries (Arkhipkin et al., 2015). These examples demonstrate that management and assessment of cephalopod stocks are achievable, providing valuable insights and practices that could improve the development of targeted strategies in regions where such measures are lacking, such as Skagerrak.
If landings continue to increase and fishing pressure intensifies, the need for tailored management approaches becomes more urgent. Flexible, adaptive management frameworks that can respond quickly to changes in abundance are likely necessary to ensure the long-term sustainability of cephalopod stocks. Such frameworks could include real-time monitoring of stock status, dynamic catch limits tied to environmental indicators, and precautionary measures during recruitment failures. Moreover, the ecological role of cephalopods in marine ecosystems adds another layer of complexity to their management. Due to their voracious prey consumption and high production rate, cephalopods pose an important link in marine food webs (de la Chesnais et al., 2019) and changes in their abundance can have cascading effects on other species. Effective management must therefore consider not only the sustainability of cephalopod stocks but also their broader ecological impacts. Together, these findings suggest a need for greater attention to cephalopods in the North Sea and Skagerrak, both in terms of monitoring and species-specific assessments. Improved data collection and analysis could provide critical information to support sustainable management of these increasingly significant marine resources.
Strengths and limitations
This study focused on the unique ecosystem of the Skagerrak, providing a region-specific examination of species dynamics that are often overlooked in geographically broader studies. By narrowing the scope to this specific area, the study captures fine-scale patterns and processes that might otherwise be missed in large-scale analyses and lead to undesired management outcomes (Cadrin 2020). This localized approach highlights the distinct ecological characteristics and challenges of managing the Skagerrak ecosystem, offering insights tailored to its particular environmental and biological context.
Furthermore, the study highlights the remarkable biodiversity of the Skagerrak, documenting 236 unique species across two surveys over almost 40 years. This extensive inventory underscores the ecological richness of the region and establishes a foundational dataset for understanding the area’s biological complexity. While these findings confirm Skagerrak’s status as a highly diverse region and stress the need for its protection, they also reveal a critical gap in knowledge, as many species remain without quantitative assessments in the region (Östman et al. 2016; Hornborg et al. 2020).
Integrating data from two surveys using different gear types posed a methodological challenge, as the reliability of swept area estimates is often questioned (e.g., Berg et al. 2024). This study addresses these limitations by employing a robust approach to estimate gear efficiencies. By focusing on overlapping areas, seasons, and years, and grouping species with similar body shapes and behaviors, the study mitigates potential confounding factors. This innovative methodology enables the reliable combination of datasets to estimate species-specific relative abundance indices, providing crucial information for data-limited species.
Moreover, the study incorporates region-specific landings data from Denmark, Sweden, and Norway, identifying 19 species for which reliable landings information is available. By analyzing trends in these data, the research provides a valuable perspective on the correlation between fishing activities and species abundance. This detailed examination of landings trends contributes to a more nuanced understanding of fisheries in the Skagerrak region, offering insights into sustainable resource management.
The analysis of relative survey and landings trends reveals critical information about the status of species in the Skagerrak. Declines in certain species highlight the potential impacts of high fishing pressure or environmental changes, signaling the need for targeted management actions. Conversely, increasing trends may indicate species recovery and success of certain management measures as well as adaptation to changing conditions, potentially opening opportunities for future fisheries. For example, the potential expansion of suitable habitat for blackbelly rosefish in the North Atlantic has been identified, which may influence their distribution and biomass (Morato et al., 2020). This dual perspective helps identify priorities for conservation and sustainable exploitation.
By assessing the availability and quality of data for species caught by commercial fishing fleets, the study lays a foundation for future stock assessments and management advice, such as the risk-based assessment of Swedish fisheries in the Skagerrak-Kattegat region (Hornborg et al., 2020). The inventory of species and their abundance trends serves as a critical resource not only for fisheries management but also for biodiversity conservation and spatial planning efforts. This work emphasizes the importance of robust data collection and analysis in supporting effective management and ensuring the long-term sustainability of Skagerrak’s fisheries and ecosystems.
Despite its strengths, this study has certain limitations that should be acknowledged to guide future research. The use of a 10-year timeframe trend analysis, while valuable, may not align with the generation time of all species, potentially limiting the ecological relevance of the findings. For example, the IUCN Red List criteria consider a period spanning three generations or 10 years, whichever is longer (IUCN, 2001). For species with longer generation times, such as the Atlantic wolffish, this 10-year period may not adequately capture all population dynamics and overlook long-term declines. Aligning future analyses with species-specific generation times, as recommended by Punt et al., (2016), would provide a more ecologically grounded perspective, particularly for species of minor commercial importance that are vital for biodiversity conservation and restoration agendas.
Challenges in estimating trends come about from methodological and survey-related factors. Differences in depth ranges between the NS-IBTS and NOSS surveys result in incomplete coverage of deep-water habitats, such as the Norwegian Trench, which is critical for certain species such as roundnose grenadier and rabbitfish. Ship effects and gear efficiency further complicate trend estimation, highlighting the need for standardization and calibration across surveys. This is also highlighted by the need for gear calibration between the GOV and Campelen trawls used in NS-IBTS and NOSS, respectively. The current study mitigates these discrepancies by grouping species based on habitat and body shape building on the approach described by Walker et al., (2017), yet the approach used here does not account for the length of the fish or ship effects and might introduce uncertainties, especially for species inhabiting multiple or mixed habitats. Future research should prioritize further standardization and calibration across surveys.
Summarizing complex temporal patterns into single metrics poses additional challenges. While this study estimates relative abundance indices, reducing these temporal patterns to a single value (here: Pearson correlation coefficient) may obscure year-to-year variability or mask historical baselines critical for understanding long-term trends. Given that many species in this study are deep-water and long-lived, alternative metrics, such as ratios of recent to historical averages or time series analyses over longer periods, could provide more robust insights into population changes. For example, the sharp decline in pollack landings over the last three decades highlights the need for longer-term perspectives to contextualize recent trends.
Lastly, the exclusion of pelagic species and certain taxonomic groups, such as cephalopods or elasmobranchs which are only identified at coarse taxonomic levels, limits the comprehensiveness of the analysis. Cephalopods, which are increasingly important in fisheries, are not subject to detailed stock assessments due to identification challenges and data scarcity (Arkhipkin et al., 2021). Elasmobranchs show pronounced negative abundance trends on a global scale (Dulvy et al., 2024), and, therefore, need to be identified on a species level and monitored closely. Fundamental shifts in elasmobranch assemblages in the North Sea have been noticed from the historical dominance of larger and commercially valuable species to the current prevalence of smaller and more productive species (Bom et al., 2022; Sguotti et al., 2016). Thus, addressing these gaps will require improved species-level identification in surveys and landings, as well as targeted studies to explore the population dynamics of these overlooked taxa.
Perspectives and conclusion
This study represents a significant step toward addressing the gaps in knowledge about the "forgotten" species of the Skagerrak. By shedding light on the diversity of species in this unique marine area, the availability of data, their trends in abundance, and the uncertainties surrounding these trends, this work contributes to a broader understanding of the ecological and fisheries dynamics in the region. It is a testament to the value of international collaboration in creating an inventory of species and prioritizing stocks that require urgent attention for conservation and management.
The results of this study underline the importance of integrating data from multiple surveys and from commercial landings to provide a more comprehensive and accurate picture of species trends. The methodological advancements highlighted here demonstrate how careful analyses can bring new insights into data-deficient species, emphasizing the need for continued improvements in survey coverage, data collection, and analytical methods. Future efforts should explore additional ways to calculate trends or changes in relative abundance that are less susceptible to outliers, such as approaches that take averages over multiple years. These refinements would make trend estimates more robust and reliable for long-term monitoring and decision-making.
Another key area for future work lies in the integration of uncertainty and other ecological factors, such as changes in spatial distributions, into trend assessments. The latter will become particularly important with accelerating ocean warming, which will have species-specific effects on habitat suitability. This could be achieved through methodologies similar to those used for IUCN Red List ratings, where uncertainty and spatial dynamics are explicitly considered in determining species status. Additionally, investigating trends in abundance for different length or age groups will provide a deeper understanding of population structure and dynamics. This will help identify potential vulnerabilities, such as declines in larger, mature individuals, which are often critical for the sustainability of fish stocks.
Emerging fisheries, such as those targeting cephalopods, present both opportunities and challenges. The short generation times and rapid population dynamics of cephalopods, driven by environmental fluctuations, require adaptive management frameworks that go beyond traditional multi-year stock assessments. Incorporating real-time monitoring and dynamic catch limits tied to environmental indicators can help balance economic interests with ecological sustainability. Moreover, the ecological role of cephalopods as both predators and prey underscores their importance within marine food webs, warranting greater attention in research and management.
A major challenge remains the governance complexities of the region, with the Skagerrak spanning multiple jurisdictions, including Denmark, Norway, and Sweden, each with varying management and data collection frameworks (Ziegler et al., 2016). This geographical and political complexity calls for enhanced international collaboration, harmonization of policies, and the development of region-specific management approaches. The report also emphasizes the need for a unified strategy to address data limitations, particularly for species inhabiting deeper areas of the Norwegian Trench, which are poorly represented in existing surveys.
Overall, this study serves as an important foundation for future research and management initiatives in Skagerrak. By bringing attention to the species that have historically been overlooked, it highlights the need for continued international collaboration, innovative methodologies, and targeted conservation efforts to ensure the sustainable use and protection of these vital resources.
References
André, C., Henriksson, S., Jahnke, M., De Wit, P., Knutsen, H., Jorde, P.E., Søvik, G., Moland, E., Berkström, C. and van Deurs, M., 2024. Spatial population structure and connectivity among marine populations in the Skagerrak: implications for marine biodiversity conservation. https://doi.org/10.6027/nord2024-033
Arkhipkin, A. I., Rodhouse, P. G. K., Pierce, G. J., Sauer, W., Sakai, M., Allcock, L., Arguelles, J., et al. 2015. World squid fisheries. Reviews in Fisheries Science and Aquaculture, 23: 92–252. https://10.1080/23308249.2015.1026226
Arkhipkin, A. I., Hendrickson, L. C., Payá, I., Pierce, G. J., Roa-Ureta, R. H., Robin, J. P., & Winter, A. 2021. Stock assessment and management of cephalopods: advances and challenges for short-lived fishery resources. ICES Journal of Marine Science, 78(2), 714-730. https://doi.org/10.1093/icesjms/fsaa038
Bendtsen, J., Gustafsson, K. E., Söderkvist, J., & Hansen, J. L. 2009. Ventilation of bottom water in the North Sea–Baltic Sea transition zone. Journal of Marine Systems, 75(1-2), 138-149. https://doi.org/10.1016/j.jmarsys.2008.08.006
Berkeley, S.A., Hixon, M.A., Larson, R.J. and Love, M.S., 2004. Fisheries sustainability via protection of age structure and spatial distribution of fish populations. Fisheries, 29(8), pp.23-32. https://doi.org/10.1577/1548-8446(2004)29[23:FSVPOA]2.0.CO;2
Berg, C. W., Nielsen, A., and Kristensen, K. 2014. Evaluation of alternative age-based methods for estimating relative abundance from survey data in relation to assessment models. Fisheries Research, 151, 91–99. https://doi.org/10.1016/j.fishres.2013.10.005
Berg, C. W., Wieland, K. and Rindorf, A., 2024. Effect of tow duration, door spread, and swept area on the catch efficiency of a bottom trawl. Fisheries Research, 278, p.107108. https://doi.org/10.1016/j.fishres.2024.107108
Bom, R. A., Brader, A., Batsleer, J., Poos, J. J., Van Der Veer, H. W., & Van Leeuwen, A. 2022. A long-term view on recent changes in abundance of common skate complex in the North Sea. Marine Biology, 169(11), 146. https://doi.org/10.1007/s00227-022-04132-w
Boyle, P. R., Rodhouse, P. G. 2005. Cephalopods: Ecology and Fisheries. Blackwell, Oxford. 452 pp.
Caddy, J. F. 1983. The cephalopods: factors relevant to their population dynamics and to the assessment and management of stocks. In Advances in Assessment of World Cephalopod Resources, pp. 416–457. FAO Fisheries Technical Papers, 231, FAO Publications, Rome.
Cadrin, S.X., 2020. Defining spatial structure for fishery stock assessment. Fisheries Research, 221, p.105397. https://doi.org/10.1016/j.fishres.2019.105397
Ciannelli, L., Fisher, J.A., Skern-Mauritzen, M., Hunsicker, M.E., Hidalgo, M., Frank, K.T. and Bailey, K.M., 2013. Theory, consequences and evidence of eroding population spatial structure in harvested marine fishes: a review. Marine Ecology Progress Series, 480, pp.227-243. https://doi.org/10.3354/meps10067
Costello, C., Ovando, D., Hilborn, R., Gaines, S.D., Deschenes, O. and Lester, S.E., 2012. Status and solutions for the world’s unassessed fisheries. Science, 338(6106), pp.517-520. https://doi.org/10.1126/science.1223389
de la Chesnais, T., Fulton, E.A., Tracey, S.R. and Pecl, G.T., 2019. The ecological role of cephalopods and their representation in ecosystem models. Reviews in Fish Biology and Fisheries, 29, pp.313-334. https://doi.org/10.1007/s11160-019-09554-2
Dulvy, N.K., Pacoureau, N., Matsushiba, J.H., Yan, H.F., VanderWright, W.J., Rigby, C.L., Finucci, B., Sherman, C.S., Jabado, R.W., Carlson, J.K. and Pollom, R.A., 2024. Ecological erosion and expanding extinction risk of sharks and rays. Science, 386(6726), p.eadn1477. https://doi.org/10.1126/science.adn1477
Froese, R. and D. Pauly. Editors. 2024. FishBase. World Wide Web electronic publication.
Hilborn, R., Amoroso, R.O., Anderson, C.M., Baum, J.K., Branch, T.A., Costello, C., De Moor, C.L., Faraj, A., Hively, D., Jensen, O.P. and Kurota, H., 2020. Effective fisheries management instrumental in improving fish stock status. Proceedings of the National Academy of Sciences, 117(4), pp.2218-2224. https://doi.org/10.1073/pnas.1909726116
Hornborg, S., Hobday, A. J., Borthwick, L., and Valentinsson, D. 2020. Risk-based evaluation of the vulnerability of the Skagerrak–Kattegat marine fish community to Swedish fisheries. ICES Journal of Marine Science, 77(7-8), 2706-2717. https://doi.org/10.1093/icesjms/fsaa136
Hunsicker, M. E., Essington, T. E., Watson, R., & Sumaila, U. R. (2010). The contribution of cephalopods to global marine fisheries: can we have our squid and eat them too?. Fish and fisheries, 11(4), 421-438. https://doi.org/10.1111/j.1467-2979.2010.00369.x
ICES. 2023a. Workshop 2 on Fish Distribution (WKFISHDISH2; outputs from 2022 meeting). ICES Scientific Reports. 5:7. 127 pp. https://doi.org/10.17895/ices.pub.21692246
ICES. 2023b. Working Group on Cephalopod Fisheries and Life History (WGCEPH; outputs from 2022 meeting). ICES Scientific Reports. 5:01. 163 pp. https://doi.org/10.17895/ices.pub.21976718
ICES. 2024. Workshop on the Development of Quantitative Assessment Methodologies based on Life-history traits, exploitation characteristics, and other relevant parameters for data-limited stocks (WKLIFEXIII). ICES Scientific Reports. 6:95. 64pp. https://doi.org/10.17895/ices.pub.27677745
IUCN. 2001. IUCN Red List Categories and Criteria: Version 3.1. IUCN Species Survival Commission. IUCN, Gland, Switzerland and Cambridge, UK. ii + 30pp.
López, J. and Perry, A. (2022). The most depleted fish stocks in the Northeast Atlantic. Oceana, Madrid. 28 p.
Morato, T., González‐Irusta, J. M., Dominguez‐Carrió, C., Wei, C. L., Davies, A., Sweetman, A. K., ... & Carreiro‐Silva, M. 2020. Climate‐induced changes in the suitable habitat of cold‐water corals and commercially important deep‐sea fishes in the North Atlantic. Global Change Biology, 26(4), 2181-2202. https://doi.org/10.1111/gcb.14996
Oesterwind, D., Barrett, C.J., Sell, A.F., Núñez-Riboni, I., Kloppmann, M., Piatkowski, U., Wieland, K. and Laptikhovsky, V., 2022. Climate change-related changes in cephalopod biodiversity on the North East Atlantic Shelf. Biodiversity and Conservation, 31(5), pp.1491-1518. https://doi.org/10.1007/s10531-022-02403-y
Östman, Ö., Beier, U., Ragnarsson Stabo, H., Olsson, J., Svedäng, H., Sundelöf, A., Sandström, A., et al. 2016. Förvaltningsmål för nationellt förvaltade bestånd - En översikt av kvantitativa mål. Institutionen för akvatiska resurser, Sveriges lantbruksuniversitet, Öregrund. 67s. https://pub.epsilon.slu.se/14134/ (last accessed 15 June 2020).
Pante E, Simon-Bouhet B, Irisson J. 2023. marmap: Import, Plot and Analyze Bathymetric and Topographic Data_. R package version 1.0.10, https://CRAN.R-project.org/package=marmap
Punt, A. E., Butterworth, D. S., de Moor, C. L., De Oliveira, J. A., & Haddon, M. 2016. Management strategy evaluation: best practices. Fish and fisheries, 17(2), 303-334. https://doi.org/10.1111/faf.12104
Sguotti, C., Lynam, C. P., García‐Carreras, B., Ellis, J. R., & Engelhard, G. H. 2016. Distribution of skates and sharks in the North Sea: 112 years of change. Global change biology, 22(8), 2729-2743. https://doi.org/10.1111/gcb.13316
Van der Kooij, J., Engelhard, G.H. and Righton, D.A., 2016. Climate change and squid range expansion in the North Sea. Journal of Biogeography, 43(11), pp.2285-2298. https://doi.org/10.1111/jbi.12847
van Deurs, M., Mildenberger, T., Søvik, G., Moland, E., Henriksen, O., Brown, E. J., Bergström, U., & Sköld, M. 2024. Fish stocks in Skagerrak with management shortcomings. Nordic Council of Ministers. Nord 2024:032. https://doi.org/10.6027/nord2024-032
Walker, N.D., Maxwell, D.L., Le Quesne, W.J. and Jennings, S., 2017. Estimating efficiency of survey and commercial trawl gears from comparisons of catch-ratios. ICES Journal of Marine Science, 74(5), pp.1448-1457. https://doi.org/10.1093/icesjms/fsw250
Ziegler, F. S., Hornborg, S., Valentinsson, D., Hognes, E. S., Sovik, G., & Eigaard, O. R. (2016). Same stock, different management: quantifying the sustainability of three shrimp fisheries in the Skagerrak from a product perspective. ICES Journal of Marine Science, 73(7), 1806-1814. https://doi.org/10.1093/icesjms/fsw035