PART 2.
2.2 Material and Methods
2.2.1 Volume of subarctic water
Spatial view To describe the annual 3-D hydrographic variability from 1995 to present, we combined data sets from ICES (International Council for the Exploration of the Sea), PINRO (Polar Research
Institute of Marine Fisheries and Oceanography, Russia), and the Argo Global Data Assembly Centre in France (Argo, 2000) (Mork et al., 2019). These data are processed as described in Skagseth et al. (2022). Spatial maps showing SAW thickness defined as 1 °C < T < 4 °C and S < 34.9 (Fig. 2.2).
Section N Hydrographic observations were made 3–4 times a year along a standard section (Section N), crossing the Faroe slope along the 6°W meridian (Fig. 2.1). These numerous measurements at Section N enable us to construct a proxy record for the SAW volume back to 1992. A cross-sectional area of SAW (actually Modified East Icelandic Water, MEIW) – our estimate of the influence from the cold Icelandic Tongue – is calculated for each measurement of Section N by integrating the areal representation of observations in the T-S range (1–3 °C, < 34.85) (Kristiansen et al., 2019).
Svinøy Section A SAW proxy series is also estimated as the area along the Norwegian Svinøy section (0–500 m depths), which extends north-westward from the Norwegian slope (Fig. 2.1). The cross-section area is here represented by water fresher than 34.9 in July–August.
2.2.2 Calanoid copepods
Section N Monitoring of zooplankton abundance and composition (WP-2 net) was initiated at Section N in 1994 with data being collected in mid-to late May, refined our analysis to the overwintering generations. No data are available for 1996, 1998 and 2006. The overwintered stages of C. finmarchicus (CIV to CVI) (Kristiansen et al., 2016) and all the developmental stages of C. hyperboreus from the truly subarctic (north of the Iceland-Faroe Front, Fig. 2.1) were used in our analysis, which follows Kristiansen et al. (2019).
Svinøy Section The zooplankton time-series from the Svinøy section started in 1995, and only the three westernmost stations from 17 April to 17 May are used here (following the example of Skagseth et al., 2022). C. hyperboreus has been identified to copepodite stages and only the copepodite stage IV, V, and adult females and males were used in the present analysis. Younger stages were omitted because they exhibit great fluctuations in abundance during the growth season (Gislason, 2018). The older stages will in addition represent the overwintering stages (Gislason, 2018). The data are presented as abundance per m3.
2.2.3 Demersal fish and guillemots
Faroese waters host two distinct cod stocks: the Faroe Plateau Cod and the Faroe Bank Cod. The International Council for the Exploration of the Sea (ICES) regularly assesses both stocks to guide sustainable fishing practices. The Faroe Plateau Cod stock is a data-rich (ICES category 1), allowing for comprehensive stock assessments that provides estimates of recruitment, spawning stock biomass, total stock biomass, and fishing pressure from 1959 to 2024 (ICES, 2023). Conversely, the Faroe Bank Cod is classified as data-limited (ICES category 3), and the assessments for this stock rely primarily on survey biomass indices, and estimates of recruitment or spawning stock biomass are not currently available. The primary biomass index used in assessments is a CPUE (Catch Per Unit Effort) series derived from groundfish surveys conducted in September from 1996 to 2024 (ICES, 2023). Additionally, a secondary CPUE series from groundfish March surveys (1994–2024), is available, with gaps in 1996, 2004, and 2005.
2.2.4 Guillemots
We use counts of the total number of guillemots attending a long-term study colony for these species in the Faroe Islands (the Høvdin breeding cliff on the islands Skúvoy) since 1972 (see Olsen et al., submitted).
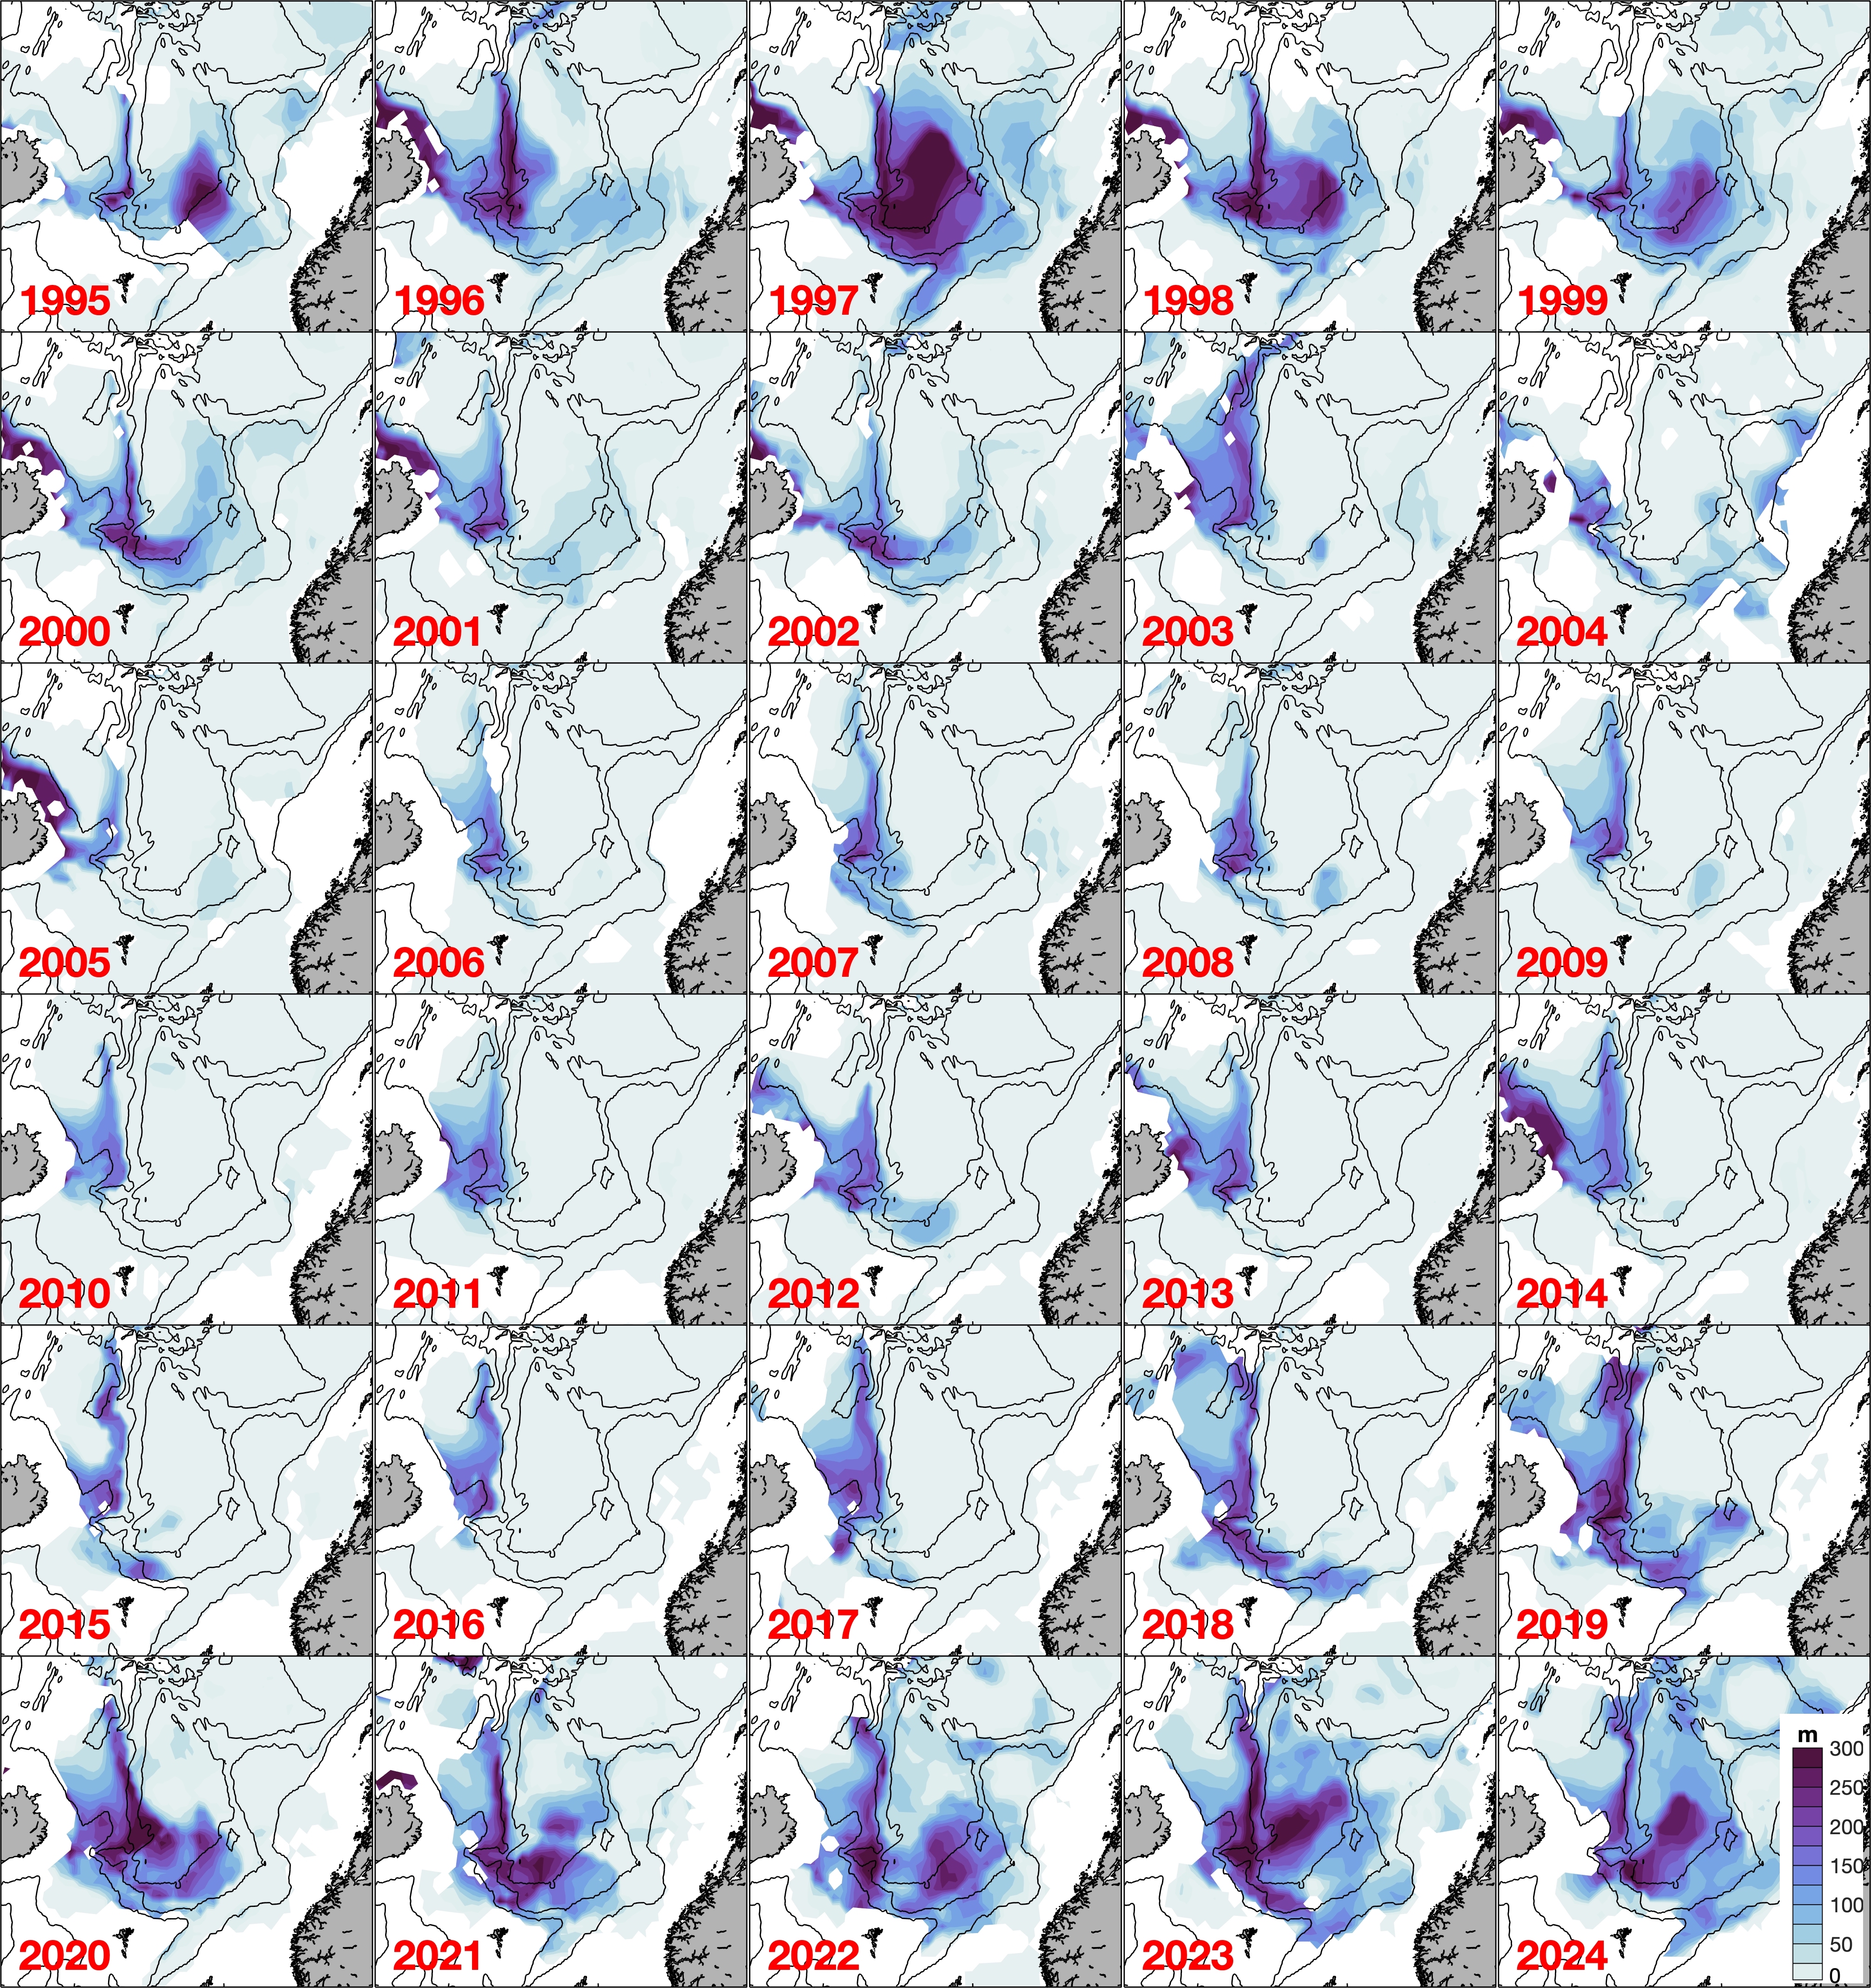
Figure 2.2 Spatio-temporal changes in SAW thickness (see blue color scale) in the greater Norwegian Sea (including eastern parts of the Iceland Sea and the Faroe-Shetland Channel).