Photo 22. Urban woodland scene in autumn (photo by Imad Clicks).
Appendix
A1. Method for GIS-analysis
Heat stress risk maps
The heat stress risk maps have been constructed using data from the US Landsat satellite constellation, with added prognoses from the IPCC. The Landsat series of satellites measure the temperature of the earth, with a spatial resolution of 100 metres, since 1983. This provides us with climatological time series of temperature data for every spot on the planet.
We have downloaded this data for the Nordic region over the last three summers (2021, 2022 and 2023), and we have extracted the hottest temperatures measured per year for every location. We do this every year. Then we take the median value over the last three years, and we consider that to be the current heat stress risk temperature.
Based on IPCC prognoses, we have extrapolated this heat stress risk temperature to the future, being the near future (about 2030), the mid-term future (about 2050) and the far future (about 2090). We have done so using Shared Socioeconomic Pathway 5, which is considered the current worst-case scenario.
After that we have classified the thermal map and predictions into seven classes, based on physiological classes ranging from “too cold for trees” to “morbid heat stress”. It is important to note that this classification is meant for trees, not for humans.
Climate analyses
The method used in this report, described in Swedish as klimatanalyser (Trädkontoret AB 2024) is based on the kuenm package for R (Muscarella et al., 2014), a modelling package based on the Maxent software for modelling species niches and distributions (Philips et al., 2017). The process includes recorded observations of a tree species from Gbif (Global biodiversity infrastructure facility), combined with high-resolution climate data (see Figure A1) to model the future distribution of a species. The model is run on climate data based on the SSP370- scenario. SSP370 is one of the socioeconomic scenarios used in climate models and future projections to examine the effects of different pathways for future development on the climate. SSP stands for “Shared Socioeconomic Pathways” and is a set of five scenarios that describe possible future societal developments. The number 370 in SSP370 represents the approximate radiative forcing, measured in watts per square metre (W/m²), expected by the year 2100 under this scenario. SSP370 describes a world with moderate challenges for both climate change and adaptation. This scenario includes relatively high greenhouse gas emissions, leading to a radiative forcing of approximately 7.0 W/m² by 2100. It also implies moderate social, economic, and technological developments, meaning that efforts to reduce emissions and adapt society to climate change are not particularly ambitious (IPCC, 2021).
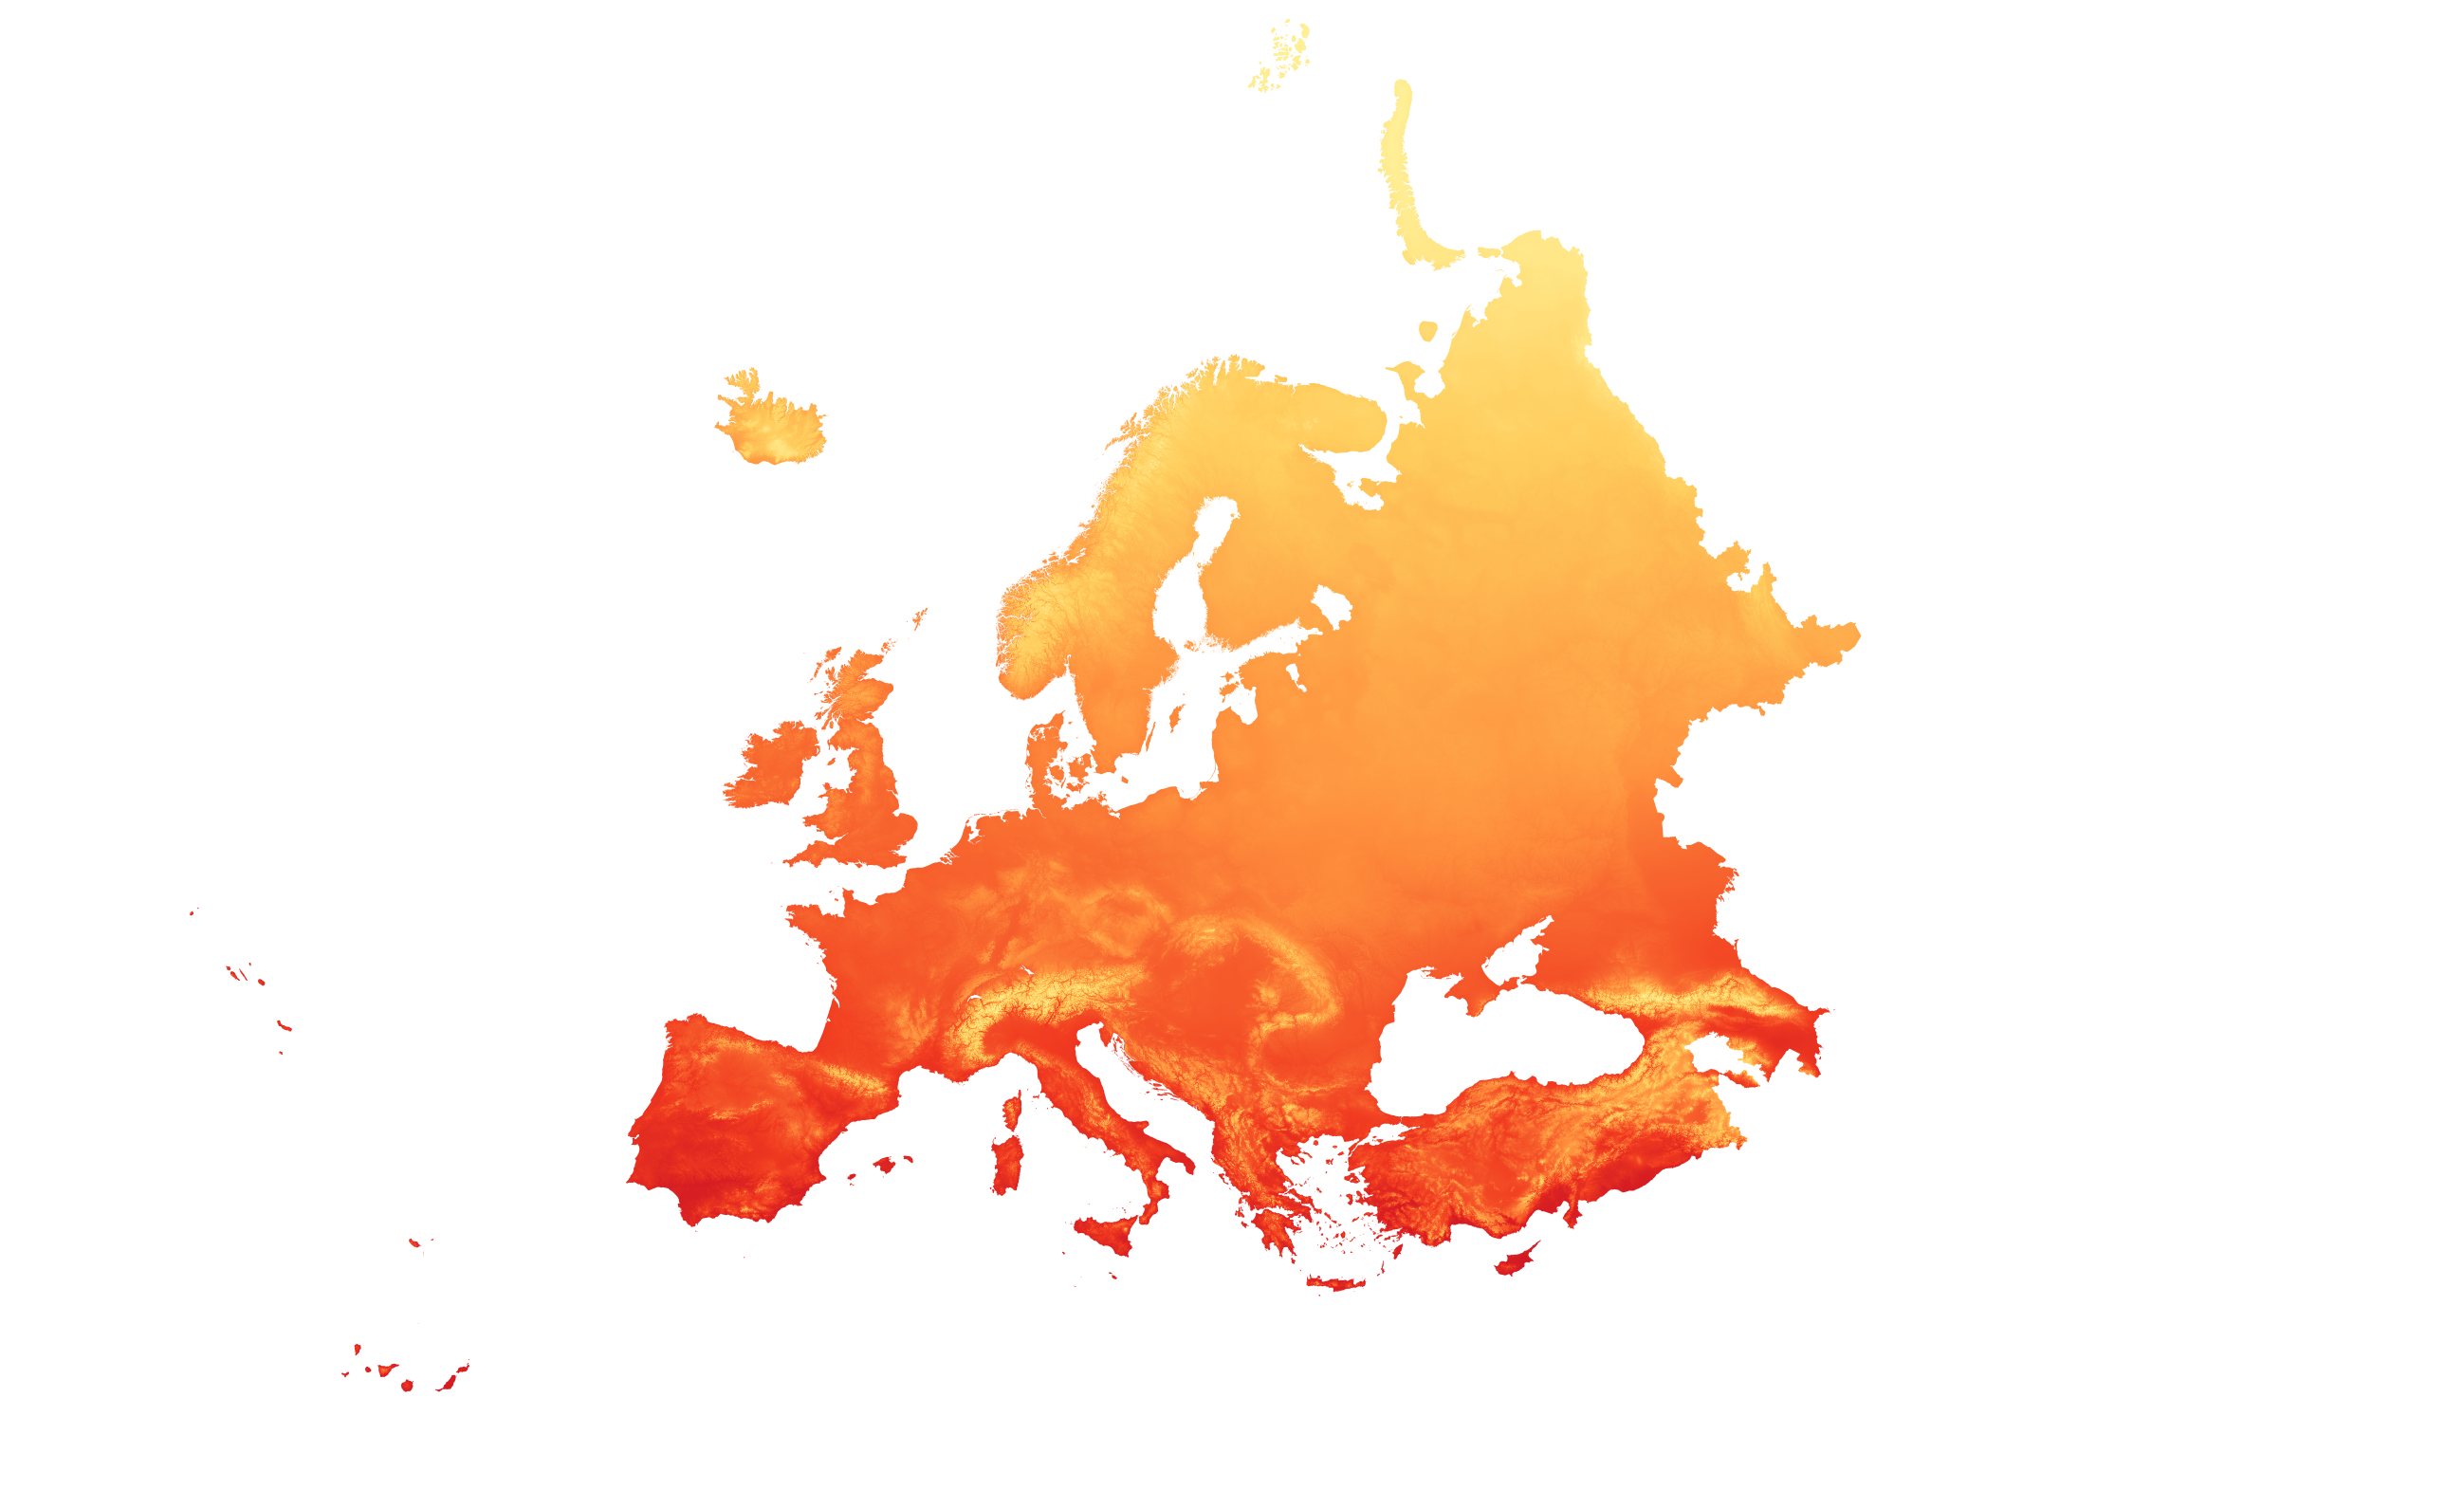
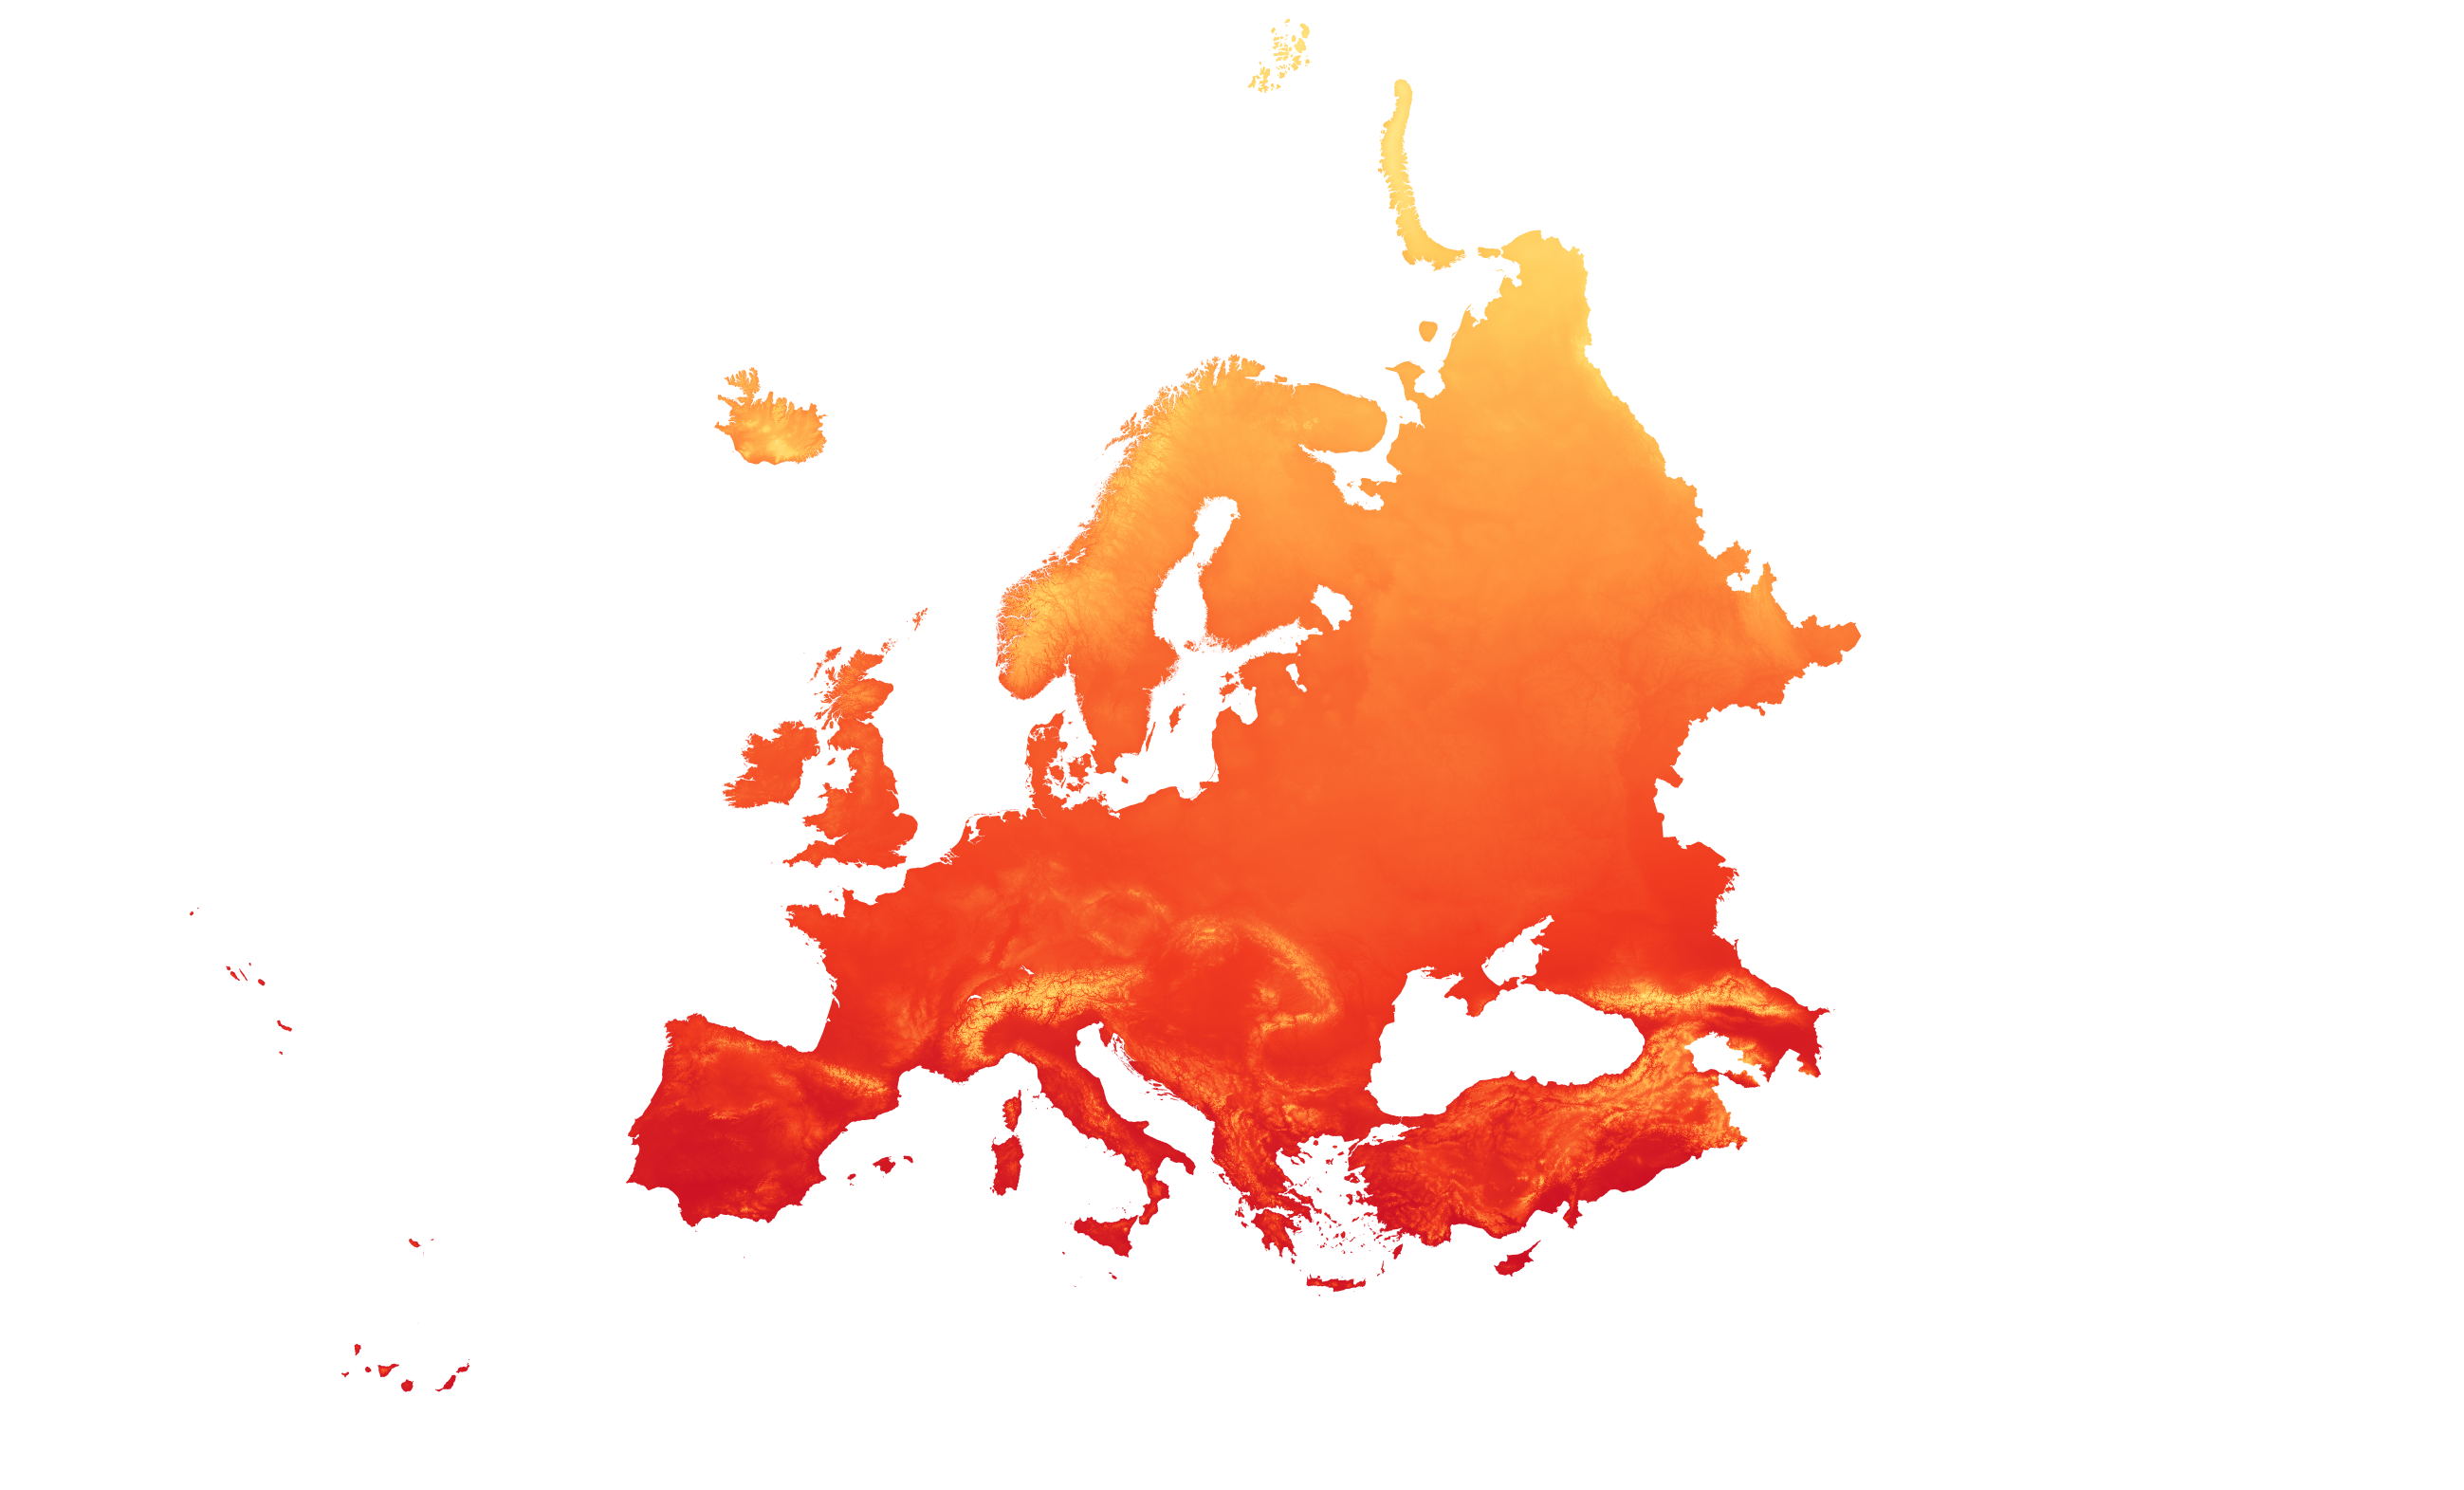
Fig A1. Example of high-resolution climate data: Bio1. The development of mean annual temperature in Europe as modelled by GFDL for the ssp370- scenario for 1981-2010 (first) and 2071-2100 (second). (Karger et al., 2021).
The method is broken down into three main steps:
- Processing occurrence data: Occurrence data containing information about a tree species’ observed presence. This data has been retrieved from the portal Gbif.org, which hosts a large species library with observations of species from around the world. First, the occurrence data of various species is filtered from CSV files containing species data from GBIF.org. The goal is to prepare and clean this data for use, including removing observations with high uncertainty and duplicate coordinates, as well as partitioning the data into blocks for further analysis.
- Processing climate data: High-resolution climate data in raster format is used to model future distribution and provide an overview of a species' historical range. This data has been downloaded from chelsa-climate.org and contains high-resolution global climate data. The climate data is processed using various packages in the R programming language and is then cropped to fit the study area, in this case, the Nordic region.
- Data modelling: The cleaned occurrence data, along with climate data is processed through a Maxent script in R, where each species’ potential habitat is modelled based on occurrence and climate data. The model processes various modelling scenarios to identify the most suitable scenario for each species and then compiles this into a new raster layer representing the projected occurrence of the species. The raster is then graduated from 0 to 10 where 0 represents unfavourable conditions for the mapped species, and 10 represents favourable conditions.
Socioeconomic analyses
As Malmö was the only participating city in the project that submitted data on socioeconomic parameters, we chose this city for an in-depth case study, while the other 8 cities participating in the project needed another approach. The in-depth analysis of Malmö can inspire similar analyses in other cities in the future. In Malmö, we used data on employment, mean yearly income, and ethnicity as a percentage of the population on DESO (demographic statistical areas) level that are either born outside Sweden or have parents both born outside Sweden (so-called first and second-generation immigrants). Additionally, we used the reported mean number of sick days per DESO area to illustrate the challenges of public health. For the report, we illustrated levels of each of the four datasets and whether the area reached the 3+30+300 score. The three areas in Malmö that are defined by the Swedish police as vulnerable due to their socioeconomic and safety challenges are also shown on the maps. Additionally, we plotted the datasets against 3+30+300 overall score showing the size of the population in each DESO area. Especially for ethnicity, the relationship between a high share of first and second-generation immigrants and 3+30+300 is almost linear. The higher the share of immigrants, the higher school note.
For the other case cities, we first looked at if and how the different countries define socio-economic vulnerability, and if the countries or cities themselves define any area as vulnerable. Results can be found in Table 8 above. For all cities we were able to identify areas that are seen as vulnerable or experiencing challenges connected to socioeconomic parameters. Data on how these areas score on the different 3+30+300 components were extracted and compared to how the city scores as a whole. We chose not to present this data as maps as the different areas are defined in different manners and that socioeconomic vulnerability is a sensitive issue. The results are instead presented in table form to show general trends instead of pinpointing specific areas in the cities.
Comparison of tree cover data with climate-related parameters
The methodology used for this part of the study is grounded in an analysis of climate data, supplemented by tree canopy data provided by the participating cities. This foundational information facilitated the development of two distinct studies: one examining the correlation between heatmap data and tree cover, and the other investigating the relationship between noise pollution levels and tree cover.
Malmö was selected for the noise pollution study due to its comprehensive and detailed data among the participating cities. This data established a robust framework for analysing how tree cover influences noise levels in urban environments (see Figure A2).
In both studies, statistical analyses were conducted to identify and quantify the correlations between the respective environmental factors – temperature and noise pollution – and tree cover. This involved comparing the spatial distribution of these data sets to the levels of aerial tree cover in the areas studied. This methodological approach aims to inform urban planning practices and enhance understanding of the benefits that tree cover provides in urban settings.
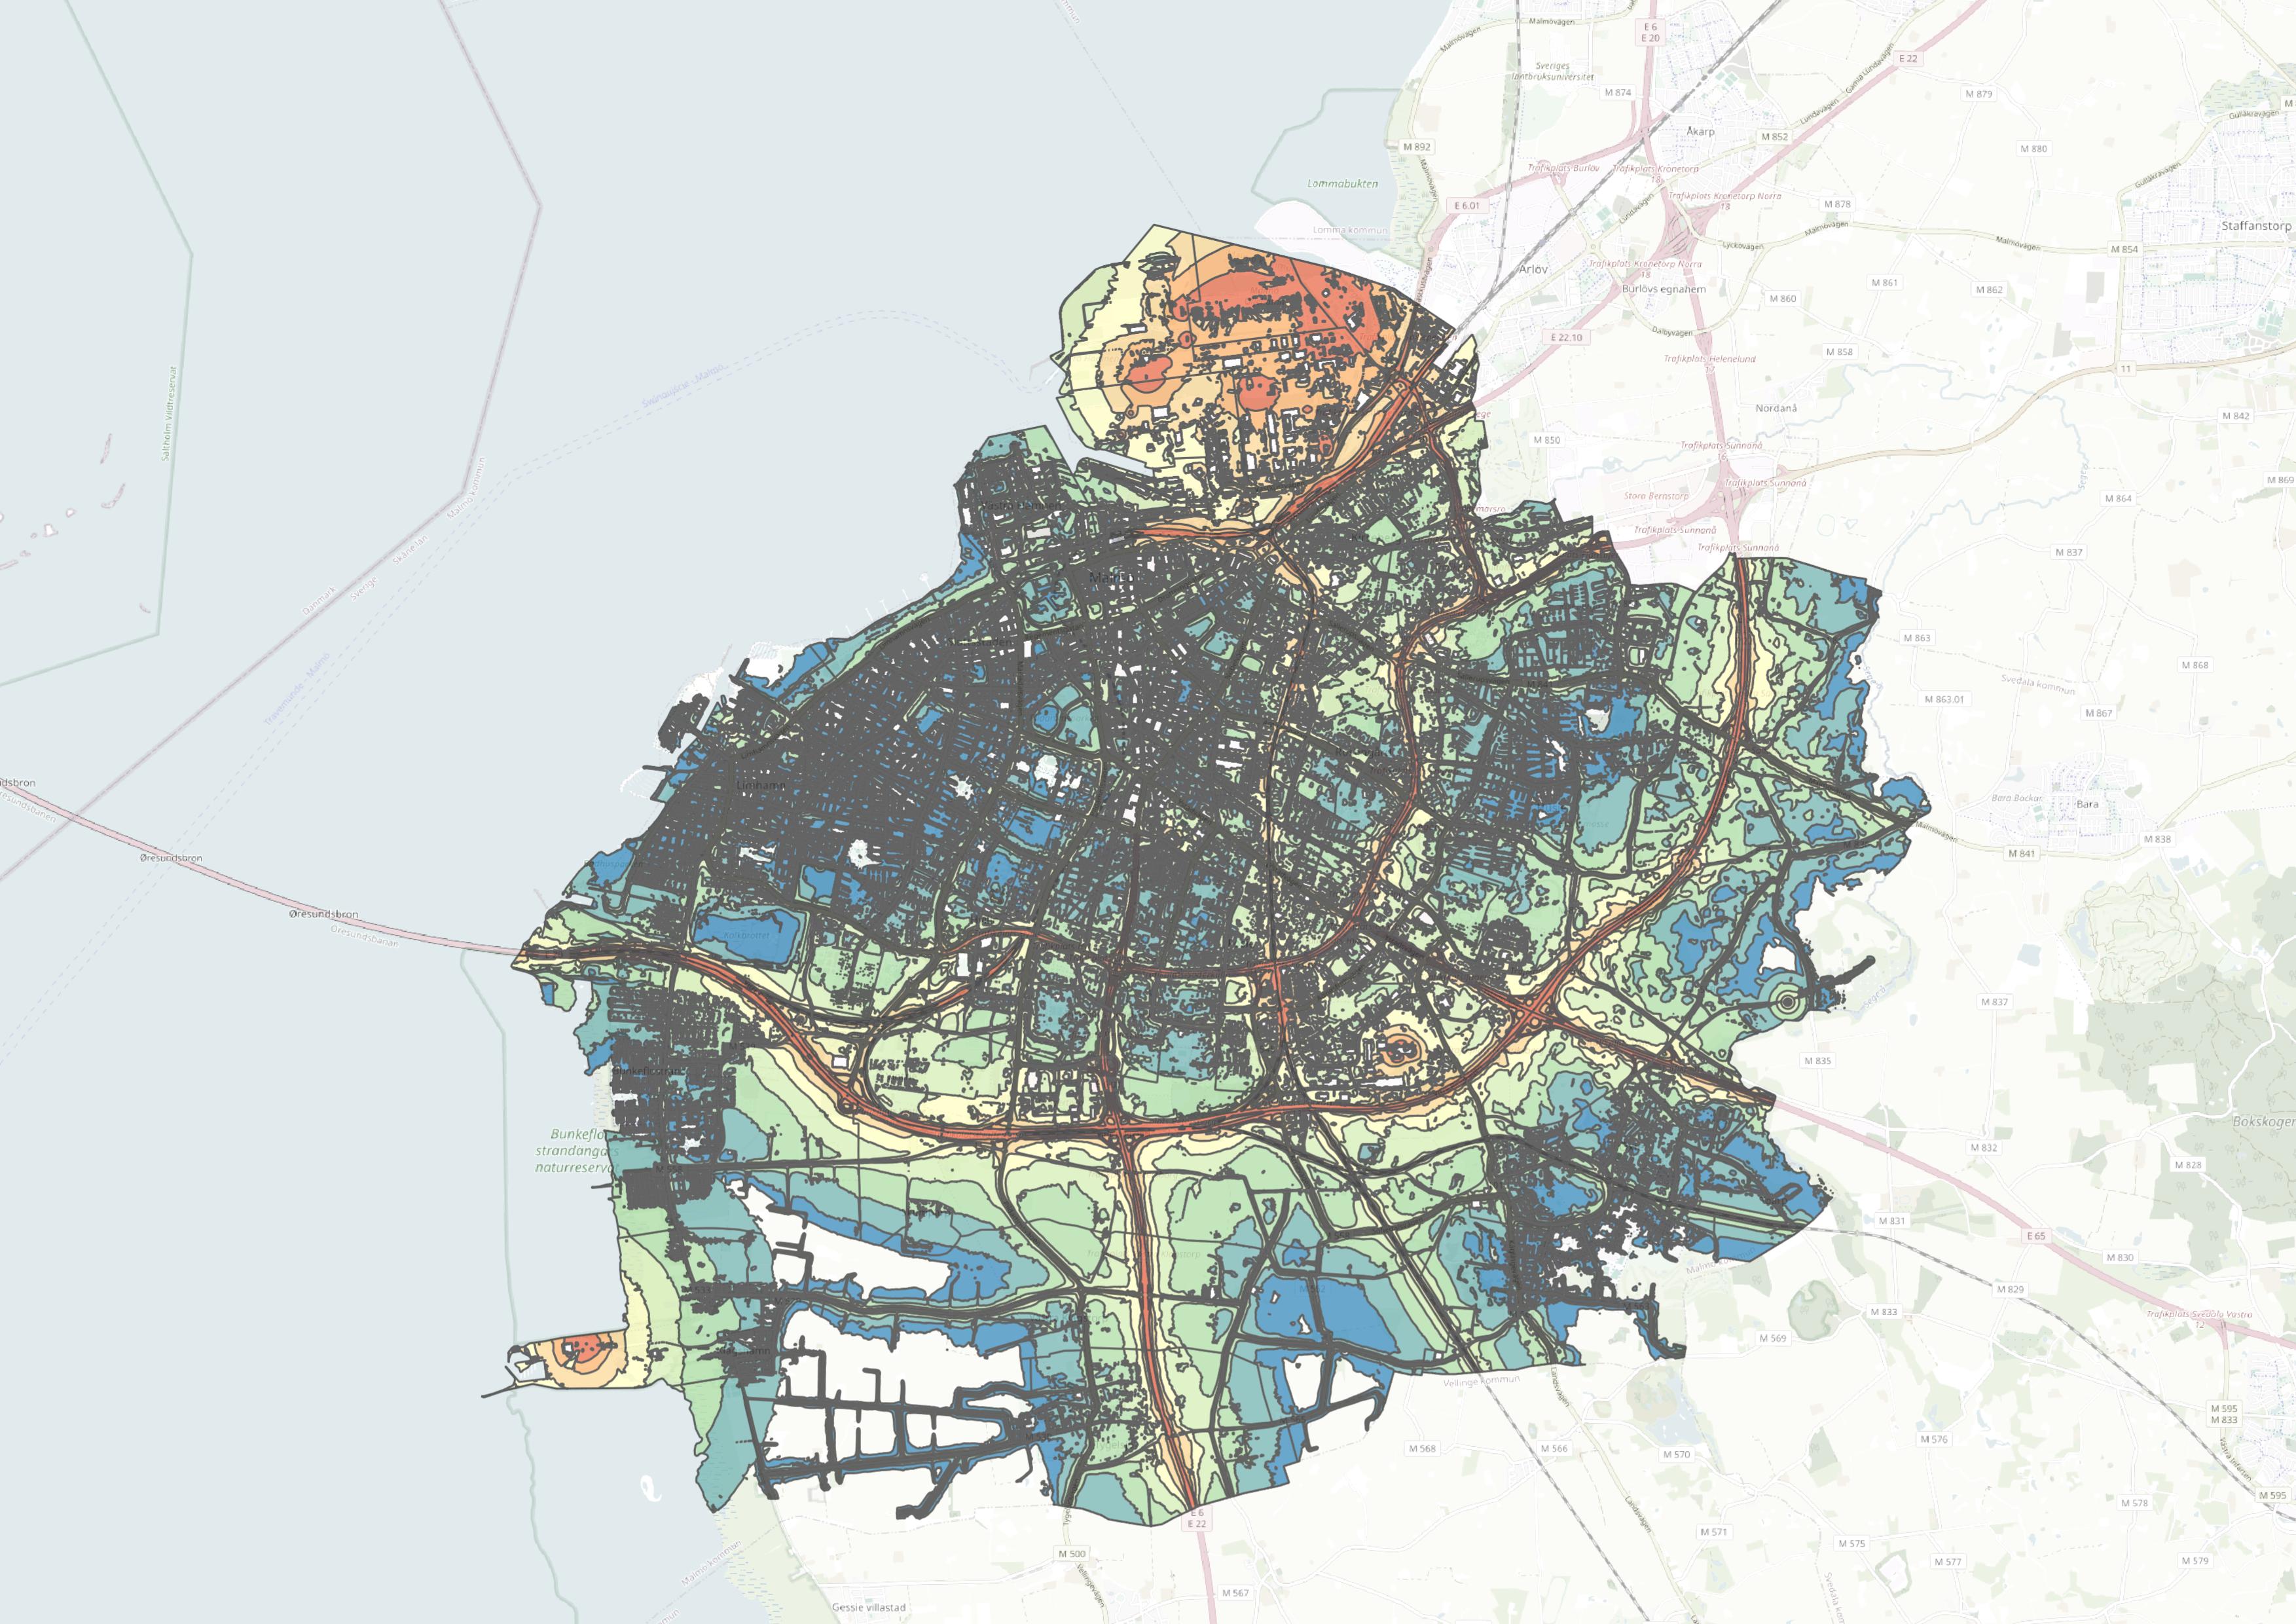
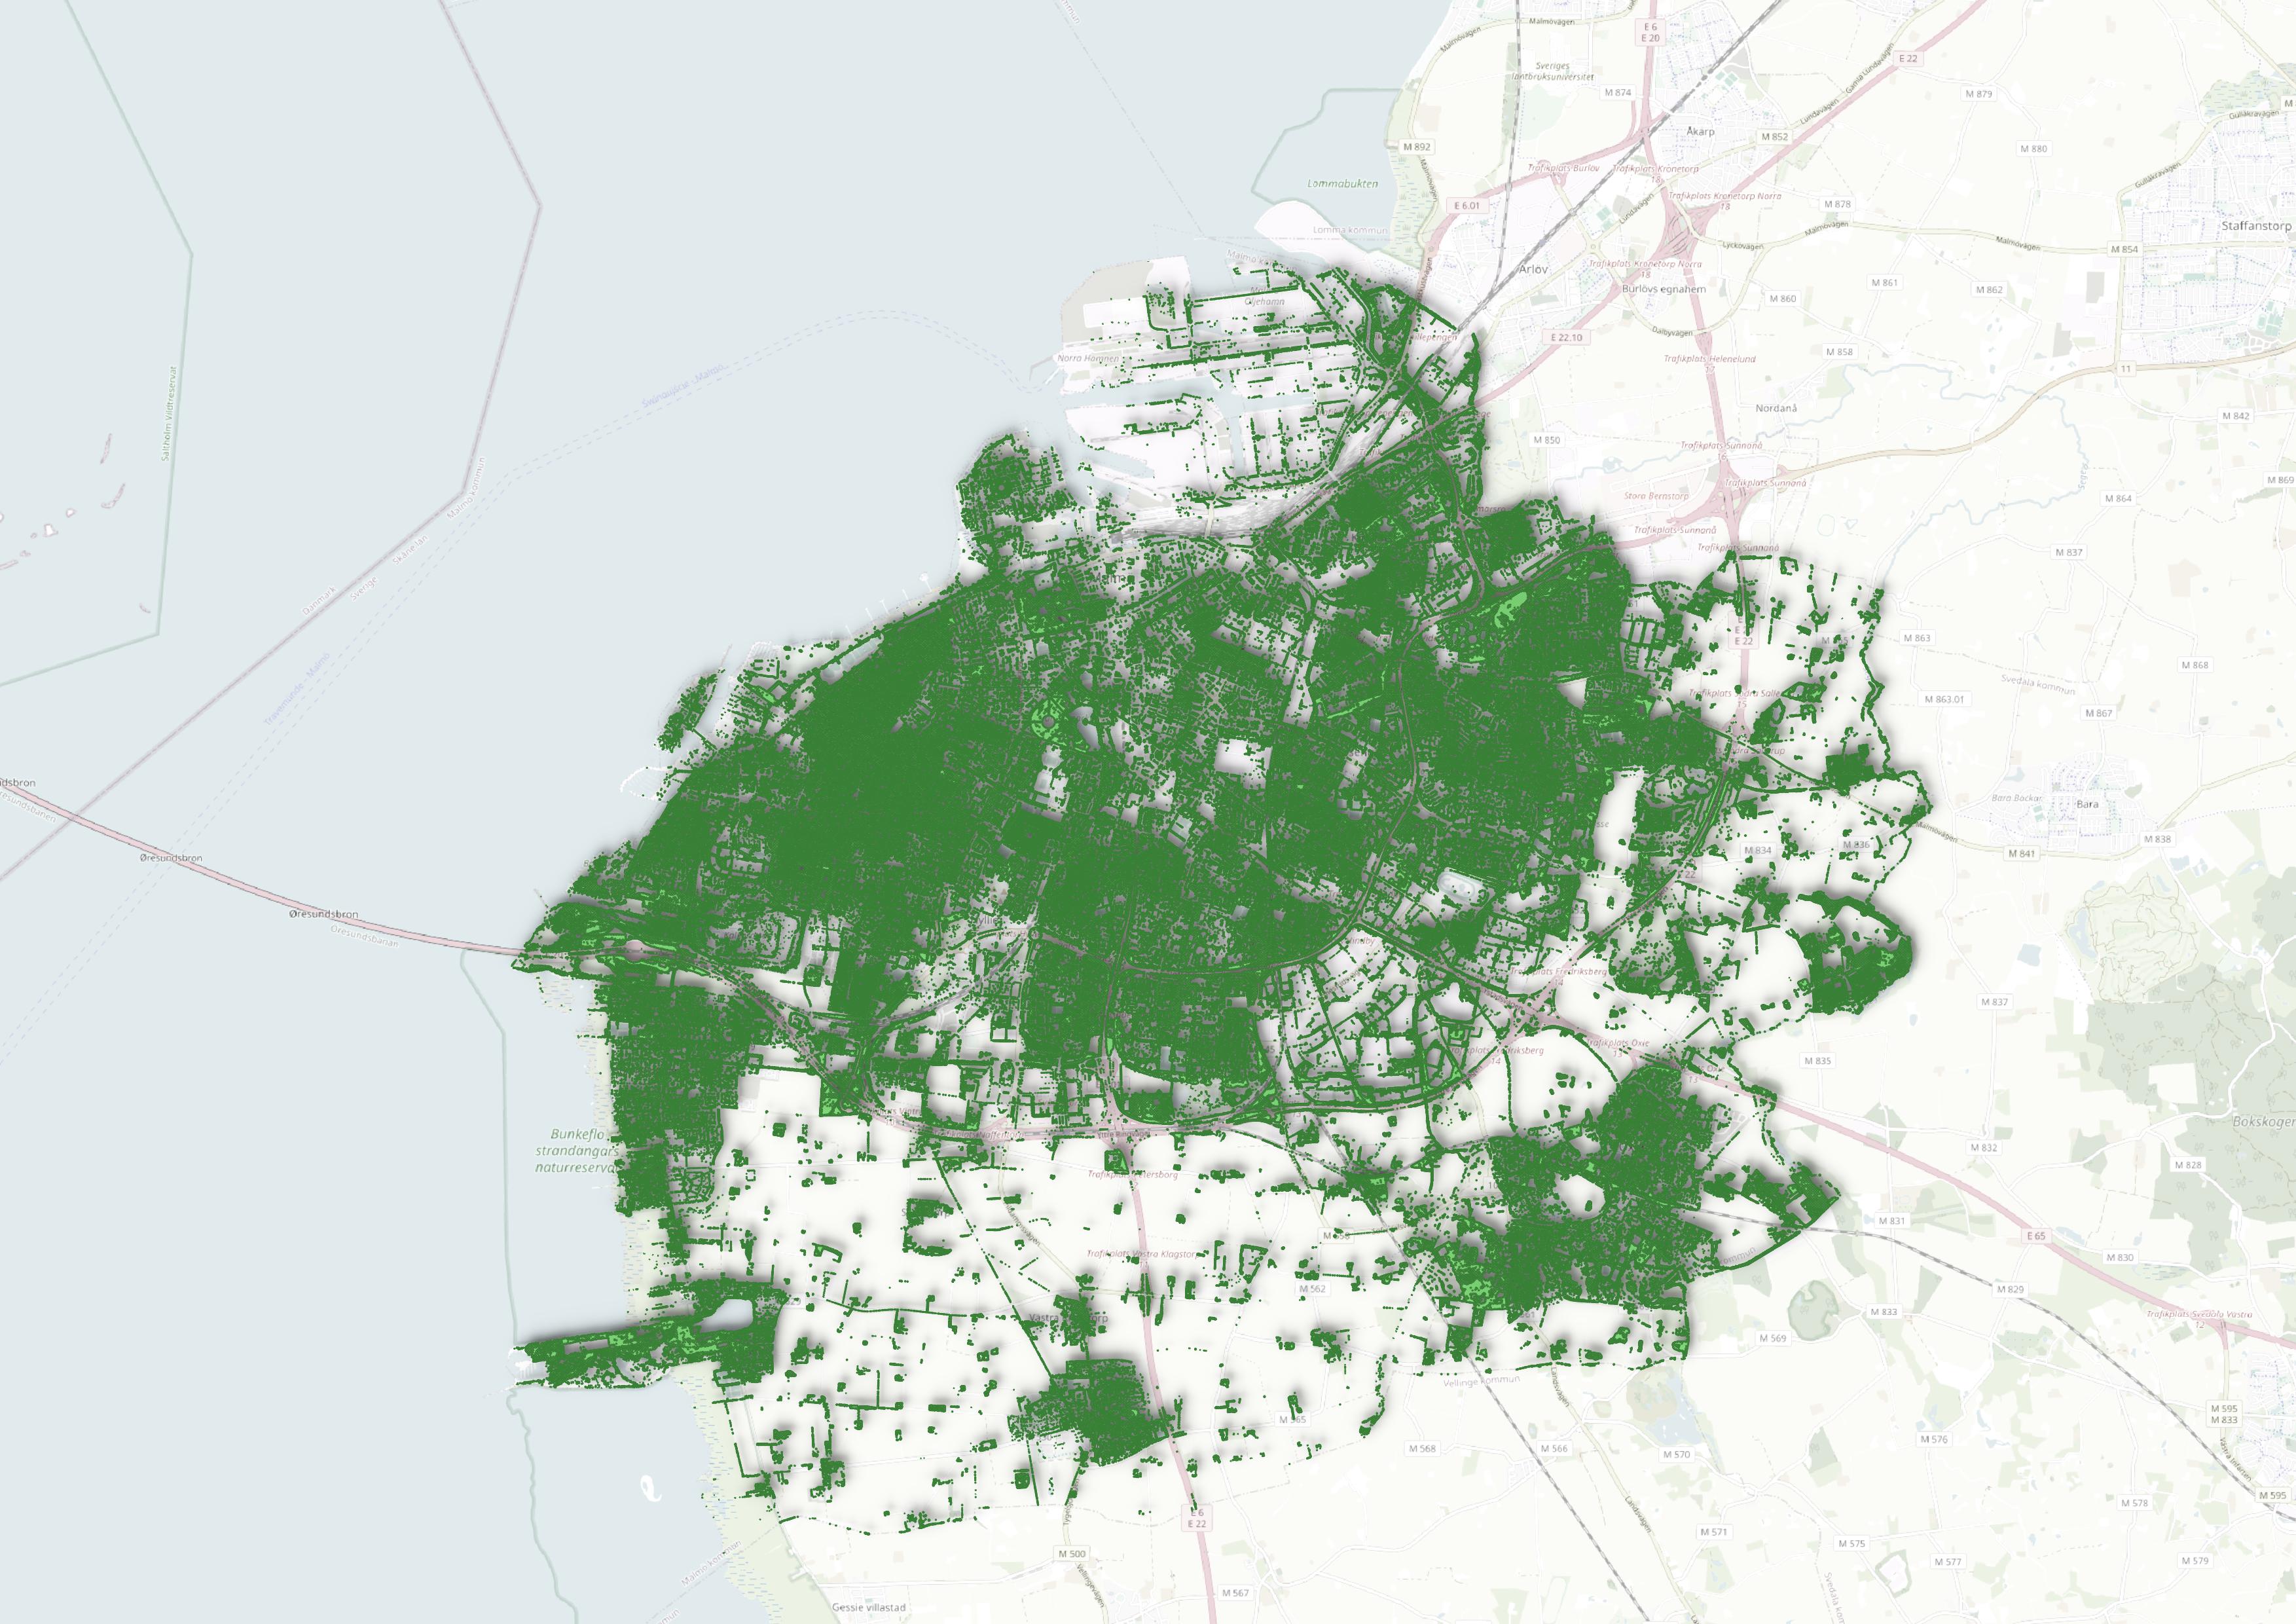
Figure A2. An example of the data used in the studies: noise pollution data from Malmö, Sweden is shown on the left, while tree canopy coverage for the city is displayed on the right.
A2. Workshop series – aims and key findings
As part of the Yggdrasil project, three workshops were held with the participating cities. These workshops aimed to provide the project team with insights for the final report and to equip Nordic municipalities with the knowledge and tools required to implement the 3+30+300 principle effectively (see Table A1). The workshops were facilitated by Clara Lind (Trädkontoret) and Cecil Konijnendijk (Nature Based Solutions Institute), along with other team members. Each municipality was encouraged to have two representatives involved throughout the series, contributing to the project’s development and building networks with other participants. Members from the Yggdrasils external reference group were also invited and were represented at all the workshops.
Workshop | Date and time | Description |
Workshop 1 | 2024-09-27 Online 3 hours | Introduction and initial GIS analysis
|
Workshop 2 | 2024-11-08 In-person in Stockholm 6 hours | In-depth analysis and application
|
Workshop 3 | 2024-02-25 Online | Conclusion and ambassador creation
|
Table A1. Summary of the project workshop series.
Workshop 1
The first Yggdrasil workshop, held online in September 2024, brought together participating municipalities to discuss the 3+30+300 principle, the experiences of the municipalities with using the principle to date, and the initial GIS analysis. The Yggdrasil workshop series was also introduced. The municipalities were given a preview of the comprehensive GIS analyses that would be presented and discussed in greater detail during the second workshop. The agenda included an introduction to the project, the role of trees in urban planning, and breakout discussions on challenges, opportunities, and local adaptations of the principle.
Key findings
- GIS analysis and mapping: the cities appreciated the GIS maps, seeing them as useful communication tools. However, they highlighted the need for localised and finer-grained data for planning purposes. Some cities may need to combine this data with their own, and suggested integrating heatmaps or other tools to make the analysis more relevant to their specific contexts.
- Application in cities (some examples):
- Holbaek has already included the 3+30+300 principle in several of its strategies, such as biodiversity and climate planning, with a "bottom-up" approach.
- Malmo has adopted 3+30+300 politically and has integrated it into its comprehensive plan.
- Stavanger has begun using the principle in area-specific planning, especially to assess existing neighbourhoods for the 3 and 30 components. It's seen as a valuable tool to enhance the city’s Green Plan.
- Turku has not yet implemented the principle but sees potential, particularly in urban regeneration projects, like transforming former industrial areas into residential zones.
- Challenges and contextual adaptation:
- Participants from northern regions, such as Iceland and Bergen, noted that heat stress is not a pressing issue for them. Instead, they emphasised the need to address stormwater management and other climate impacts, making shading less of a priority.
- In denser urban areas, limited space and lack of long-term maintenance funding were cited as barriers to implementation. Many cities face difficulties balancing the protection of trees with development needs, especially in vulnerable areas.
- Communication and engagement: The principle was acknowledged as a powerful communication tool, especially with stakeholders like politicians, developers, and residents. Its simplicity makes it effective for raising awareness of the benefits of urban greenery, such as climate resilience and improved well-being.
- Socioeconomic considerations: While participants agreed that green spaces contribute to urban equity, they also noted that the correlation between vulnerable areas and green space availability isn't always straightforward. For example, in Visby in Sweden, the wealthier inner city has fewer green spaces but remains less vulnerable, demonstrating the complex interplay between cultural heritage, planning restrictions, and green infrastructure.
Conclusions
The workshop highlighted the importance of adapting the 3+30+300 principle to local conditions, such as different climate zones and urban densities across Nordic cities. The participants called for a toolbox of strategies that could be applied in various contexts, with emphasis on seasonal variations and the socio-economic impact of urban greening. While the principle is a good starting point for strategic planning, cities require more detailed guidance and support on how to implement it effectively in their unique environments. Future workshops will continue to refine these tools and approaches.
Workshop 2
The second workshop took place as a full-day event at the Ekologigruppen office in Stockholm. This workshop focused on in-depth analysis and strategic planning for implementing the 3+30+300 principle. Participants were provided with insights from the project for applying the principle while considering the Nordic and their own specific context. The day combined practical insights with theoretical knowledge, allowing participants to explore and discuss real-world applications of the principle in their own municipalities. Presentations on a GIS deep dive, relations between urban forests and human health, suggestions for strategic principle implementation, and research that has been using the 3+30+300 principle to study health benefits offered inspiration. During the interactive group activity, each municipality analysed maps showing their scores for the 3+30+300 principle, maps that identified possible priority areas expanding the local tree canopy cover, as well as heat stress maps. Most cities found some of their scores surprising, especially where they scored lower than expected. This mapping exercise provided a solid foundation for further analysis and strategic planning.
Key findings
- Caution in public sharing without proper explanation
Although the maps were seen as excellent analysis and communication tools, municipal staff expressed hesitation about sharing these 3+30+300 maps with politicians and the public without robust supporting arguments. There was concern that low-scoring areas in red (and blue) could lead to misconceptions, as a low score does not necessarily mean that a specific area is a priority for green space improvements. City staff emphasised the need for clear communication and prioritisation criteria to help the public and stakeholders understand why certain areas may or may not be prioritised for greening efforts. - Economic justifications for investment in urban trees
Participants requested economic arguments to support the 3+30+300 principle, highlighting the need for a stronger financial case for investing in urban trees and green infrastructure. Economic data could strengthen the case for tree planting and tree conservation initiatives and help cities secure funding and political support. - Alternative green solutions
Given space constraints in urban environments, there was interest in exploring whether shrubs, perennial plants, green walls, green roofs, and other types of vegetation could be considered within the 3+30+300 framework, especially in areas where growing full-sized trees is challenging. This reflects a desire to maximise green cover through flexible solutions when traditional tree planting is not feasible. - Guidelines for the use of native and exotic species
Municipalities expressed the need for clearer guidelines regarding use of native versus exotic species. A consistent framework could help cities make informed decisions about plant selection, promoting biodiversity and ecological resilience across different Nordic regions. The share of native species could differ, for example, according to type of green space (e.g., higher in parks and forested areas than in street tree plantings). - Defining high-quality green spaces
A key discussion point was how to define what is meant with a "high-quality" green space (for the 300-component). There was consensus that each city should have the flexibility to define this based on its unique context, considering factors like usability, safety, ecological value, and accessibility. For some cities, a high-quality green space may simply be one that is actively used by the public, even if it is small or non-traditional.
- Challenges in high-density areas and development zones
Participants noted the challenges of creating larger green spaces in high-density or heavily developed areas. There was consensus on the importance of preserving existing green spaces in these zones to maintain high scores and ensure that urban expansion does not erode green coverage. Cities emphasised the need to balance green space preservation with other land use needs, such as housing and parking. - Integration with mobility and transit
The role of green spaces along mobility corridors, such as pedestrian and cycle lanes, which allows residents to benefit from greenery during their daily commutes, was highlighted. Future work that links implementation of the 3+30+300 principle with mobility corridors was suggested. - Encouraging innovation and persistence
An overarching message was the importance of challenging constraints and not accepting “no” as the final answer. Cities agreed that with creative thinking and perseverance, there are always ways to incorporate green solutions, even areas and spaces that are challenging for trees and parks.
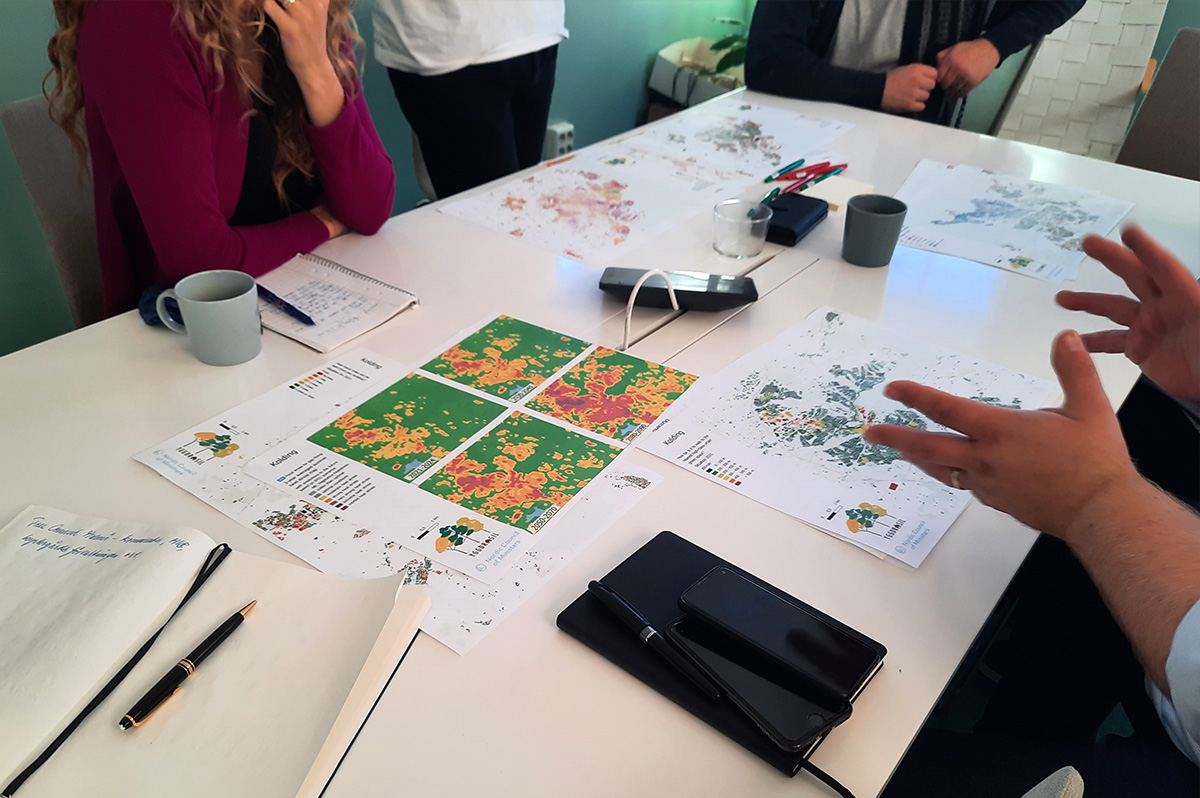
Photo 23. Interactive group-activity during workshop 2 (photo by Cecil Konijnendijk).
Conclusions
The workshop provided a platform for Nordic municipalities to gain insights into their own green space distributions and to understand the broader implications of the 3+30+300 principle. The discussions underscored a strong commitment to enhancing urban green spaces but also highlighted key challenges, such as the need for economic justifications, flexible and context-dependent green solutions, and clearer guidelines on species selection. While each city operates within unique constraints, there was a shared recognition of the importance of adapting the 3+30+300 framework to local contexts.
Going forward, cities are encouraged to use the 3+30+300 analysis and maps as starting points for deeper analysis and strategic planning, rather than seeing them as proposing definitive solutions. Several city staff mentioned that they have plans to enhance their use of the principle. The workshop emphasised that improving urban green coverage requires not only innovative thinking but also careful communication with stakeholders to ensure that green initiatives are well understood and supported.
In summary, the workshop successfully established a foundation for further collaboration and analysis among Nordic cities, setting the stage for practical implementation of the 3+30+300 principle to support balancing ecological, economic, and social needs.
Workshop 3 – to take place after project conclusion
The third workshop was to be held in February 2025 (after project conclusion) and would concentrate on the results from all analyses and activities throughout the project, highlighting key findings. Focus would be on the 3+30+300 handbook that will be finalised in January 2025 and sent out to the workshop attendees beforehand. Group discussions were to be held on how municipalities can act as ambassadors for the 3+30+300 principle, focusing on strategies for promoting awareness and best practices. Participants would also be engaged in an interactive session to create action plans for ongoing support from the established network and advocacy for the 3+30+300 principle in the Nordic region (creation of an ambassador network).