Photo 12. Park in Copenhagen, Denmark (photo by Jonas Schöne/Unsplash).
3. GIS-analysis of 3+30+300 status in Nordic cities
Methodology
For the first time, the 3+30+300 principle has been calculated and assessed for the entire Nordic Region. The following input datasets have been used for this work:
- Buildings: The Overture Global Building dataset (Version July 2024),
- Tree Canopy Cover: European Space Agency (ESA) World Cover Map 2021
- Roads: OpenStreetMap
- Parks: A mix of OpenStreetMap and ESA World Map 2021
- Administrative areas for aggregations: Global Administrative Map
To calculate the 3-component within the principle: We buffer each building with a 25-metre buffer (halo buffer). Then we count the number of canopy pixels from the ESA Land Cover Map intersecting the buffer. Each pixel of 10x10m represents one significant tree. The result is stored as an integer number, depicting the number of significant trees surrounding the building.
The 25-metre distance has been chosen based on research at what distance individual leaves are still visible. With average eyesight, if you move beyond 25 metres away from a tree, the vegetation starts to become a green blur. Around 25 metres and less, you see the individual leaves rattling in the wind, you notice the fractal structures the vegetation is built up from. This enhances the mental and physical distress. Obviously, this choice can be debated, as viewing trees at a larger distance can also be beneficial.
To calculate the 30-component: We buffer each building with a 500-metre buffer. We count the number of land pixels within the buffer, and we count the number of canopy pixels within the buffer. The canopy cover is then calculated as xxx \frac{canopycoverarea}{Landcoverarea}\times100\% . The value is stored as a floating point number, depicting the canopy cover of the synthetic neighbourhood surrounding the building.
The 500-metre buffer has been chosen to represent an average neighbourhood. After running some tests with different distances, and in accordance with Prof. Konijnendijk, the choice was made that a 500-metre buffer best represents the daily basis liveable area of people, also in terms of walkability.
To calculate the 300-component: For the parks, a machine learning model is used to predict urban green spaces based on ESA Land Cover Map. We then subtract obvious non-parks based on OpenStreetMap (for instance, we remove airports and military compounds), and we add obvious parks from OpenStreetMap (digitised green spaces with a name containing ‘park’). This algorithm can be applied globally, making results comparable. The result of this step is a database with park polygons, describing the area of the parks.
For the roads we use the OpenStreetMap roads layer, and remote non-walkable roads from it (motorways, bus lanes, etc). It does contain small footpaths and tracks. For the park entrances we then overlay the OpenStreetMap roads layer with the parks. We mark the spots where the OpenStreetMap data enters a park as a Park Entry Point. To then assess the 300-rule (i.e. within a 300-metres walk), we calculate for each building, over the road, the distance to the nearest Park Entry Point. The distance is stored as a floating point value, depicting the walking distance to the nearest high class urban green space.
To calculate the overall score used for this analysis: The score is calculated by normalising the 3-, the 30- and the 300-component on a scale from 0 to 10. The turning point for each rule (so 3 trees for the 3-rule, the 30% for the 30-rule, etc) is set to a score of 6. Lower scores are scaled between 0 and 6, higher scores are scaled between 6 and 10.
We then take a weighted average based on the three scores. The weights are:
- The 3-component counts for 25% of the overall score
- The 30-component counts for 50% of the overall score
- The 300-component counts for 25% of the overall score
The result is a map with 22 million buildings for the whole Nordic Region (see Figure 7).
It is important to note that the overall score is not part of the actual 3+30+300-rule. It is provided as a helper layer to municipalities, to be able to combine all information into one map. It is also relevant to note that all maps in the document are north-oriented.
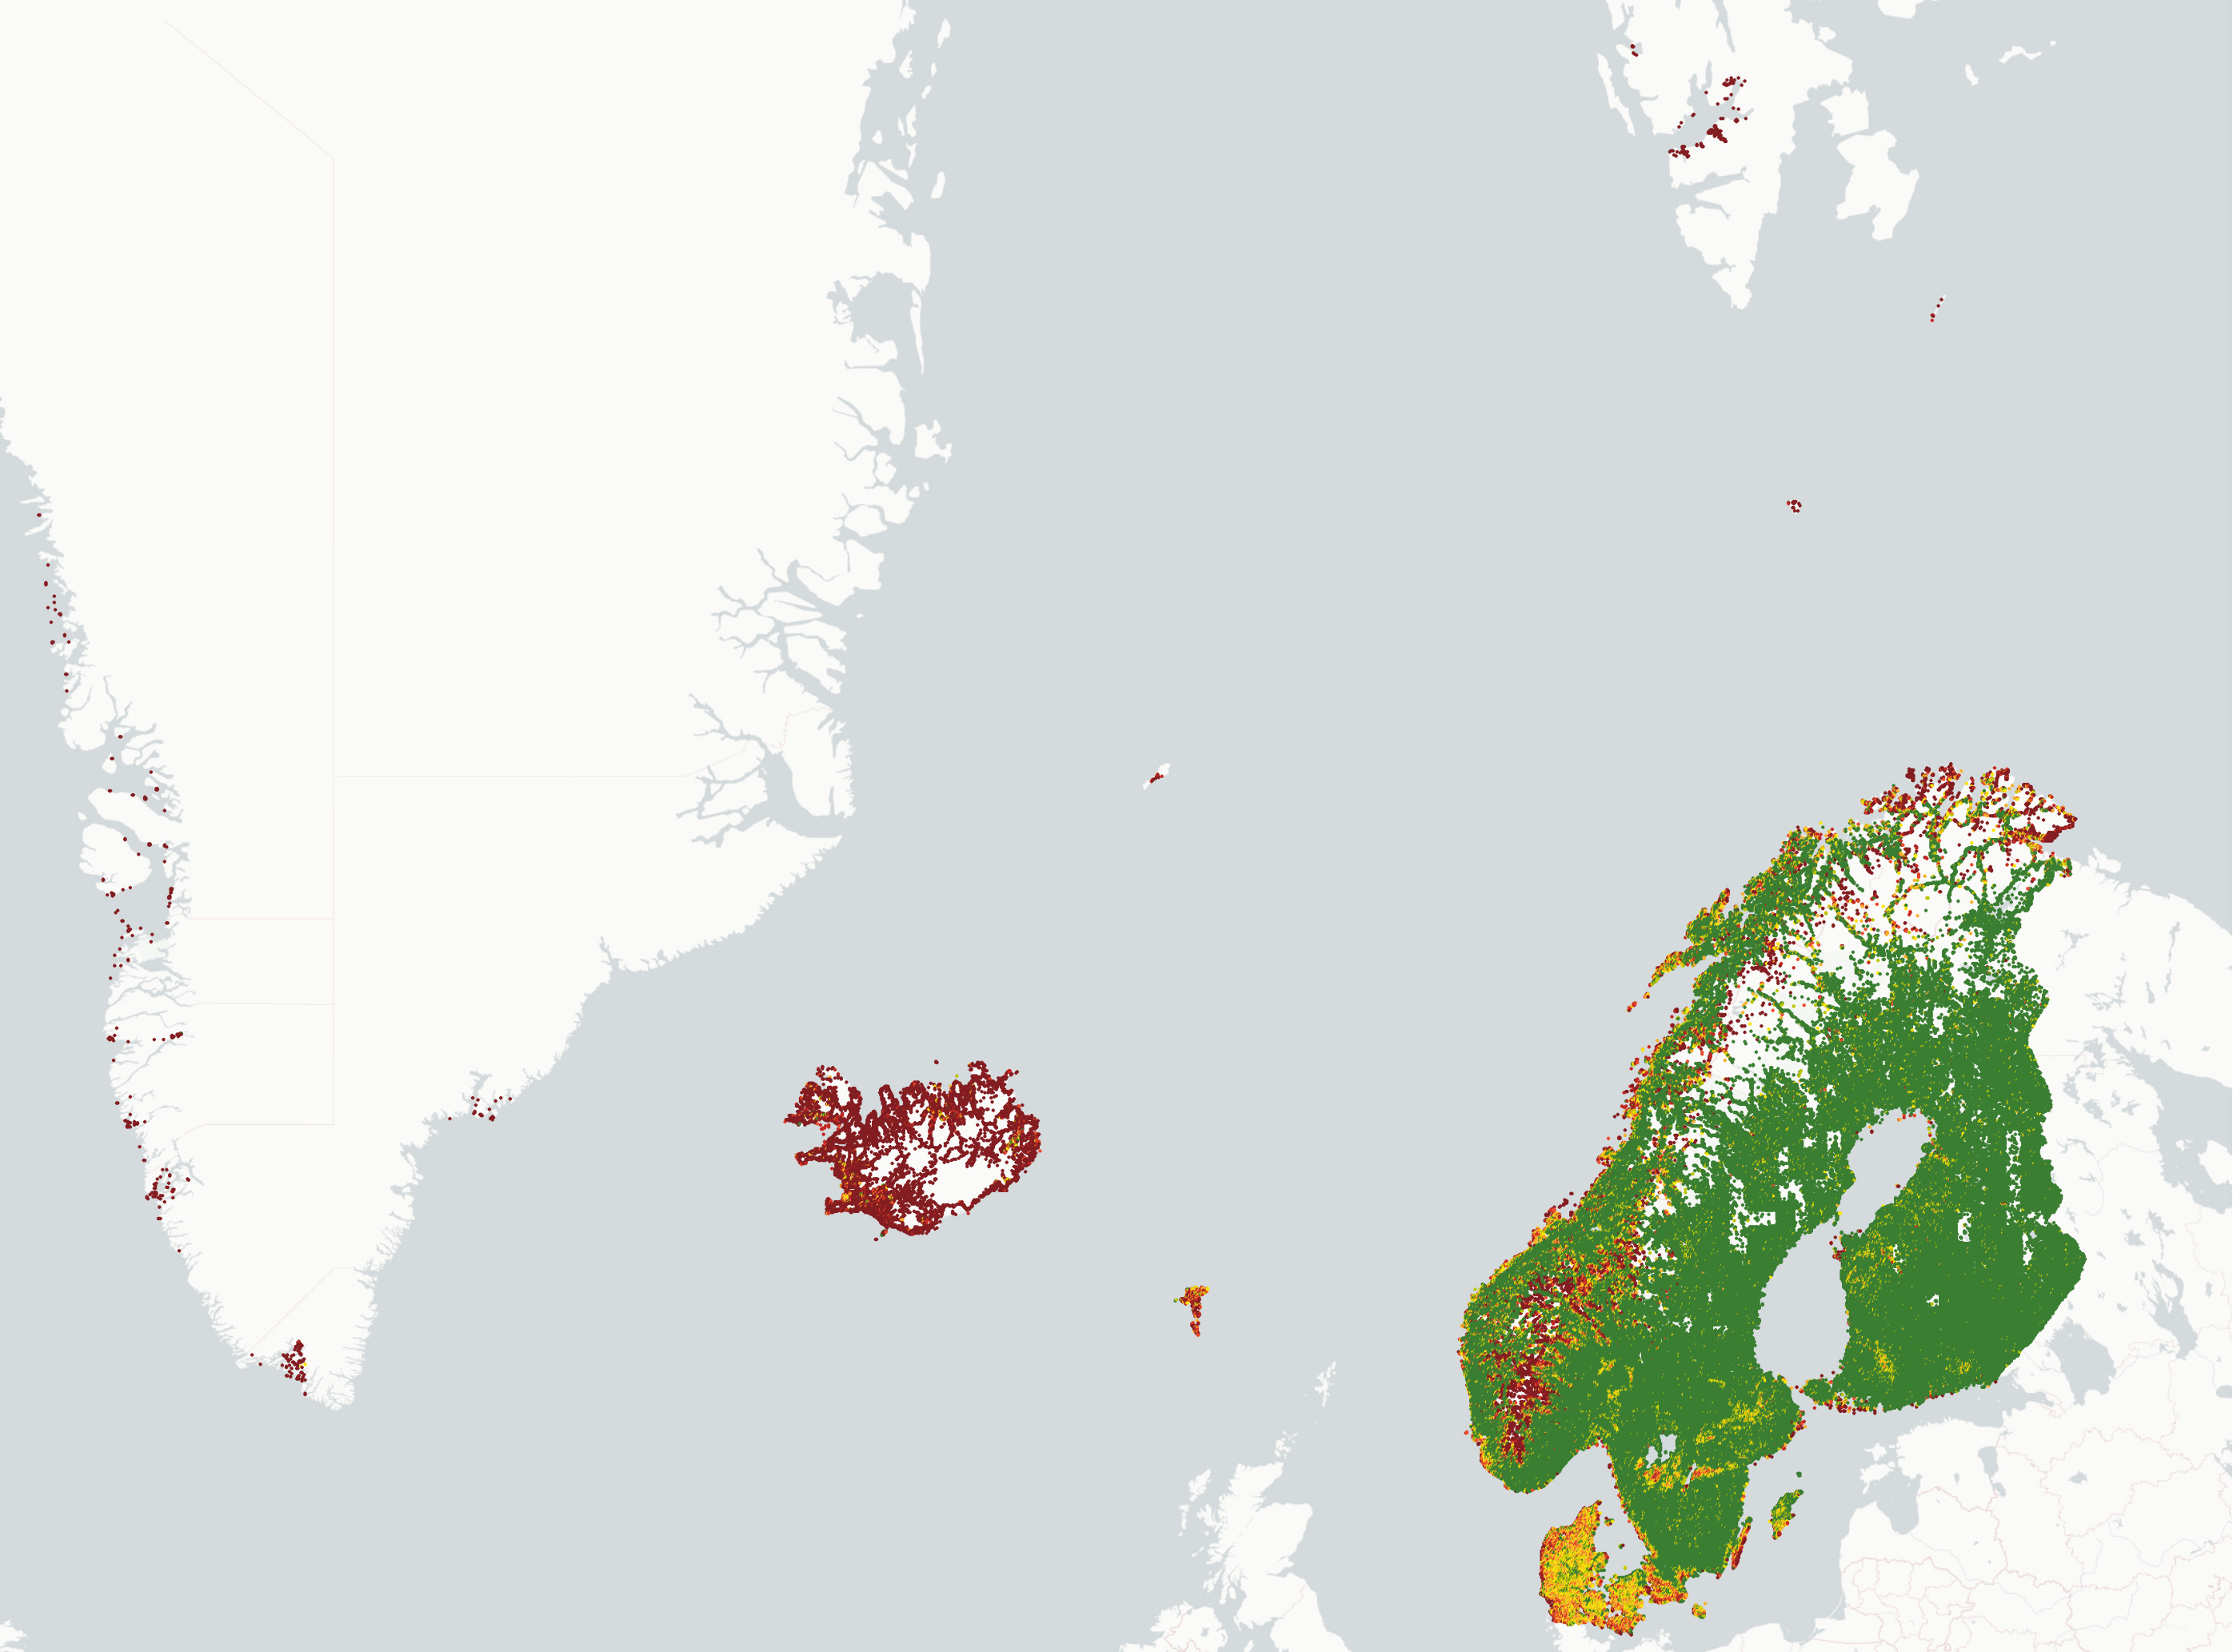
Figure 7. Overview map of 3+30+300 scores for the entire Nordic Region. Green shows 3+30+300 compliance, while red indicates areas where the principle is not met. The white area in the Nordics is free of buildings.
Nordic Cities current adherence to the 3+30+300 principle
When it comes to the amount of trees and green space, and meeting the 3+30+300 principle, the Nordic Region is a lovely region to live in. The average Nordic building scores an 8.4 out of 10 on the 3+30+300-rule. There are big differences between the specific regions though, ranging from 0.02% of the buildings reaching the 30% canopy cover goal in Greenland, up to 97.7% for the 300-rule in Finland (see Table 3).
Table 3. Overview of 3+30+300-principle scores for the Nordic countries. The percentages and averages refer to all buildings in every respective country. Scores are for all buildings in the respective countries, including cities and rural areas. Green space is defined in this context as a publicly accessible park or green space of at least 1 ha in size.
Country | Adherence of buildings reaching | Averages per building | ||||||
3-component (%) | 30-component (%) | 300-component (%) | Positive overall score (%) | All 3 rules at once (%) | n° of trees | Canopy cover (%) | Distance to green space (m) | |
Norway | 85.63 | 84.06 | 95.88 | 92.29 | 74.48 | 40.39 | 54.83 | 42.0 |
Denmark | 71.70 | 32.83 | 93.45 | 66.96 | 26.73 | 24.31 | 26.25 | 60.6 |
Sweden | 83.11 | 79.94 | 97.23 | 89.74 | 70.74 | 38.24 | 53.99 | 27.1 |
Åland | 86.48 | 92.48 | 51.40 | 88.02 | 43.89 | 40.96 | 60.25 | 329.9 |
Finland | 97.55 | 92.54 | 97.70 | 97.12 | 87.39 | 56.69 | 56.24 | 22.6 |
Faroe Islands | 73.67 | 18.56 | 80.75 | 51.74 | 17.17 | 28.47 | 16.23 | 140.2 |
Iceland | 39.26 | 4.08 | 51.52 | 23.50 | 3.57 | 11.00 | 7.93 | 327.7 |
Greenland | 1.46 | 0.02 | 2.73 | 0.10 | 0.01 | 0.18 | 0.43 | 632.2 |
Gap analysis to pinpoint areas with less than 30% canopy cover
Out of the 22,589,315 buildings in the Nordic Region, close to 6 million (5,859,386) do not reach the 30% goal. As such, they have a gap impacting 25.9% of the Nordic buildings. The gap is more apparent in the northwestern Nordic Region (Iceland, Svalbard, Jan Mayen, Greenland), but even in the “green countries” you can observe gaps. This happens mostly in the centre of urban settlements and in harbours and industrial areas. See Figure 8 as an example of this for Bergen in Norway.
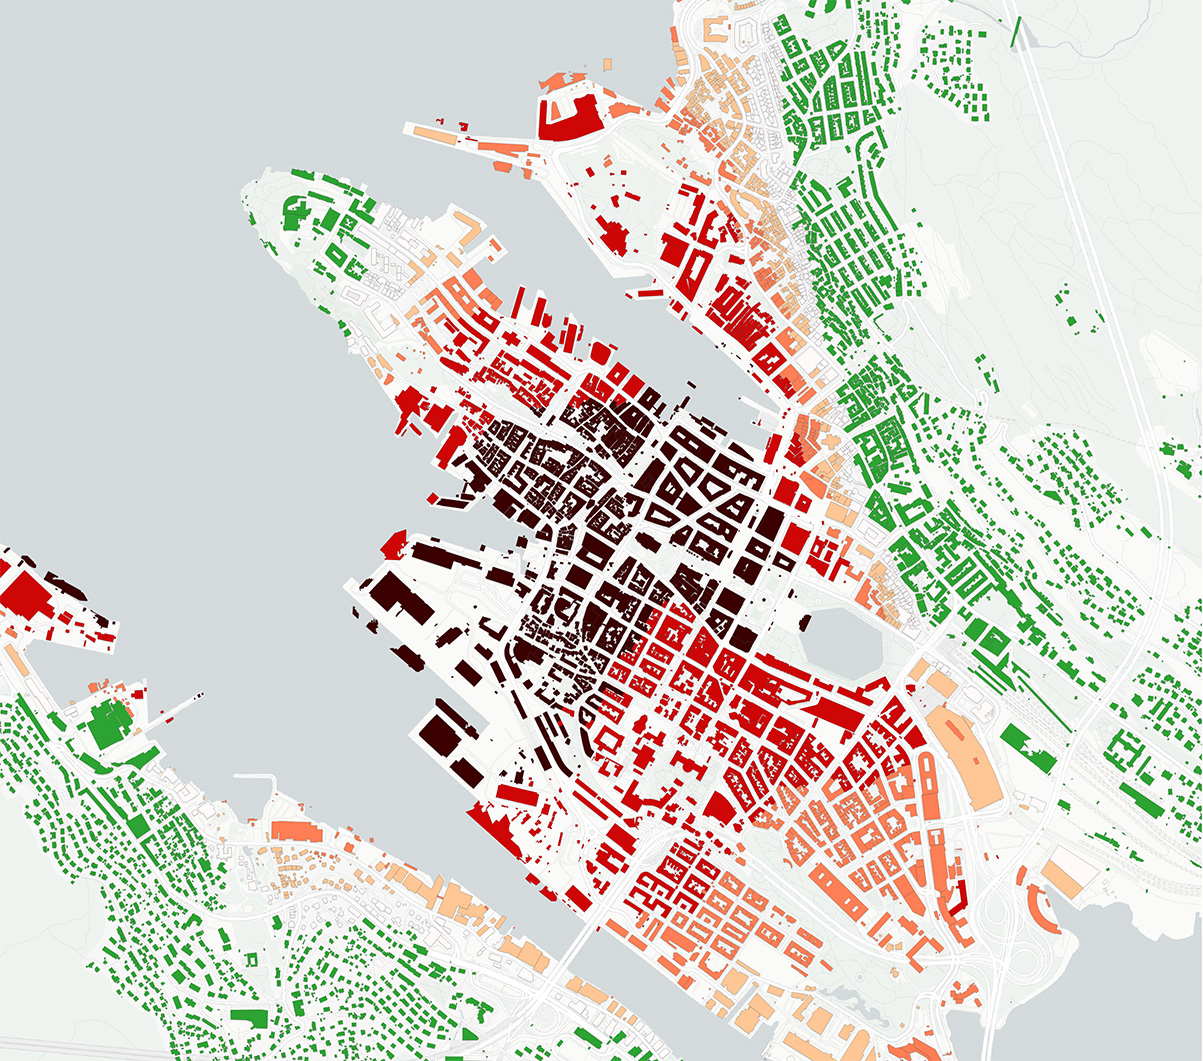
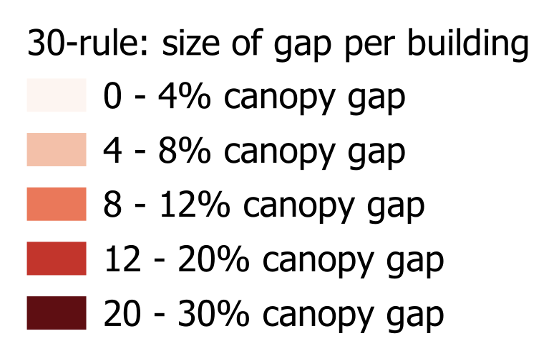
Figure 8. Gap analysis of Bergen, Norway. Green buildings adhere to the 30-rule, red buildings do not (ranging from a 0% gap up to a 30% gap). Spatial patterns immediately become visible.
Figures 8 through 26 show 3+30+300 scores as well as gap analysis specifically for the 30% canopy component of the principle for the municipalities participating in the Yggdrasil project. The 3+30+300 maps easily indicate neighbourhoods and other areas (for example, industrial areas and business parks) where there is an absence or lack of trees and public green space. This type of analysis can assist with making policy and planning decisions, e.g., on which areas to prioritise for improving tree visibility, expanding local tree cover, and providing better access to high-quality public green space. In this case focus is on the 30-component, as research suggests that this component is of particular importance to both cooling and public health promotion, but similar analyses could be carried out for the other two components and the principle as a whole.
Addressing the identified gaps can obviously imply planting more trees. To be most effective, it is good practice to focus on the areas with a big gap (far below 30%) and where many buildings with a big gap group together. The combination implies that you can catch many birds with one stone by planting some trees there. For a schematic representation of this, see Table 4.
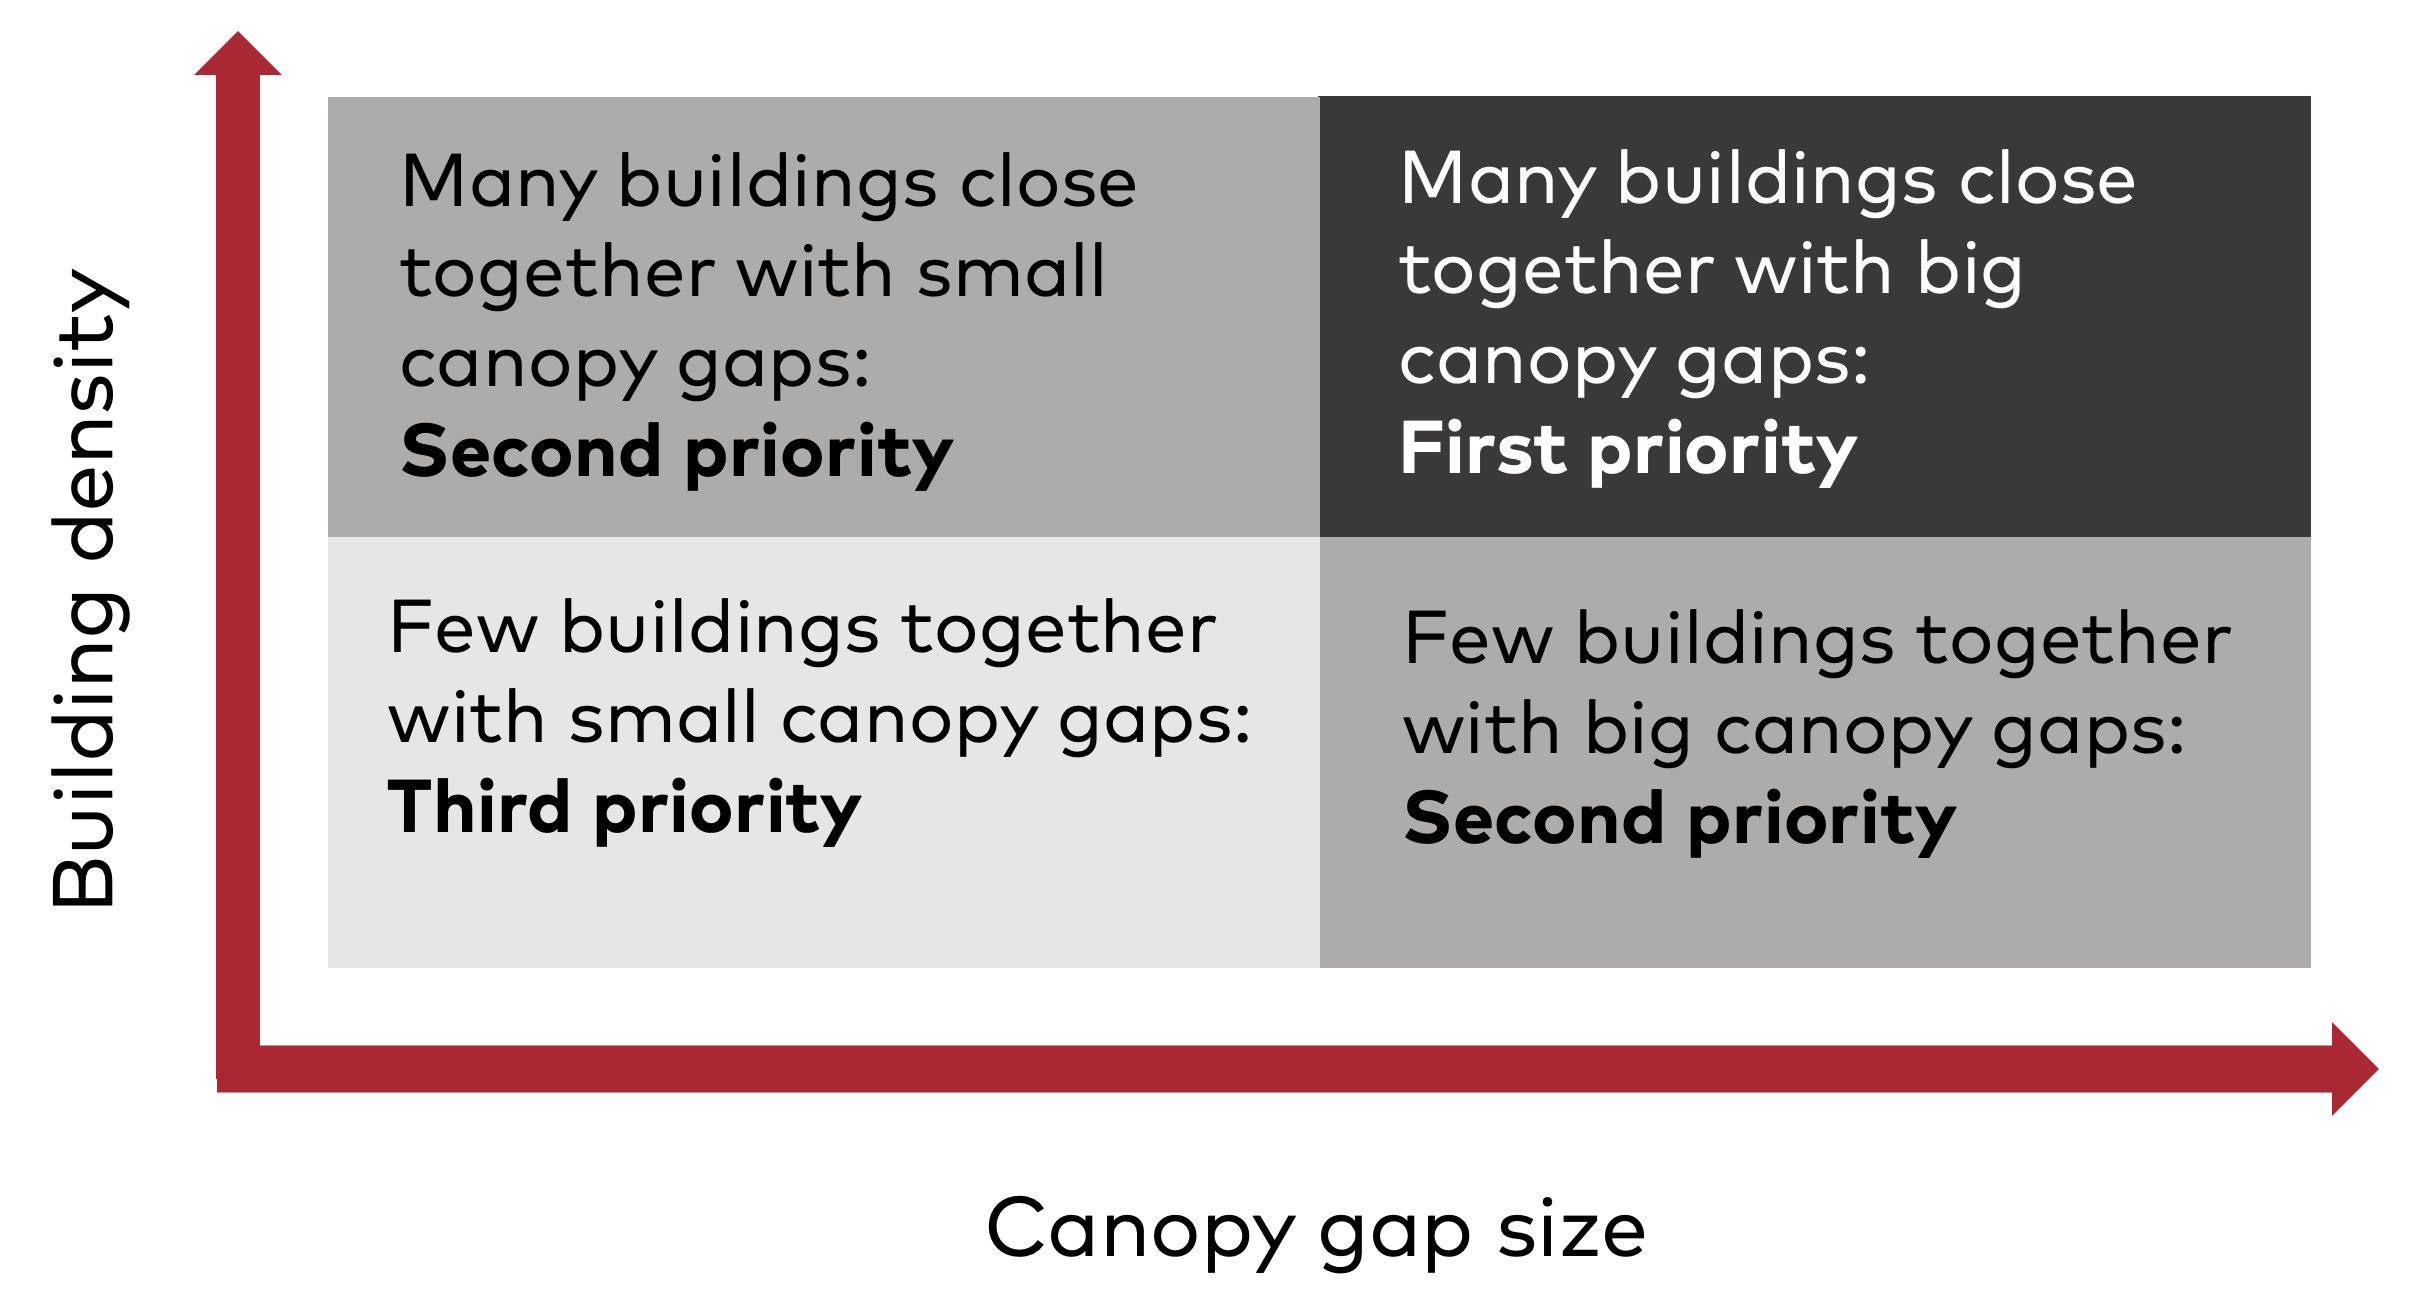
Table 4. Schematic overview of different tree planting scenarios and priorities.
In the 30-component gap analysis through GIS, we can identify those areas with many buildings together, having a big canopy cover gap. These are marked in blue in the gap analysis maps for the different Nordic municipalities. See Figure 9 as an example of a gap-analysis for Bergen in Norway. Not surprisingly, often these priority areas are found in dense (and historical) city centres where it will be more difficult to find space for new trees. This is important, however, as these densely built centres often have a high population density and also face the heaviest consequences from the urban heat island effect and resulting health challenges.
The maps also show that residential areas outside of the centre, and especially the suburbs have good 3+30+300 scores. Here canopy cover is often higher than in the dense urban core.
The 3+30+300 principle is most relevant for built-up areas where communities live. It does not have the same impact in surrounding countryside or forested areas where building density is low. Here, other landscape qualities will play an important role (such as meadows and other types of agricultural landscapes, some of which can be diverse and have high cultural values, and residents often have good access to trees and nature.
The maps will also make it possible to e.g., compare different types of neighbourhoods and see how newer neighbourhoods are doing in comparison with older ones. Moreover, new developments and neighbourhoods that are to be redeveloped require special attention, ideally projecting 3+30+300 scores in the longer term as newly planted trees mature and obtain bigger sizes and canopies.
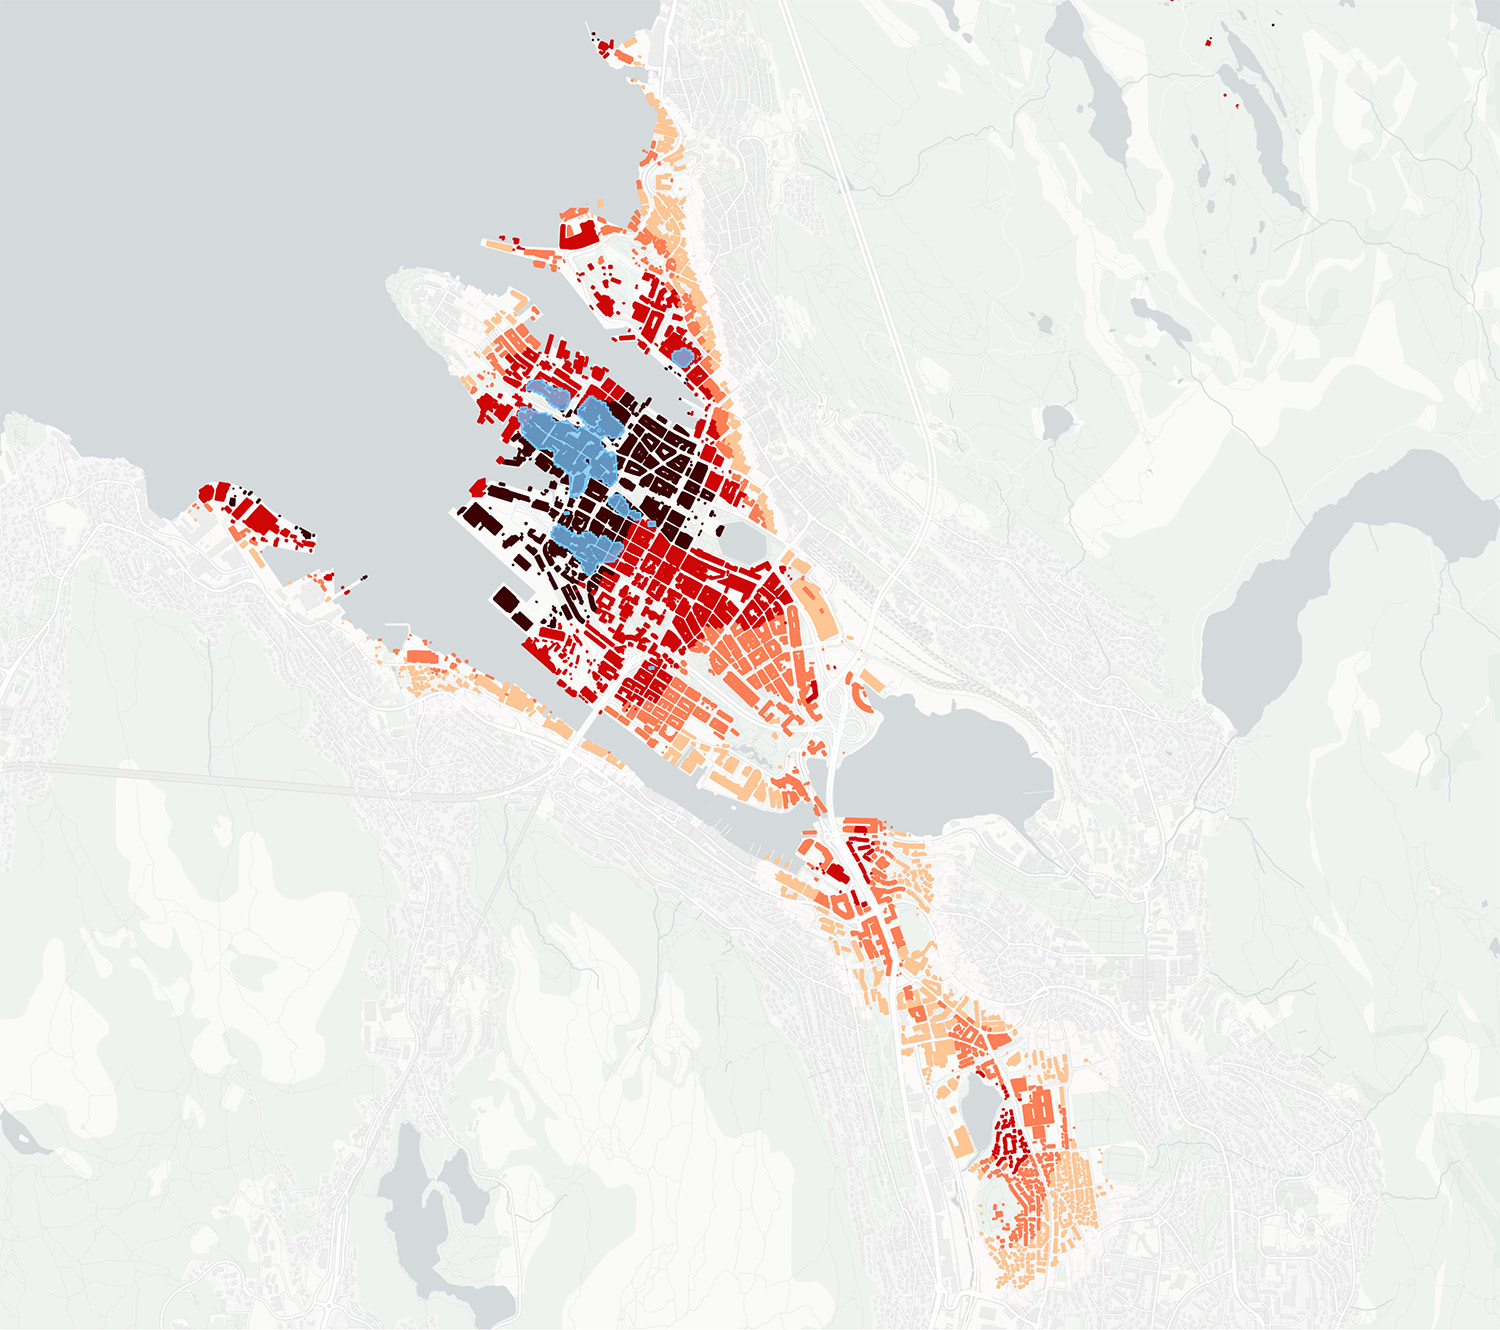
Figure 9. Focal areas for Bergen, Norway based on 30-component gap analysis. By planting trees in the blue areas, one will have a lot more impact than when planting elsewhere.
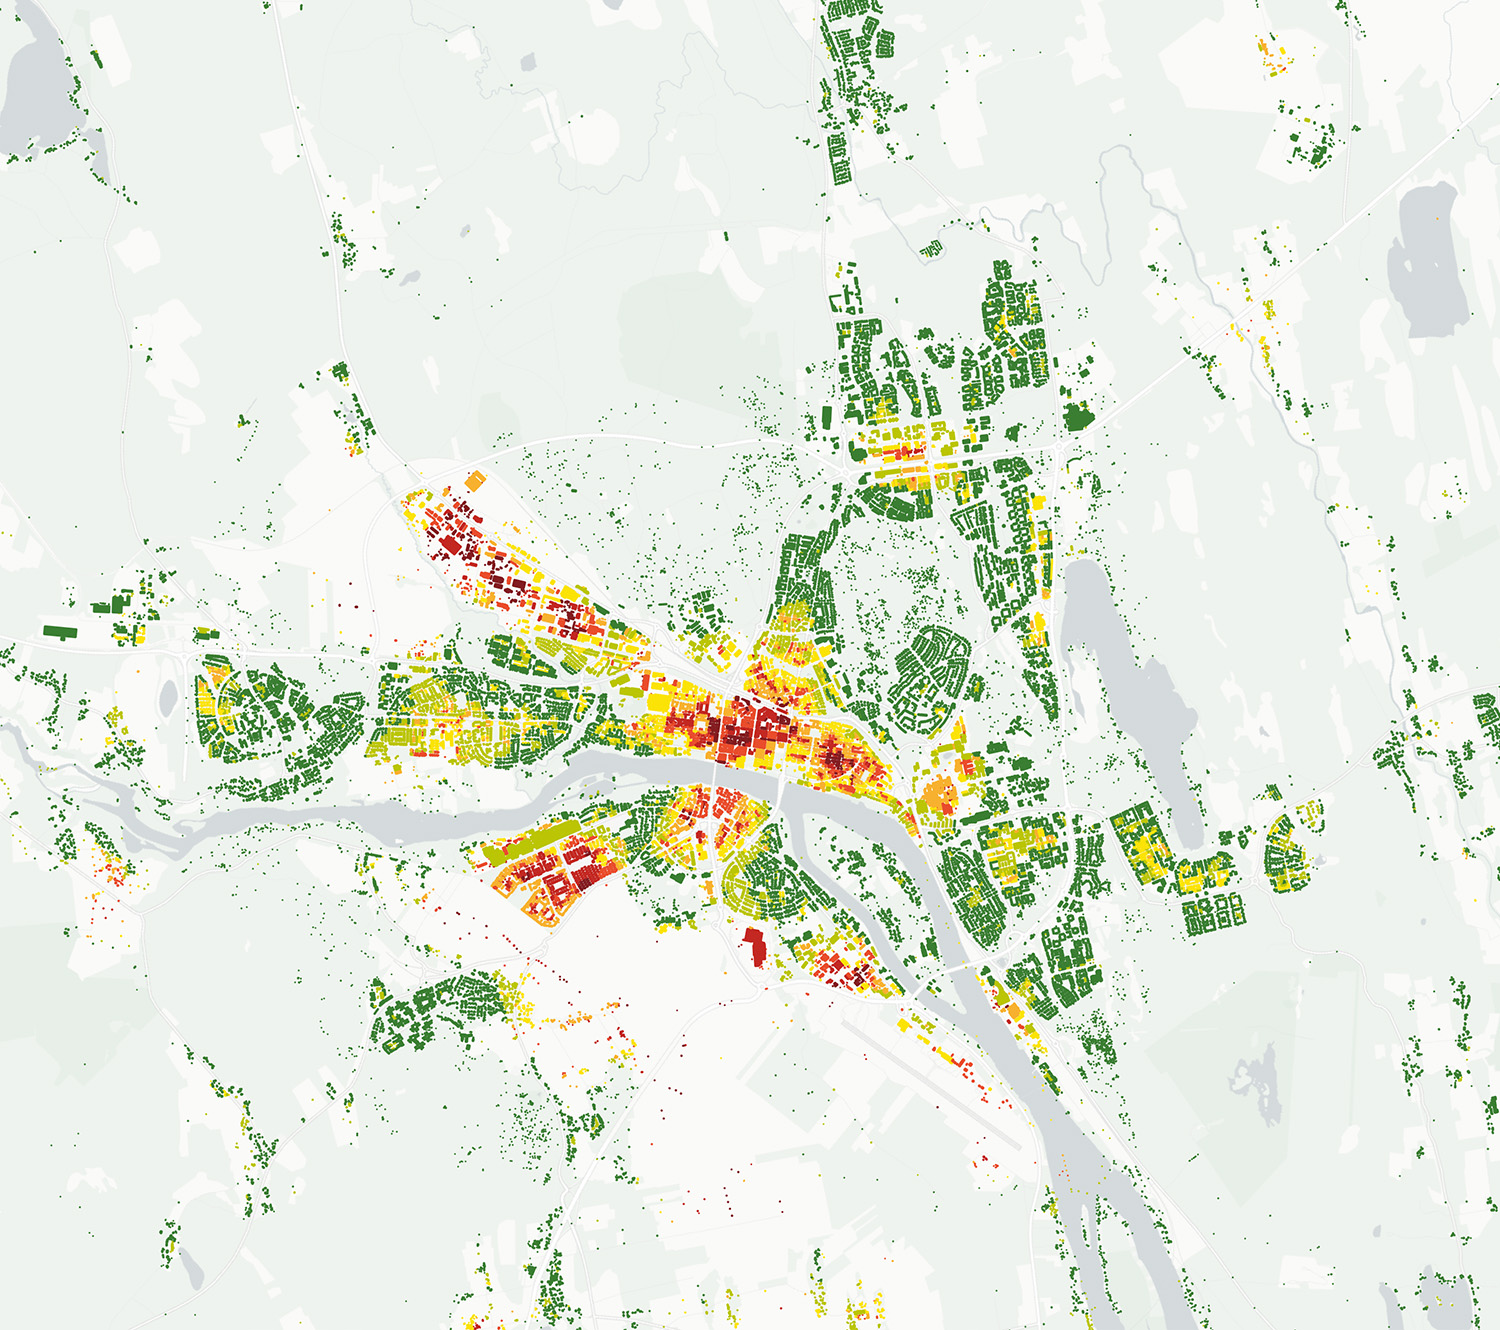
Figure 10. Overall 3+30+300 score for Umeå, Sweden. Yellow and green colours indicate buildings and areas with positive 3+30+300 scores, orange and red tones depict scores that are too low.
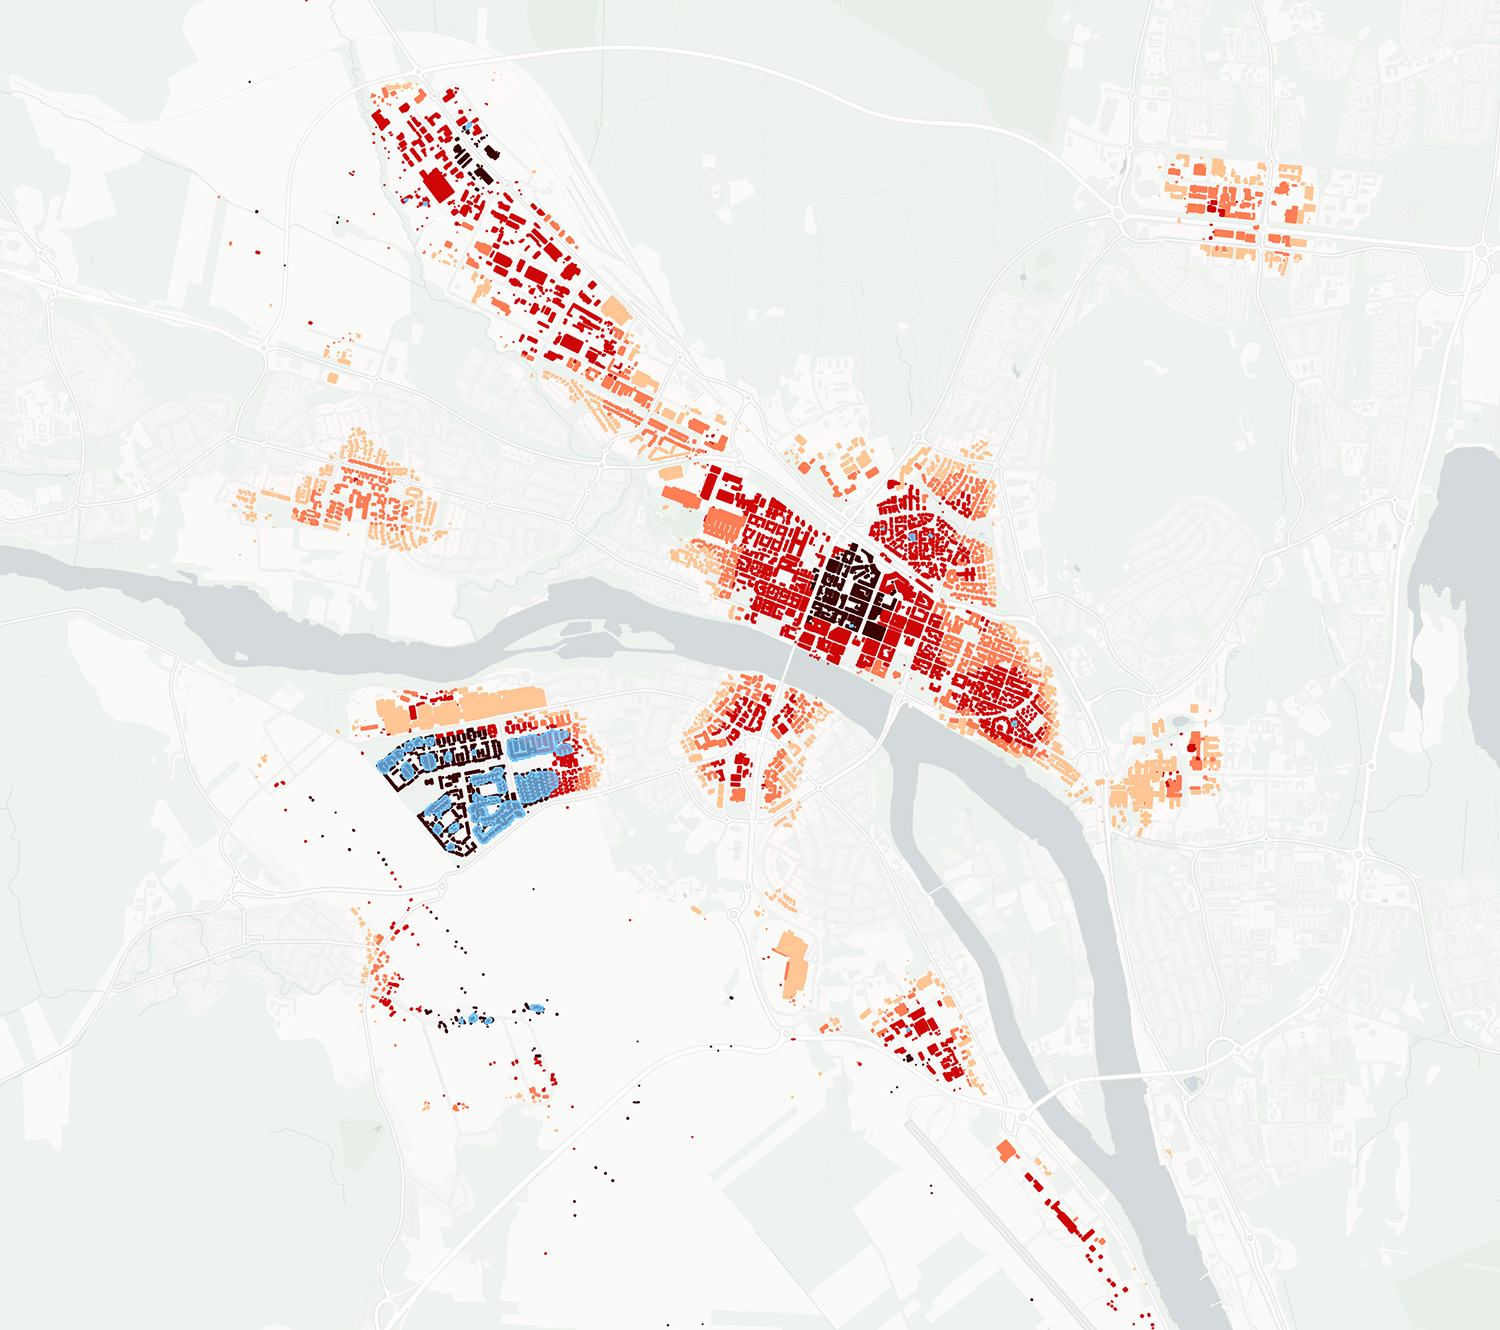
Figure 11. Gap analysis for Umeå, Sweden for the 30-component. Red buildings score too low and require attention. Blue areas depict the focus areas with the highest impact on gap fixing.
Figure 12. 3+30+300-rule overall score map for Kolding, Denmark. Yellow and green colours indicate buildings and areas with positive 3+30+300 scores, orange and red tones depict scores that are too low.
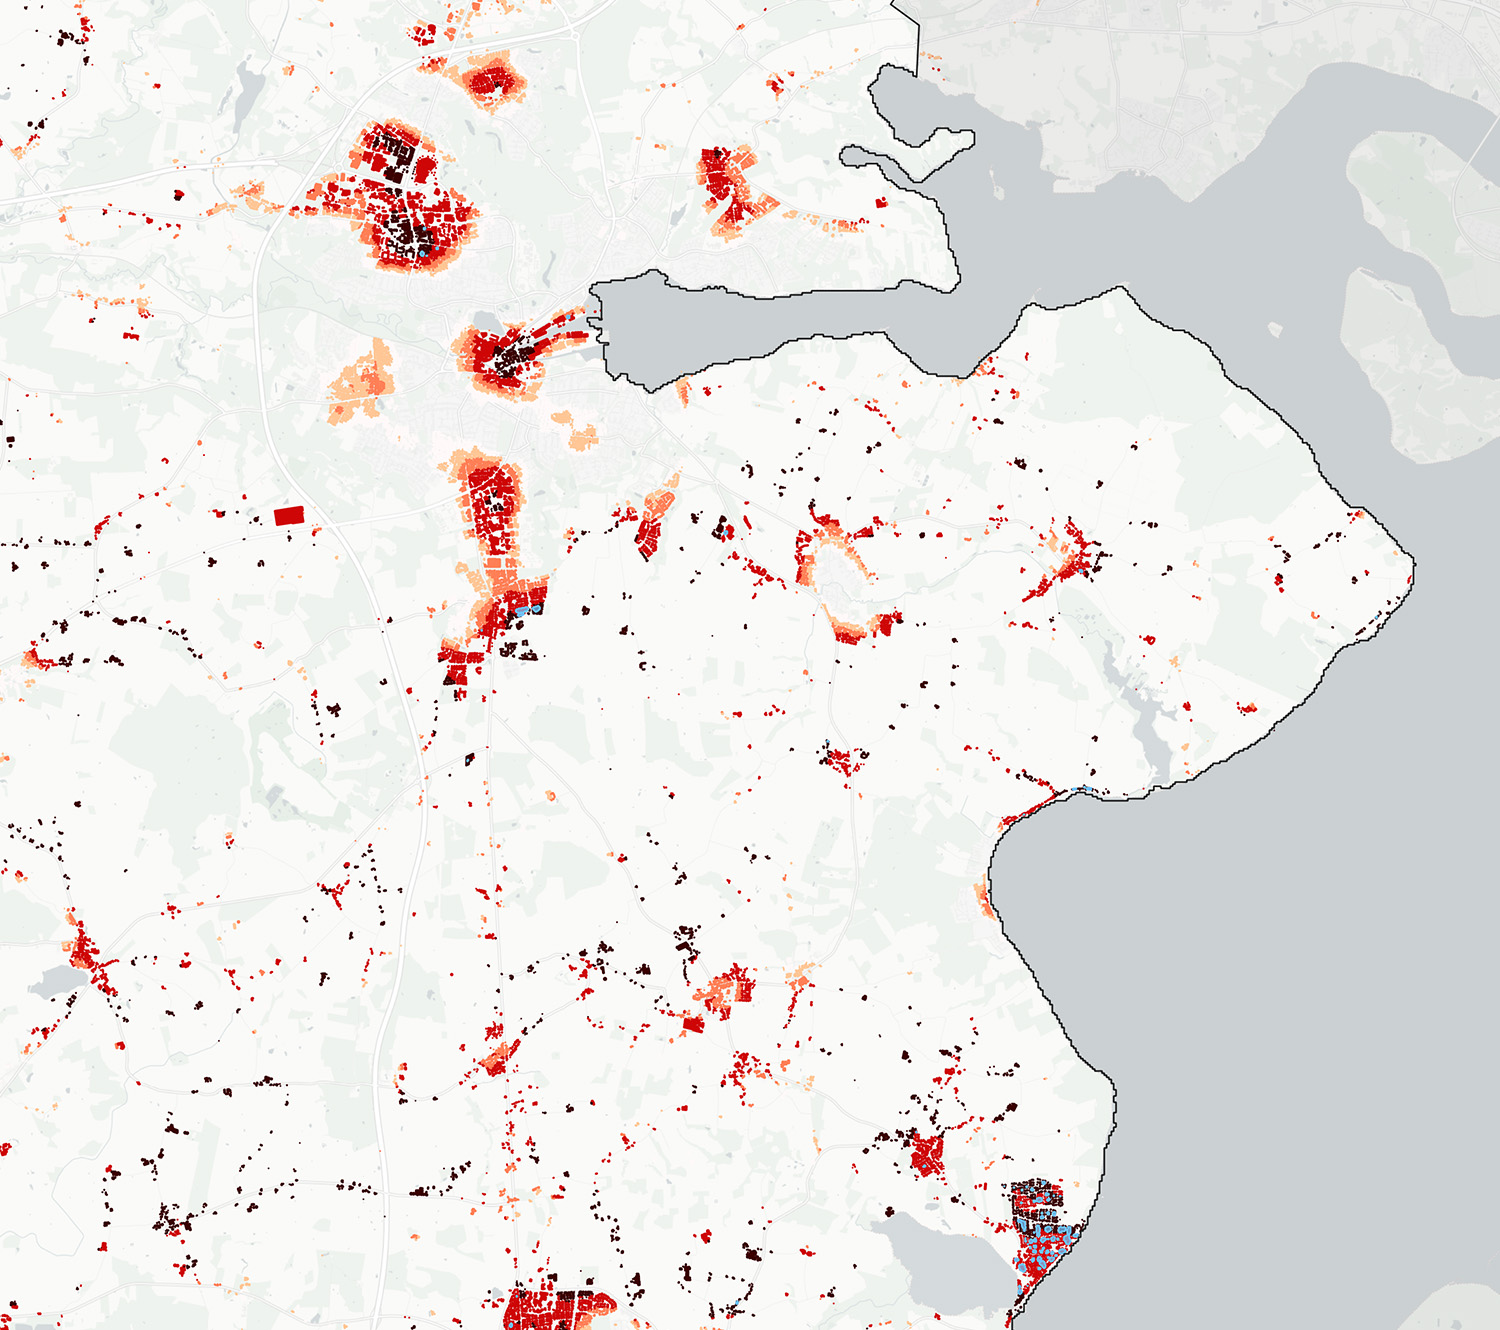
Figure 13. Gap analysis for Kolding, Denmark. Red buildings have a gap towards the 30-rule, and the intensity of the red-tone depicts the size of the gap. Blue areas mark focal areas, where planting trees has the most significant impact on fixing the gap.
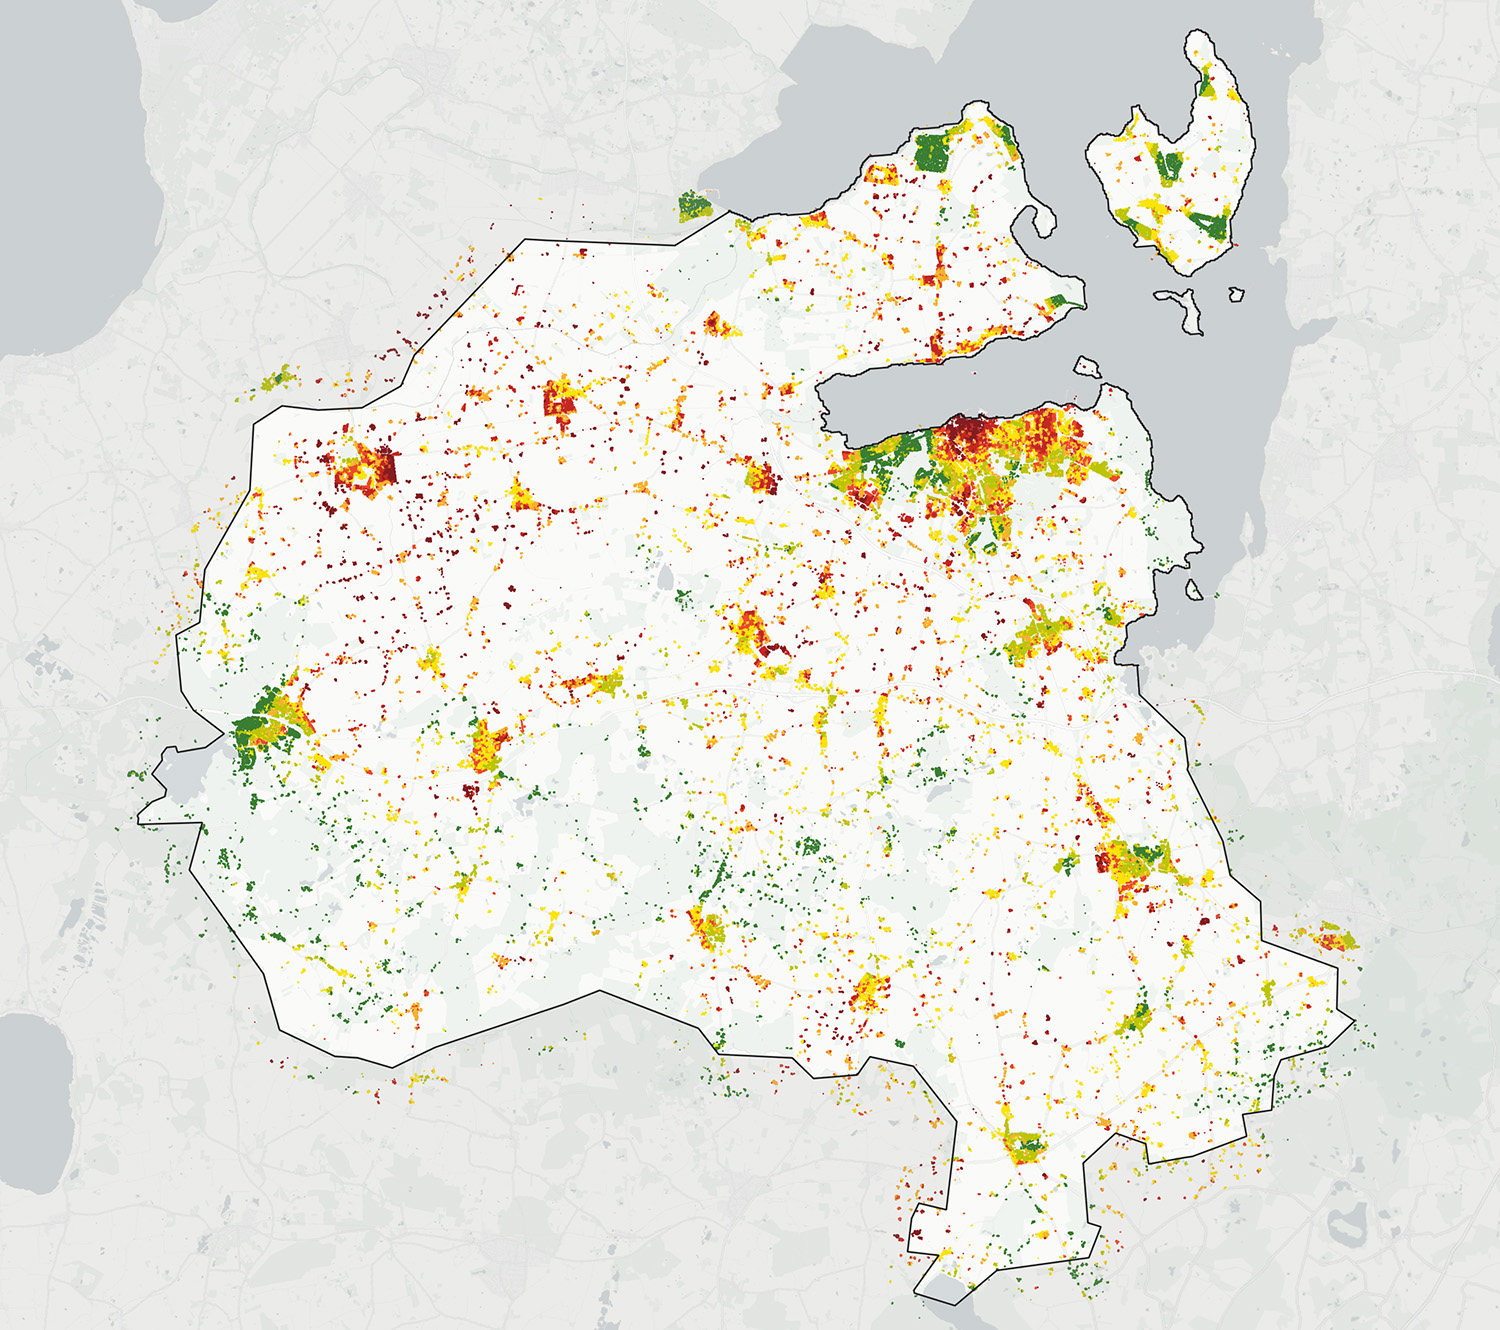
Figure 14. Overall 3+30+300-principle score for Holbæk, Denmark. Yellow and green colours indicate buildings and areas with positive 3+30+300 scores, orange and red tones depict scores that are too low.
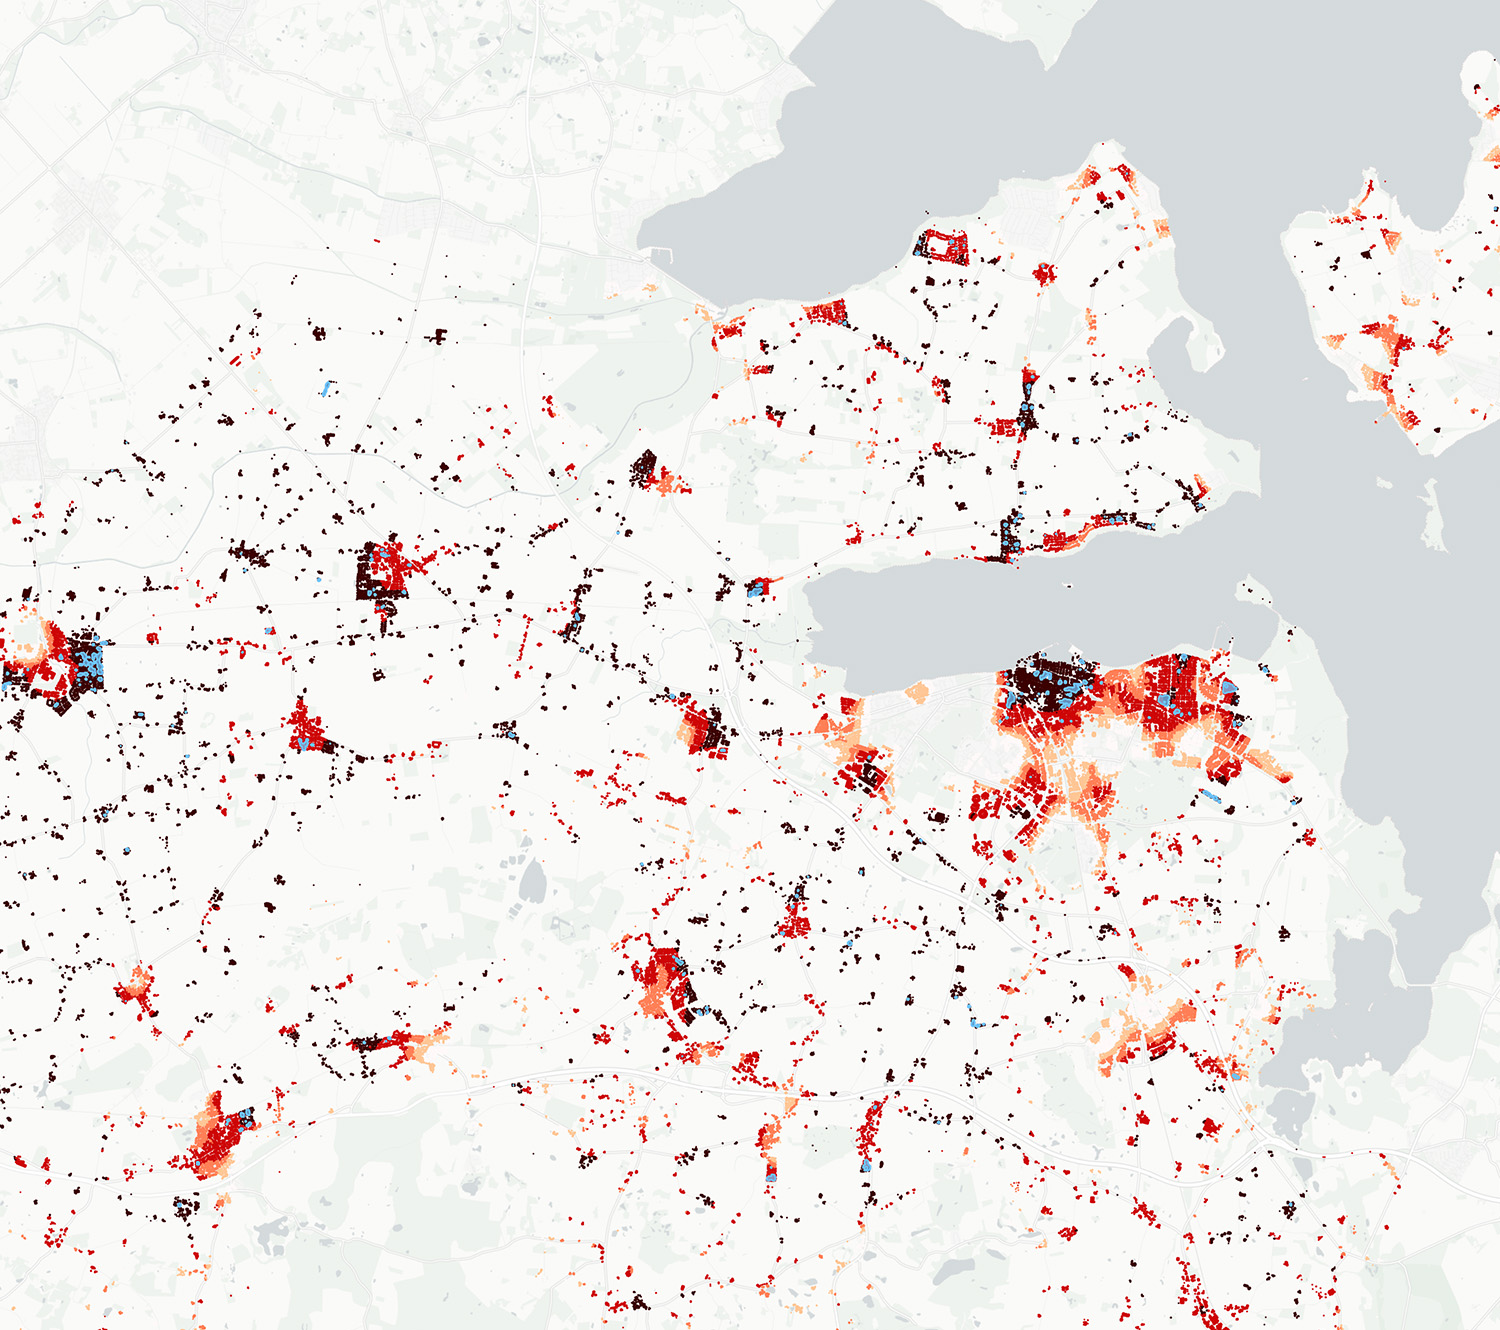
Figure 15. Gap analysis for Holbæk, Denmark. Red buildings have a gap towards the 30-component, the intensity of red depicts the size of the gap. Blue areas are focal areas for fixing the gap.
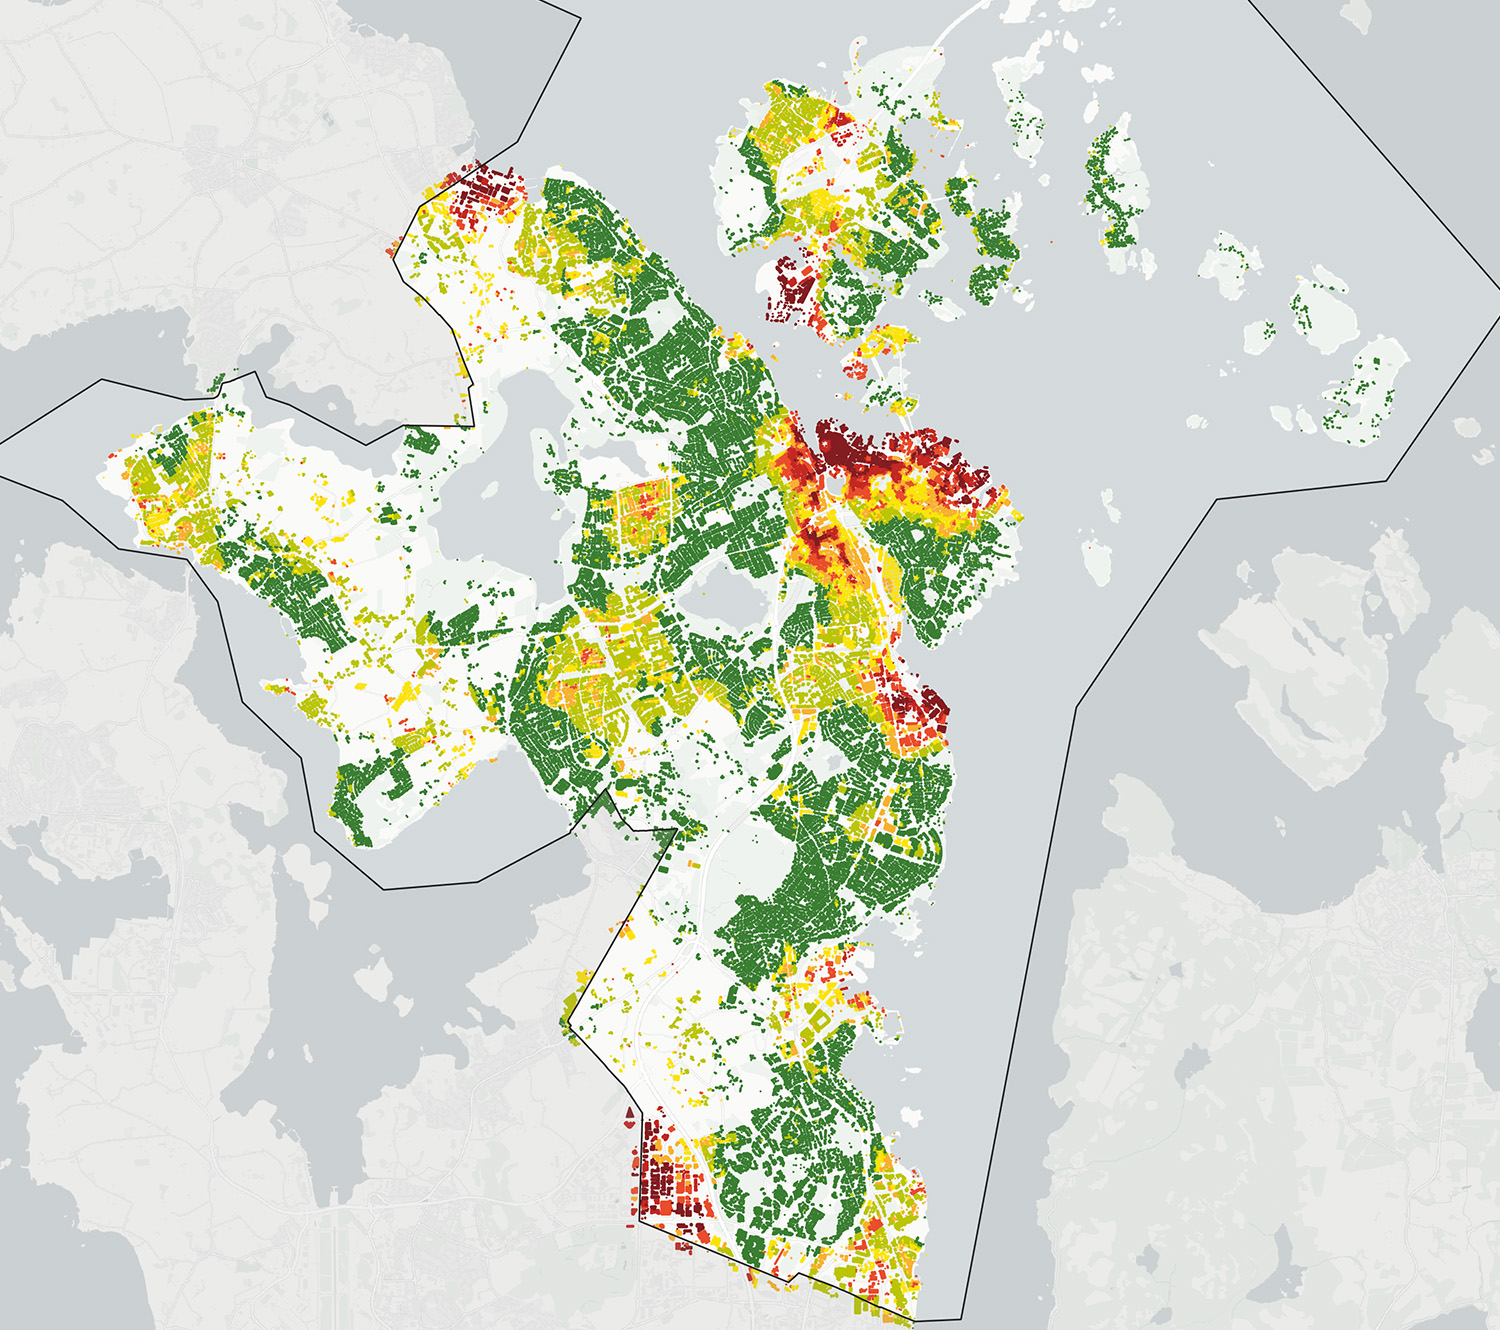
Figure 16. 3+30+300-principle map of overall scores for Stavanger, Norway. Yellow and green colours indicate buildings and areas with positive 3+30+300 scores, orange and red tones depict scores that are too low.
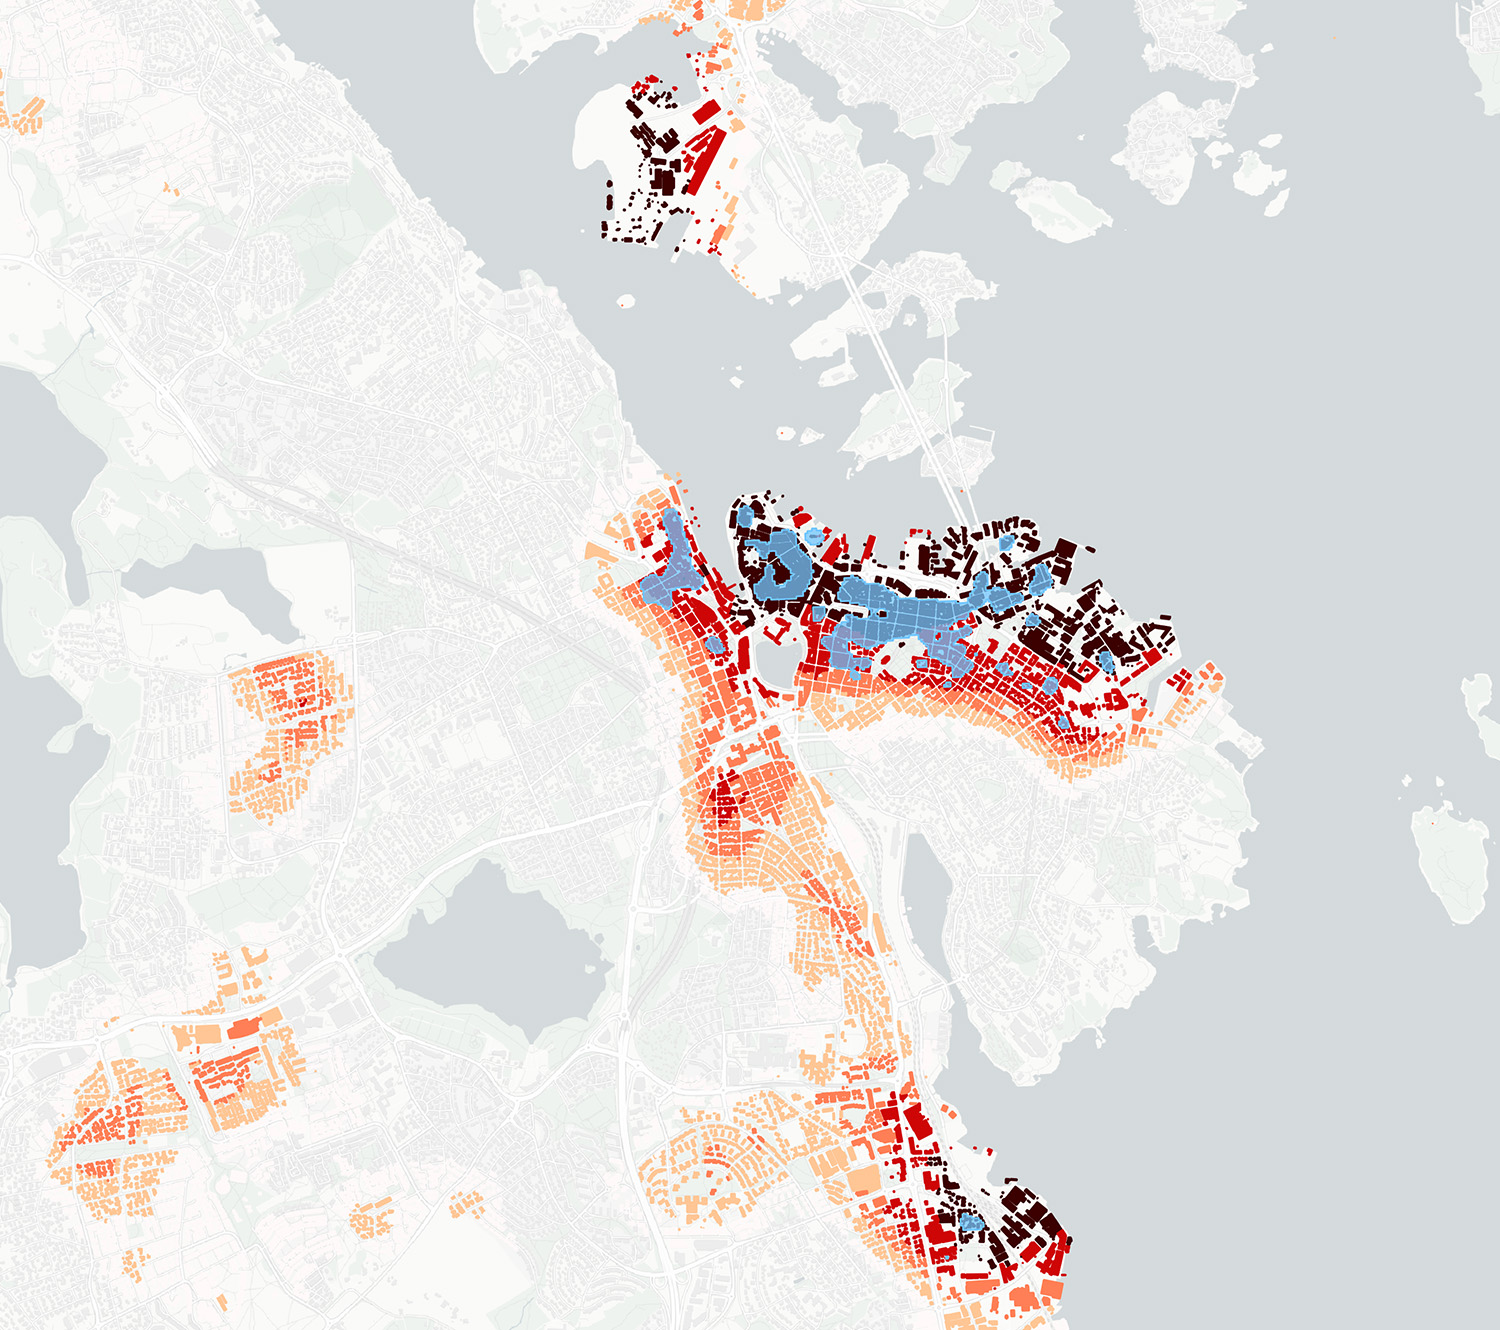
Figure 17. Gap analysis for Stavanger, Norway. Red buildings have a gap towards the 30-rule. The blue areas are focal areas for action.
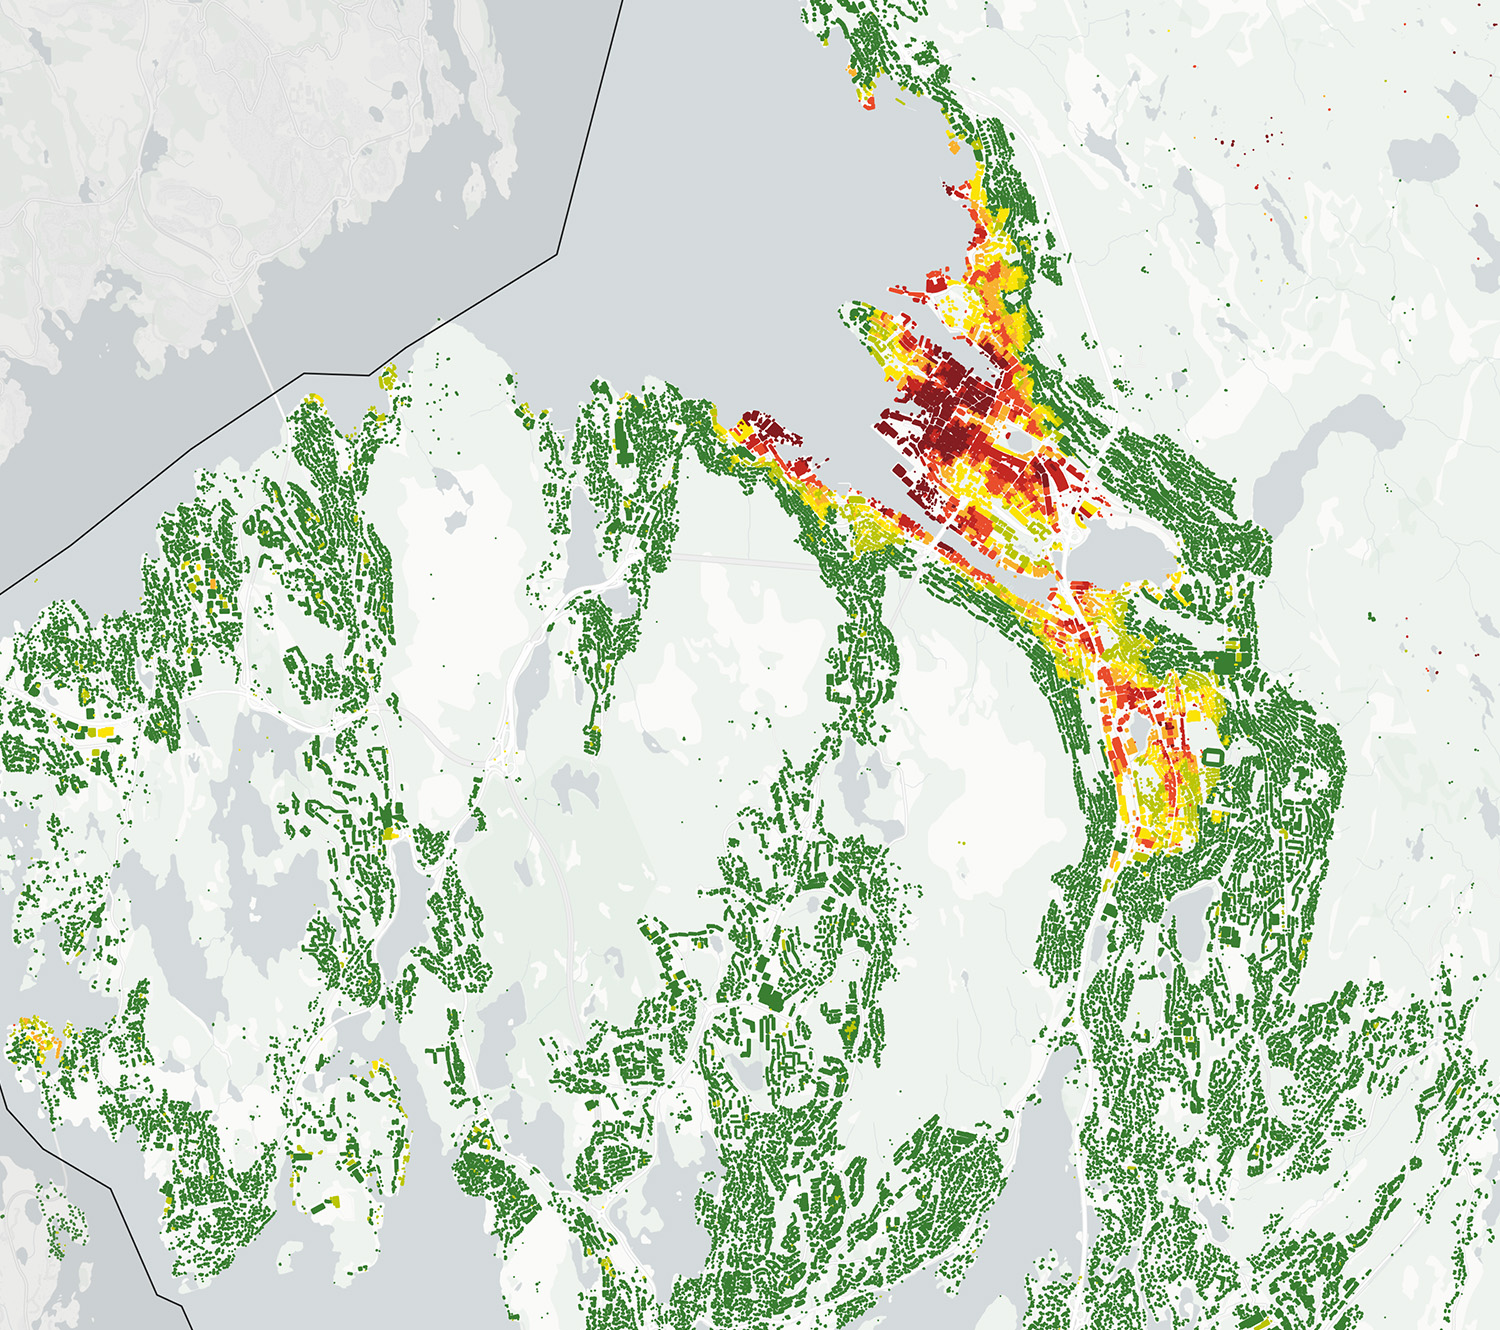
Figure 18. The 3+30+300-rule overall score for Bergen, Norway. Yellow and green colours indicate buildings and areas with positive 3+30+300 scores, orange and red tones depict scores that are too low.
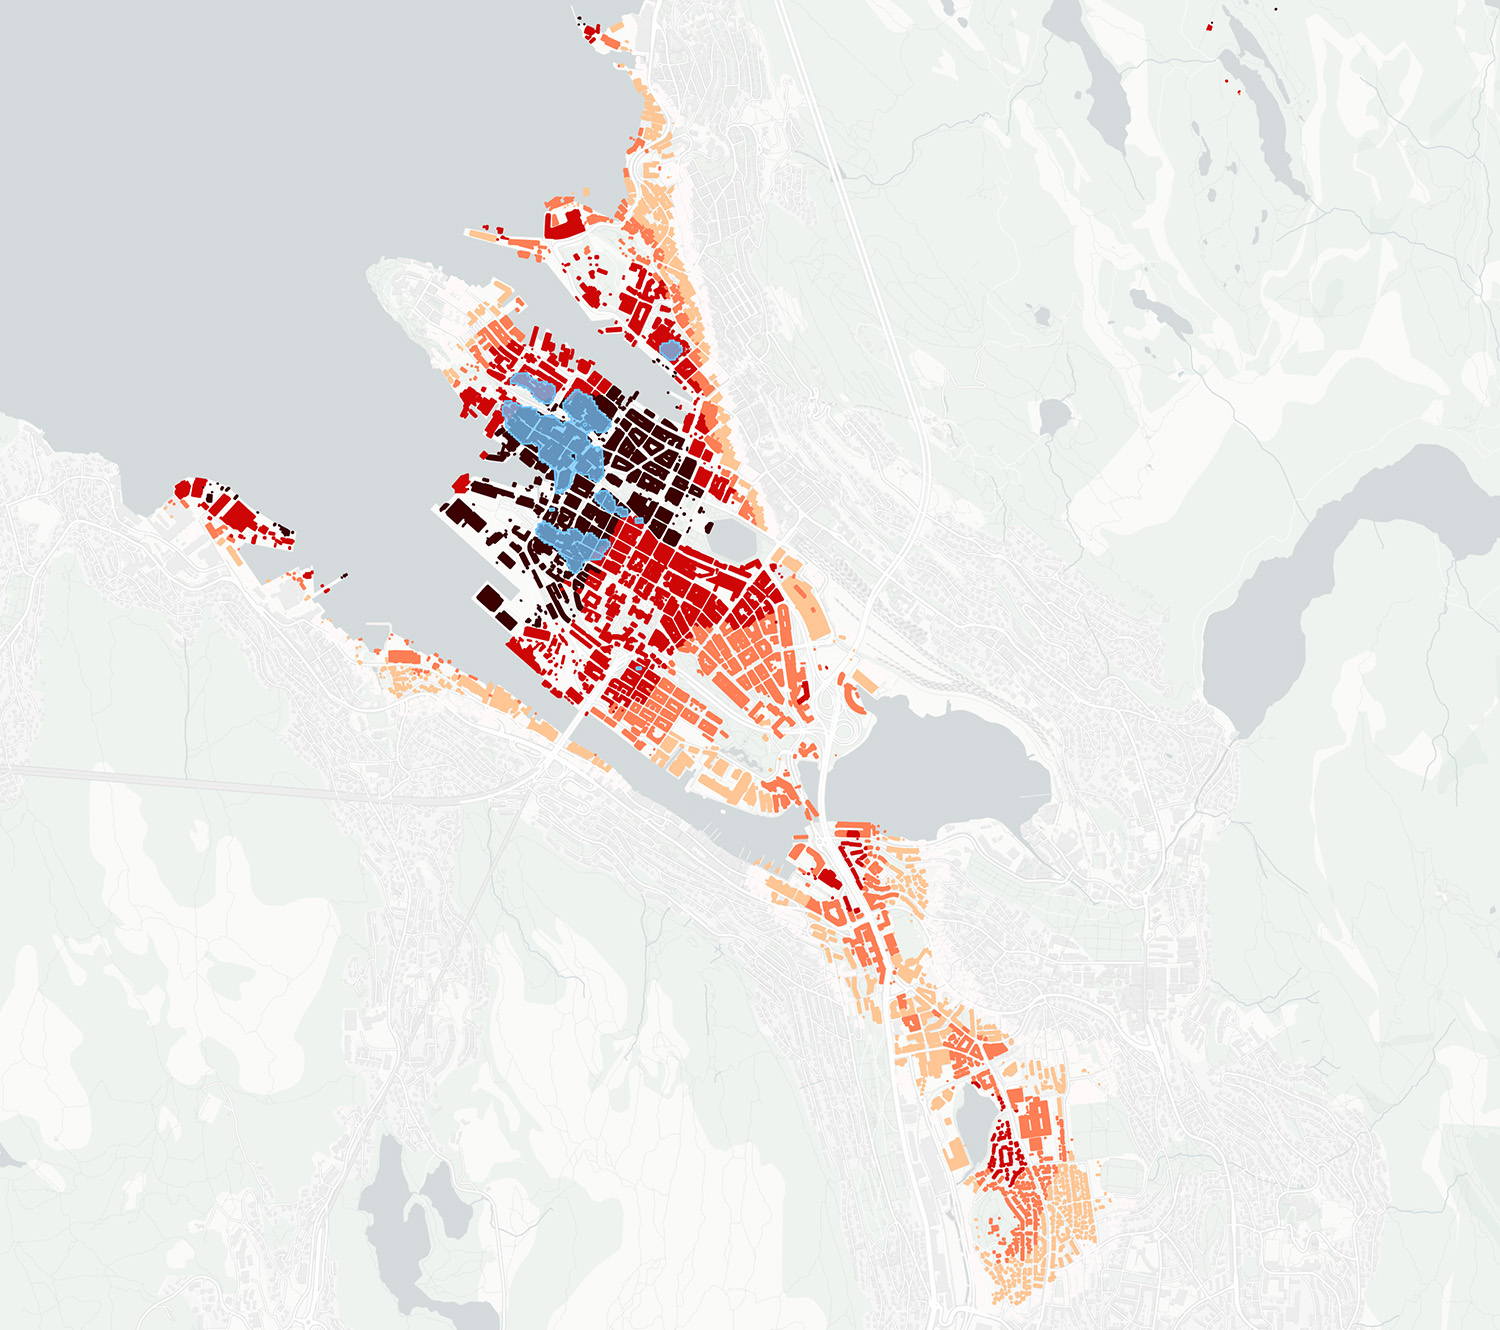
Figure 19. Bergen, Norway gap analysis. Red buildings do not adhere to the 30-rule, and show a gap. Fixing the blue regions will have the biggest impact on solving the gap problem.

Figure 20. Overall 3+30+300 score map for Turku, Finland. Yellow and green colours indicate buildings and areas with positive 3+30+300 scores, orange and red tones depict scores that are too low.
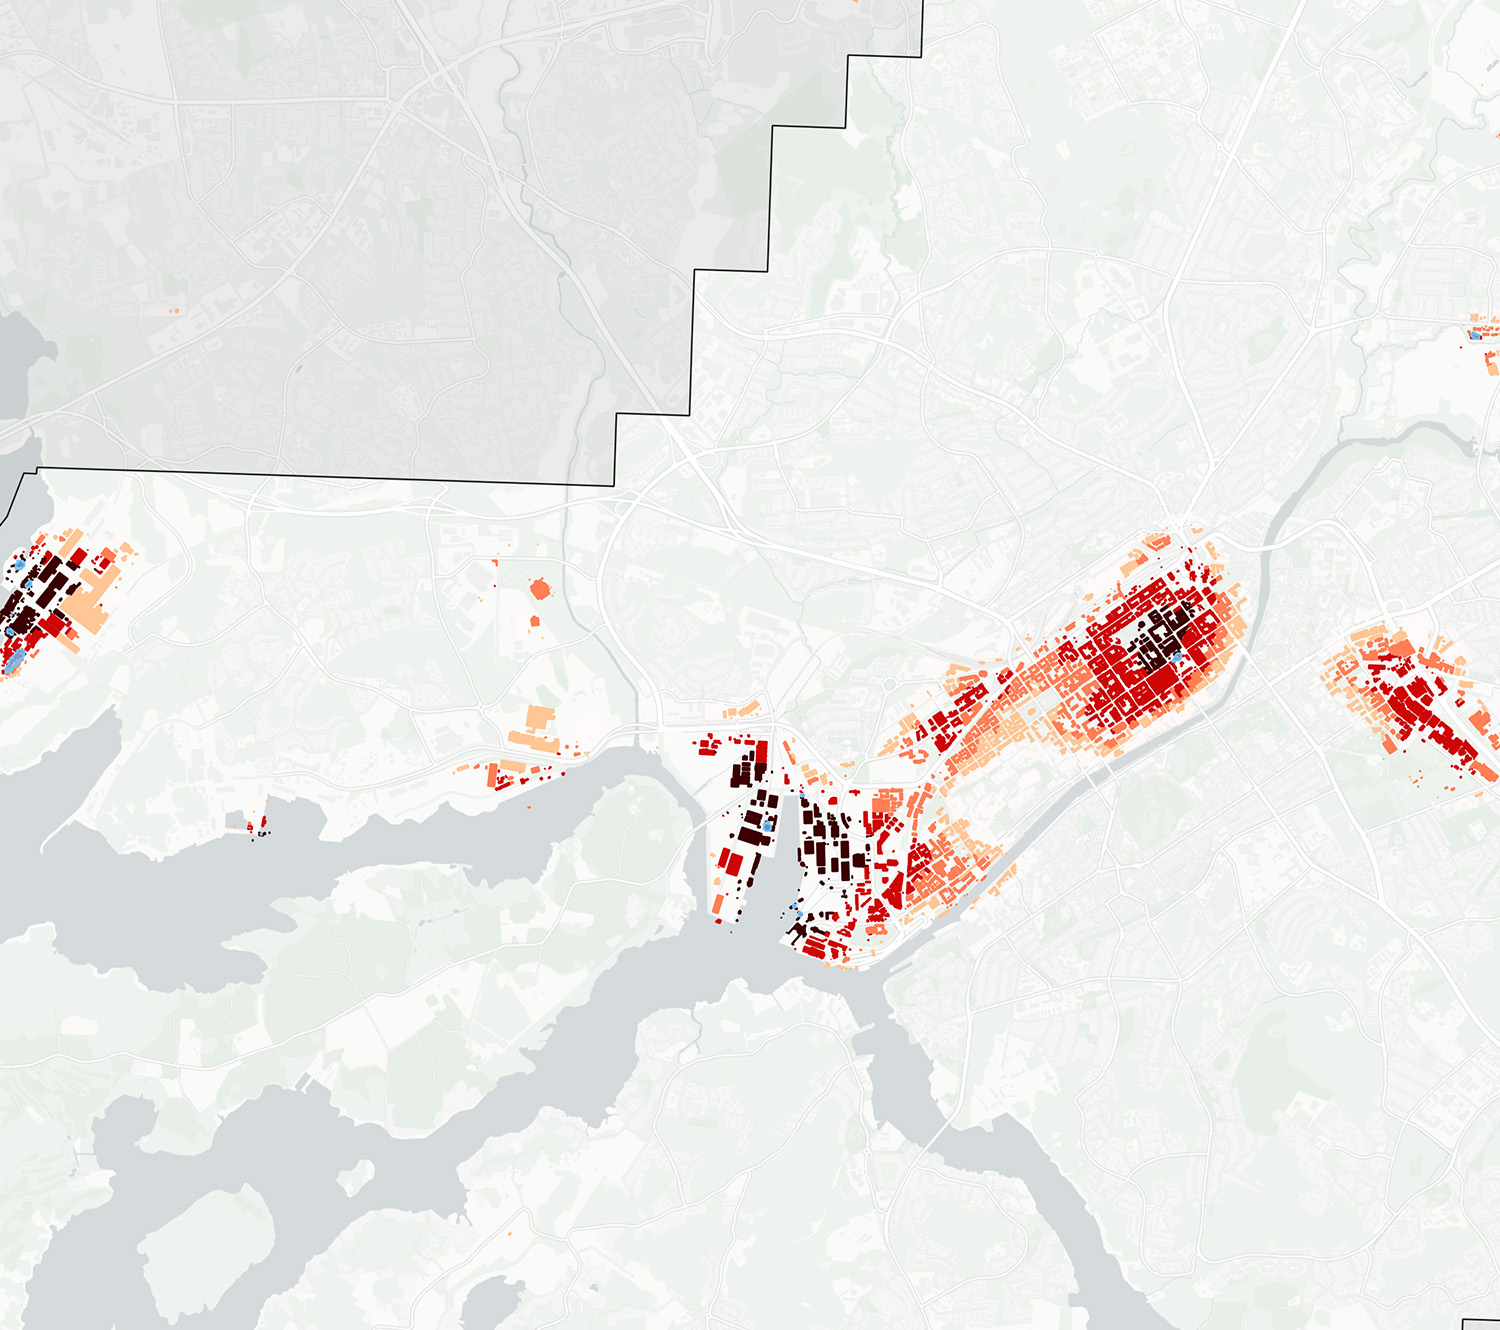
Figure 21. Gap analysis for Turku, Finland. Red buildings do not meet the 30-rule. The blue areas are focal areas for fixing the gap.
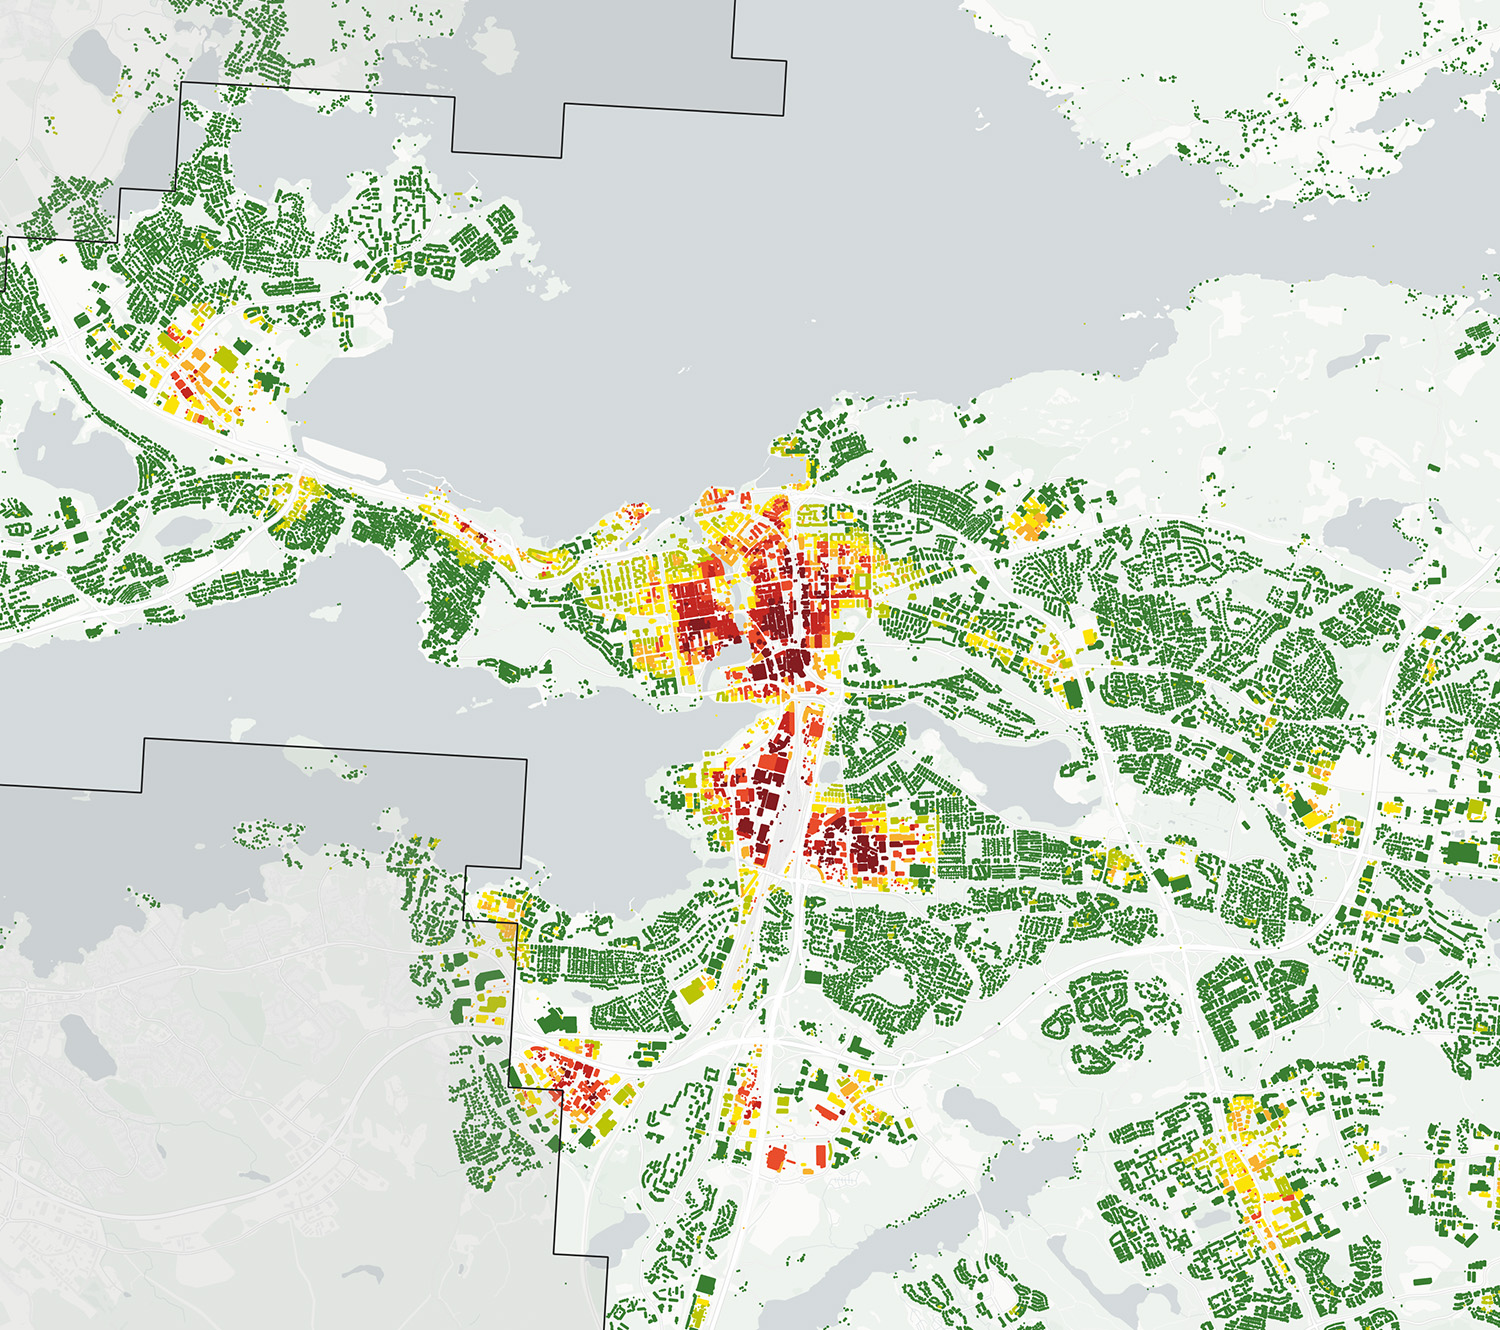
Figure 22. The overall 3+30+300 score for Tampere, Finland. Yellow and green colours indicate buildings and areas with positive 3+30+300 scores, orange and red tones depict scores that are too low.
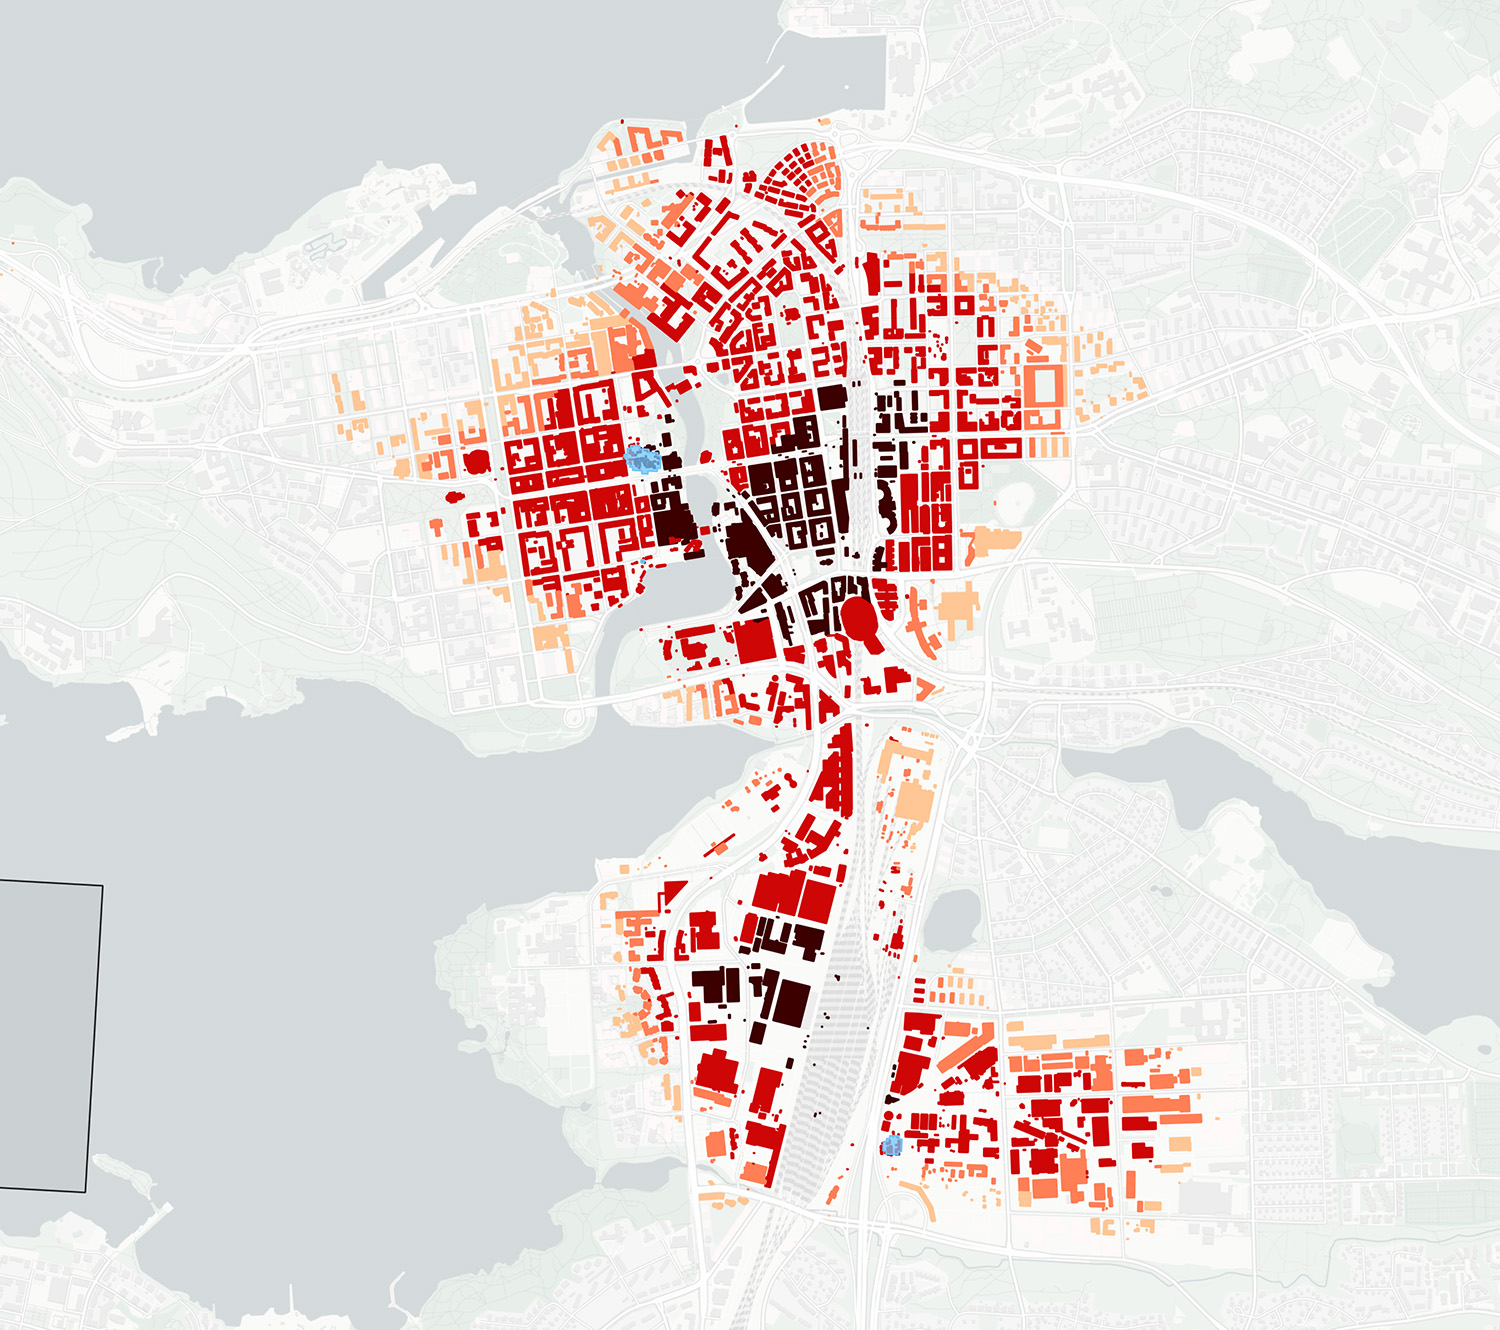
Figure 23. Gap analysis for Tampere, Finland. The red buildings require interventions in the canopy cover. Blue areas depict the focal areas where the biggest impact can be made.
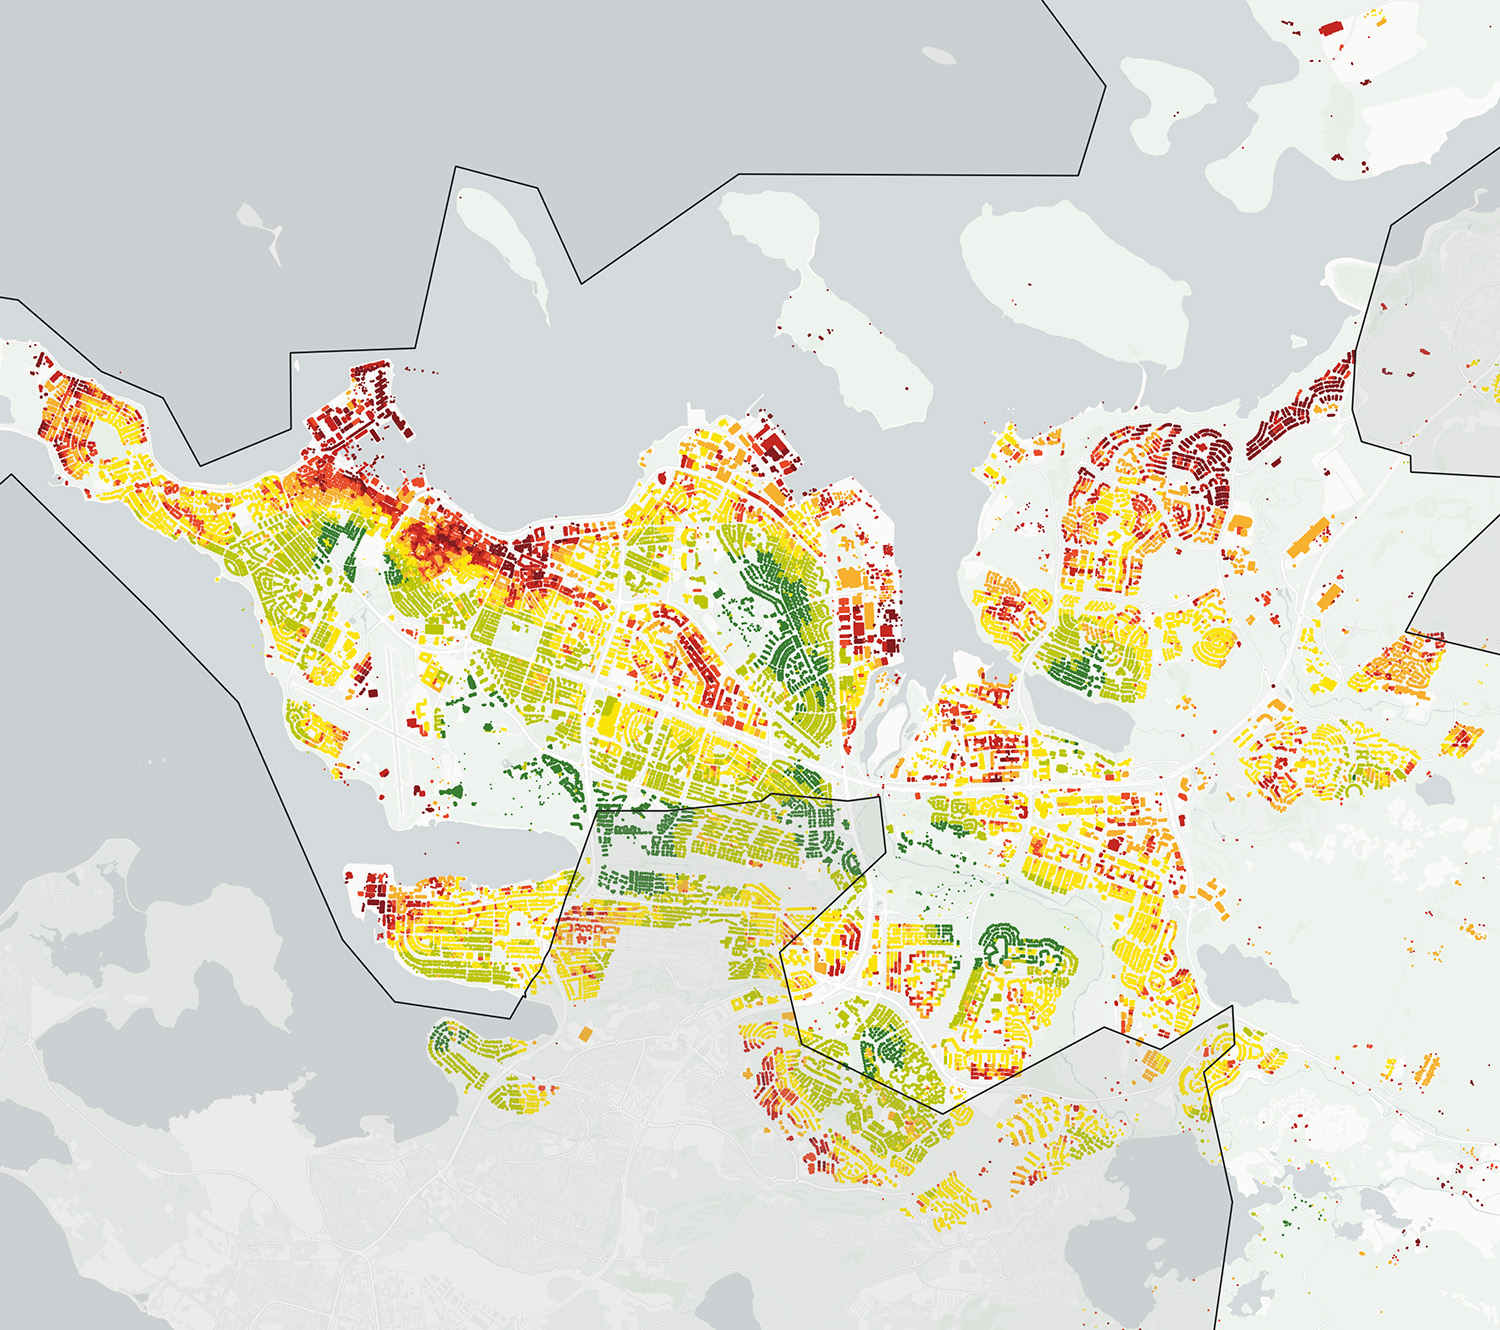
Figure 24. 3+30+300-principle presented as an overall score for Reykjavik, Iceland. Yellow and green colours indicate buildings and areas with positive 3+30+300 scores, orange and red tones depict scores that are too low.
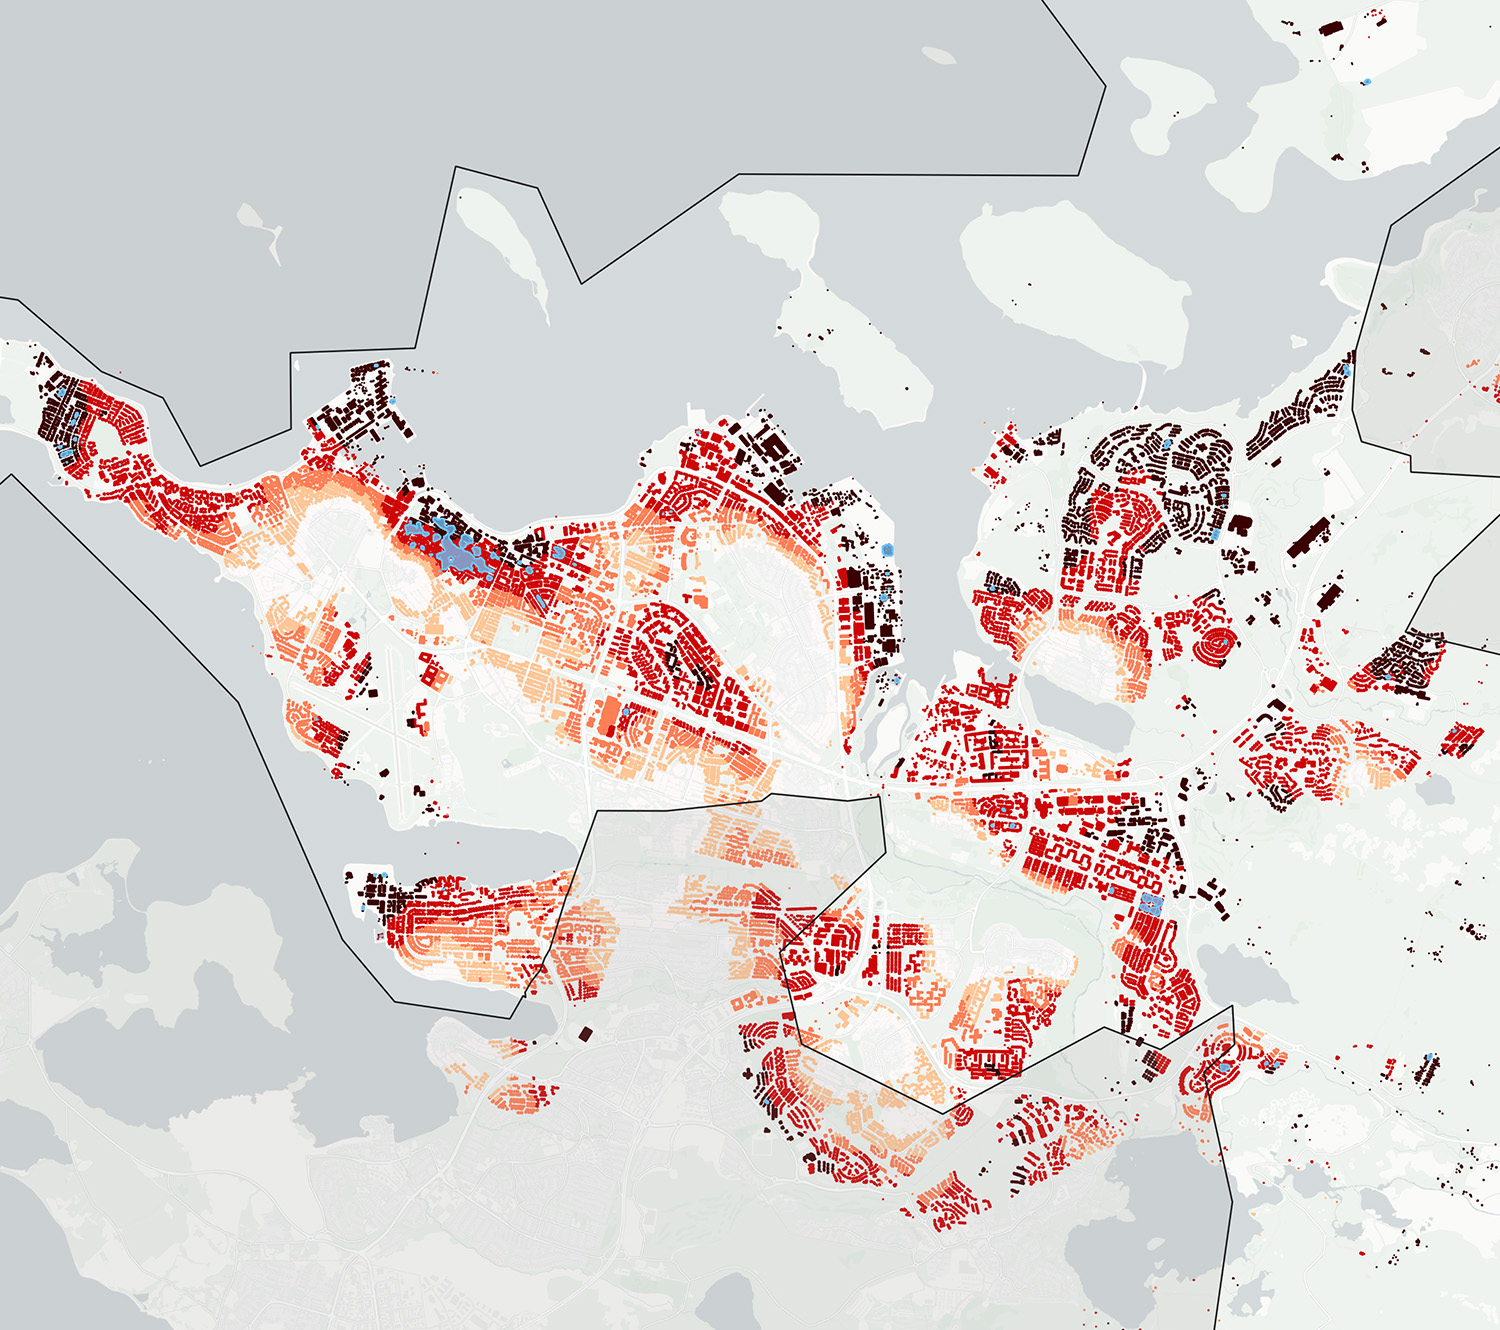
Figure 25. 30-component gap analysis for Reykjavik, Iceland. Red buildings require extra attention. The blue areas depict the zones where the effect on bridging the gap is the biggest.
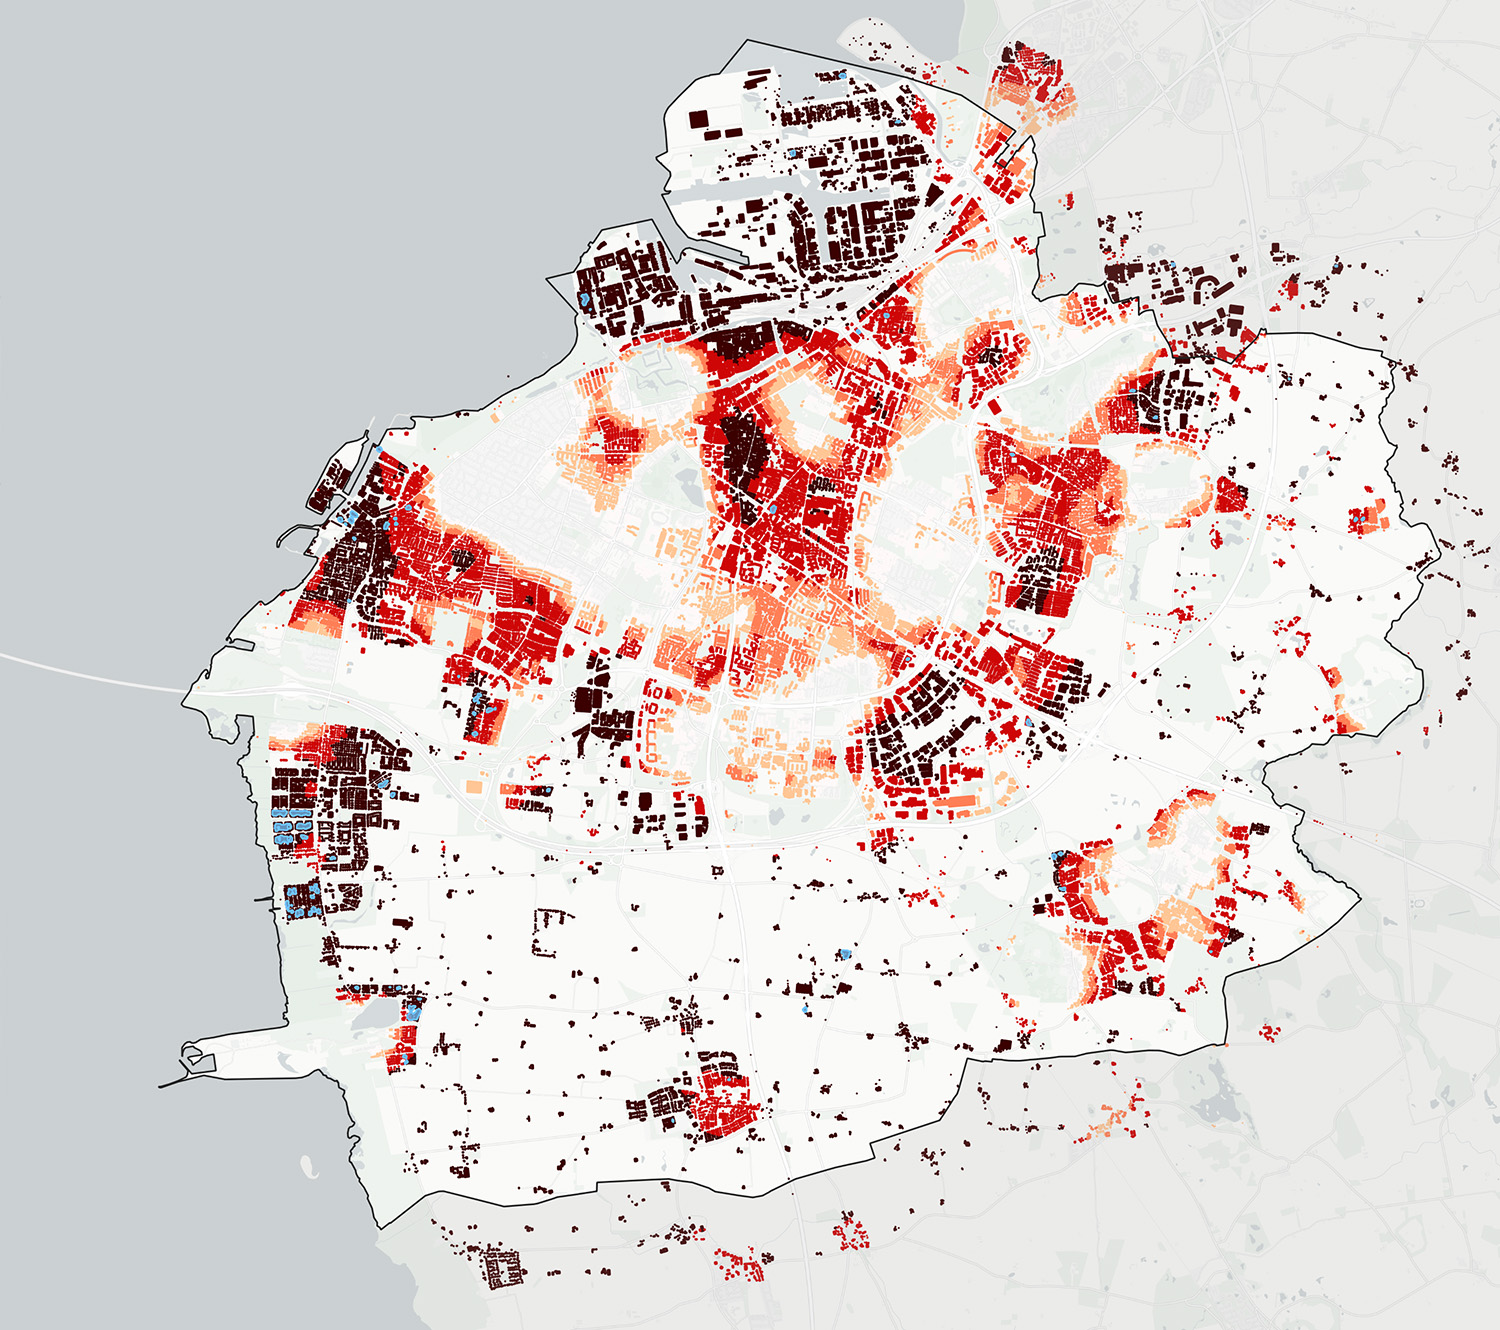
Figure 26. 30-component gaps analysis for Malmö, Sweden. Red buildings require extra care. The blue areas depict the zones where the effect on bridging the gap is the biggest.
These gap analysis maps were used during the second workshop with the participating municipalities (see also Appendix A2). Participants found the maps useful and agreed with many of the priority areas for greening and expansion of tree canopy cover, although they also disagreed with some others. In some cases there were logical explanations for ‘blue’ gap areas that did not require further action, such as the specific land-use type (industrial harbour areas) or the presence of other landscape qualities (location on a coast or river, presence of open cultural landscape with high recreational values).
Socioeconomic perspectives on urban trees
When working with the 3+30+300 principle and carrying out assessments and gap analyses as those presented in the previous section, it is important to keep in mind what trees and green spaces are supposed to achieve. Here it is also important to differentiate between communities with different socio-economic characteristics and associated different needs.
Urban trees and urban green spaces hold significant socioeconomic value, impacting various aspects of life. From improving public health and reducing pollution to contributing to economic growth, even access to urban trees and green space is crucial for environmental and social justice.
Key socioeconomic perspectives on urban trees include those of:
Public health and well-being
As discussed in the section on urban trees and health above, trees absorb pollutants like nitrogen dioxide (NO₂), sulphur dioxide (SO₂), and particulate matter, contributing to cleaner air (Nowak et al., 2002; Eisenmann et al., 2019). This has direct health benefits, particularly for vulnerable populations like children, the elderly, and people with chronic diseases, by reducing respiratory and cardiovascular illnesses (Lee, 2011; Kuo, 2015). Additionally urban forests and other green spaces have been shown to lower stress, reduce symptoms of anxiety and depression, and improve overall mental well-being (Kaplan et al., 1989; Bratman et al., 2015). Access to green spaces encourages physical activity, promoting healthier lifestyles (Sugiyama et al., 2008). Further, trees provide shade and cool the air through transpiration, mitigating the urban heat island effect (Oke, 1982; Bowler, 2010) – an important underlying argument for the 3+30+300 principle. The cooling effect of urban tree canopy reduces heat-related health risks. International research shows that particularly low-income neighbourhoods may be disproportionately affected by extreme heat (Chakraborty et al., 2019).
Economic contributions
Trees enhance the aesthetic appeal of neighbourhoods and streets, resulting in higher property values. Studies show that homes located near well-maintained trees or parks can see a rise in their market value by up to 10–20% (Crompton, 2001; Kardan et al., 2015). This is not necessarily only a positive impact, as higher property and rental prices can push out lower-income residents from neighbourhoods, known under the term ‘green gentrification’ (e.g., Anguelovski et al., 2022). Urban trees can reduce energy costs by providing natural shade, lowering the need for air conditioning in summer, and acting as windbreaks in winter. This translates into lower utility bills for residents and businesses (Hsieh, 2018; Sailor, 2008). Well-maintained urban forests attract tourists and provide recreation opportunities for residents, contributing to local economies (Crompton, 2001). Parks, botanical gardens, and tree-lined streets enhance the aesthetic value of cities, making them more attractive places to live and visit (Kaplan, 1985; Nasar, 1992). While there are several studies showing that green space also may reduce the need for health care, prescription medications, and associated costs (Becker et al., 2029: Buckley et al., 2022: Adewuyi et al., 2023), a systematic review by Patwary et al. (2024), indicated that many studies had a risk of bias and that factors related to healthcare accessibility may influence the relationship.
Environmental justice and equity
Based on studies on American cities and cities in the global south, research indicates that there is often an unequal distribution of urban trees, with wealthier neighbourhoods enjoying more tree cover than low-income or marginalised communities (Wolch et al., 2014; Lin et al., 2021). This disparity highlights environmental justice issues, where those who could benefit most from green spaces – due to higher levels of pollution and heat stress – often have the least access (Cruz-Sandoval et al., 2020; Woodward et al., 2023). This injustice is further articulated as trees help neighbourhoods become more resilient to climate change by reducing flood risks through better stormwater management. This is particularly crucial in underserved areas that are more vulnerable to environmental hazards (Maantay et al., 2010; Salmond et al., 2016). Additionally urban trees and parks offer social spaces that strengthen community ties, serve as gathering places, and foster a sense of belonging. They contribute to cultural identity and neighbourhood pride, particularly in urban areas with a high population diversity (Kuo, 2003).
Urban trees are not just a natural asset; they are socioeconomic drivers that enhance quality of life, contribute to economic vitality, and promote sustainability. Equitable access to green spaces, combined with strategic urban planning and community engagement, ensures that all city dwellers benefit from the advantages trees provide (Zang, 2017). Balancing the costs of tree maintenance with their long-term benefits is crucial for creating resilient, livable cities.
Socioeconomic status and vulnerability
To investigate socioeconomic perspectives on urban trees in the Nordic context we must first define what we mean with socioeconomic status and socioeconomic vulnerability. The term socioeconomic status is often linked to education level, income level, and employment. Educational attainment is often used to describe the socioeconomic position of a person or group in society. Education generally contributes to increased chances in professional life and thus also affects the income level of the individual or group (Folkhälsomyndigheten, 2021).
Socioeconomic vulnerability can be understood as the likelihood or risk of being harmed or exposed to stresses and little or no opportunity to adapt accordingly (Nikkanen et al., 2021). The concept can be applied to individuals and groups as well as to societies. Social vulnerability is linked to a susceptibility based on social, economic or political factors, and varies across social and geographical space. Social space refers to who is vulnerable, which is determined by economic, political and institutional factors, while geographical space refers to where an individual or group is vulnerable (MSB, 2021).
Socioeconomic status is an important determinant of health (EEA, 2018; Scientific Council for Sustainable Development, 2018; Public Health Agency of Sweden, 2021). In general, groups with low socioeconomic status are at increased risk of exposure to climate and environmental risks. These are groups that tend to live in poorer environmental conditions in terms of, for example, noise and air pollution (EEA, 2018), but also in areas that tend to get much warmer (Jensen Karlsson and Nuder, 2023). Temperature differences can be noted between areas with different socioeconomic status. Areas with dense buildings, a lot of impervious surfaces, large lawns and large roofs get much warmer, which according to a mapping carried out by the Swedish national public television broadcaster (Jensen Karlsson and Nuder, 2023) coincides with areas with socioeconomic challenges.
Nordic definitions of socioeconomic vulnerability
While the Nordic Region is often portrayed as sharing many similarities in culture and society, there is no standard or regional definition of what constitutes socioeconomic vulnerability. This poses challenges when it comes to analysing and understanding impacts of urban vulnerability on one hand, and access to green space and trees on the other. While Denmark and Sweden have official definitions and identify vulnerable areas based on official statistics, Finland, Iceland, and Norway do not. In Finland, there is generally an even distribution of wealth across the population (Nikkanen et al., 2021). Finland has been working on a policy of socially mixed housing for decades (Nordic Welfare Center, 2019) (Table 5).
A similarity with Sweden and Norway is that both countries are interested in areas where unemployment is higher and where fewer people are in education, while Denmark has a different focus on ethnic segregation (Nordic Welfare Centre, 2019). However, one concern is that a regional Nordic definition of socioeconomic does not exist.
A similarity with Sweden and Norway is that both countries are interested in areas where unemployment is higher and where fewer people are in education, while Denmark has a different focus on ethnic segregation (Nordic Welfare Centre, 2019). However, one concern is that a regional Nordic definition of socioeconomic does not exist.
Nordic definitions of socioeconomic vulnerability | |
Denmark | Vulnerable areas (‘udsatte områder’) is an official term in Denmark, defined within the "Public Housing Act" ("Lov om almene boliger"). Denmark defines areas with socioeconomic vulnerability as vulnerable areas, parallel communities, transformation areas, and prevention areas. The areas are defined based on the percentage of residents who are non-Western immigrants as well as criteria of unemployment, criminal convictions, education and average gross income. Parallel communities are defined as areas that have more than 50% of residents who are immigrants or descendants from non-Western countries, as well as fulfilling all criteria as a vulnerable area and transformation areas are areas that have been designated as parallel communities for five consecutive years. (see more at bl.dk/viden-kartotek/udsatte-boligomraader (BL, undated). The Danish government has published an official list of vulnerable residential areas annually since 2010, with changes in the definition and/or terminology in 2013, 2018 and 2021. |
Faroe Islands | The Faroe Islands do not have a formally defined concept of socioeconomically vulnerable areas. Like other small island communities, the Faroe Islands have regions where residents face challenges accessing essential services such as healthcare, education, and employment opportunities. While the Faroe Islands enjoy a relatively high standard of living, disparities can exist between different areas, particularly between more urban and rural locations, read more at the Faroe Islands official site for statistics and through the Nordic statistics database |
Finland | In Finland, terms such as socioeconomically challenged areas or areas with a low standard of living describe areas where the population has poorer living conditions. Statistics Finland (Tilastokeskus) collects and analyses data related to unemployment, income and education, which is used to map socio-economic differences between different regions and neighbourhoods (stat.fi/index_en.html, undated) |
Greenland | Greenland does not have a formalised definition of socioeconomically vulnerable areas. However, socioeconomic vulnerability in Greenland is often linked to broader issues related to poverty, unemployment, access to education, healthcare, and infrastructure, particularly in remote and rural communities. Key factors associated with socioeconomic vulnerability in Greenland include geographical isolation as many small settlements and villages in Greenland are geographically isolated, which can limit access to essential services such as healthcare, education, and employment opportunities. This isolation often exacerbates socioeconomic challenges. Read more the official statistical agency for Greenland stat.gl and the Nordic statistics database |
Iceland | Iceland does not have a specific legal or governmental definition for socioeconomically vulnerable areas. However, the country does recognize socioeconomic vulnerability in its broader policies regarding poverty, housing, and welfare. Read more at oecd.org/en/countries/iceland.html, Iceland’s National Statistical Agency (statice.is) and the Icelandic Ministry of Social Affairs (stjornarradid.is). |
Norway | Norway does not use a formal definition of ‘socioeconomically disadvantaged area’ like Sweden or Denmark but there is extensive analysis of areas with socioeconomic challenges through various indicators such as unemployment, income levels, and education levels. Statistics Norway (SSB) collects data on such factors to map and analyse living conditions in different areas. ‘Levekårsutfordringer’ (living condition challenges) is a term often used in Norway to describe areas with high unemployment rates, low income, low education levels and high levels of welfare dependency. The Norwegian government has initiated various programmes to support these areas, for example through ‘Områdeløft’ and other urban renewal initiatives. |
Sweden | Vulnerable area is a term used by police authorities in Sweden since 2015. They define vulnerable areas as “[...] geographically defined places with low socioeconomic status and where criminals have an impact on the local community.” (Polisen, 2023). However, it is unclear what is meant by low socioeconomic status. These areas are divided into three categories: vulnerable areas, risk areas, and particularly vulnerable areas. A vulnerable area is characterised by low socioeconomic status defined as low levels of education, high unemployment, and economically vulnerable households. A study from 2019 shows that more than 13% of households in vulnerable areas receive some form of financial assistance, the unemployment rate is roughly doubled and 7.9% of residents in vulnerable areas are openly unemployed, compared with the 3.1 average. Households are larger, averaging 2.5 people per household compared to the national average of 2.2. (Global village, 2017) |
Table 5. Summary of the different definitions of the term socioeconomic vulnerability between the Nordic countries.
3+30+300 and socioeconomic parameters in the Nordic context
As seen earlier in Table 3, on the city level, the Nordic cities generally score high on the 3+30+300 principle, although reaching 30% tree cover represents a common challenge. Within the cities, there are significant differences between parts of the cities linked to how the built environment is designed.
Locations where the cities have developed play a major role in the appearance and conditions of their urban green space. Proximity to water and harbours has had a significant impact on where cities are located in the landscape, but the surroundings affect how much and where the public green structure is. In Denmark as well as in southern and central Sweden, many cities are located in agricultural landscapes, which means that the availability of trees and publicly accessible green spaces is generally higher in the cities than in the surrounding areas. Holbæk, Kolding, and Malmö are all examples of cities that are largely surrounded by agricultural land, and where agricultural land has been claimed as the cities have grown. The growth of the cities has, in many parts, meant that more trees have been planted than if the land had continued to be farmed, even if high nature values linked to field mounds and ditches have disappeared. Umeå in northern Sweden, on the other hand, is surrounded by forest, which means that natural land and trees have been claimed as the city has grown. Stavanger and Bergen are located in a fjord landscape where large differences in altitude and proximity to the sea have contributed to the compact growth of the cities, where forests and nature are located close to the city boundaries, and green areas that have been utilised as the cities have grown.
To investigate the Nordic dimension of socioeconomic vulnerability, and trees and green space data on employment rate, income, educational level, ethnicity and public health has been compared to the fulfilment of the 3+30+300 principle. Based on data availability, Malmö has been used as an in-depth case study. In the remaining network cities, areas defined as vulnerable or areas identified as facing socioeconomic challenges have been used to analyse local dimensions of how socioeconomic parameters correspond to green space and tree availability.
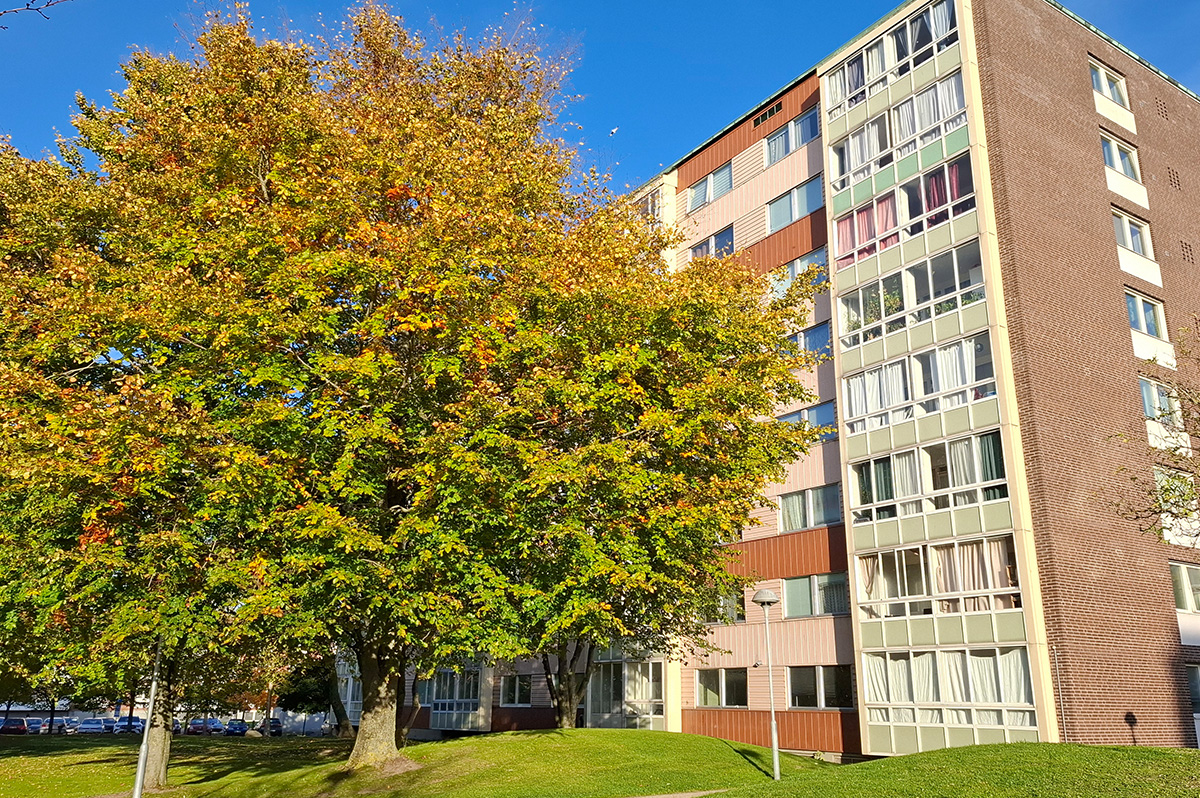
Photo 13. Large trees close to buildings in the Rosengård district of Malmö, Sweden (photo by Wösel Thorensen).
Nordic cities
Results of the analysis of the nine Nordic cities participating in the Yggdrasil project show that the correlation between access to urban trees and green space and socioeconomic vulnerability needs a contextualised understanding. Vulnerable areas have been identified using official sources but differ in how they are defined and which data is used. Malmö is used as an in-depth case study below but common traits are found in a majority of the cities.
Case study Malmö
Although many Nordic cities generally score high on the 3+30+300 principle, Malmö, due to the city's dense urban form and being surrounded by agricultural land and the sea, has significant challenges reaching acceptable levels of all three components (Figure 27).
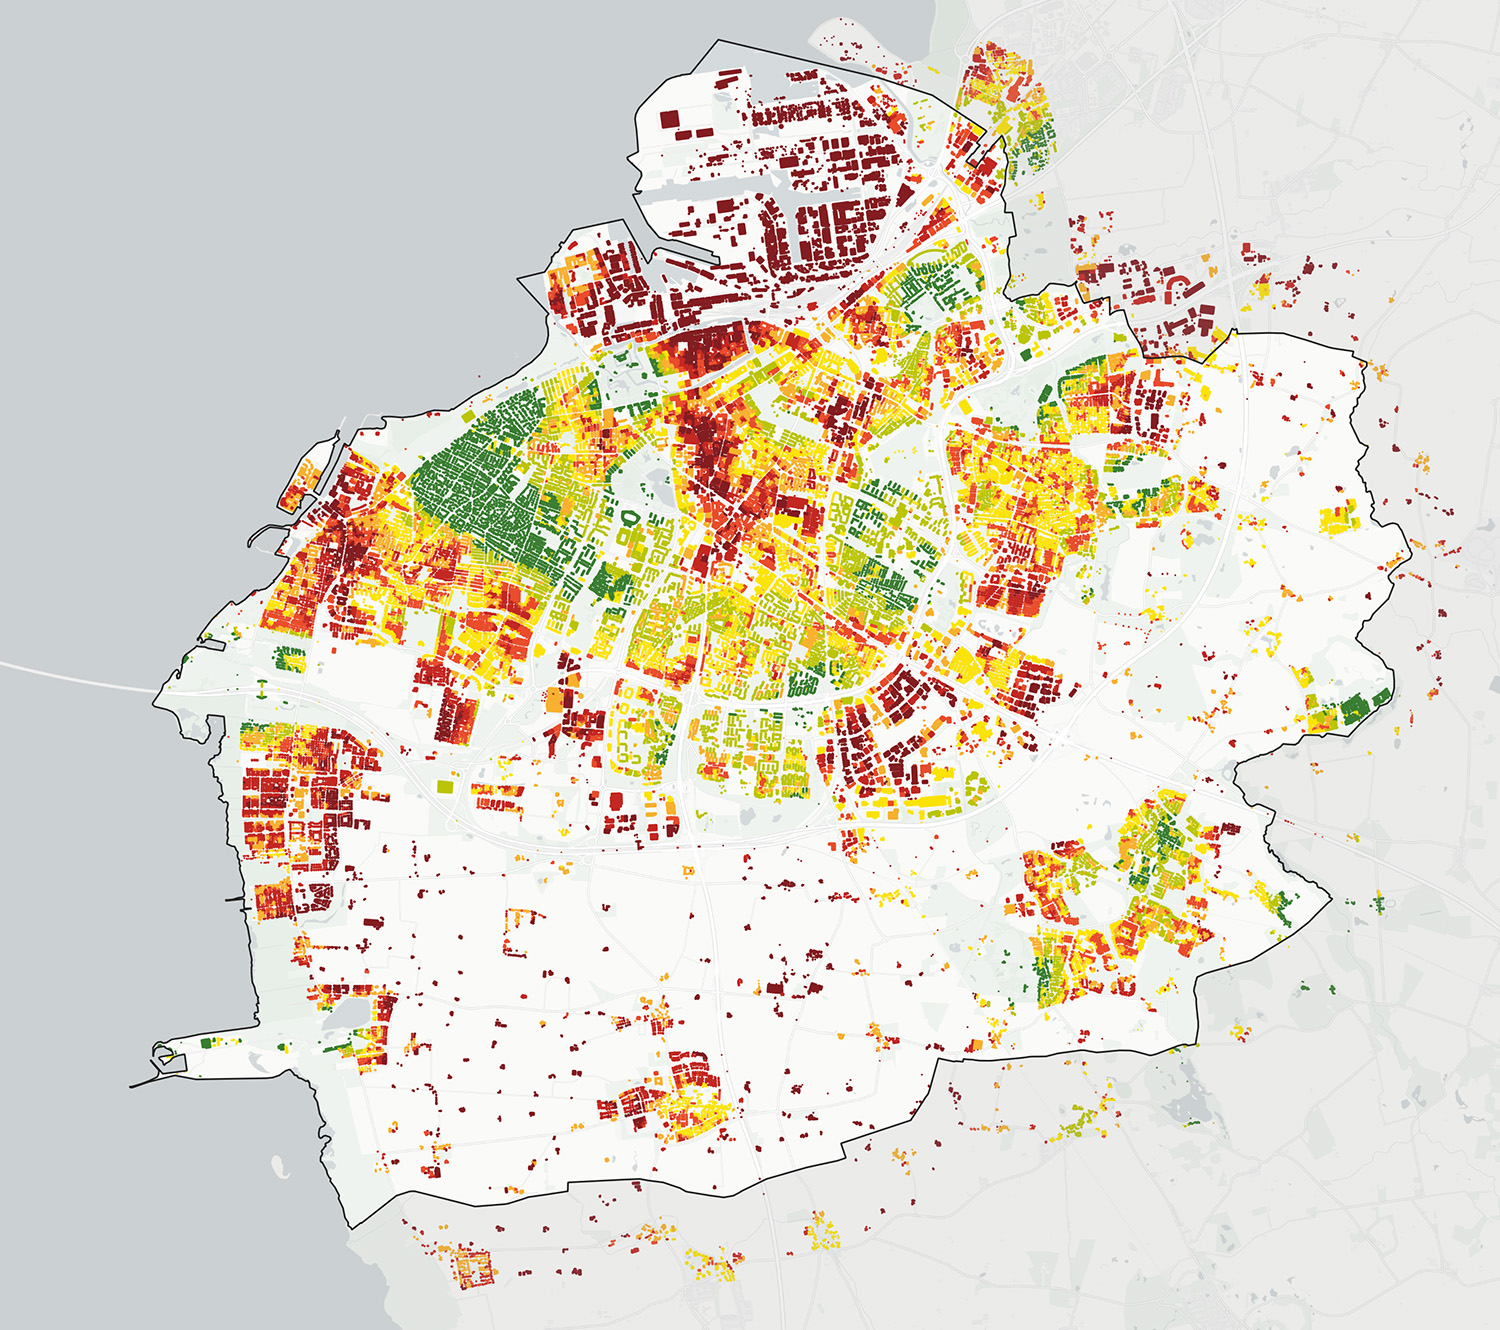
Figure 27. 3+30+300-rule overall score per building in Malmö, Sweden. Yellow and green colours indicate buildings and areas with positive 3+30+300 scores, orange and red tones depict scores that are too low.
In Malmö much of the inner city as well as harbour and industry areas have substantial challenges and the dense urban form in the central parts makes it difficult to find space to add trees.
To investigate the relationship between green space on the one hand, and on the other tree access and socioeconomic variables data on employment rate, median income, proportion of population with first and second generation migrants (here defined as born outside of Sweden or has two parents born outside Sweden) as well as number of sick days has been compared to the results of the 3+30+300 analysis. Additionally, three areas in Malmö are defined by the Swedish police as vulnerable (Table 5). These are marked with black outlines in the maps below (Figures 28–31).
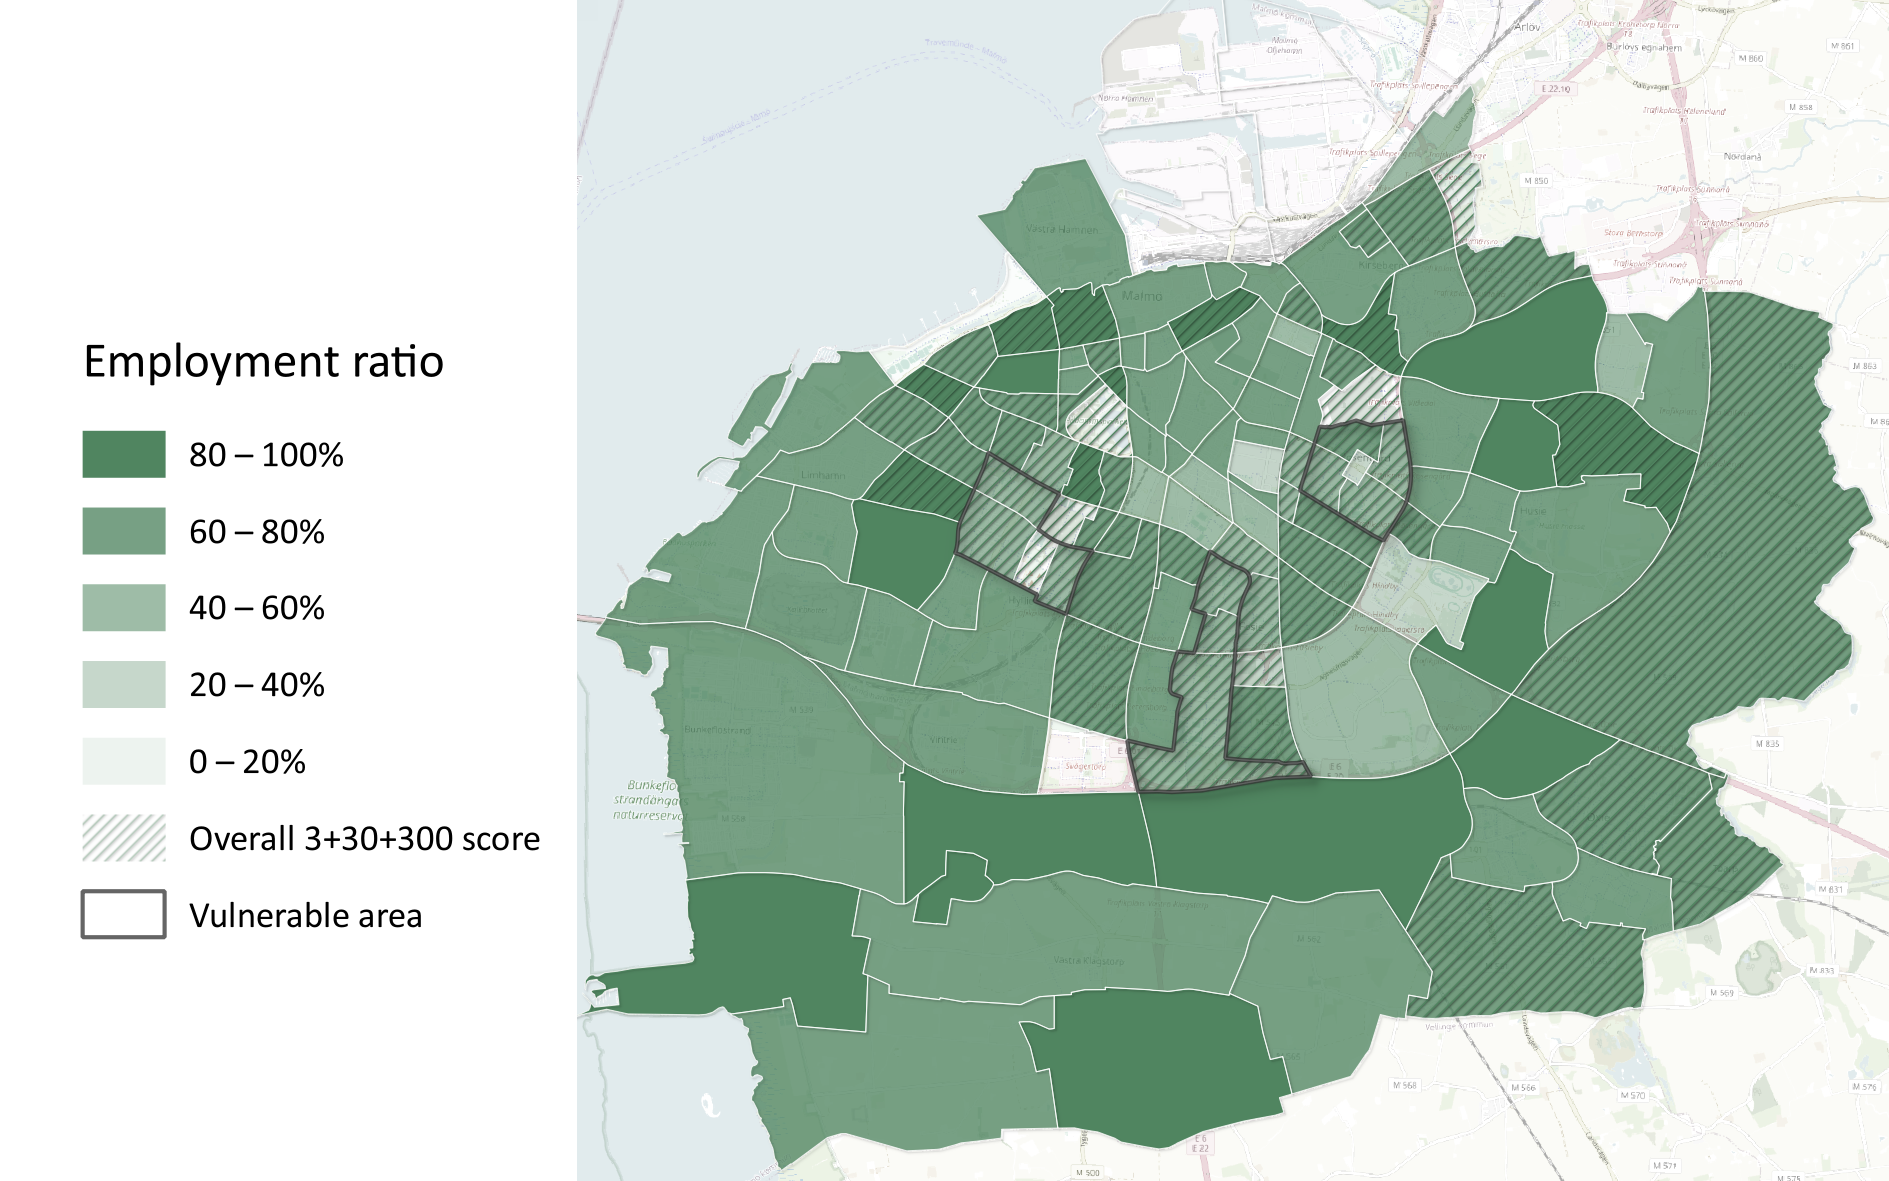
Figure 28. Map showing employment rate in % as well as the threshold for acceptable level of 3+30+300 (i.e. overall score over 6 out of 10). The areas defined by the Swedish police as vulnerable are framed in black.
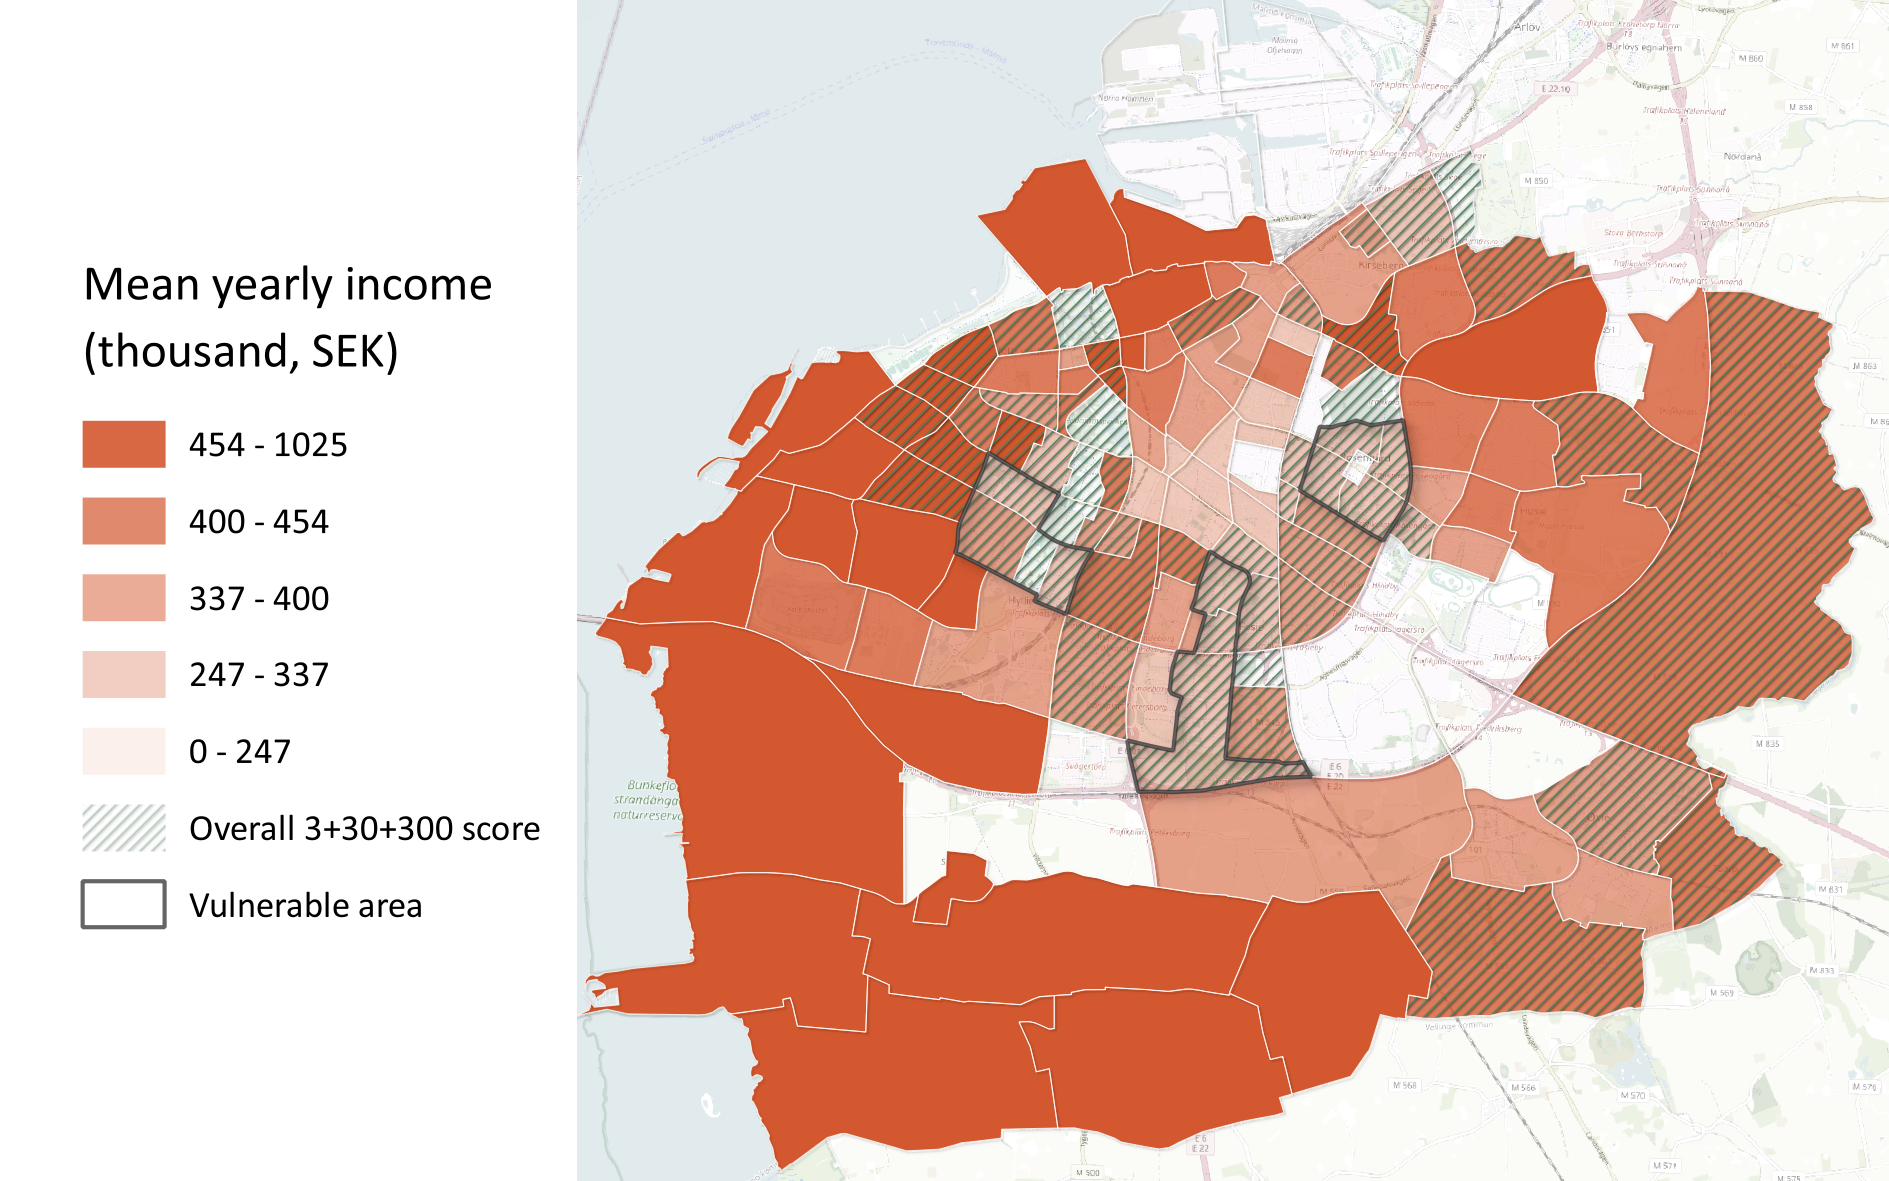
Figure 29. Map showing mean yearly income as well as the threshold for acceptable level of 3+30+300 (i.e. overall score over 6 out of 10). The areas defined by the Swedish police as vulnerable are framed in black.
Looking at both employment rate and mean yearly income, areas that score acceptable on 3+30+300 can have both high and low scores on these socioeconomic aspects (Figure 29). Additionally, the three defined vulnerable areas in Malmö score relatively low on both these factors. As the maps above show, there is no visible relationship between these parameters of socioeconomic vulnerability and access to green space or trees.
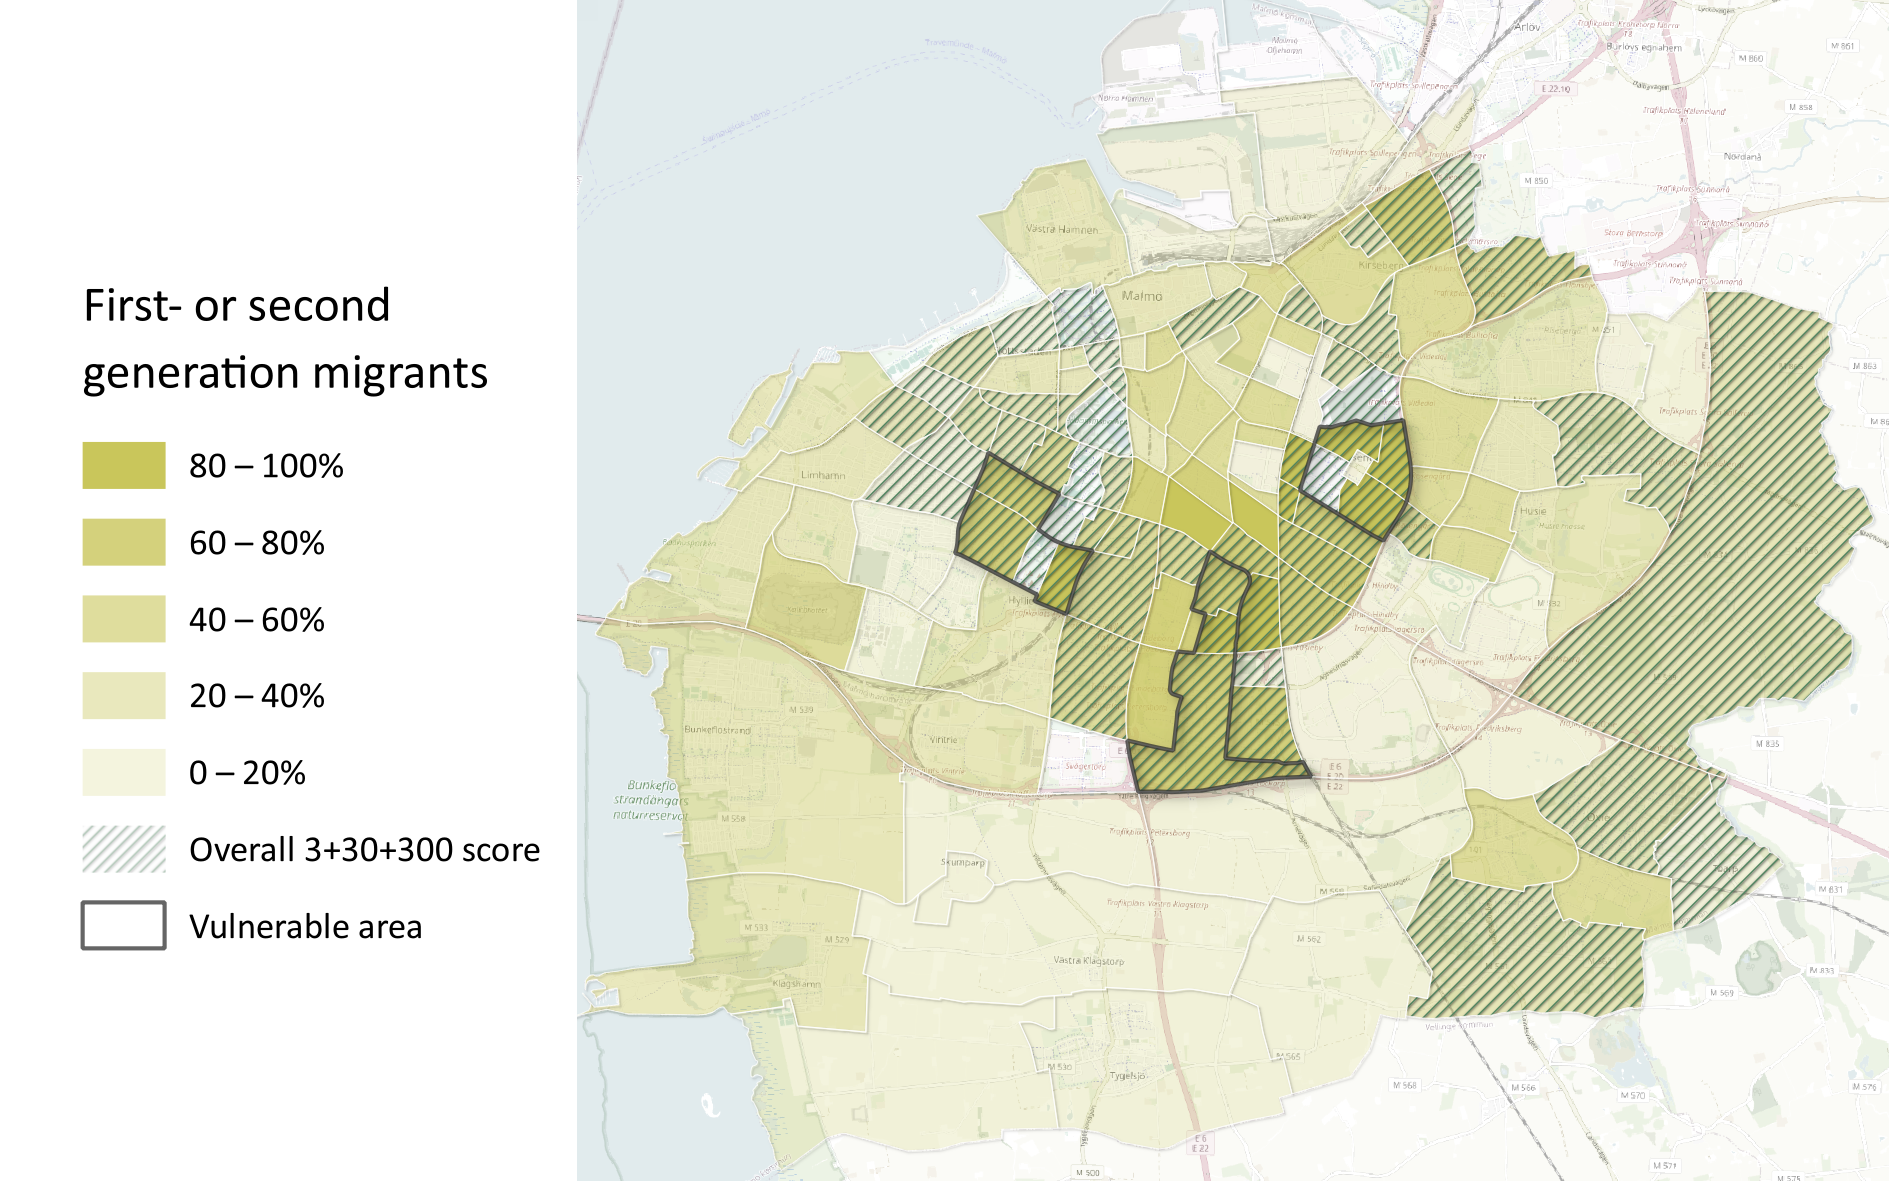
Figure 30. Map showing mean yearly sick days rate as well as the threshold for acceptable level of 3+30+300 (i.e. overall score over 6 out of 10). The areas defined by the Swedish police as vulnerable are framed in black.
For yearly sick days, a majority of the areas that score high on this variable also have an acceptable 3+30+300 level (Figure 30), indicating that health correlates to the socioeconomic parameters rather than green space accessibility in Malmö.
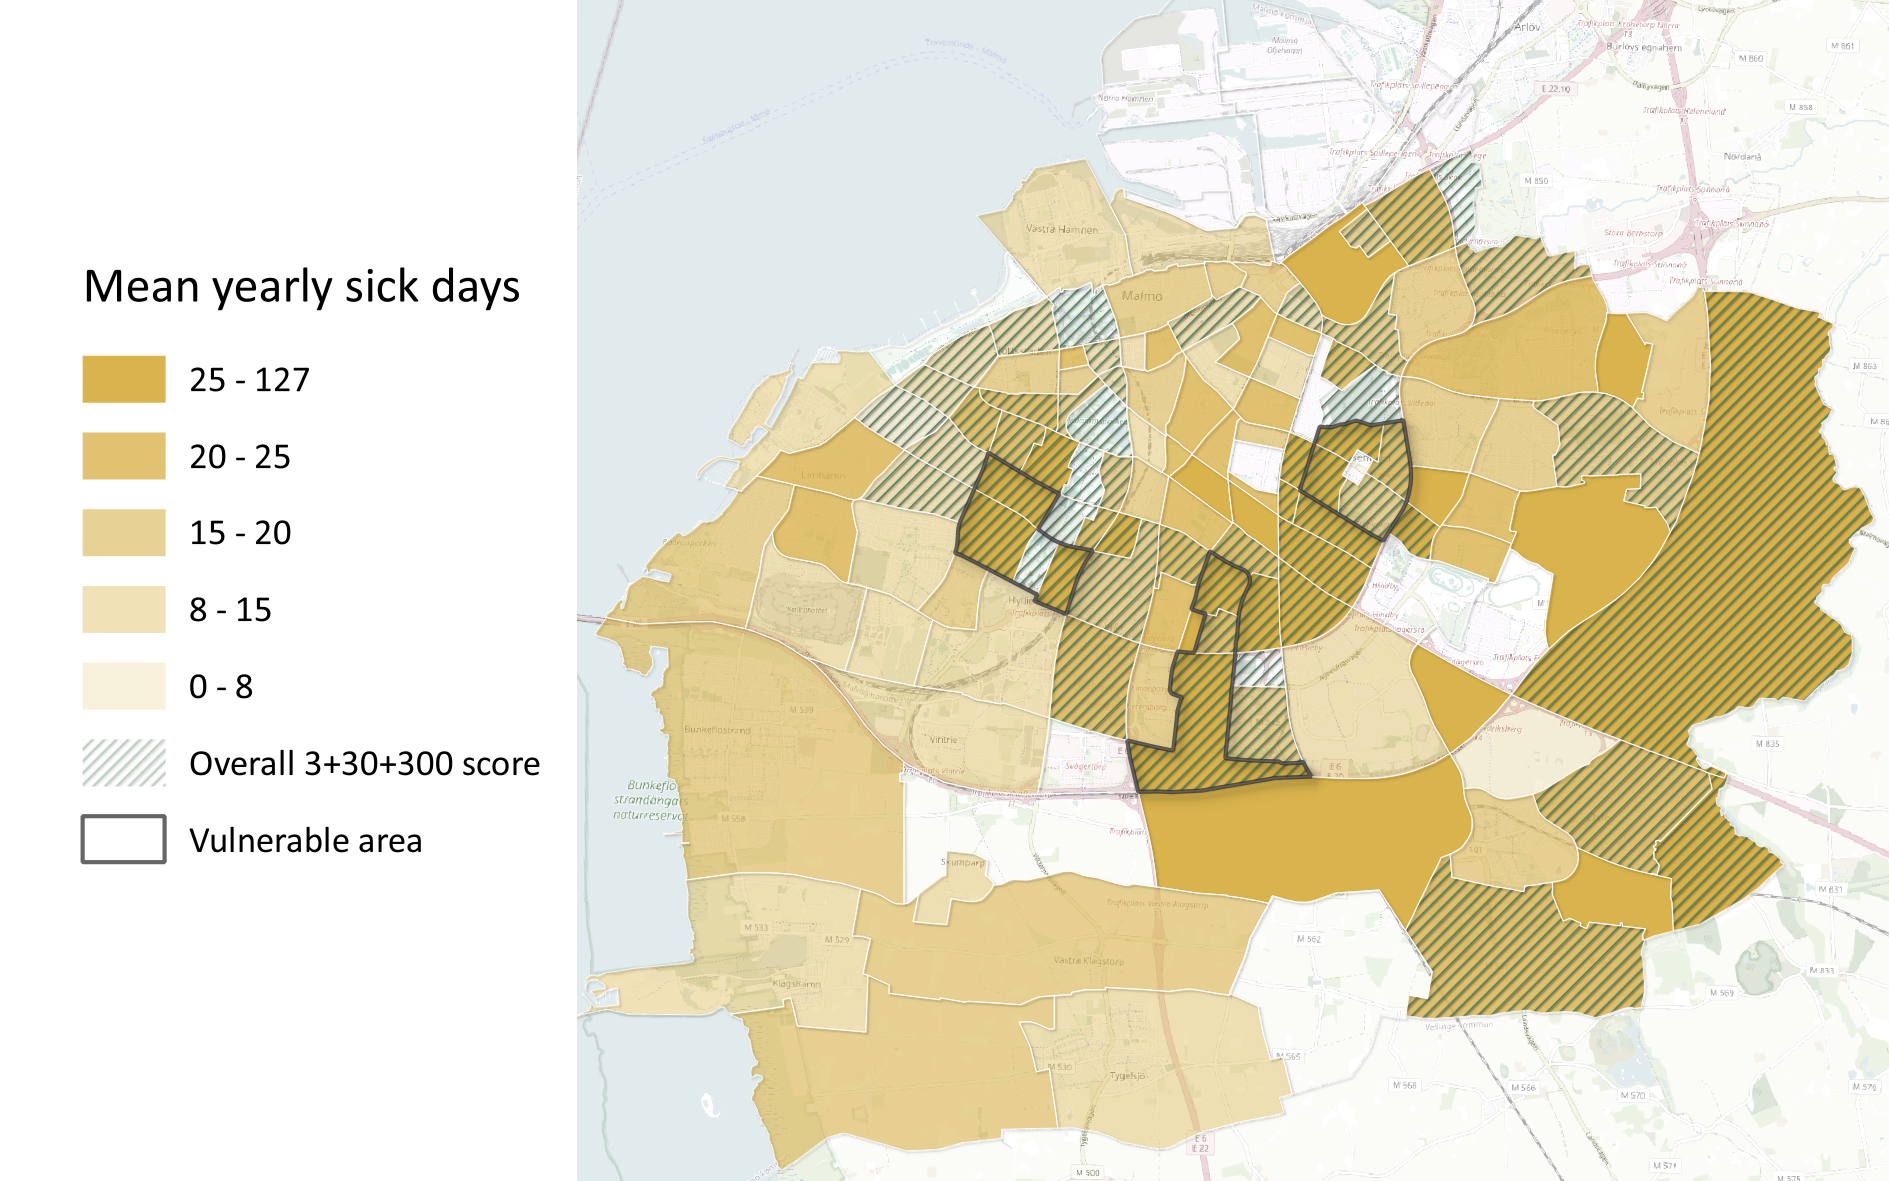
Figure 31. Map showing percentage of first and second generation migrants as well as the threshold for acceptable level of 3+30+300 (i.e. overall score over 6 out of 10). The areas defined by the Swedish police as vulnerable are framed in black.
For ethnicity, here measured by the presence of first or second-generation immigrants, areas with a high percentage of immigrants also reached an acceptable level of 3+30+300 (Figure 31). In Figure 32 below the result has been plotted showing the percentage of first and second generation migrants on the y-axis and the 3+30+300 school note on the x-axis. The results show a tendency that areas with a high share of migrants also have a good fulfilment of the 3+30+300 rule. The calculated r-squared is 0.05. Please note, however, that although linking ethnicity and cultural background to canopy cover and green space provision is common in e.g., North America and the United Kingdom, this is a much more contentious issue in the Nordic Region and should always be handled with great care.
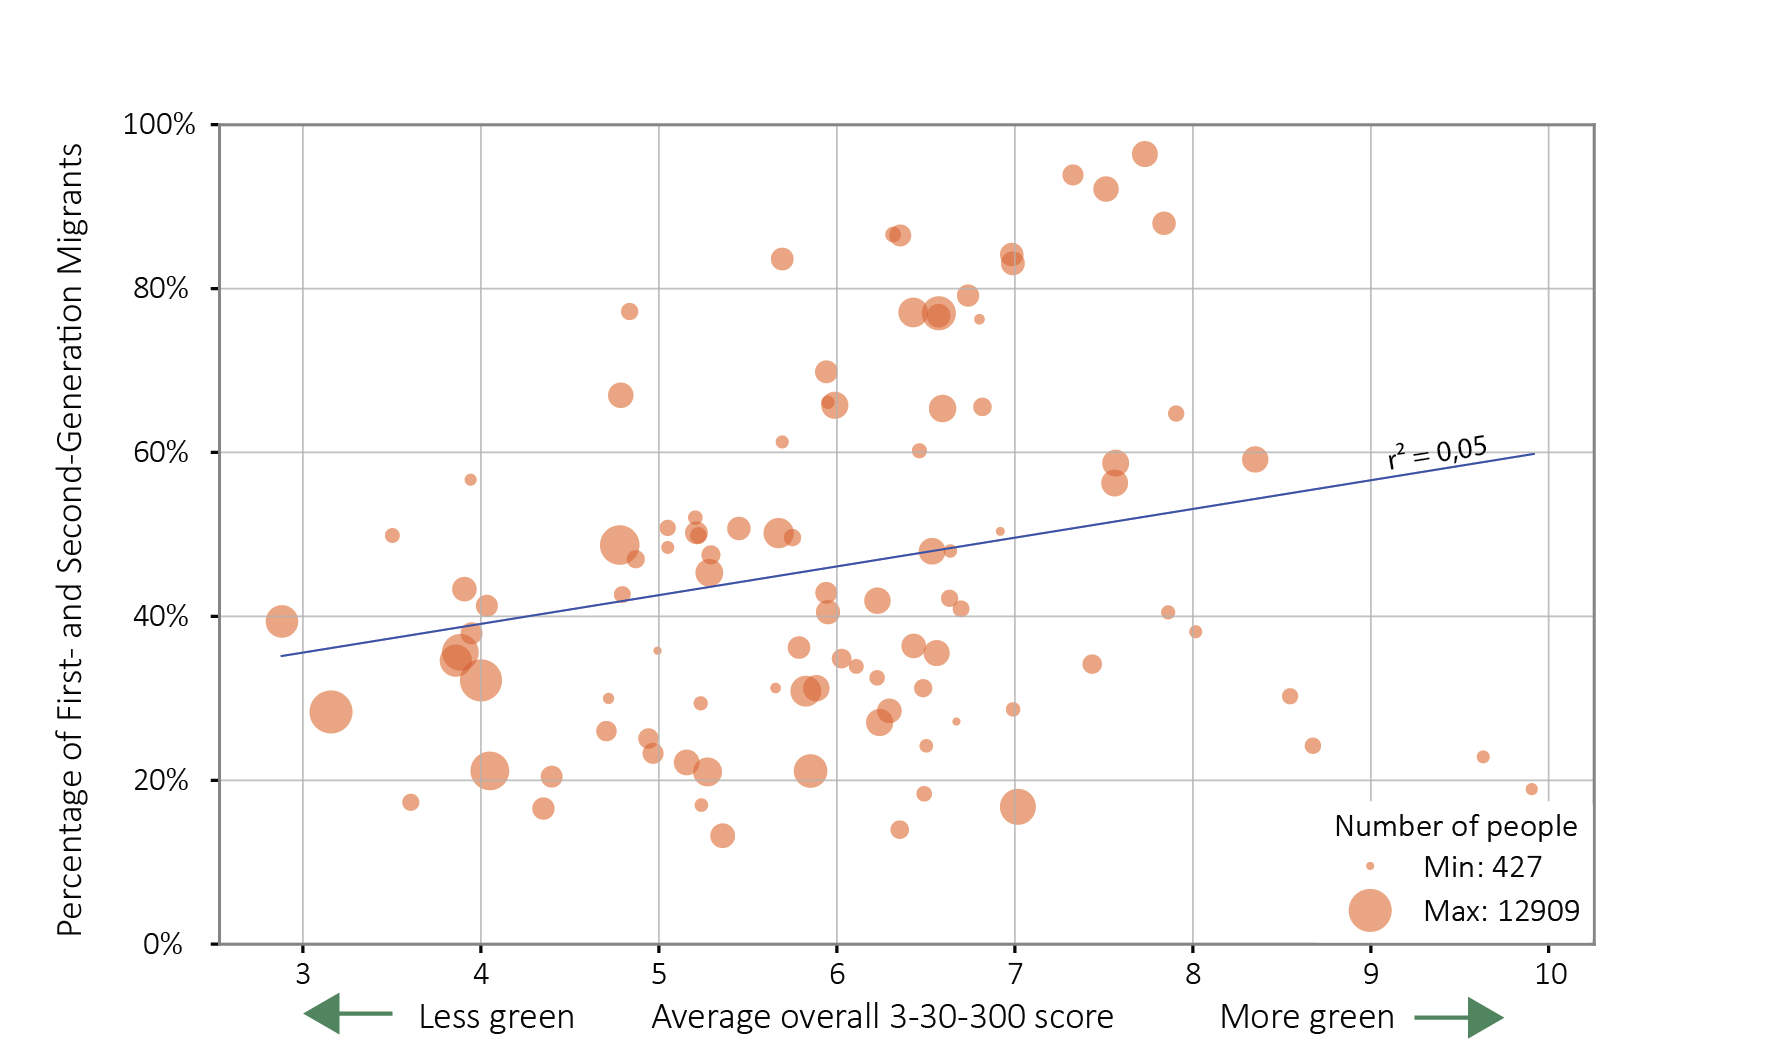
Figure 32. Correlation between share of first and second generation immigrants and the 3+30+300 school note for Malmö, Sweden.
Overall score | Mean number of trees seen from each building | Percentage tree cover | Mean distance to green space (m) | |
Malmö (city wide) | 6.3 (standard deviation 1.62) | 15.0 | 18.7 | 100.0 |
Nydala/Hermodsdal/Lindängen | 6.5 | 16.0 | 23.3 | 47.5 |
Holma/Kroksbäck/Bellevuegården | 7.1 | 23.4 | 26.5 | 55.4 |
Rosengård | 7.5 | 40.0 | 28.9 | 49.4 |
Table 6. The 3+30+300 overall score for Malmö as a whole and the three areas defined by the Swedish police as vulnerable.
Looking at the numbers, Table 6 lists the overall score, mean number of trees seen from each building, the percentage of tree cover, and the mean distance to a public green space for Malmö and the three defined vulnerable areas. The vulnerable areas score better on all parameters than Malmö as a whole. This paints a different picture than the usual negative correlation between tree canopy cover and green space access on the one hand, and higher vulnerability of local communities on the other found in international studies (e.g., Astell-Burt et al., 2014; Cusick, 2022; Konijnendijk, 2022).
As seen in the current adherence to the 3+30+300 rule section above, Nordic cities generally score high, and this is also evident in socioeconomically vulnerable areas as shown here in Malmö. Ongoing research at the Swedish University of Agricultural Sciences (slu.se, 2024) working with developing new methods to assess environmental justice in relation to green space and socioeconomic status shows preliminary results similar to the Yggdrasil analysis. By combining tree cover, square metres of green space per resident, and distance from home to green spaces, and by focusing on the socioeconomic aspects income per household, age dependency ratio (i.e., share of household dependent on the income of family members such as children and elderly), education level, and employment rate, the project shows that the city don’t have a major problem with the inequitable distribution of greenery.
In the analysis below, looking at the other 8 cities in the Yggdrasil project, similar results can be found. While there are studies showing more conventional results of environmental justice in Oslo (Venter at al., 2023) the results in the Yggdrasil project indicate that the relationship between socioeconomic vulnerability and green space and urban trees has a Nordic dimension that requires further study and consideration in planning and policy. Further, it is crucial to note that this analysis does not take into account the quality of local green spaces, and their use and appreciation by local communities.
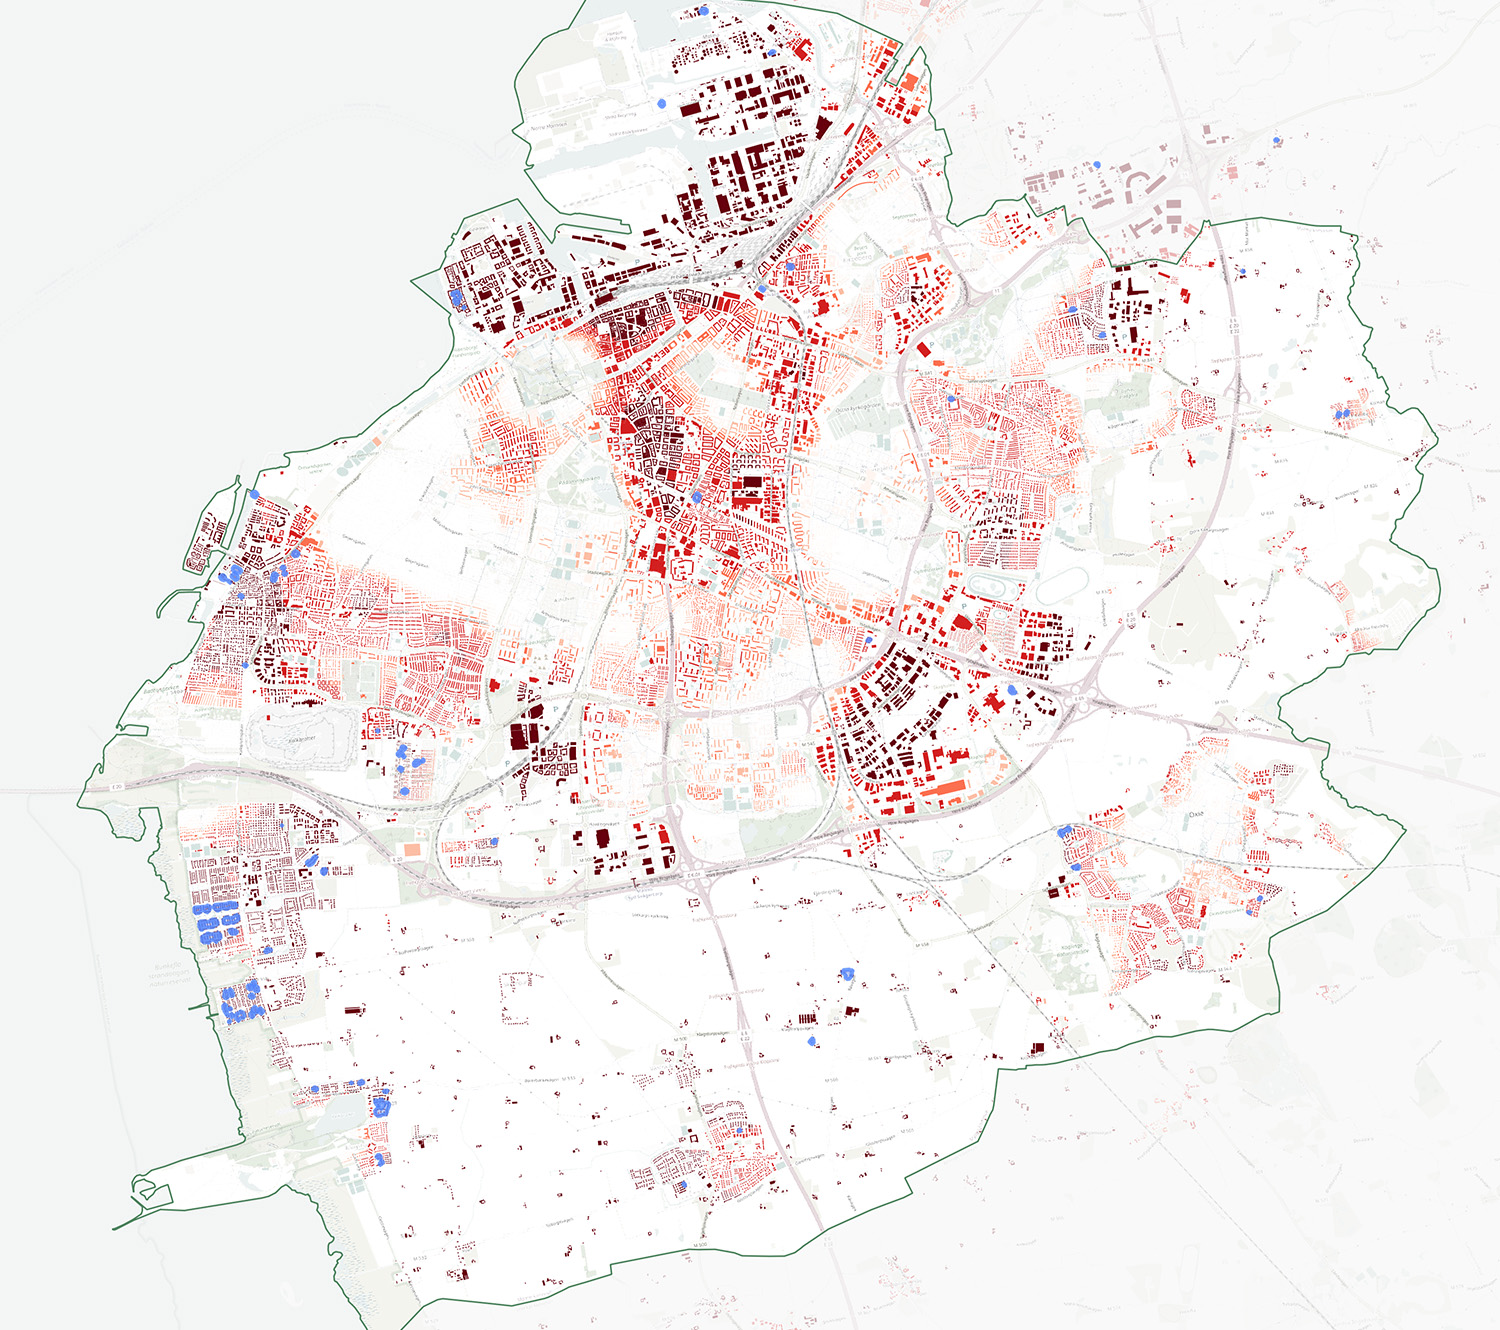
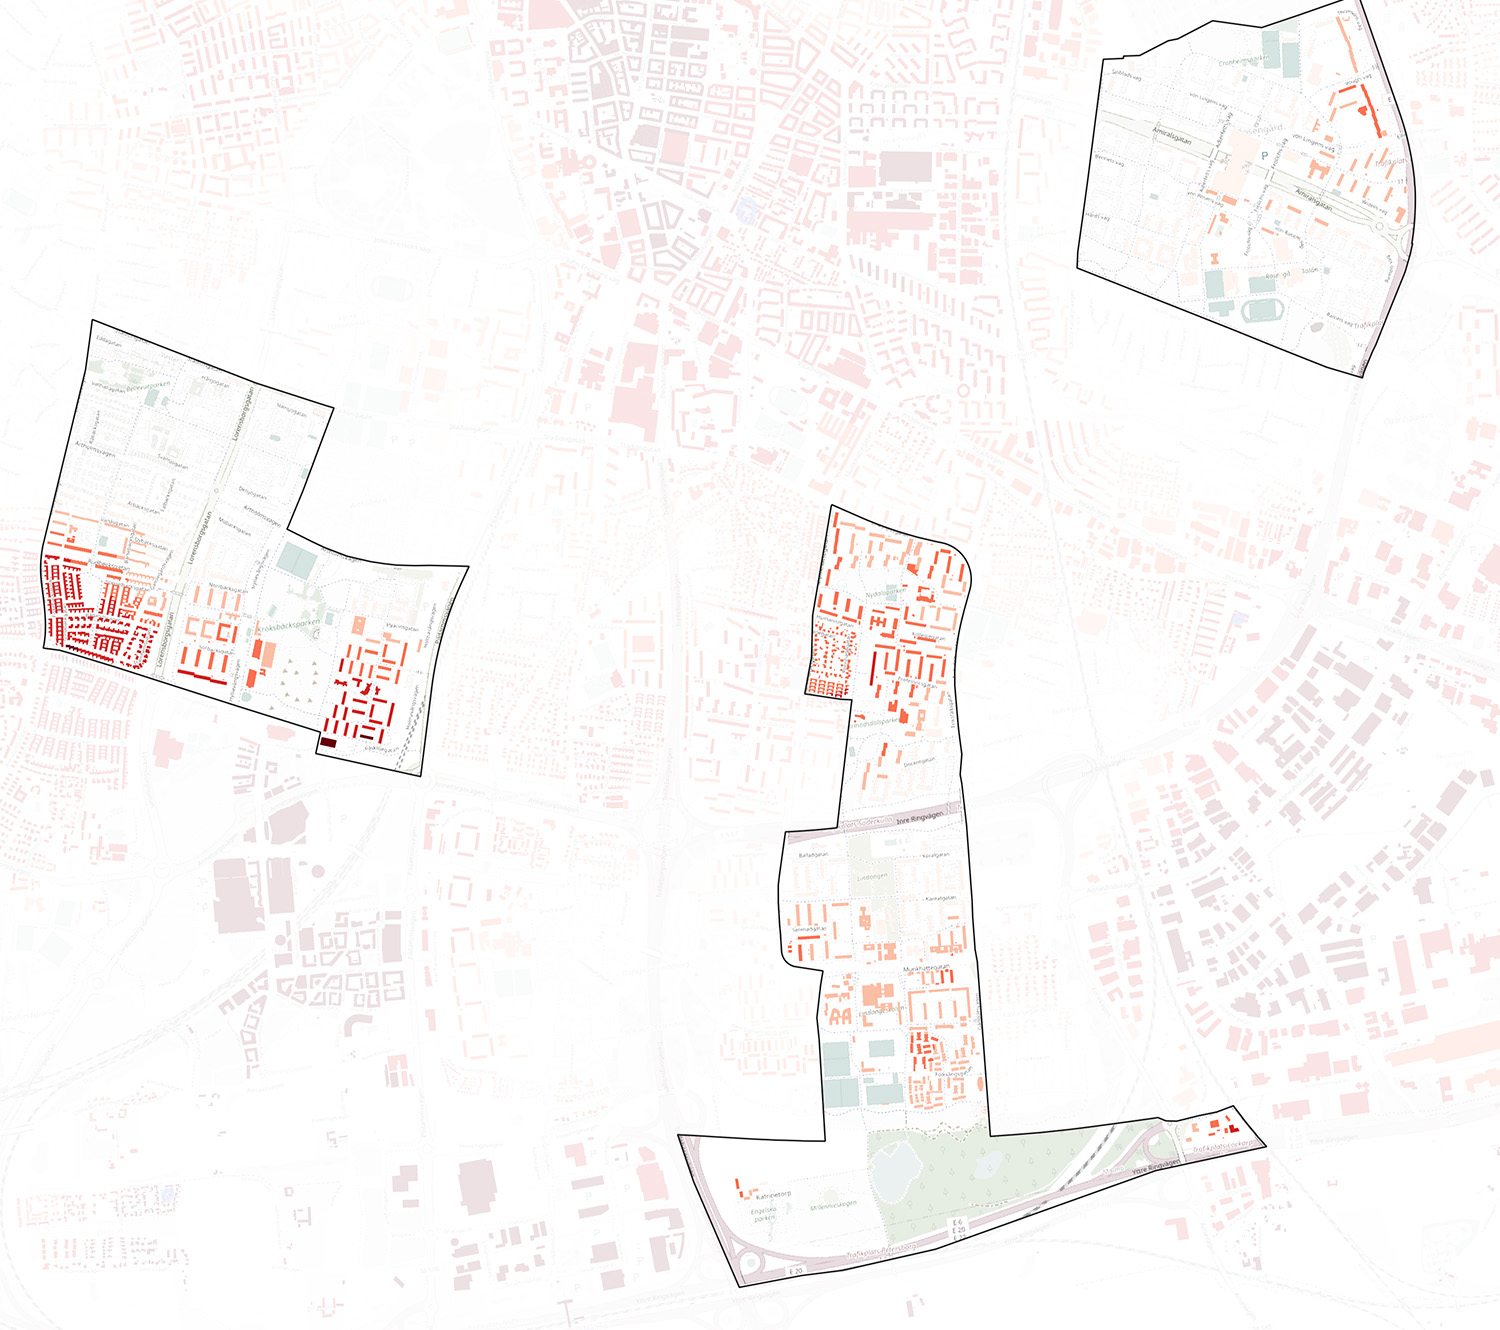
Figure 33. Gap analysis on the 30-rule for Malmö and gap analysis showing the defined vulnerable areas.
The defined vulnerable areas scores are all below 30% tree cover, ranging between 23.3 and 28.9. Although this shows a deficiency of trees, they do not represent the areas where the largest gaps are, and as these are areas with a high share of open space new trees could be planted to reach the 30% score (Figure 33).
Vulnerable areas and green space in the case cities
Table 7 provides an overview of local areas that are defined as vulnerable in the participating municipalities. As can be seen, municipalities use a wide range of definitions and approaches.
Vulnerable areas in the participating municipalities | |
Bergen | According to the Bergen municipality public health overview residents in Bergen experience a good quality of life, but there are differences related to age, level of education, and place of residence. While living standards in international comparison are high, there is a tendency towards a geographical accumulation of factors that have a negative impact on health. An overall index shows that the challenges in Bergen are greatest in Solheim South, Loddefjord, Solheim North, Ytre Arna, and Gullfjellet North (Bergen Municipality, 2024). |
Holbæk | In Holbæk, Agervang/ Grønneparken is identified as a prevention area (BL, undated). |
Kolding | In Kolding the area Skovvejen/Skovparken is defined as a vulnerable area as well as a parallel society and transformation area, being the worst category in the Danish classification system. Munkebo is defined as a prevention area, pointing out that the area has socioeconomic challenges (BL, undated). |
Reykjavik | Reykjavik, faces certain socioeconomic challenges, despite the country's overall high standard of living. Reykjavik has experienced a housing shortage in recent years, particularly after the 2008 financial crisis. Property prices and rents have surged, leading to a significant strain on low-income families and young adults, especially in central areas. This has pushed many residents to seek housing further away from the city centre, contributing to social segregation. Vulnerable groups often struggle to access affordable housing, which exacerbates socioeconomic issues. Breiðholt is one of Reykjavik’s largest and most socioeconomically diverse areas but has a higher concentration of social housing, and a significant immigrant population, which has faced challenges related to unemployment, language barriers, and income disparity. The area has also been the focus of social welfare and community engagement projects by the city to improve living conditions and social inclusion. Within Breiðholt, the Fellahverfi area is particularly noted for its socioeconomic challenges. It has been known for higher unemployment rates and a higher proportion of lower-income households compared to other parts of Reykjavik (Iceland monitor, 2021; Reykjavik.se, undated). |
Stavanger | According to Stavanger municipality, the distribution of living conditions in Stavanger is not linked to district boundaries or a clear east/west divide. Stavanger has a patchwork structure with an uneven distribution of living conditions. Areas with challenges have been identified in the eastern and northern parts of Storhaug district, the eastern part of Eiganes and Våland district and the north-eastern part of Hillevåg district. At the same time, the municipality stresses that although some areas are more likely to have concentrations of groups with poor living conditions, these are still dominated by people without living conditions problems, and that the data does not provide a basis for characterising areas as good or bad (Stavanger municipality, 2017). |
Tampere | Tampere has some areas with higher than average unemployment, especially among young people and immigrants. The neighbourhood Tesoma has been highlighted for socioeconomic problems, including higher unemployment and lower average incomes compared to other parts of the city. Efforts have been made to improve the living conditions and safety of Tesomas residents. Residents have pointed out issues such as disturbances and a lack of leisure activities, while also praising the natural surroundings, including nearby lakes and forests (Tampere municipality, 2024). |
Turku | Turku has struggled for periods with higher unemployment compared to the national average, especially among young people and residents with immigrant backgrounds. Neighbourhoods with high unemployment also tend to have lower incomes and a higher proportion of residents dependent on social benefits, such as social assistance. Segregation in the housing market is a growing problem in Turku, with differences between neighbourhoods based on income and education levels becoming more apparent in recent decades. The area Varissuo, a suburb of Turku, has been particularly highlighted as an area with socioeconomic challenges. It has a high proportion of residents with an immigrant background, relatively high unemployment rates, and a low average income compared to other parts of the city (Laakkonen, 2022). |
Umeå | Umeå is the largest city in Sweden that does not have any neighbourhoods defined by the police as vulnerable. At the same time, the municipality, in cooperation with the police, has identified the areas Mariehem, Ålidhem, and Ersboda in northeastern Umeå as areas of concern. According to the social services in Umeå, these areas are socioeconomically vulnerable, with more overcrowding, less disposable income, and greater dependence on income support than Umeå in general (Umeå municipality, 2020). |
Malmö | In Malmö, the Swedish police has defined three areas as vulnerable: Nydala/Hermodsdal/Lindängen, Holma/Kroksbäck/Bellevuegården and Rosengård. |
Table 7. Overview of local areas in the participating municipalities that are defined as vulnerable.
Of all the identified vulnerable areas, only two do not reach an acceptable level of the combined 3+30+300 score (Table 8). These are the central part of Stavanger and Fellahverfi. Fellahverfi is a part of the larger area Breidholt that reaches an acceptable score of 6.9 out of 10. All areas reach the 3 trees rule; the lowest number is the central part of Stavanger which still has a mean of 9.9 trees from each building. Tree coverage is the main challenge with 7 of the 17 vulnerable areas not reaching 30%, but the lowest number is still 13.4% in Fellahverfi. All areas have less than 300 metres to a public green space; the longest mean distance is 270 metres in central Stavanger. These findings confirm the earlier statement about the Nordic Region showing different correlations between tree cover, green space access, and the presence of vulnerable populations than many other countries.
Table 8. Results of 3+30+300 for the nine case cities (city-wide) and the identified vulnerable areas. *Note that Fellahverfi is part of the larger Breidholt area.
Overall score | Mean number of trees seen from each building | Mean percentage tree cover | Mean distance to green space (m) | |
Sweden | ||||
Umeå (city wide) | 9.1 (standard deviation 2.01) | 43.5 | 56.3 | 33.1 |
Ersboda | 8.9 | 32.2 | 47.5 | 83.1 |
Mariehem | 9.2 | 40.0 | 43.8 | 53.7 |
Ålidhem | 7.9 | 22.4 | 38.2 | 154.2 |
Malmö (city wide) | 6.3 (standard deviation 1.62) | 15.0 | 18.7 | 100.0 |
Nydala/Hermodsdal/Lindängen | 6.5 | 16.0 | 23.3 | 47.5 |
Holma/Kroksbäck/Bellevuegården | 7.1 | 23.4 | 26.5 | 55.4 |
Rosengård | 7.5 | 40.0 | 28.9 | 49.4 |
Norway | ||||
Stavanger (city wide) | 8.3 (standard deviation 1.62) | 28.8 | 36.8 | 74.7 |
Stavanger vulnerable areas | 4.9 | 9.9 | 19.0 | 270.5 |
Bergen (city wide) | 9.5 (standard deviation 1.32) | 43.3 | 63.6 | 45.1 |
Ytre Arna | 9.9 | 49.9 | 77.7 | 17.3 |
Loddefjord | 9.8 | 43.7 | 62.9 | 39.9 |
Solheim Sör | 8.5 | 29.4 | 45.4 | 106.8 |
Solheim Nord | 7.6 | 19.4 | 39.2 | 206.7 |
Denmark | ||||
Kolding (city wide) | 7.3 (standard deviation 1.97)) | 22.4 | 26.2 | 55.4 |
Munkebo | 6.2 | 25.0 | 27.5 | 168.3 |
Skovvejen | 6.8 | 25.7 | 24.5 | 42.9 |
Holbaek (city wide) | 6.9 (standard deviation 1.95) | 22.5 | 21.1 | 51.3 |
Agervang | 7.9 | 26.1 | 38.0 | 26.4 |
Finland | ||||
Turku (city wide) | 9.2 (standard deviation 1.55) | 47.0 | 55.2 | 41.2 |
Vassisuo | 9.7 | 44.9 | 62.7 | 83.3 |
Tampere (city wide) | 9.4 (standard deviation 1.28) | 48.0 | 63.4 | 55.9 |
Tesoma | 9.8 | 66.9 | 65.2 | 51.2 |
Iceland | ||||
Reykjavik (city wide) | 6.8 (standard deviation 1.83) | 22.0 | 18.3 | 118.2 |
Breidholt | 6.9 | 26.8 | 23.3 | 40.5 |
Fellahverfi* | 5.7 | 20.9 | 13.4 | 39.2 |
Nordic dimensions of socioeconomic vulnerability and access to green space and trees
As mentioned, the analysis above shows that, for the Nordic case studies, there is no direct correlation between socioeconomic vulnerability and lack of green space and urban trees. In fact there are indications that this correlation could in fact move in the opposite direction. At the same time, the results do not take into account the actual use of green space, perceived access, safety and quality of the green spaces. Studies from the NORDGREEN – Smart Planning for Healthy and Green Nordic Cities project show that objective distance and perceived nearness to green space do not always correlate (Nordh et al., 2024). The study showed, using Täby outside Stockholm as a case, that the more satisfied people were with their access to green spaces and safety outdoors in the evenings and nights, the more satisfied they were with their living environments.
In one Finnish study, residents in high and low socio-economic status (SES) areas experienced different quality features in their nearest green spaces (Viinikka et al., 2023). Low SES areas were closer to recreational facilities and pathways, while high SES areas benefited from better access to larger green spaces and forests. A Swedish study showed that greater access to total and publicly available urban green spaces is beneficial for groups with lower SES from a health perspective (Mattisson et al., 2022). However, access to high-quality publicly available urban green spaces was lower in these areas, particularly regarding noise levels, indicating a negative impact.
In Estonian cities, with results published as a conference abstract (Orru et al., 2024), the potential for improved population health by reducing “green inequality” was, however, demonstrated when comparing maximum residential greenness exposure (e.g., 0.49 in Tartu) with the average exposure (e.g., 0.29 in Tartu). Health impact assessments indicated that eliminating this inequality could prevent approximately 823 premature deaths and 9,854 years of life lost, leading to a potential life expectancy increase of 0.59 years and savings of €463.1 million in external health costs (Orru et al., 2024). The greatest health benefits were found in larger cities, where life expectancy could increase by up to 1.49 years. Notably, Tartu exhibited profound green inequality, as most residents were exposed to significantly lower levels of greenness despite the city having large green areas that comprise 25% of its total area.
Many of the areas identified as vulnerable in the present analysis were built in the late 1960s and 1970s. All of the defined vulnerable areas in Sweden are part of the so-called “Million program” which was a large public housing program implemented in Sweden between 1965 and 1974 (Photo 14). Also, the areas Breidholdt, Tesoma, and Varissou are from roughly the same time period; construction of Breidholdt started in 1966, Tesoma was built in the 1960s, and construction of Varissou started 1975. These areas have a similar building typology with large-scale apartment buildings with significant areas of preserved nature around them. In Norway, the defined vulnerable areas are much more diverse in building typology and age, although apartment buildings dominate.
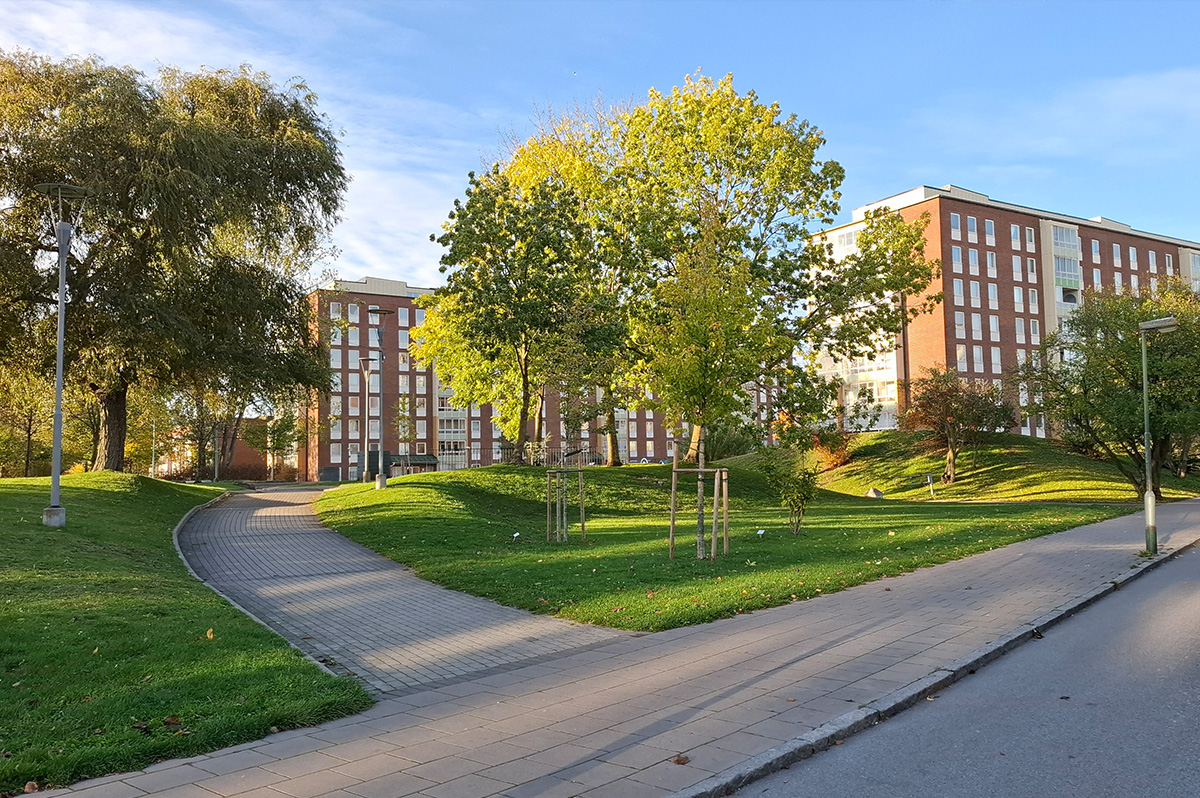
Photo 14. Scene from the Rosengård district in Malmö, Sweden (photo by Wösel Thorensen).
Conclusions
In conclusion, the correlation between socioeconomic status on the one hand and urban green space and trees on the other has a specific Nordic dimension as many vulnerable areas have acceptable levels of green space from purely a geographical perspective. The Malmö case shows a relationship between the share of first- and second-generation migrants and the 3+30+300 score, with areas hosting a higher share of migrants being increasingly greener. This relationship should not necessarily be seen as an actual correlation but can be traced to the building typology dominating socioeconomically vulnerable areas in Malmö, and in several of the other Nordic cities that have been studied. At the same time, both researchers and governmental agencies express concern that vulnerable areas are more likely to experience the negative effects of a warmer climate with a stronger urban heat island effect. This also can be related to building typologies such as those of high rise apartment buildings with a high share of hard surfaces (such as parking lots) and low-quality urban green space in the form of short cut lawns. Further, as this analysis does not compare more vulnerable areas to more affluent ones, relative environmental justice can still be the case when areas with higher socioeconomic status can have more accessible green space and trees, also with higher quality than the vulnerable areas.
Two recent studies in Sweden have concluded that the green space in Swedish cities has decreased. In a study by Ekot (the Swedish national radio newsroom) green space has decreased in all major cities during the last five years with a total area of more than 1300 hectares (sr.se, 2024). Similar results can be found in a Husqvarna group’s Husqvarna Urban Green Space Index (HUGSI in brief, Husqvarna group, 2024) which uses AI to map green space in Sweden’s 20 largest cities. According to the index, 65 hectares of green space have disappeared in the cities during 2022–2023. While Ekot’s study indicates that socioeconomic areas have been especially affected by loss of green space, research has not had a focus on environmental justice.
As discussed above, there is no common definition of socioeconomic vulnerability in the Nordic Region. Parameters such as employment rate, educational level, income and public health as well as ethnicity are used but not in the same way or to the same extent. From an environmental vulnerability perspective, children, elderly, and chronically sick are often described as vulnerable groups being especially vulnerable to the negative health effects of a warmer climate and environmental factors such as pollution and noise. These are groups that often experience limited mobility which make their home environments more important. For prioritising investments in urban green space and trees vulnerable groups must therefore be taken into account. The vulnerable areas generally have a higher problem with health (as seen in the number of sick days in the Malmö study and argued by the Norwegian municipalities) and younger populations; these areas are therefore still important when allocating funds for urban green space, even though they score high or relatively high on 3+30+300.
As also discussed in the gap analysis, many of the areas that score low on 3+30+300 in the analysis are industrial areas and dense inner city areas. The former is a place where few people live, and the latter places that often are well connected with both public transport and other transportation infrastructure, making it easier to reach green space outside the city centre. Again, vulnerable groups might still not have the possibility to travel, making institutions for these groups, such as preschools, schools, hospitals and other health institutions, as well as elderly facilities, important focus areas when investing in urban green space and trees.
As also discussed in the gap analysis, many of the areas that score low on 3+30+300 in the analysis are industrial areas and dense inner city areas. The former is a place where few people live, and the latter places that often are well connected with both public transport and other transportation infrastructure, making it easier to reach green space outside the city centre. Again, vulnerable groups might still not have the possibility to travel, making institutions for these groups, such as preschools, schools, hospitals and other health institutions, as well as elderly facilities, important focus areas when investing in urban green space and trees.
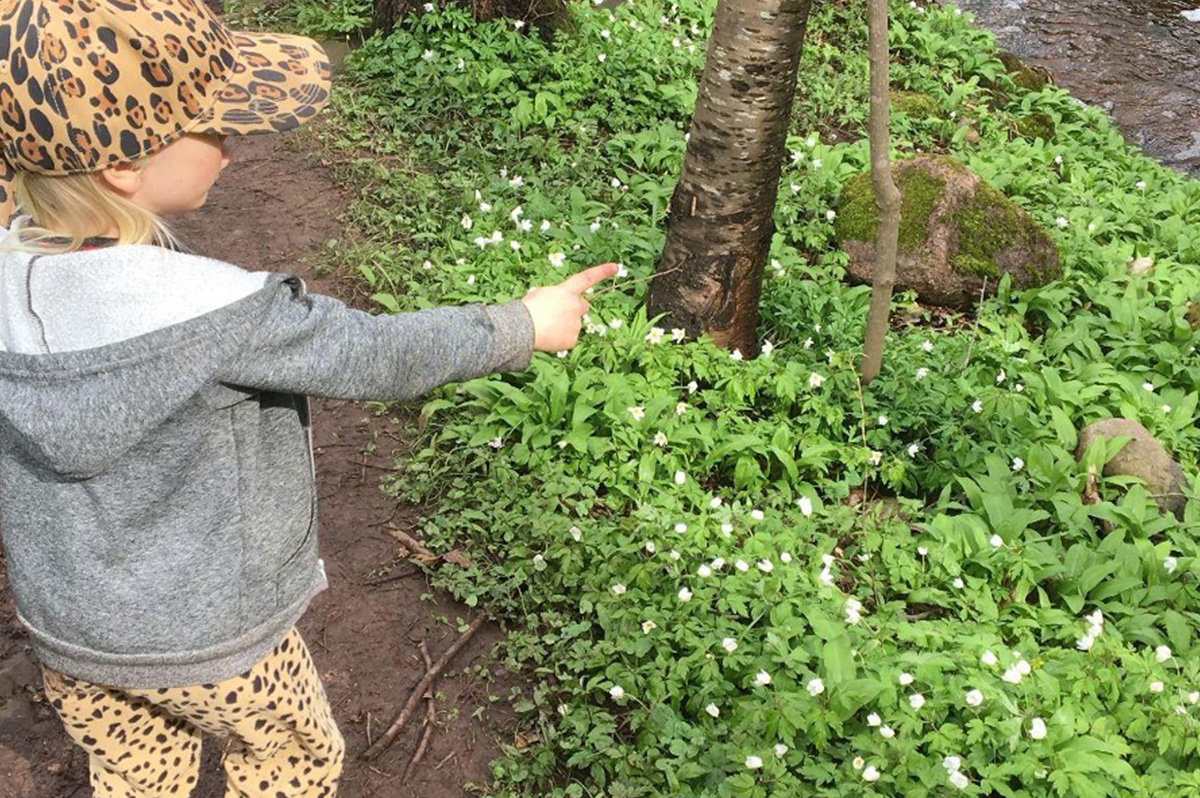
Photo 15. Having good access to trees and other nature is of particular importance to children (photo by Anna Maria Larson).
Comparison of tree cover data with climate-related parameters
Research consistently shows that trees and green spaces are vital for reducing noise, improving air quality, and strengthening climate resilience. Numerous scientific studies have emphasised the importance of trees in urban environments, underscoring their role in shaping sustainable city planning and ecological strategies (Nowak et al., 2014; Zhao et al., 2022; Gillerot et al., 2023).
Tree cover is particularly essential in mitigating the urban heat island (UHI) effect, a phenomenon where cities experience higher temperatures than nearby rural areas due to heat-retaining materials like concrete and asphalt. In densely populated regions, the lack of sufficient tree cover intensifies this effect, raising the risk of extreme heat during summer, especially during heatwaves (Sinha et al., 2022; Sheridan et al., 2024).
The global temperature rise of 1.1 °C has already triggered profound, unprecedented changes in the Earth’s climate system, including rising sea levels, more frequent and severe weather events, and the accelerated melting of sea ice. As the planet warms further, these disruptions will intensify, with profound implications for natural ecosystems and human societies.
One of the most critical consequences of additional warming is the escalation of extreme heat events. Every 0.5 °C increase in global temperatures leads to more frequent, severe, and prolonged heat waves, accompanied by heavier rainfall and longer droughts in various regions. For instance, with just 1.5 °C of warming, heatwaves that once occurred only once per decade may happen 4.1 times as often. If temperatures continue rising to 2 °C or higher, extreme heat events will become increasingly common and dangerous, pushing ecosystems and communities to the brink (IPCC, 2023).
In the Nordic countries, the growing risk of heatwaves is becoming more evident due to climate change, which is projected to increase both the frequency and intensity of extreme heat events (Figure 34). Regional heat maps based on IPCC’s forecast for future climate highlight the stark changes expected in these regions as global temperatures rise.
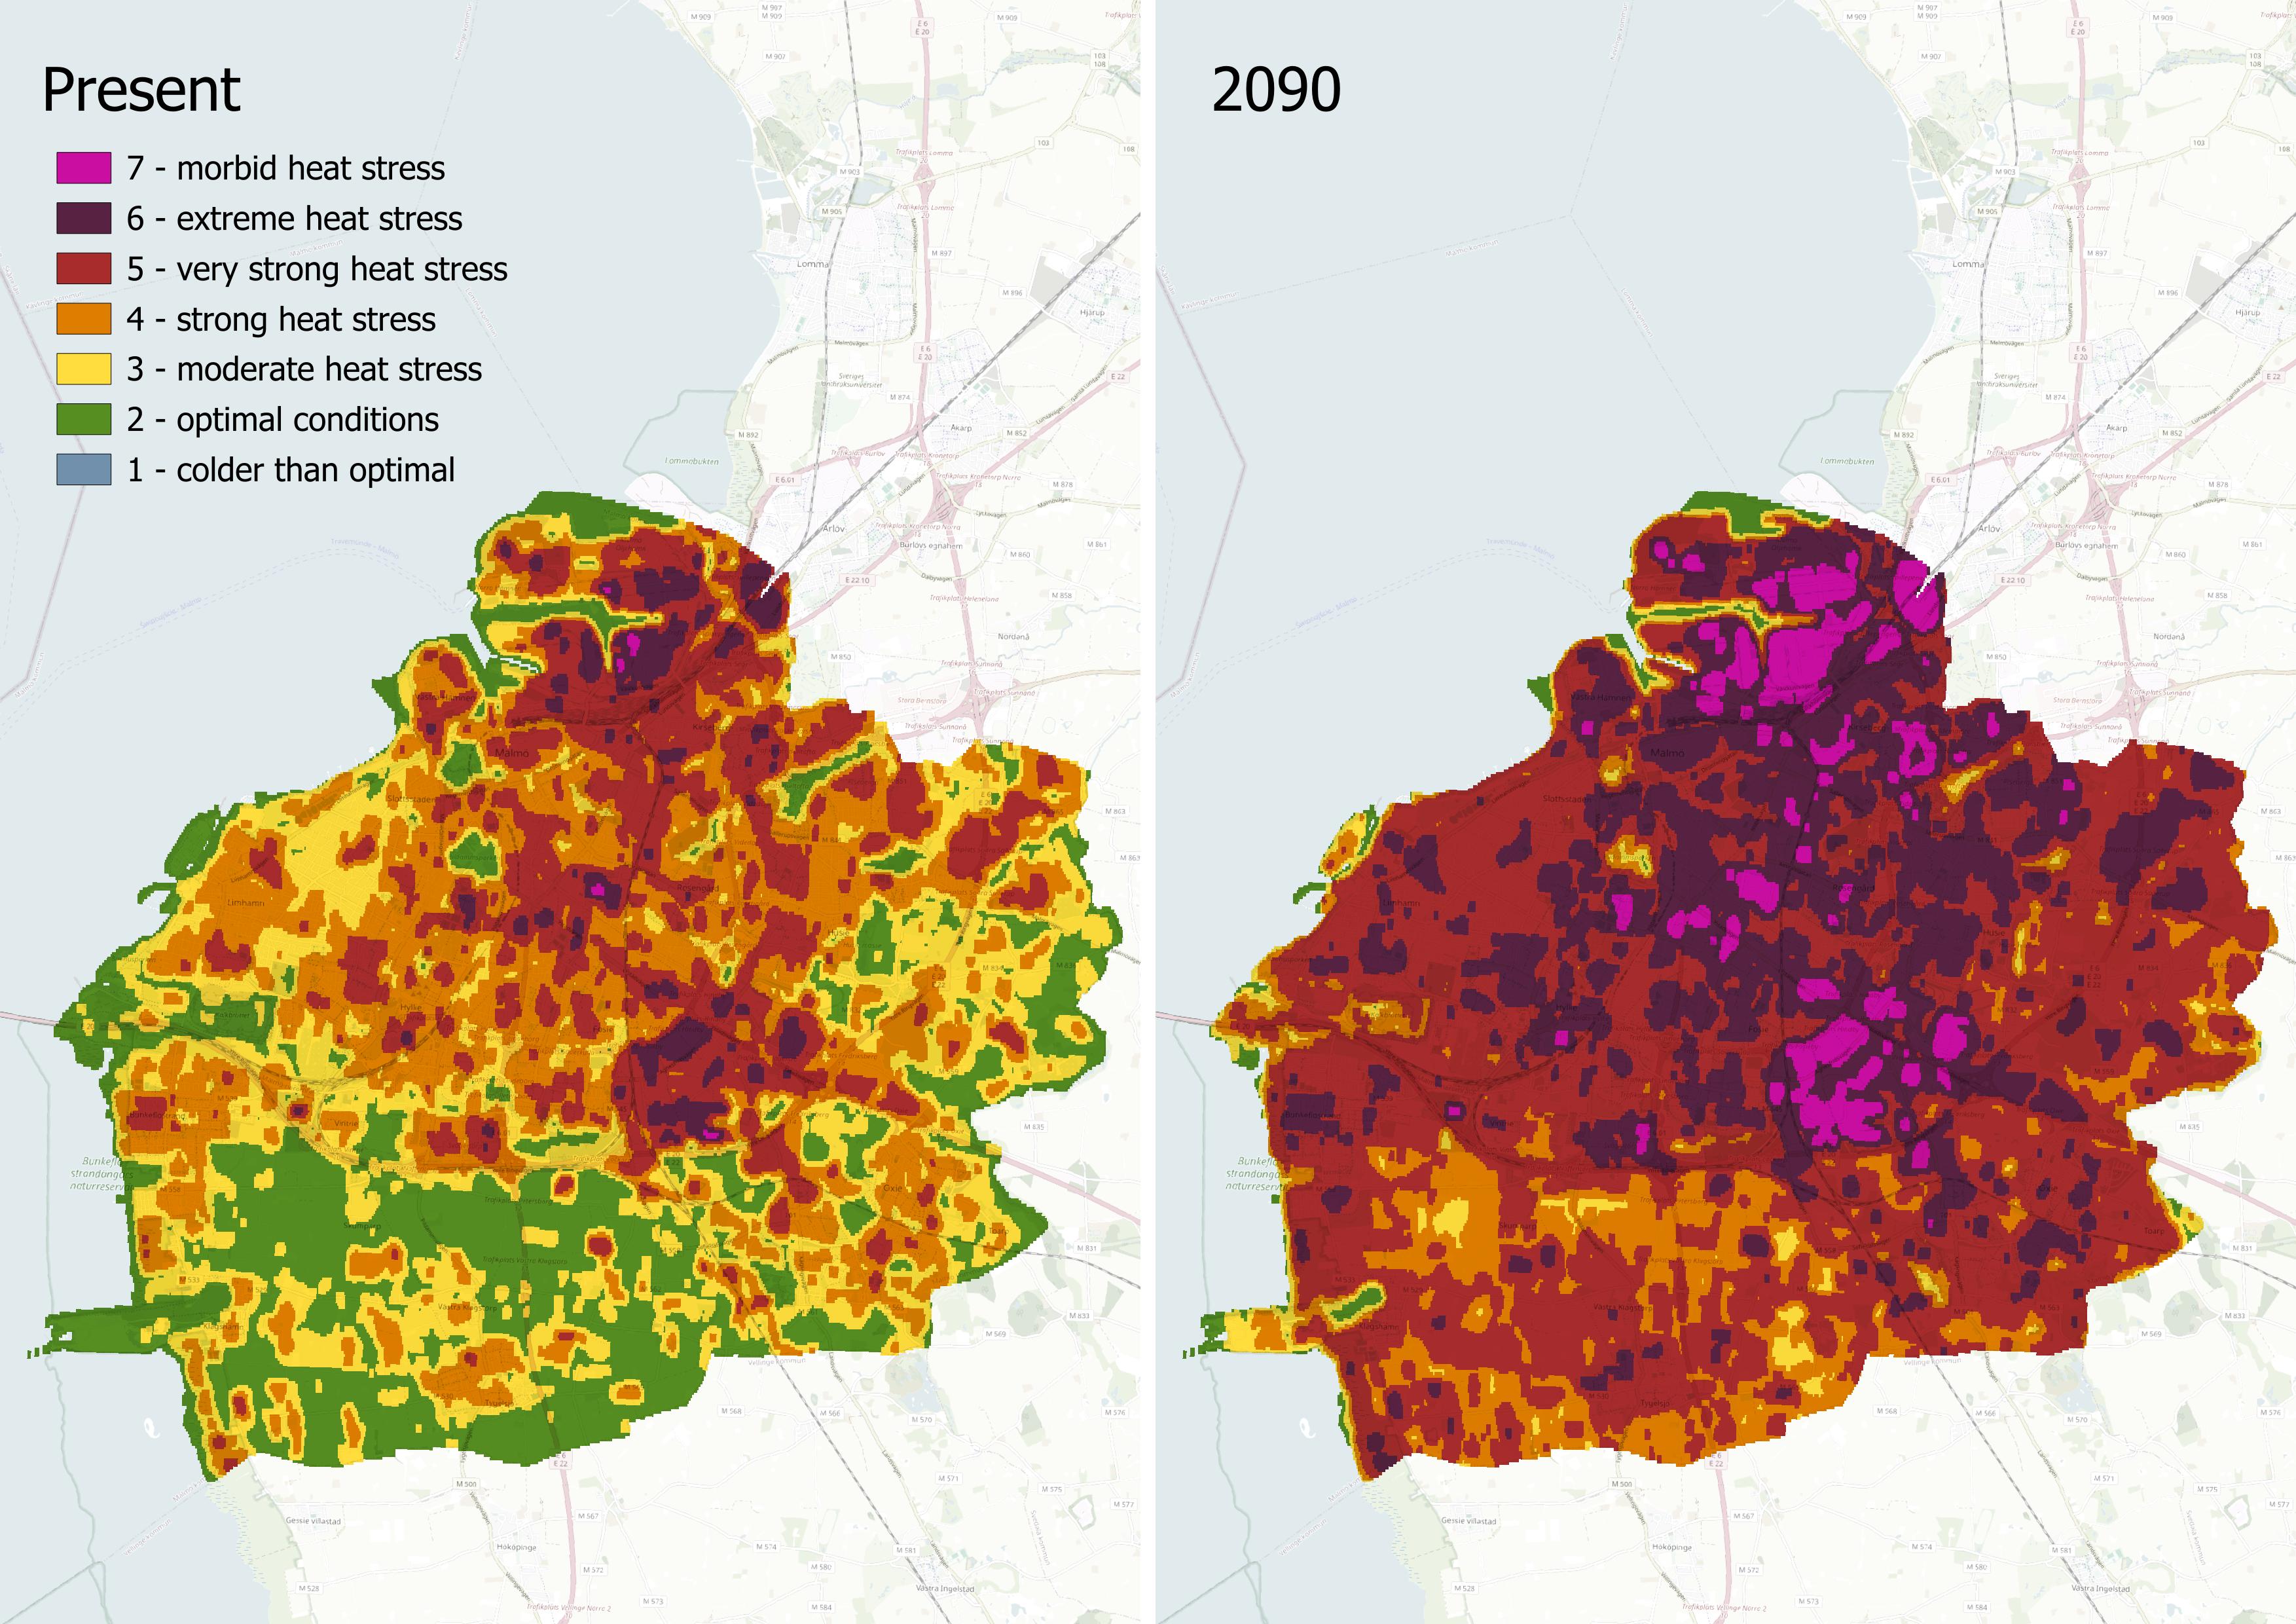
Figure 34. Three-year averaged Summertime Heat maps that illustrate the shifts in climate and their correlation with optimal tree habitats across Malmö’s municipality. This visualisation emphasises how changing climate conditions affect areas best suited for tree growth, showing a clear deterioration in growing conditions for trees across the municipality.
The importance of tree cover
To combat the rising frequency of heatwaves and a warming climate, increasing tree cover will be a powerful strategy. Research demonstrates that urban areas with extensive tree coverage experience cooler temperatures. Trees provide shade and cool the environment through evapotranspiration – a process where they release water vapour, reducing surrounding air temperatures. Heat mapping studies consistently show a strong correlation between dense vegetation and lower local temperatures, with areas rich in greenery often being several degrees cooler than those with little or no tree cover (Sinha et al., 2022; Sheridan et al., 2024)
In Malmö, districts with tree coverage at or above 30% are better positioned to mitigate future heat risks due to their robust canopy (Figure 35). When comparing heat maps with tree cover data, the connection is clear: urban areas with higher levels of tree cover consistently exhibit lower heat risk, while areas with sparse vegetation face significantly higher surface and air temperatures. As discussed earlier in this report, trees not only provide natural cooling through shade but also enhance evapotranspiration, further lowering temperatures. Conversely, areas with minimal tree cover absorb and retain more heat, contributing to elevated local temperatures. This relationship highlights the essential role trees play in reducing urban heat risk and creating cooler, more livable cities.
Figure 35. Correlation between high tree cover and heat stress in the city of Malmö. The score is based on the heat stress maps in Figure 34, meaning 2 is optimal conditions for tree habitats and 7 is morbid conditions.
When analysing additional case cities, a clear correlation between tree cover percentage and reduced heat stress emerges (Figure 36). However, factors like urban fabric, building materials, and the presence of other green infrastructure also significantly influence these outcomes. While higher tree cover helps alleviate heat stress, its impact is shaped by the broader urban context. For instance, well-planned green spaces, reflective building materials, and permeable surfaces can enhance the cooling effect of trees, whereas dense construction and heat-absorbing materials may limit it. This highlights the importance of integrating tree cover with smart urban design and sustainable infrastructure for optimal climate resilience.
Figure 36. Correlation between high tree cover and heat stress in three of the case study sites (Malmö, Umeå, and Stavanger). The score is based on the heat stress maps meaning 2 is optimal conditions for tree habitats and 7 is morbid conditions.
Malmö and Stavanger showcase distinct characteristics regarding tree cover and heat risk. Stavanger benefits from a greater integration of natural landscapes, featuring higher levels of tree cover in its urban areas. In contrast, Malmö, with its denser urban structure, has comparatively less tree cover, rendering it more vulnerable to heat risks. The differences in their urban planning and environmental conditions significantly influence how each city addresses the challenges of rising temperatures and climate resilience.
Malmö’s limited tree cover, combined with its high population density, makes it more susceptible to urban heat island (UHI) effects. This lack of adequate tree cover exacerbates the UHI effect, heightening Malmö’s vulnerability to extreme heat events.
Conversely, Stavanger’s higher tree cover provides essential natural cooling benefits (Figure 37). The abundance of trees and parks helps moderate temperatures, effectively reducing the UHI effect and offering a buffer against heat-related risks. This contrast highlights the critical role of green spaces in urban planning as a strategy for enhancing climate resilience and improving the overall liveability of cities in the future.
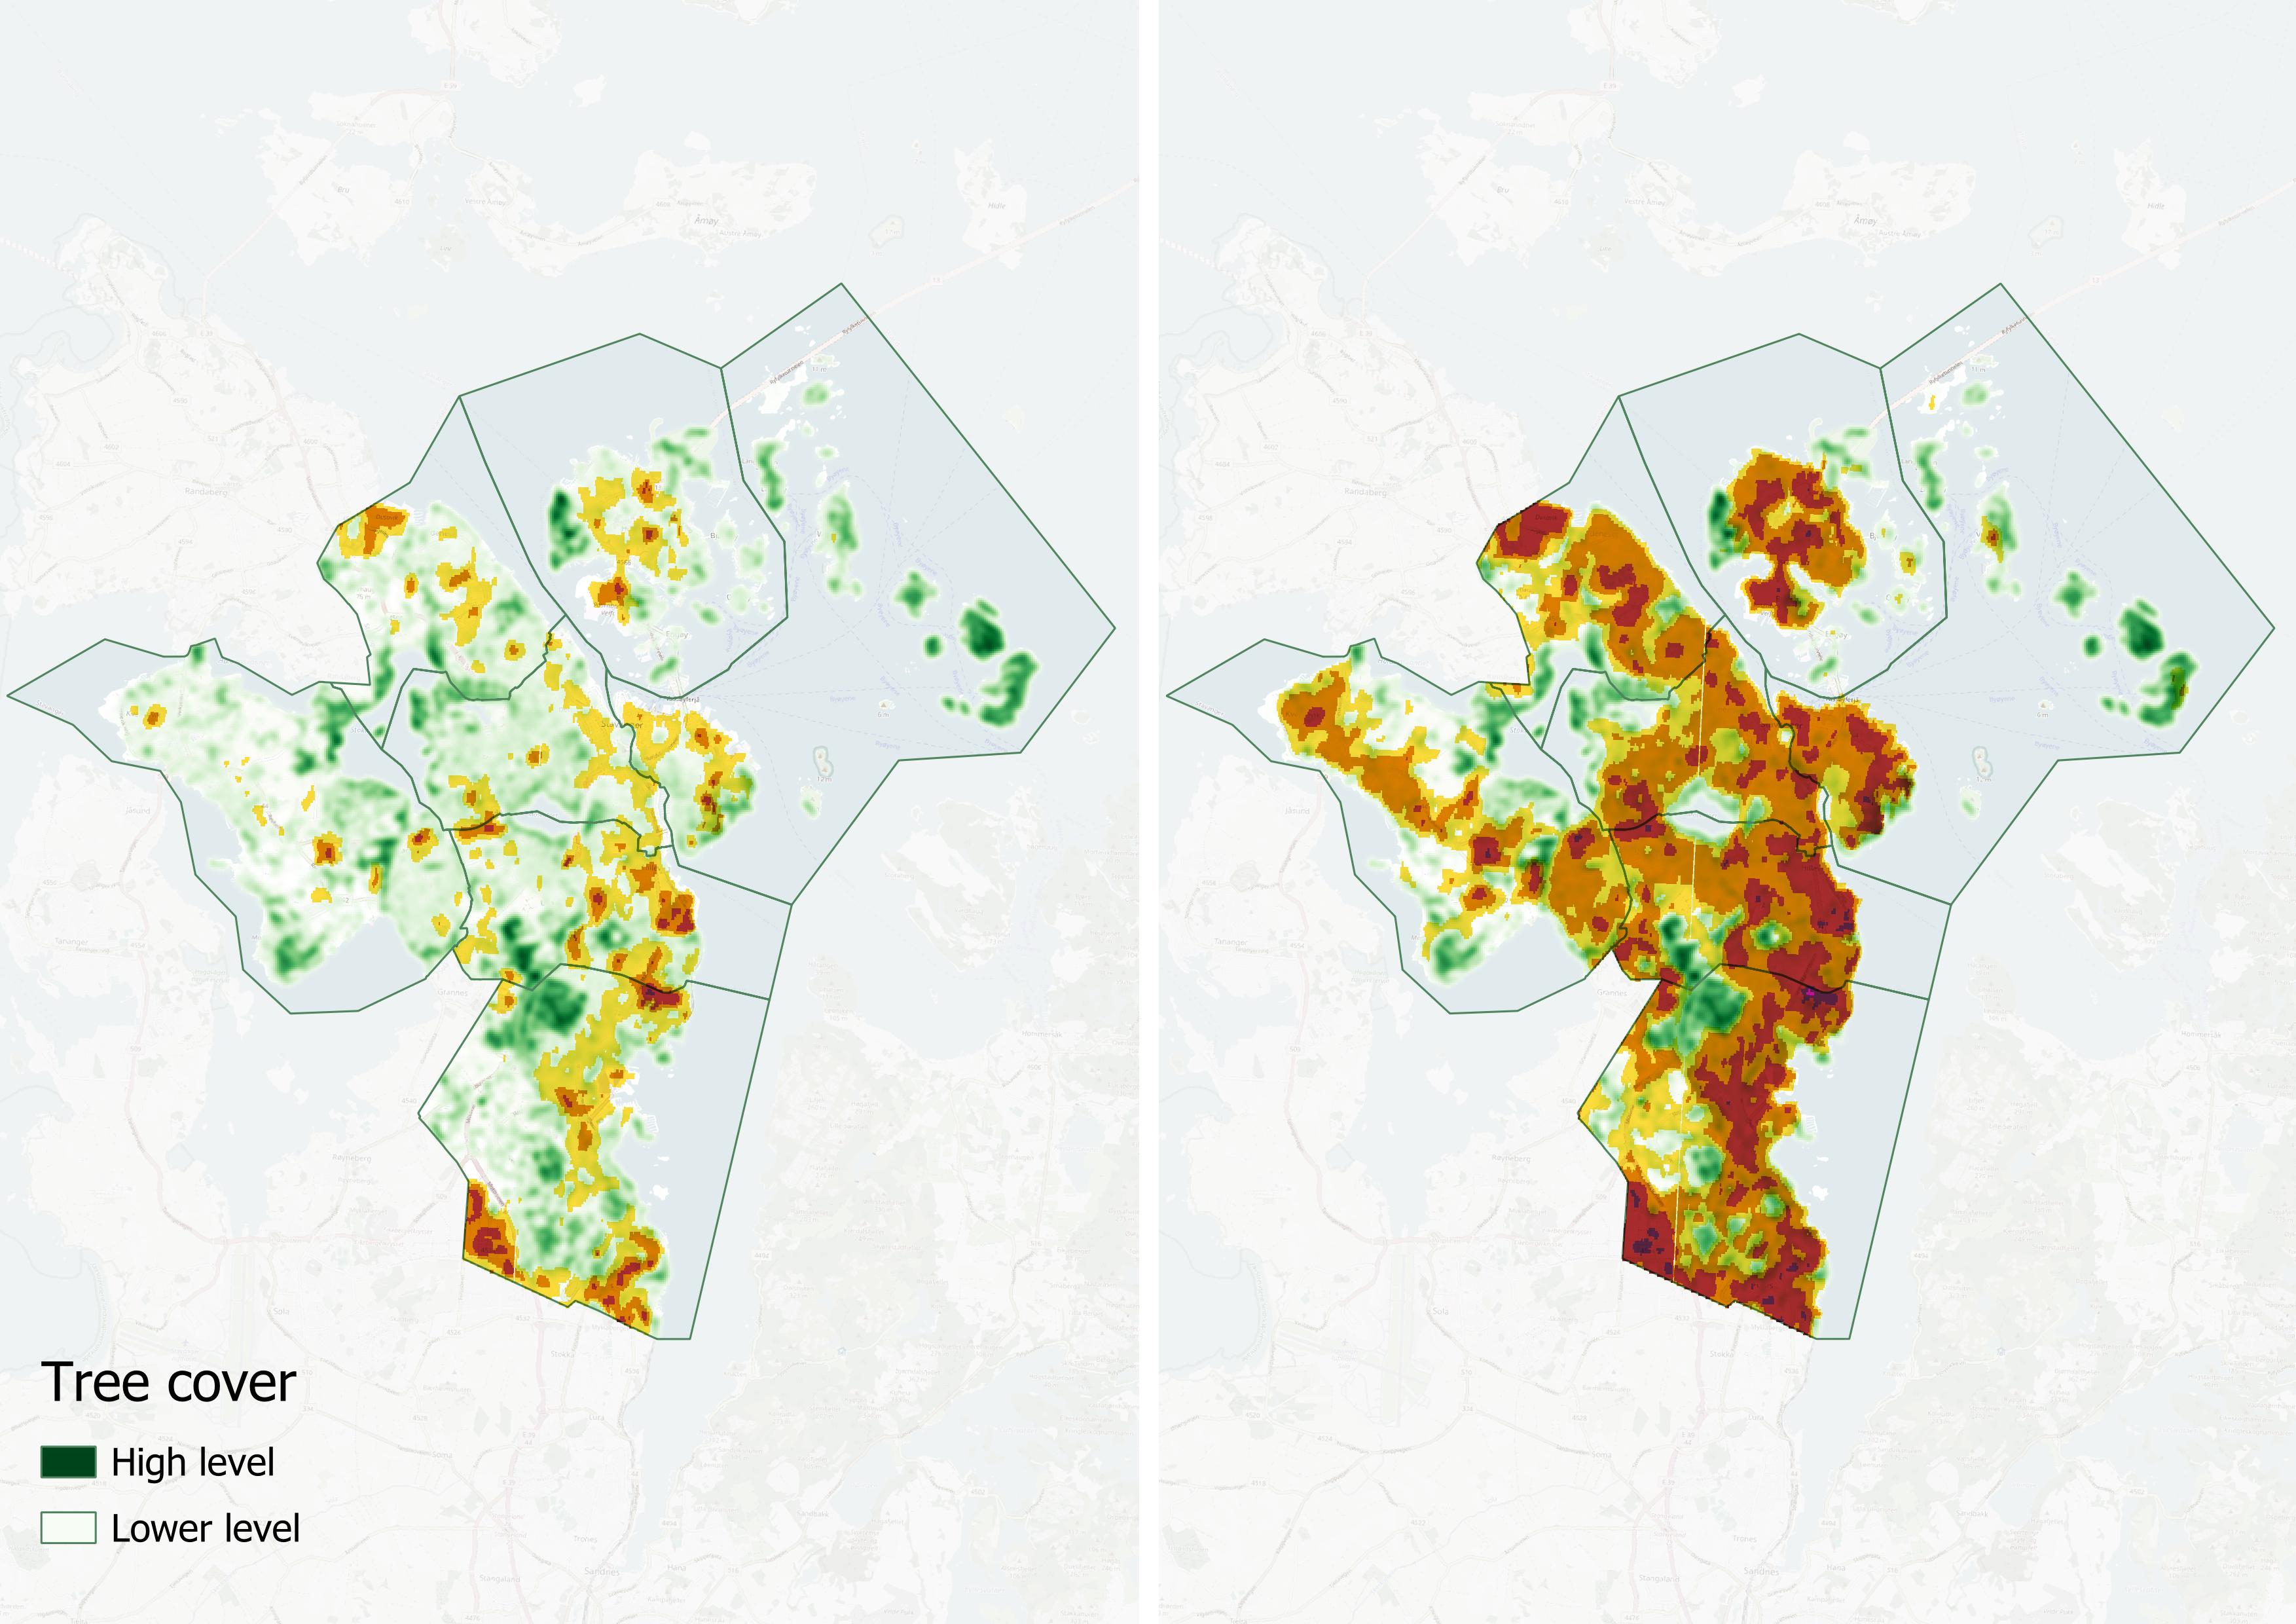
Figure 37. The tree cover in Stavanger is examined alongside heatmap data, emphasising the relationship between vegetation and temperature distribution. The left image reflects current conditions, while the right image represents climate predictions for the year 2090, with existing canopy cover.
Noise pollution
To assess the relationship between tree cover and environmental factors such as noise levels, we analyse various environmental parameters in relation to specific threshold values set by authoritative organisations like the World Health Organization (WHO), the European Union (EU), and national environmental authorities. These benchmarks are essential for evaluating compliance with public health and environmental standards.
Noise pollution is measured in decibels (dB), and evaluating noise exposure relies on established guideline values aimed at protecting public health. The Day-Evening-Night Level (Lden) metric averages noise levels over a 24-hour period, placing greater emphasis on evening and nighttime noise, as these periods have a more significant impact on human health. According to World Health Organization (WHO) guidelines, the recommended Lden threshold for road traffic noise is < 53 dB, and for railway noise, it is < 54 dB. These thresholds are essential for assessing whether long-term noise exposure exceeds levels that could negatively affect public health, potentially leading to issues such as stress and cardiovascular problems. Additionally, the recommended annual average exposure limit for noise from all combined sources is ≤ 70 dB LAeq, 24h (WHO and UN, 2022).
These values provide reference points for assessing noise levels. By comparing the measured noise levels to these established guidelines, this analysis identifies specific zones where noise pollution is the highest in the city of Malmö (Figure 38). Additionally, the analysis explores the potential relationship between tree cover and noise pollution.
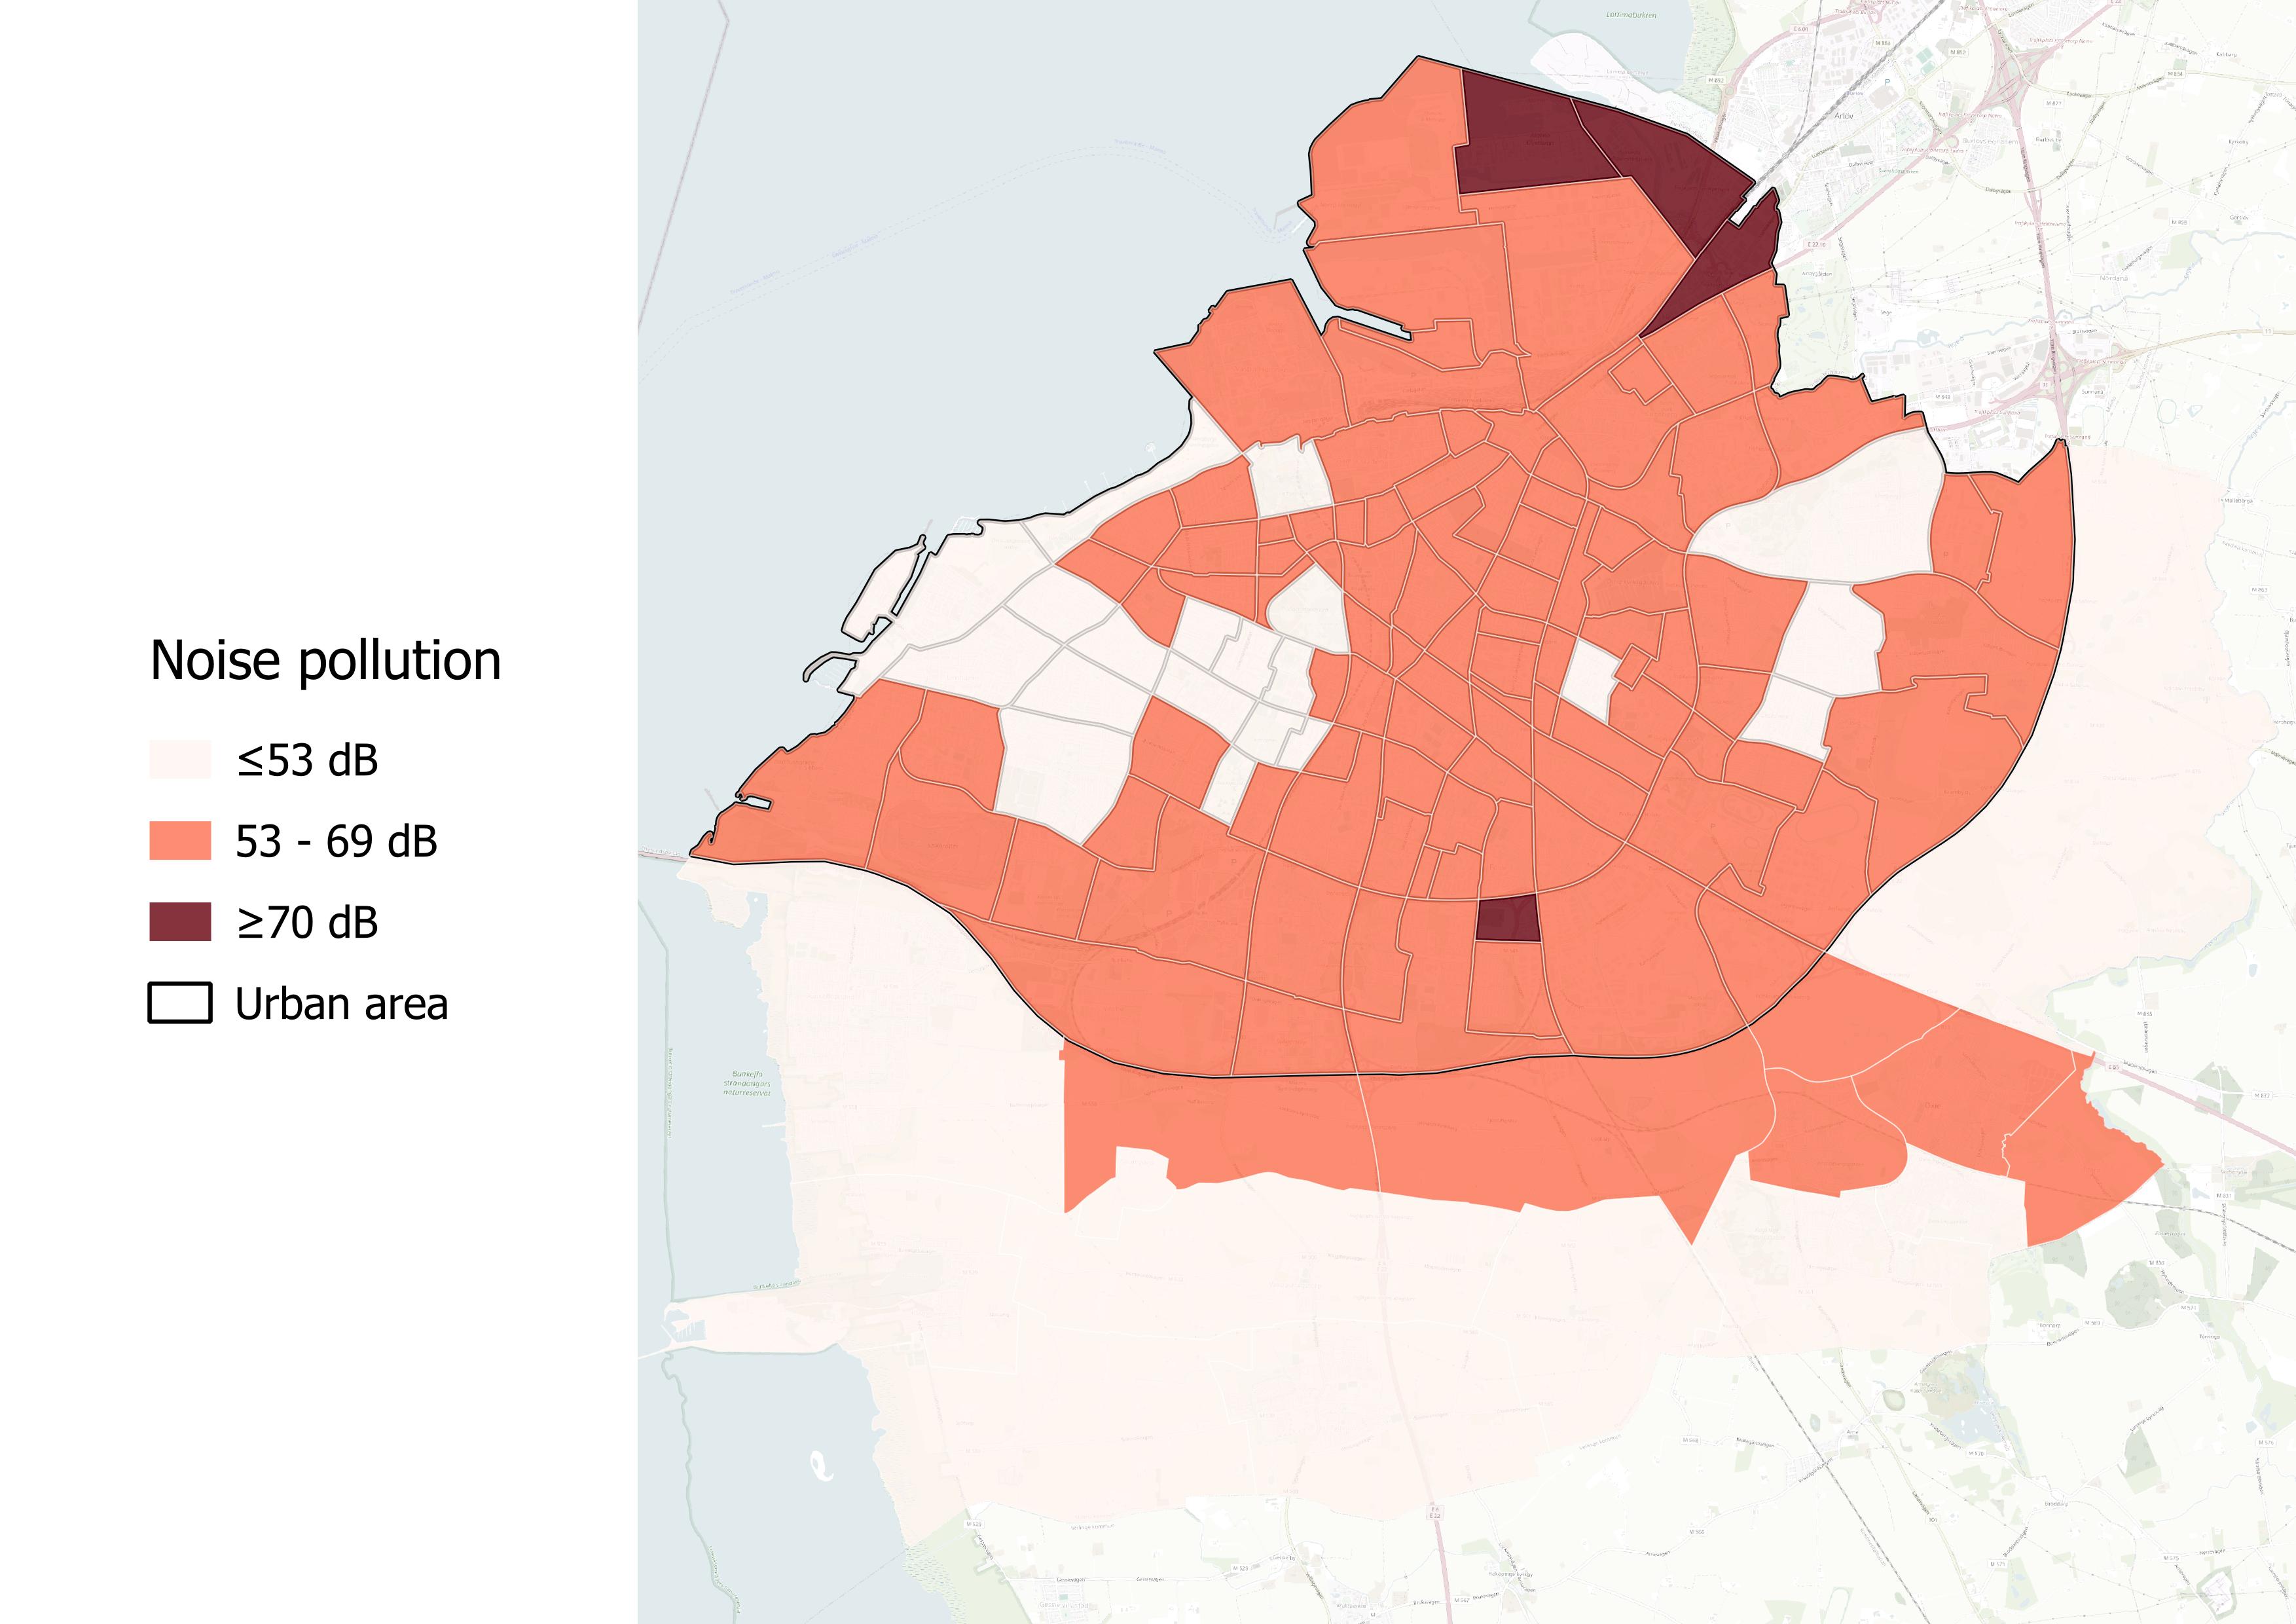
Figure 38. Noise pollution map for Malmö, showing the combined mean score of all noise sources from road traffic, trains, and industrial activities.
The map reveals significant discrepancies in noise levels between urban and rural areas in Malmö. Urban environments, characterised by high population density and heavy traffic, typically experience elevated noise levels compared to their rural counterparts. For instance, densely populated districts with substantial traffic flow may register noise levels exceeding 70 dB, primarily due to road traffic and other urban activities. In contrast, rural areas, often marked by lower traffic volumes and fewer leisure activities, tend to have quieter soundscapes, with average noise levels around 40–50 dB but also a lower level of tree cover.
Despite the challenges posed by urban noise, there is a notable correlation between tree cover and lower noise pollution levels. Areas with substantial tree cover exhibit lower noise levels, demonstrating that trees play a crucial role in mitigating the impact of urban noise (Figure 39). The natural sound-absorbing qualities of trees, along with their ability to create a buffer against noise, make them an essential component of urban planning aimed at improving overall community well-being.
Figure 39. Noise pollution in relation to tree cover in Malmö’s urban districts: the graph shows the average tree cover percentage specifically for districts within Malmö's urban areas, see figure 38, categorised by mean noise levels at or below 53 dB, between 53 and 69 dB, and at or above 70 dB.
Moreover, regions with high tree cover often feature fewer roads and lower traffic volumes. This is not merely a coincidence; areas rich in greenery tend to be planned with more consideration for natural landscapes, which often leads to the development of less dense, low-traffic environments. The reduced number of roads means fewer vehicles, contributing to lower overall noise levels.
Conclusion
In conclusion, increasing tree cover emerges as a powerful strategy to combat the rising frequency of heatwaves and the warming climate. Research consistently demonstrates that urban areas with extensive tree coverage experience cooler temperatures, thanks to the shade provided by trees and their ability to cool the environment through evapotranspiration. This natural process not only reduces surrounding air temperatures but also creates a buffer against heat stress, underscoring the vital role trees play in enhancing urban liveability.
Case studies from cities like Malmö and Stavanger illustrate the importance of tree cover in mitigating urban heat risks. Malmö's denser urban structure and limited tree cover make it more vulnerable to urban heat island effects, leading to higher surface and air temperatures, particularly during extreme heat events. In contrast, Stavanger's higher tree cover and integration of natural landscapes result in more moderate temperatures, demonstrating the protective benefits of urban greenery.
Furthermore, the analysis of noise pollution levels in relation to tree cover reveals a significant correlation between dense vegetation and reduced noise levels. Urban areas characterised by high tree cover typically experience lower noise pollution, contributing to a healthier sound environment. This is particularly important in light of established noise exposure guidelines from authoritative organisations like the World Health Organization, which indicate that prolonged exposure to high noise levels can lead to serious health issues.
Integrating tree cover with thoughtful urban planning is crucial for creating more resilient and liveable cities. By reducing the number of roads and traffic volumes in areas with abundant greenery, cities can not only lower noise pollution but also enhance community well-being. The synergy between increased tree cover, reduced heat stress, and lower noise levels highlights the multifaceted benefits of urban greenery, positioning it as an essential component of sustainable urban design.
Trees under future climate change scenarios – an analysis
As projections for the future of urban environments unfold in the context of climate change, predictive climate modelling from the Intergovernmental Panel on Climate Change (IPCC) provides a foundational resource. The analysis of projected climate impacts for the future reveals insights into urban areas facing increased risks of heat stress and regions that may transform from inhospitable environments into “tree-friendly” habitats.
These scenarios also reveal critical information regarding effective desert zones – areas where rising temperatures and declining vegetation make conditions increasingly uninhabitable for both trees and, in turn, people. Although such zones are relatively rare in the Nordic Region compared to other global areas, their potential emergence poses significant challenges for urban planners and environmental policymakers. Visualisation of these scenarios allows for the identification of vulnerable urban areas that may require targeted interventions to mitigate heat stress and enhance climate resilience.
Furthermore, the analysis extends beyond merely identifying at-risk locations; it incorporates advanced computational models that calculate expected changes in temperature and vegetation suitability across diverse urban landscapes. Examining the relationship between urban heat stress and vegetation suitability provides a clearer understanding of how various neighbourhoods may adapt – or struggle to adapt – to these climatic shifts.
The case cities are evaluated on a scale of 1 to 7, providing a nuanced assessment of their suitability for tree growth (Figure 40). A score of 1 signifies areas that are colder than the optimal conditions for trees, indicating potential challenges for vegetation health and growth. In contrast, a score of 7 denotes regions experiencing severe heat stress, which can hinder tree vitality and biodiversity.
This scoring system facilitates the identification of areas that may require intervention or adaptation strategies to enhance urban forestry initiatives. Scores in the middle range (2 to 6) reflect varying degrees of climate suitability, highlighting regions that may be on the cusp of transitioning from less favourable to more optimal conditions for tree growth. This detailed evaluation not only informs urban planners and policymakers about current habitat suitability but also guides future actions to promote sustainable and resilient urban forests in the face of changing climate conditions.
Heat stress score | ||
|---|---|---|
7 | Morbid heat stress | |
6 | Extreme heat stress | |
5 | Very strong heat stress | |
4 | Strong heat stress | |
3 | Moderate heat stress | |
2 | Optimal conditions | |
1 | Colder than optimal | |
Figure 40. Overview of heat stress scores.
Scenarios for the participating cities
In Figures 41–56, climate change-related scenarios are presented for most of the participating municipalities. The figures show the shifts in climate and their correlation with optimal tree habitats for the municipalities from the present through the year 2090. The tables show the projected development of heat risk for each municipality, once again, from today through the year 2090.
The scenarios reveal significant variability between municipalities, highlighting that the urban fabric significantly influences the urban heat island effect, which exacerbates the impacts of climate change. Areas with substantial tree cover and vegetation within cities can help mitigate these effects, resulting in more favourable scores. However, the heat island effect will increasingly impact urban areas, necessitating a re-evaluation of which tree species can thrive under these changing conditions. This underscores the importance of adaptive urban forestry strategies to enhance ecological resilience and ensure the sustainability of urban green spaces in the face of climate change.
The scenarios reveal significant variability between municipalities, highlighting that the urban fabric significantly influences the urban heat island effect, which exacerbates the impacts of climate change. Areas with substantial tree cover and vegetation within cities can help mitigate these effects, resulting in more favourable scores. However, the heat island effect will increasingly impact urban areas, necessitating a re-evaluation of which tree species can thrive under these changing conditions. This underscores the importance of adaptive urban forestry strategies to enhance ecological resilience and ensure the sustainability of urban green spaces in the face of climate change.
In contrast, rural areas generally benefit from cooler temperatures and more natural vegetation, making them less susceptible to the heat island effect. This natural advantage emphasises the need for urban planners to prioritise tree canopy and urban greenery in cities to create more balanced microclimates. By integrating accessible green spaces and adequate tree cover into urban planning, municipalities can develop thoughtful environments that not only enhance the aesthetic appeal of cities but also contribute to environmental health and community well-being.
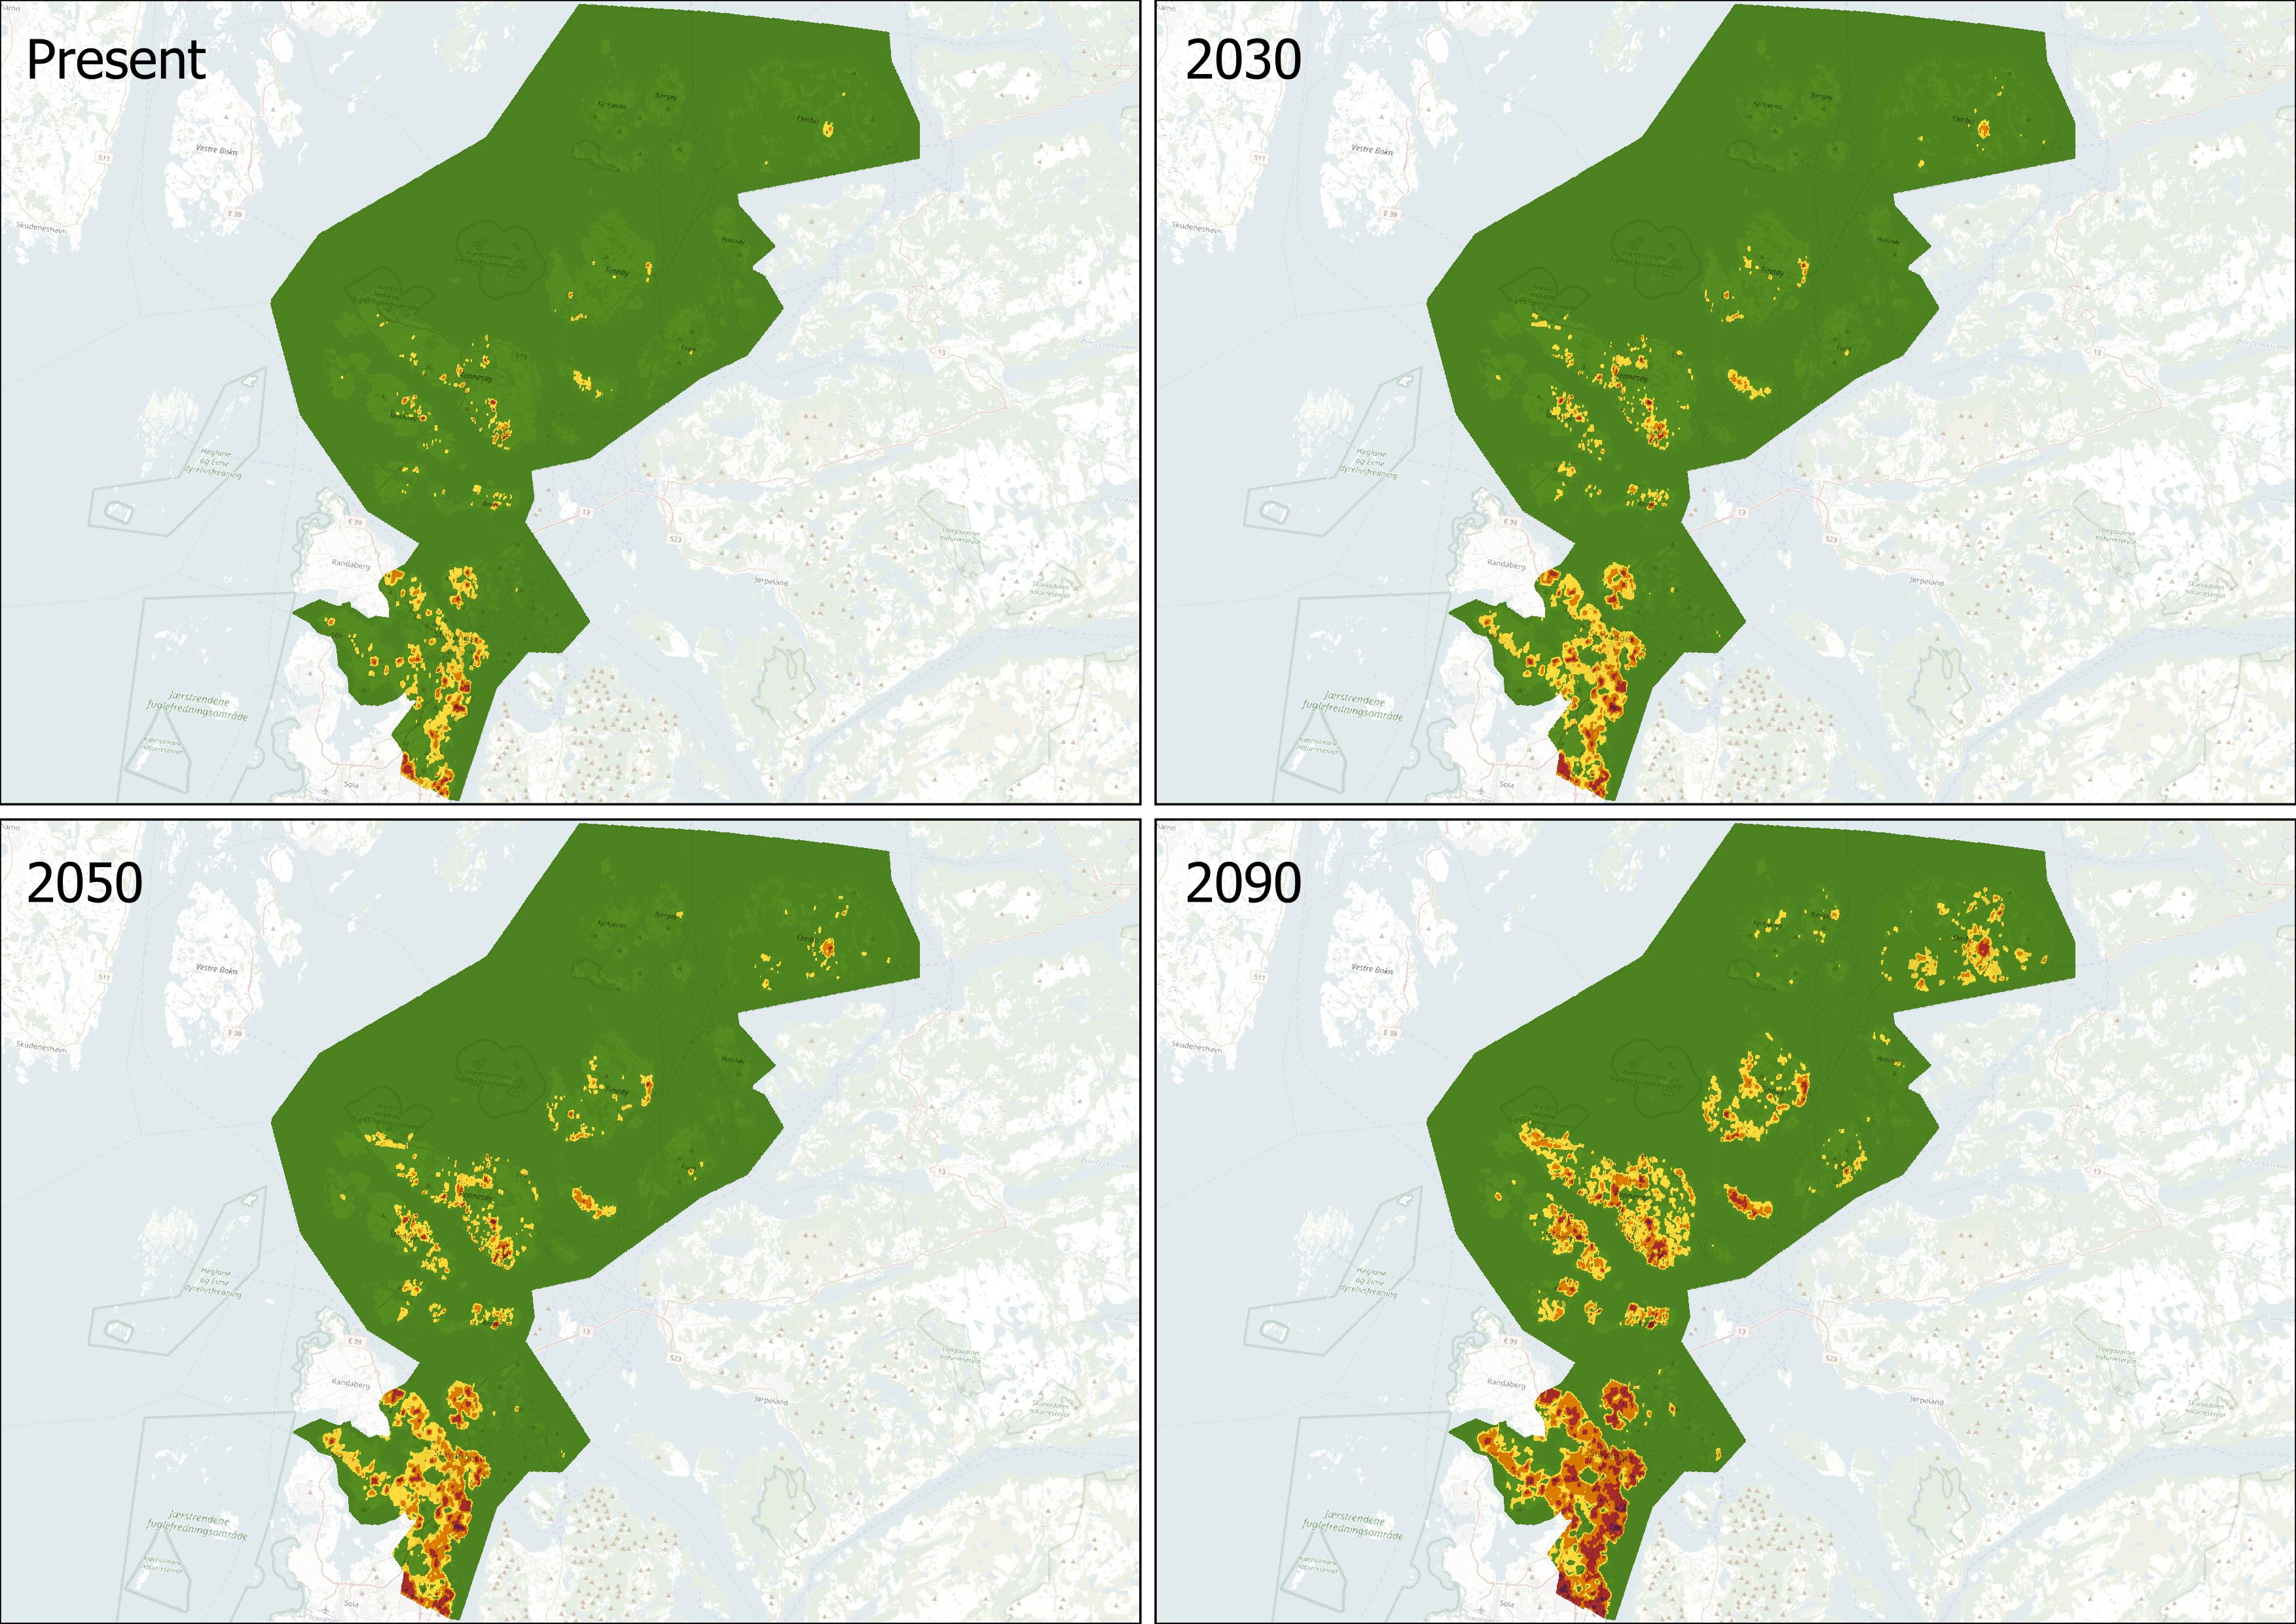
Figure 41. Scenario illustrating the shifts in climate and their correlation with optimal tree habitats across Stavanger municipality. This visualisation emphasises how changing climate conditions affect areas best suited for tree growth, providing insights into the sustainability and adaptability of urban forestry in the region.
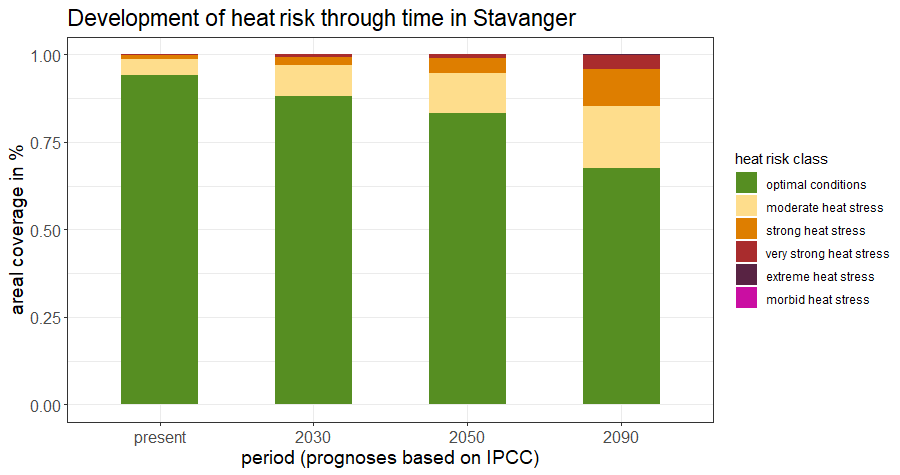
Figure 42. Percentage of Stavanger municipality classified within each category and its changes over time.
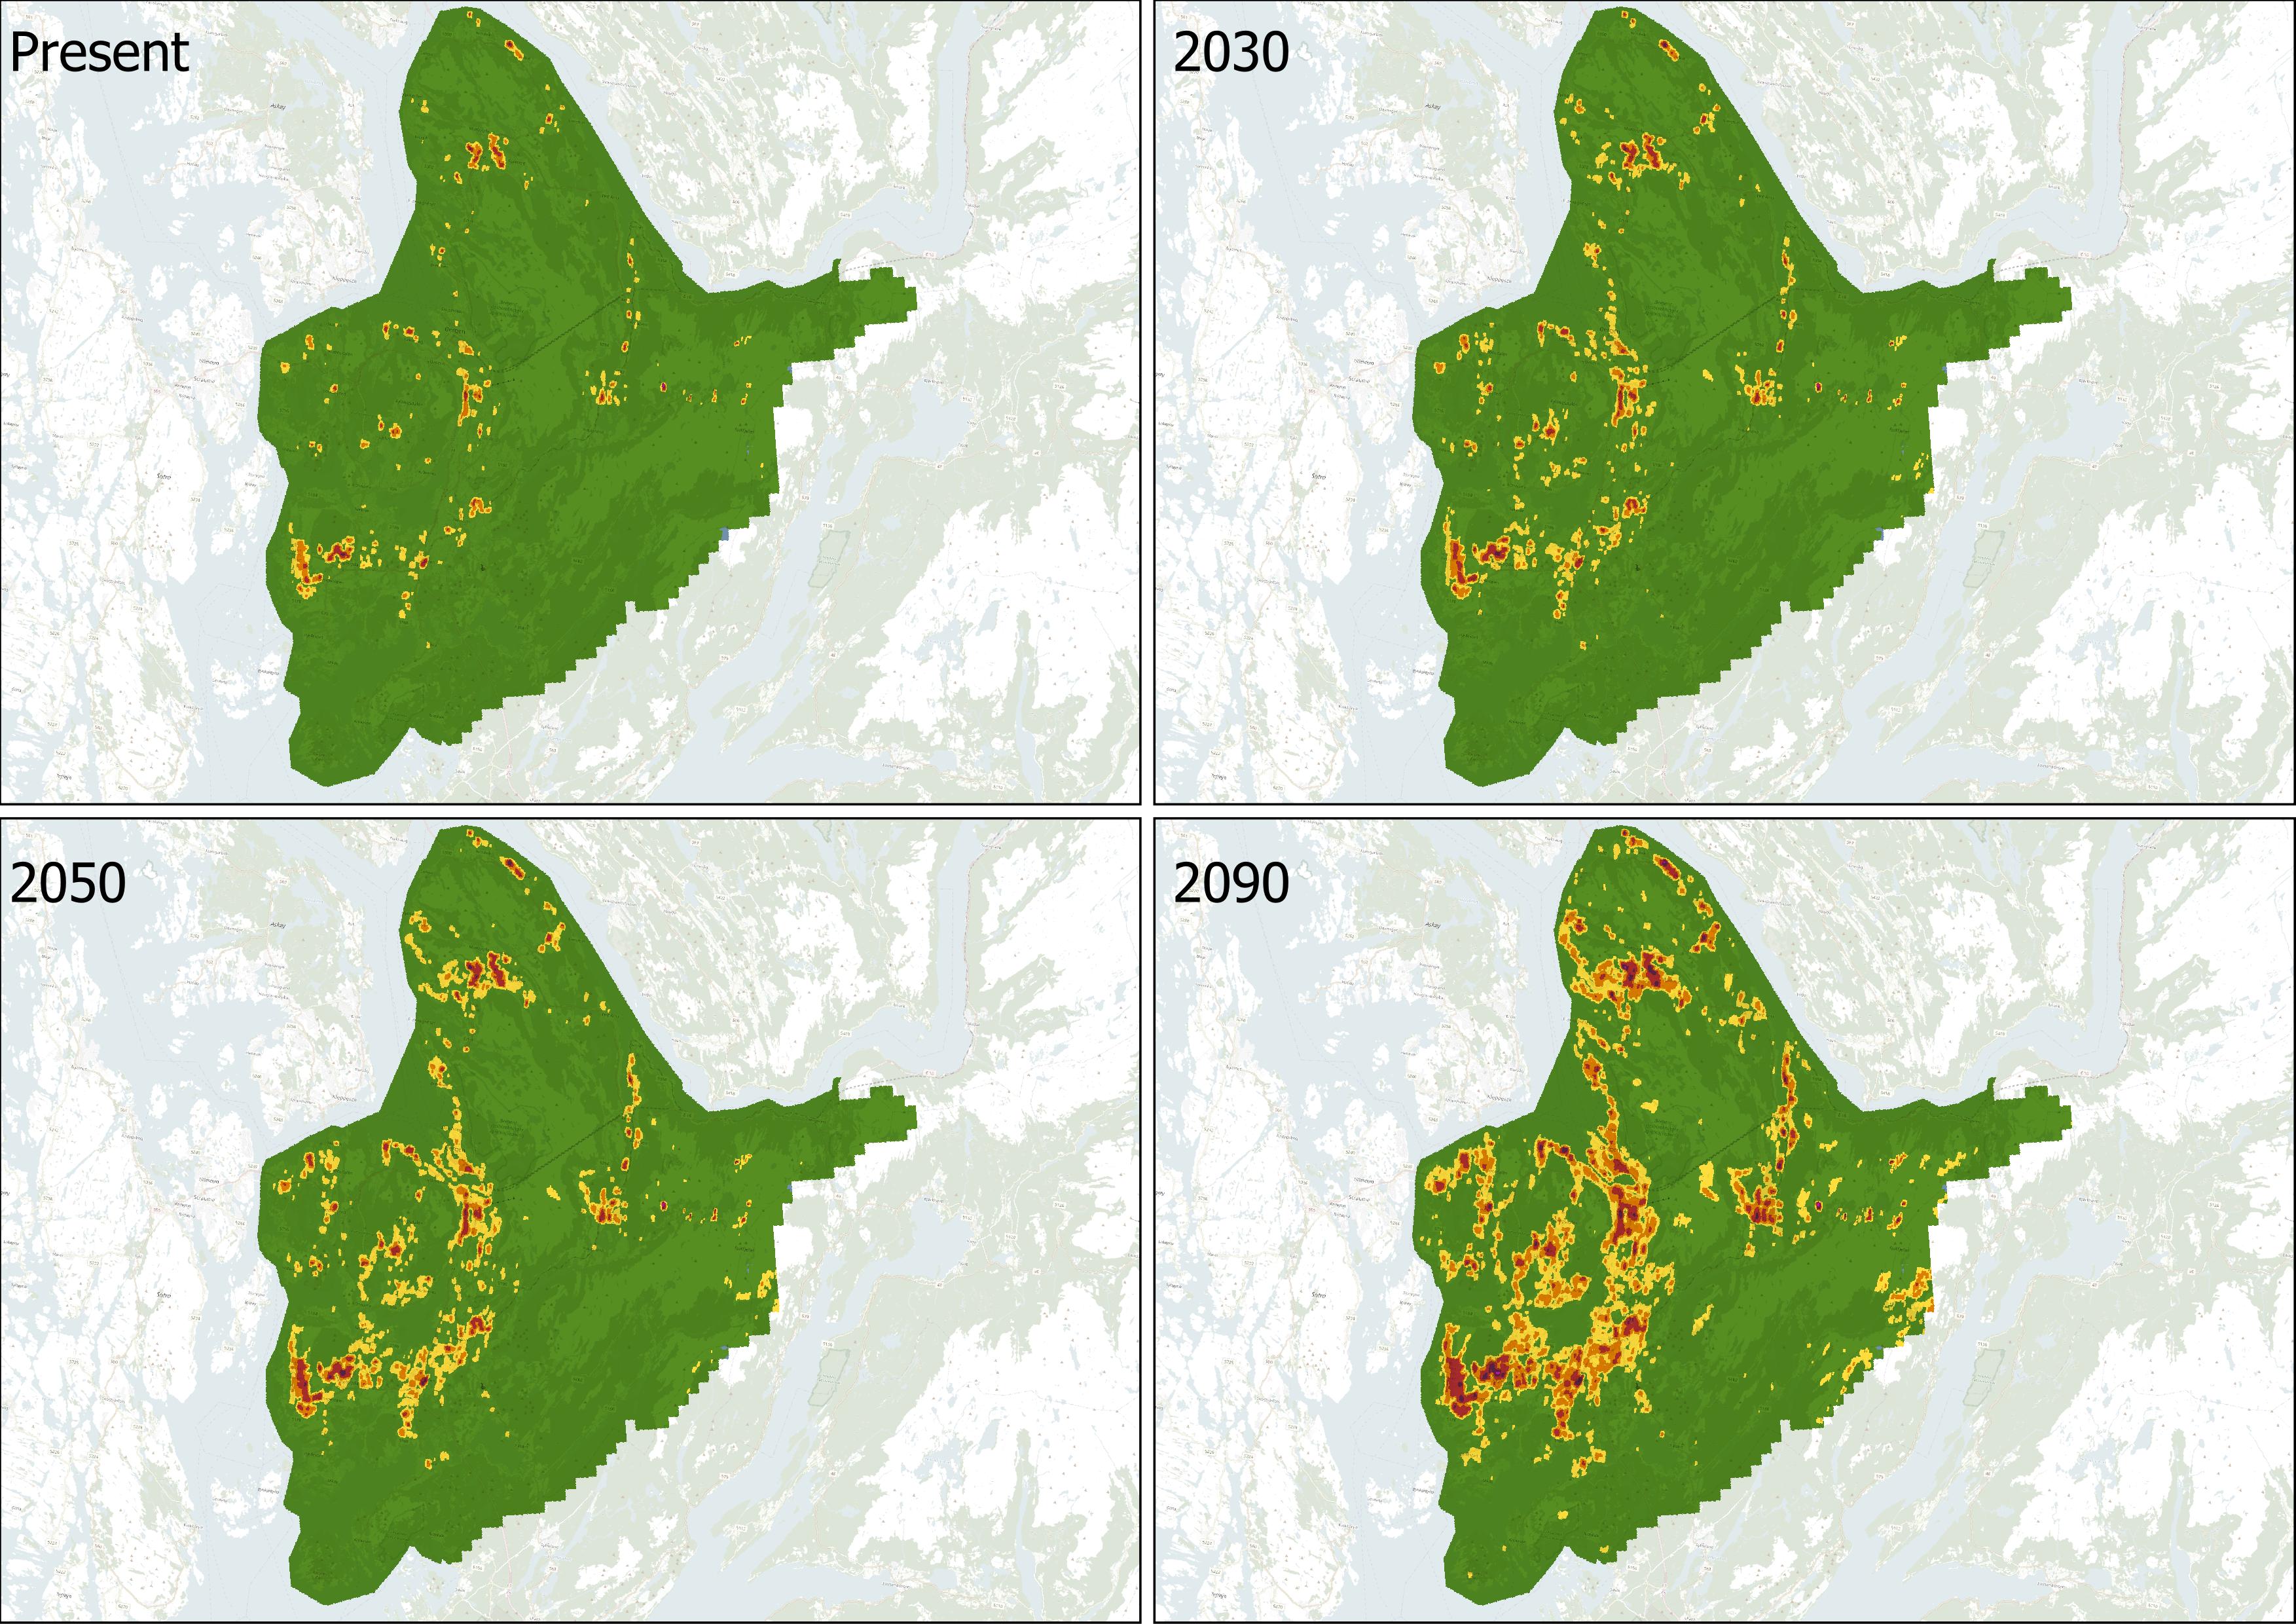
Figure 43. Scenario illustrating the shifts in climate and their correlation with optimal tree habitats across Bergen municipality. This visualisation emphasises how changing climate conditions affect areas best suited for tree growth, providing insights into the sustainability and adaptability of urban forestry in the region.
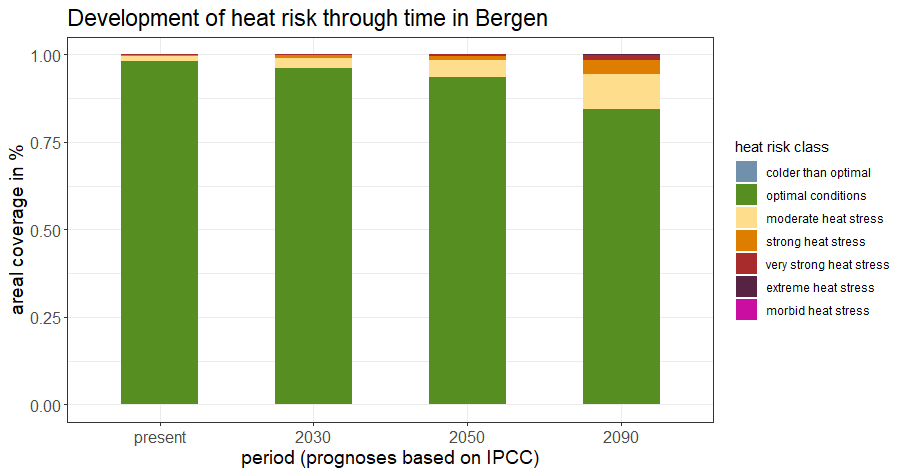
Figure 44. Percentage of Bergen municipality classified within each category and its changes over time.
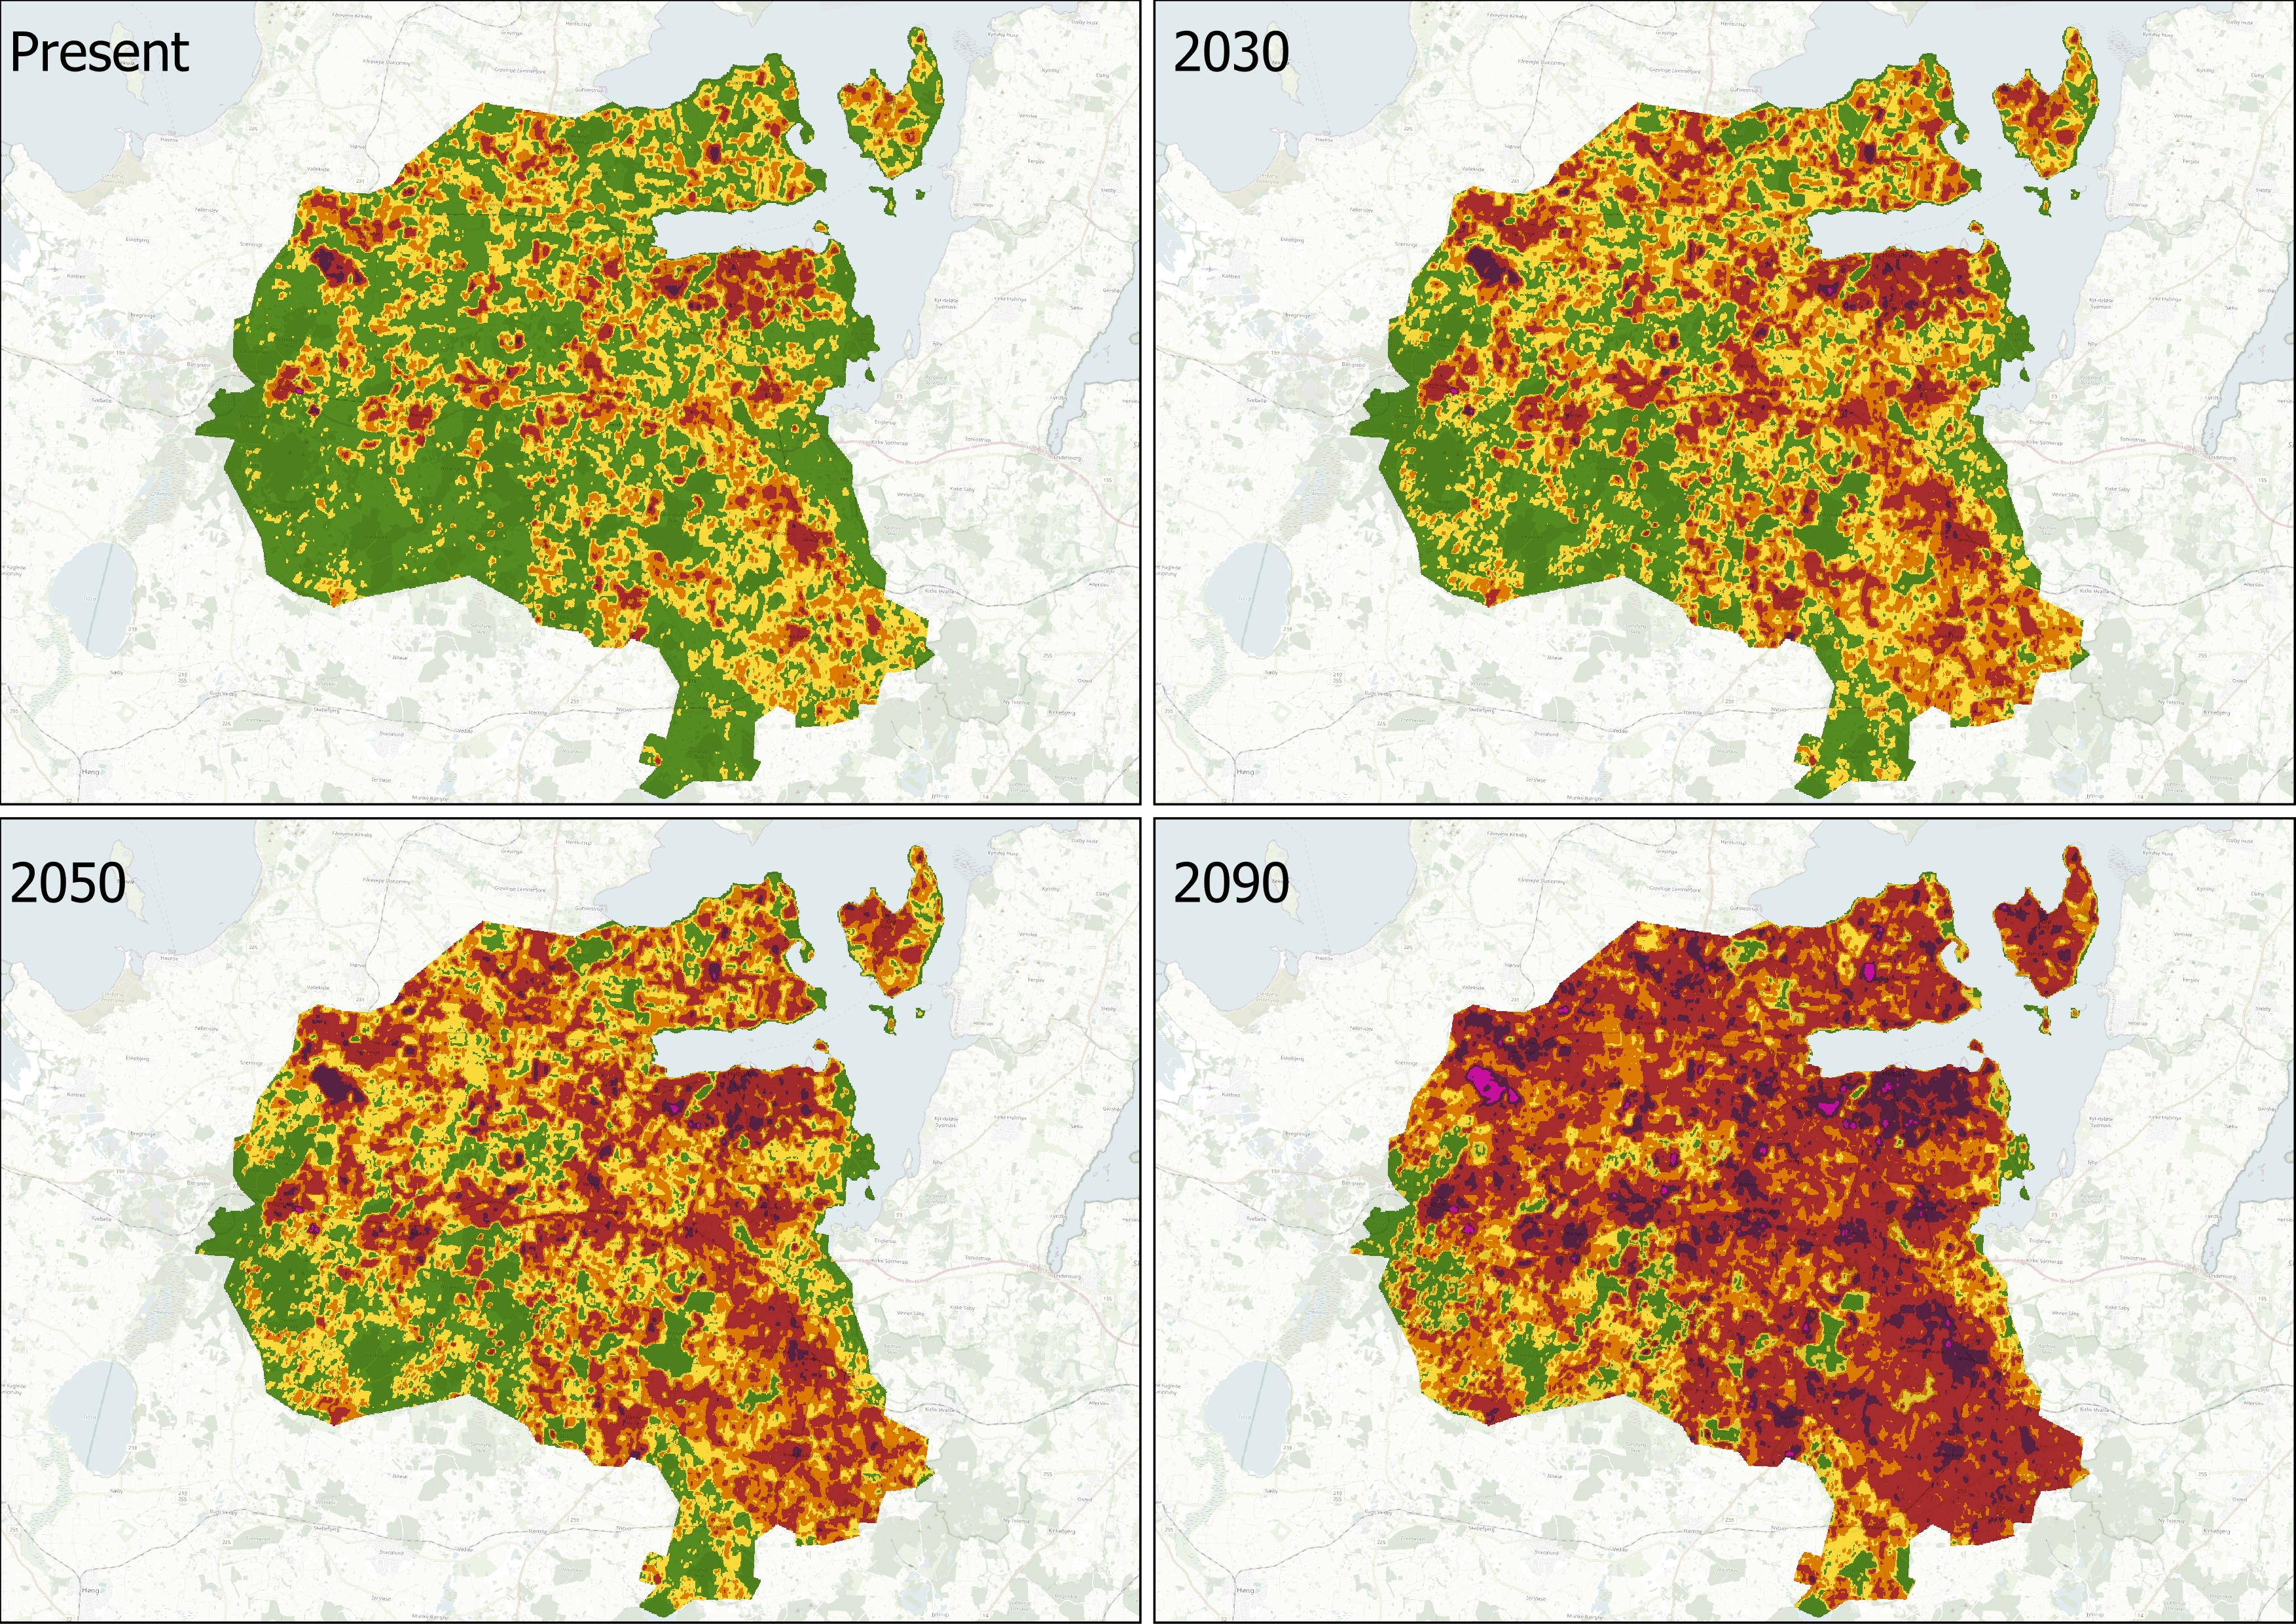
Figure 45. Scenario illustrating the shifts in climate and their correlation with optimal tree habitats across Holbæk municipality. This visualisation emphasises how changing climate conditions affect areas best suited for tree growth, providing insights into the sustainability and adaptability of urban forestry in the region.
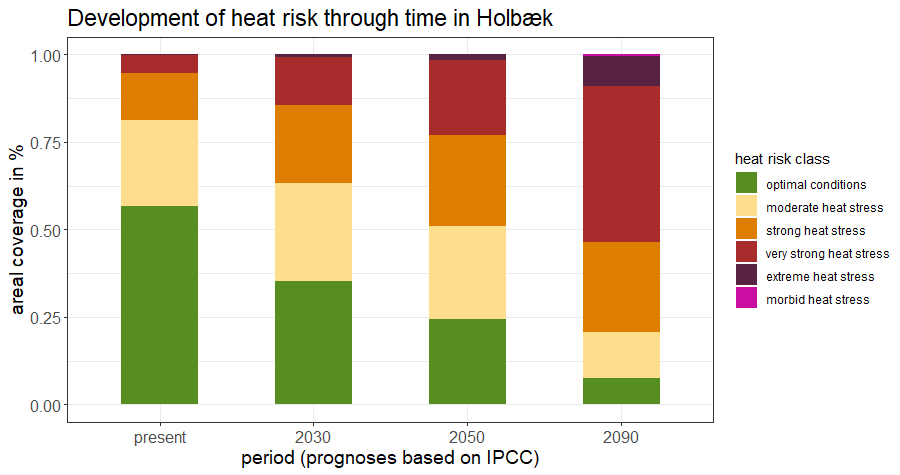
Figure 46. Percentage of Holbæk municipality classified within each category and its changes over time.
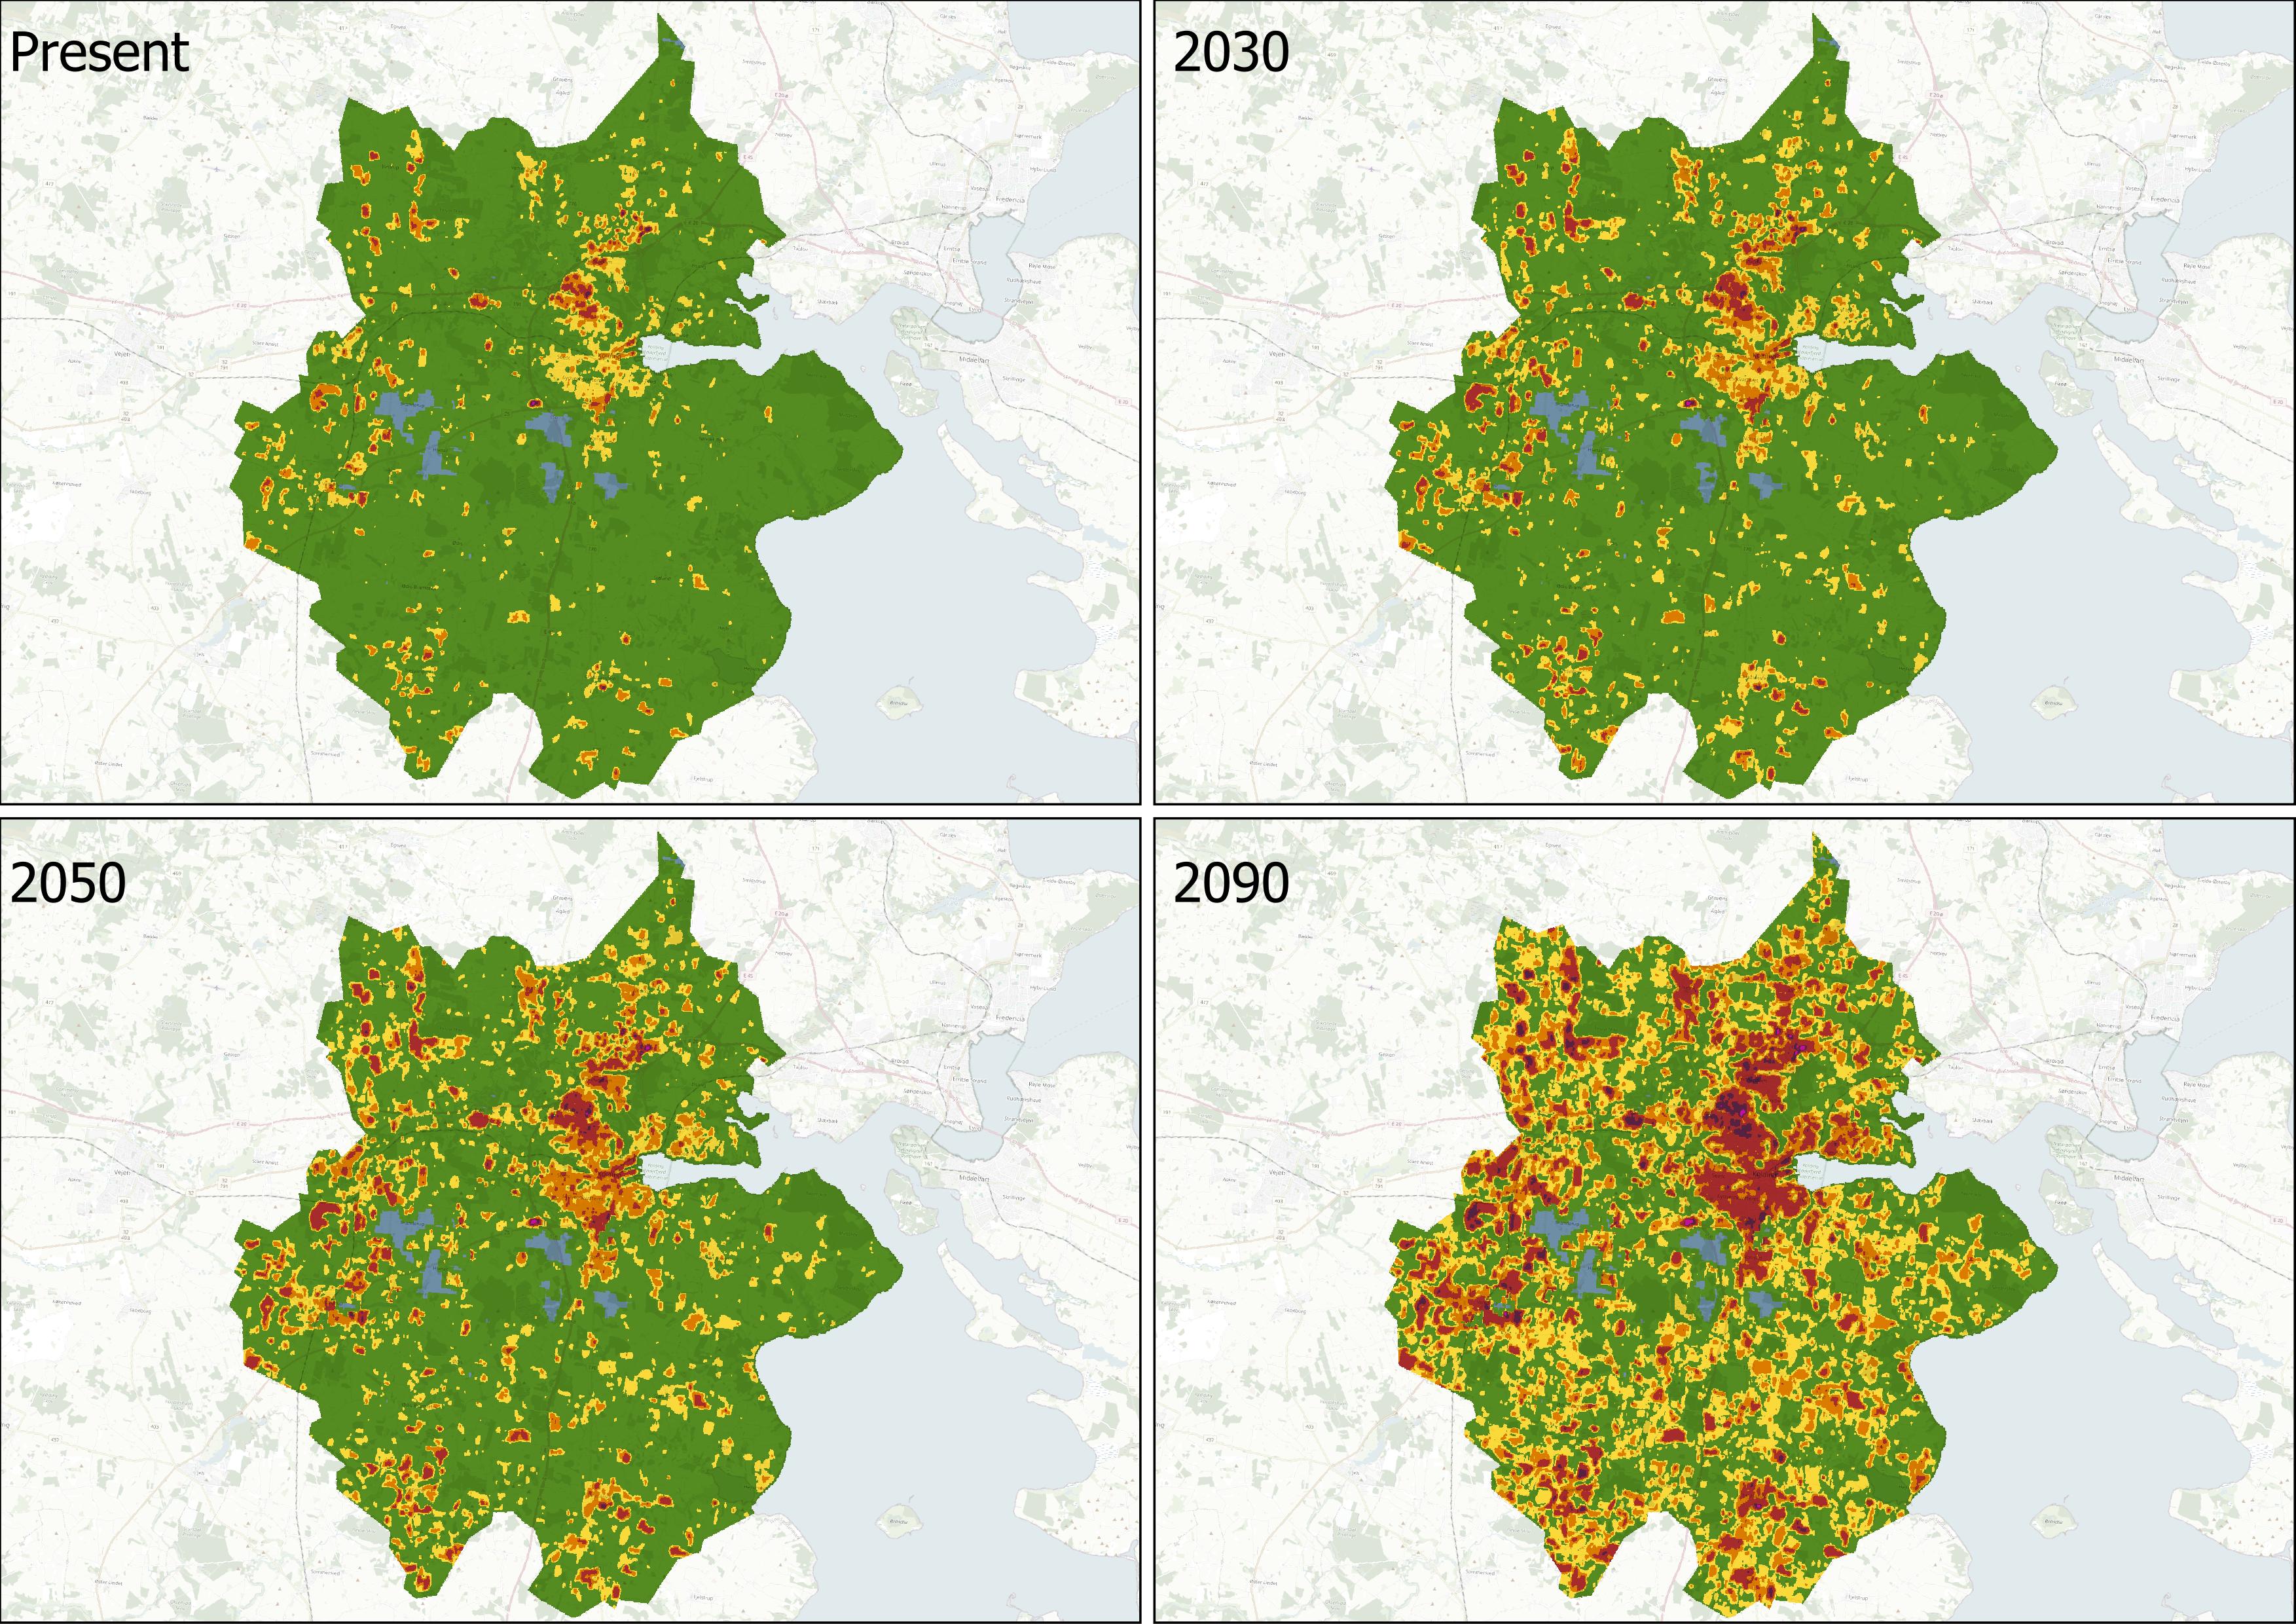
Figure 47. Scenario illustrating the shifts in climate and their correlation with optimal tree habitats across Kolding municipality. This visualisation emphasises how changing climate conditions affect areas best suited for tree growth, providing insights into the sustainability and adaptability of urban forestry in the region.
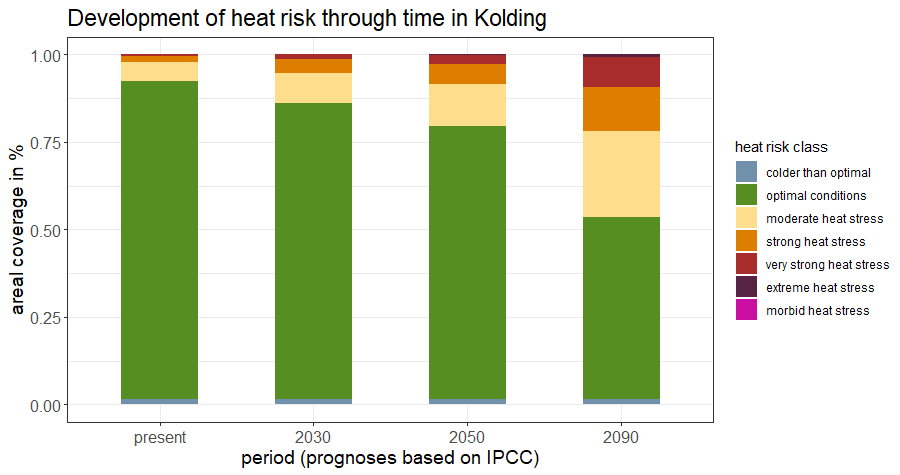
Figure 48. Percentage of the municipality classified within each category and its changes over time
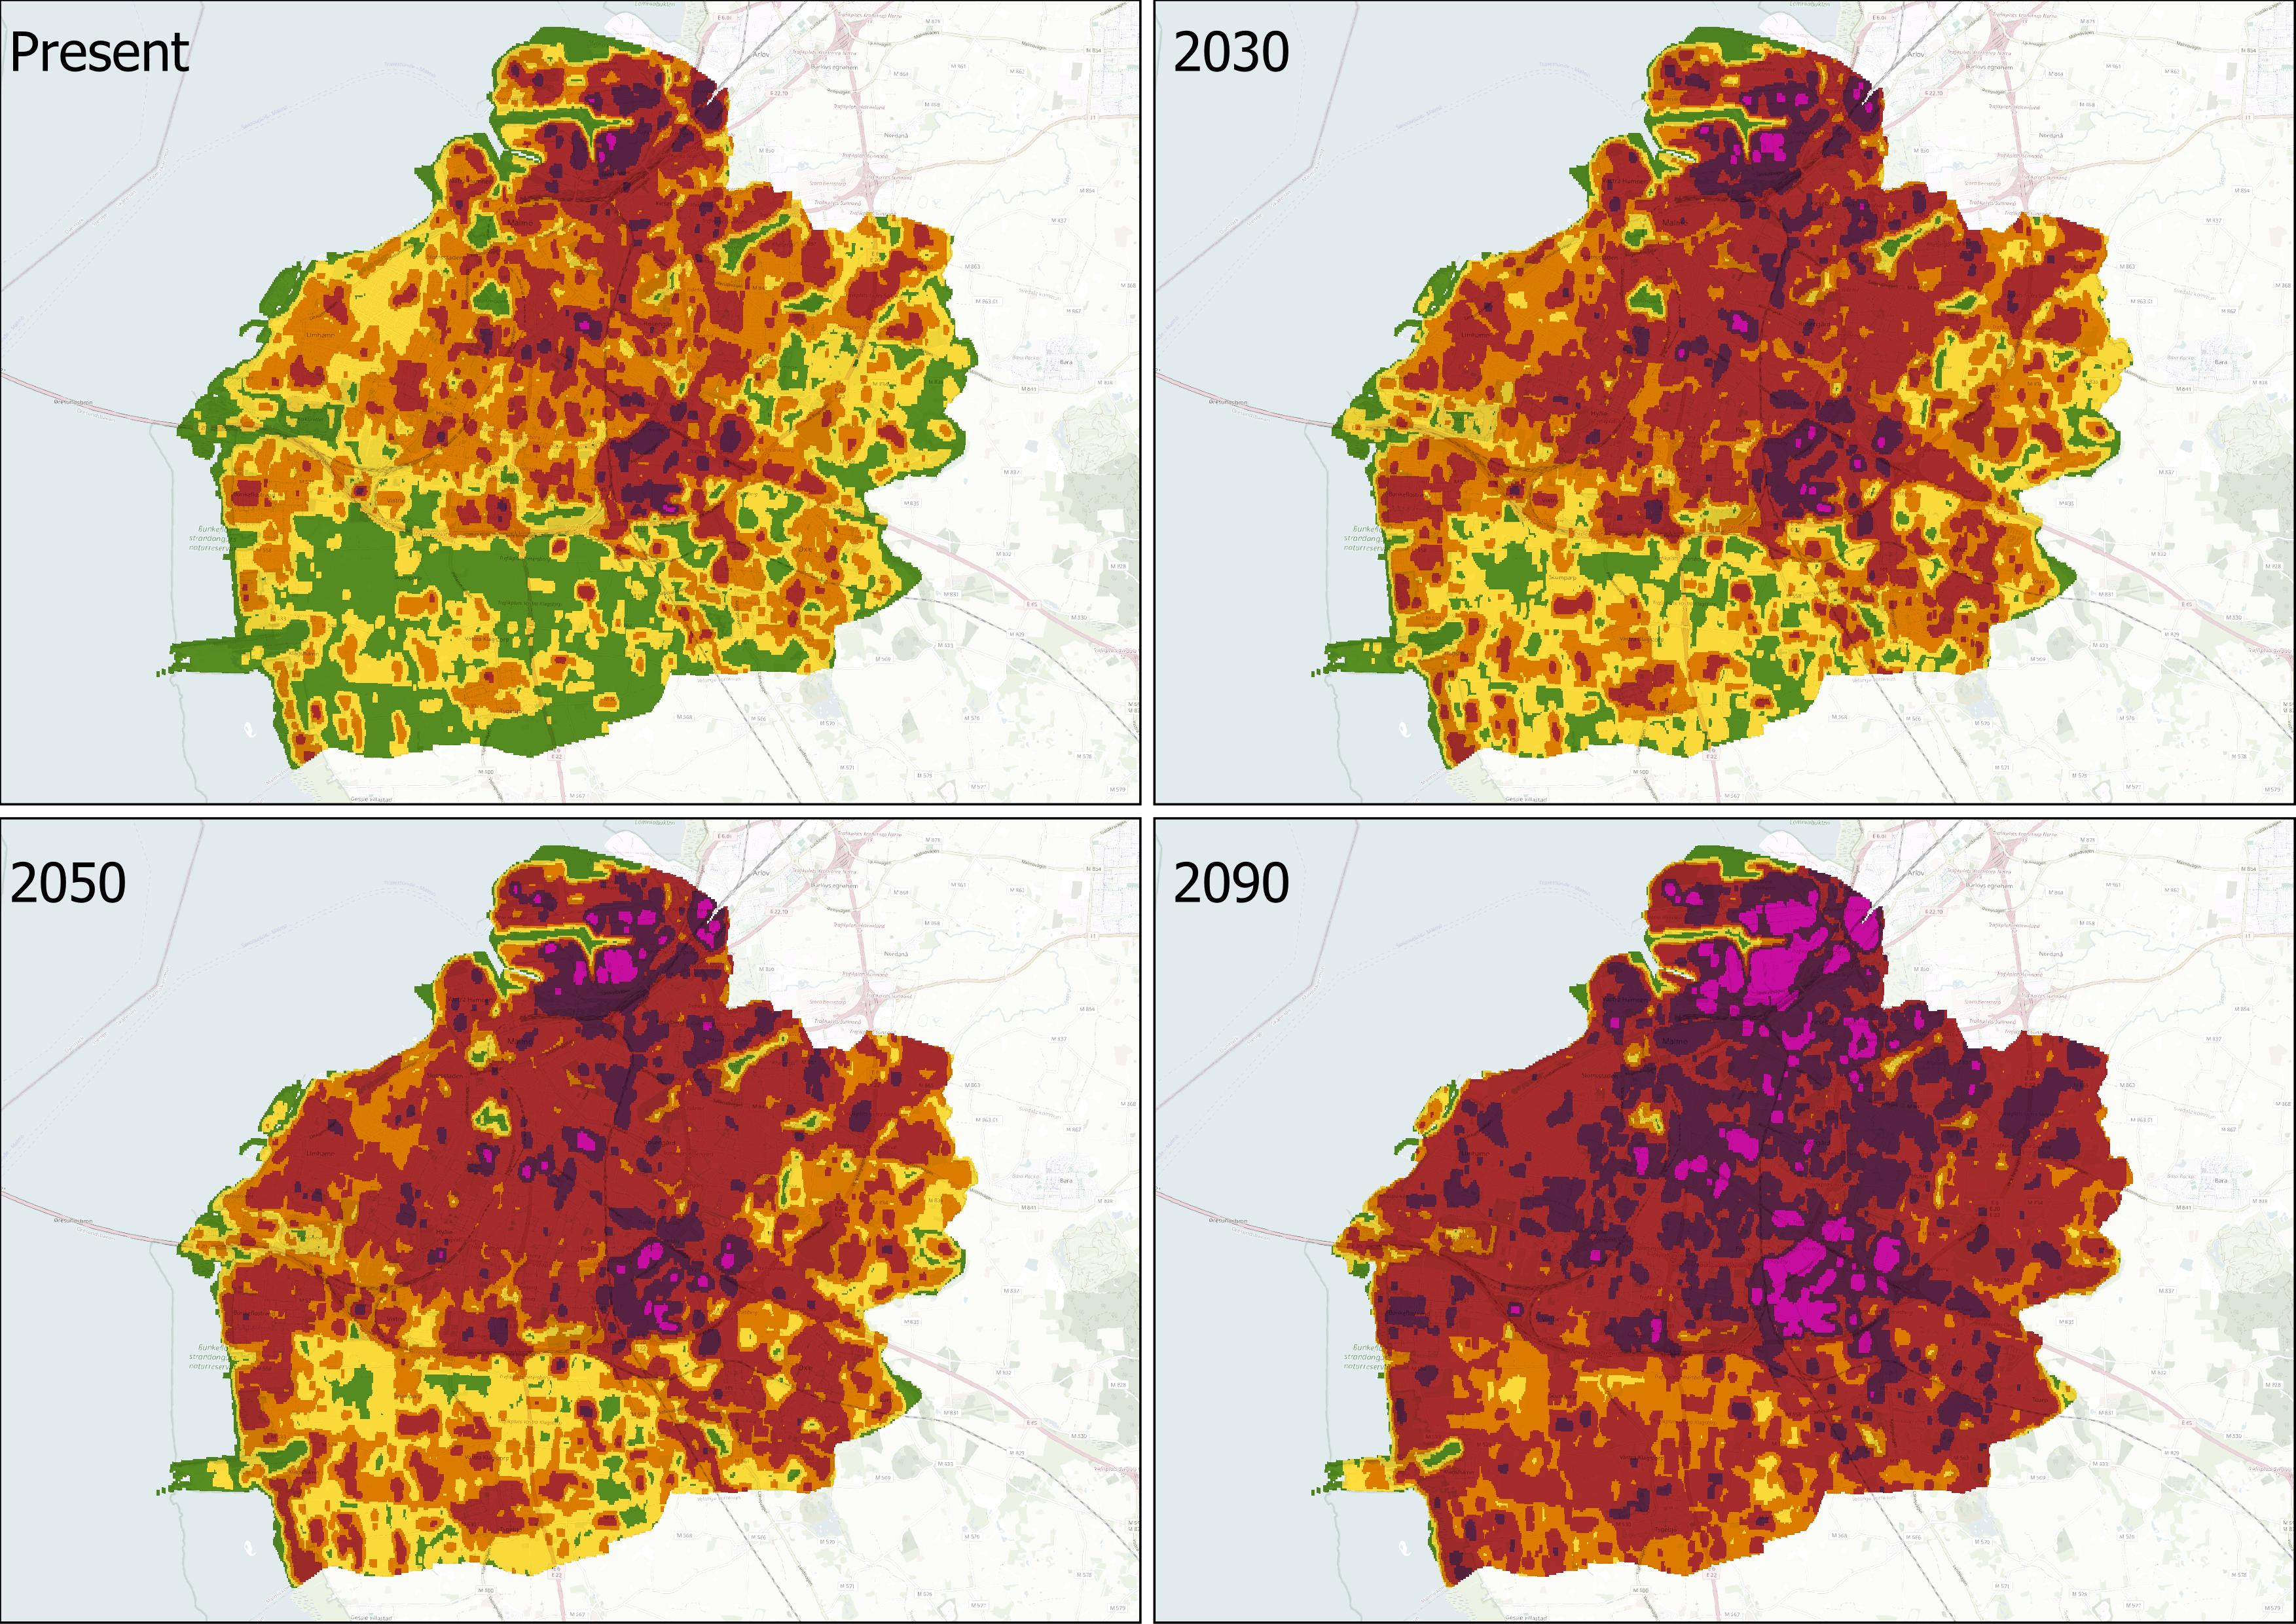
Figure 49. Scenario illustrating the shifts in climate and their correlation with optimal tree habitats across Malmö municipality. This visualisation emphasises how changing climate conditions affect areas best suited for tree growth, providing insights into the sustainability and adaptability of urban forestry in the region.
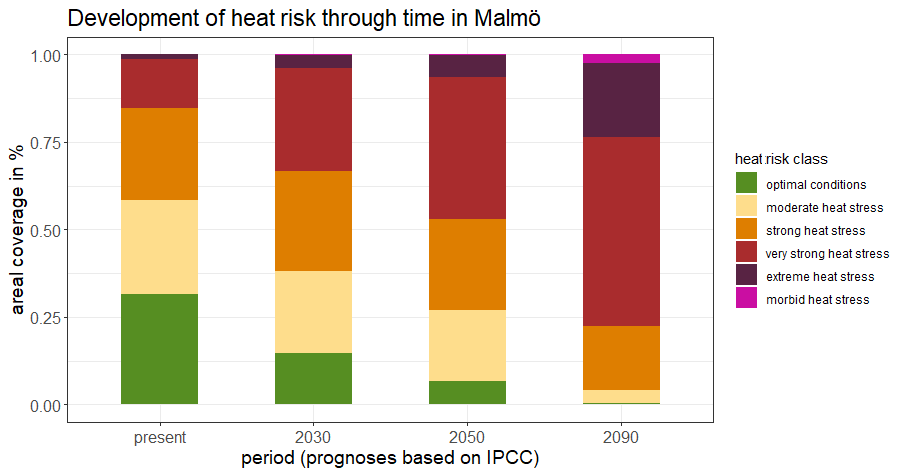
Figure 50. Percentage of Malmö municipality classified within each category and its changes over time.
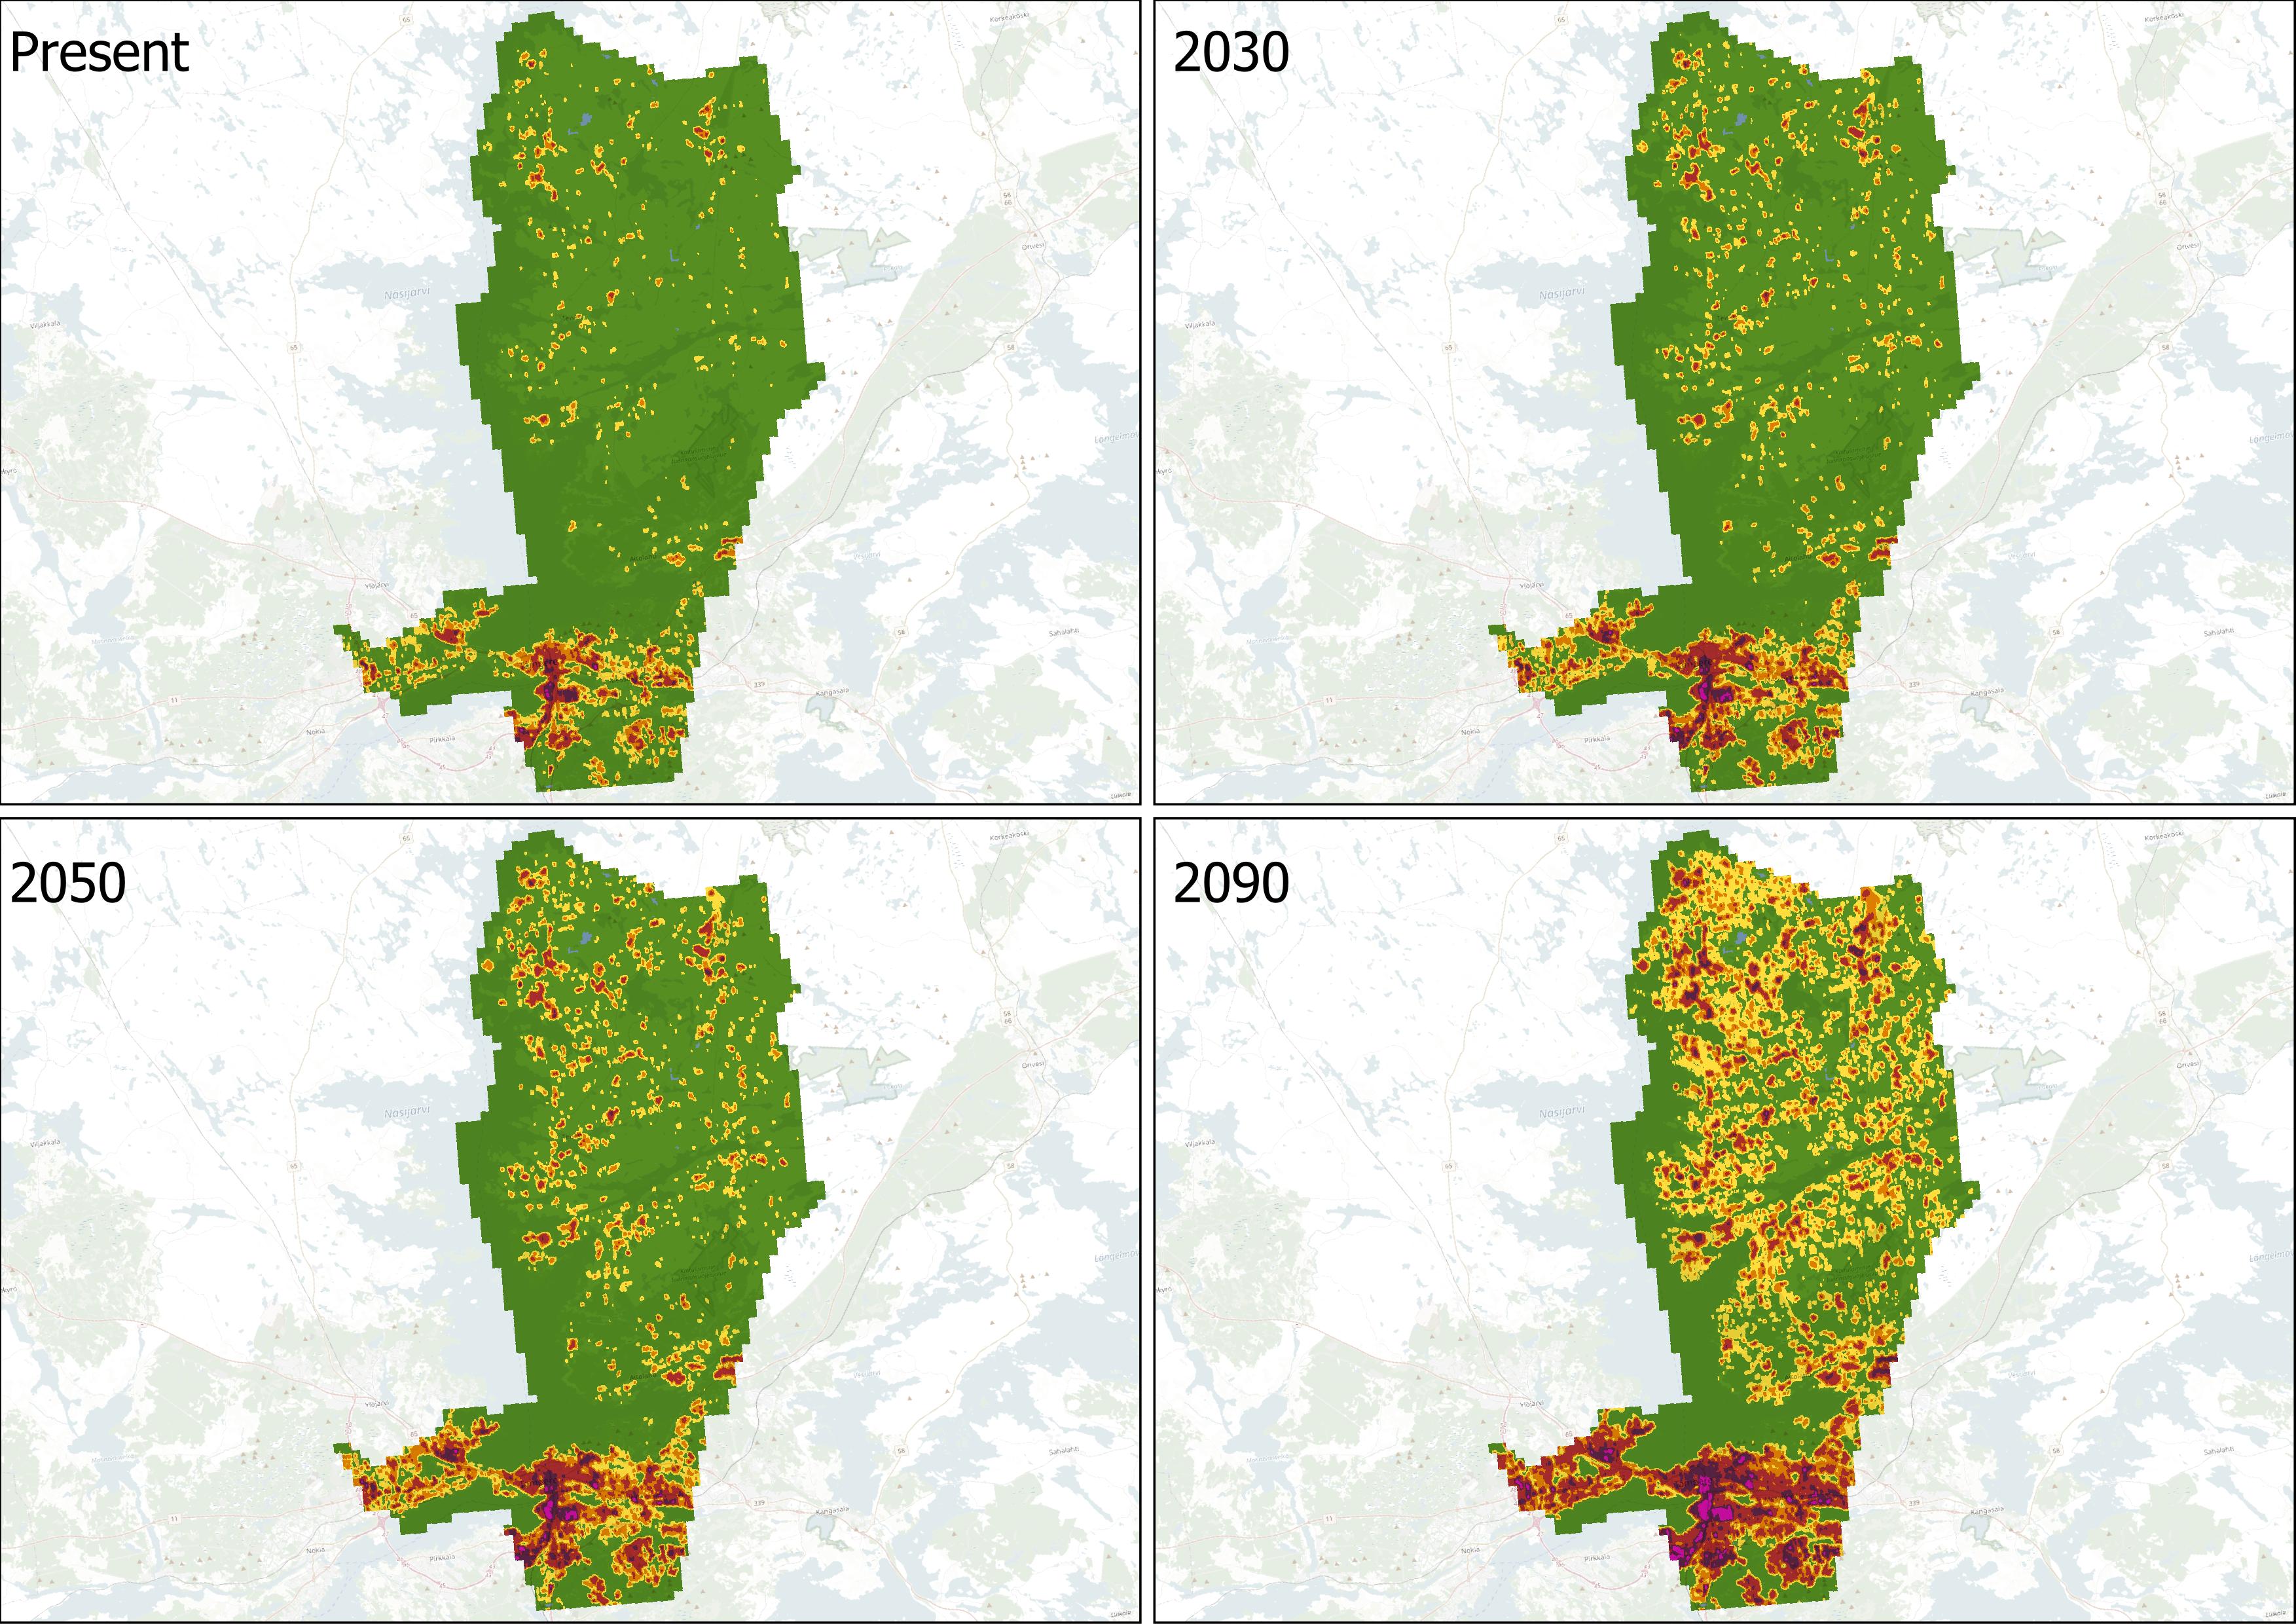
Figure 51. Scenario illustrating the shifts in climate and their correlation with optimal tree habitats across Tampere municipality. This visualisation emphasises how changing climate conditions affect areas best suited for tree growth, providing insights into the sustainability and adaptability of urban forestry in the region.
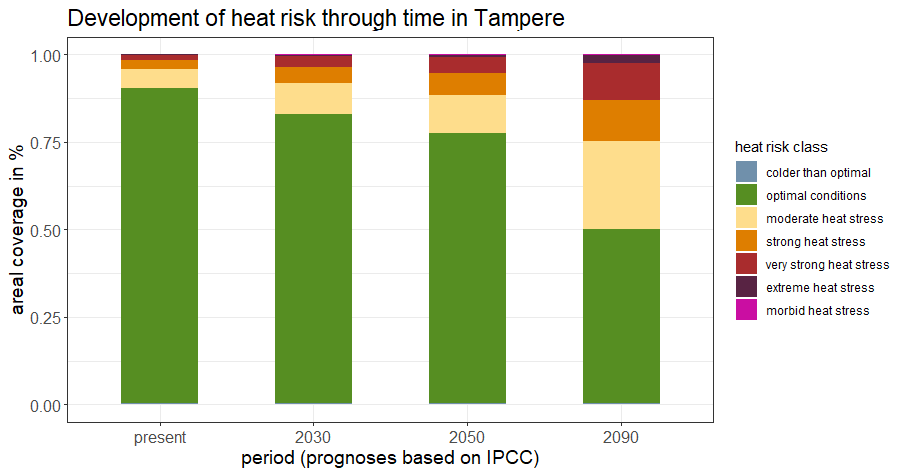
Figure 52. Percentage of Tampere municipality classified within each category and its changes over time.
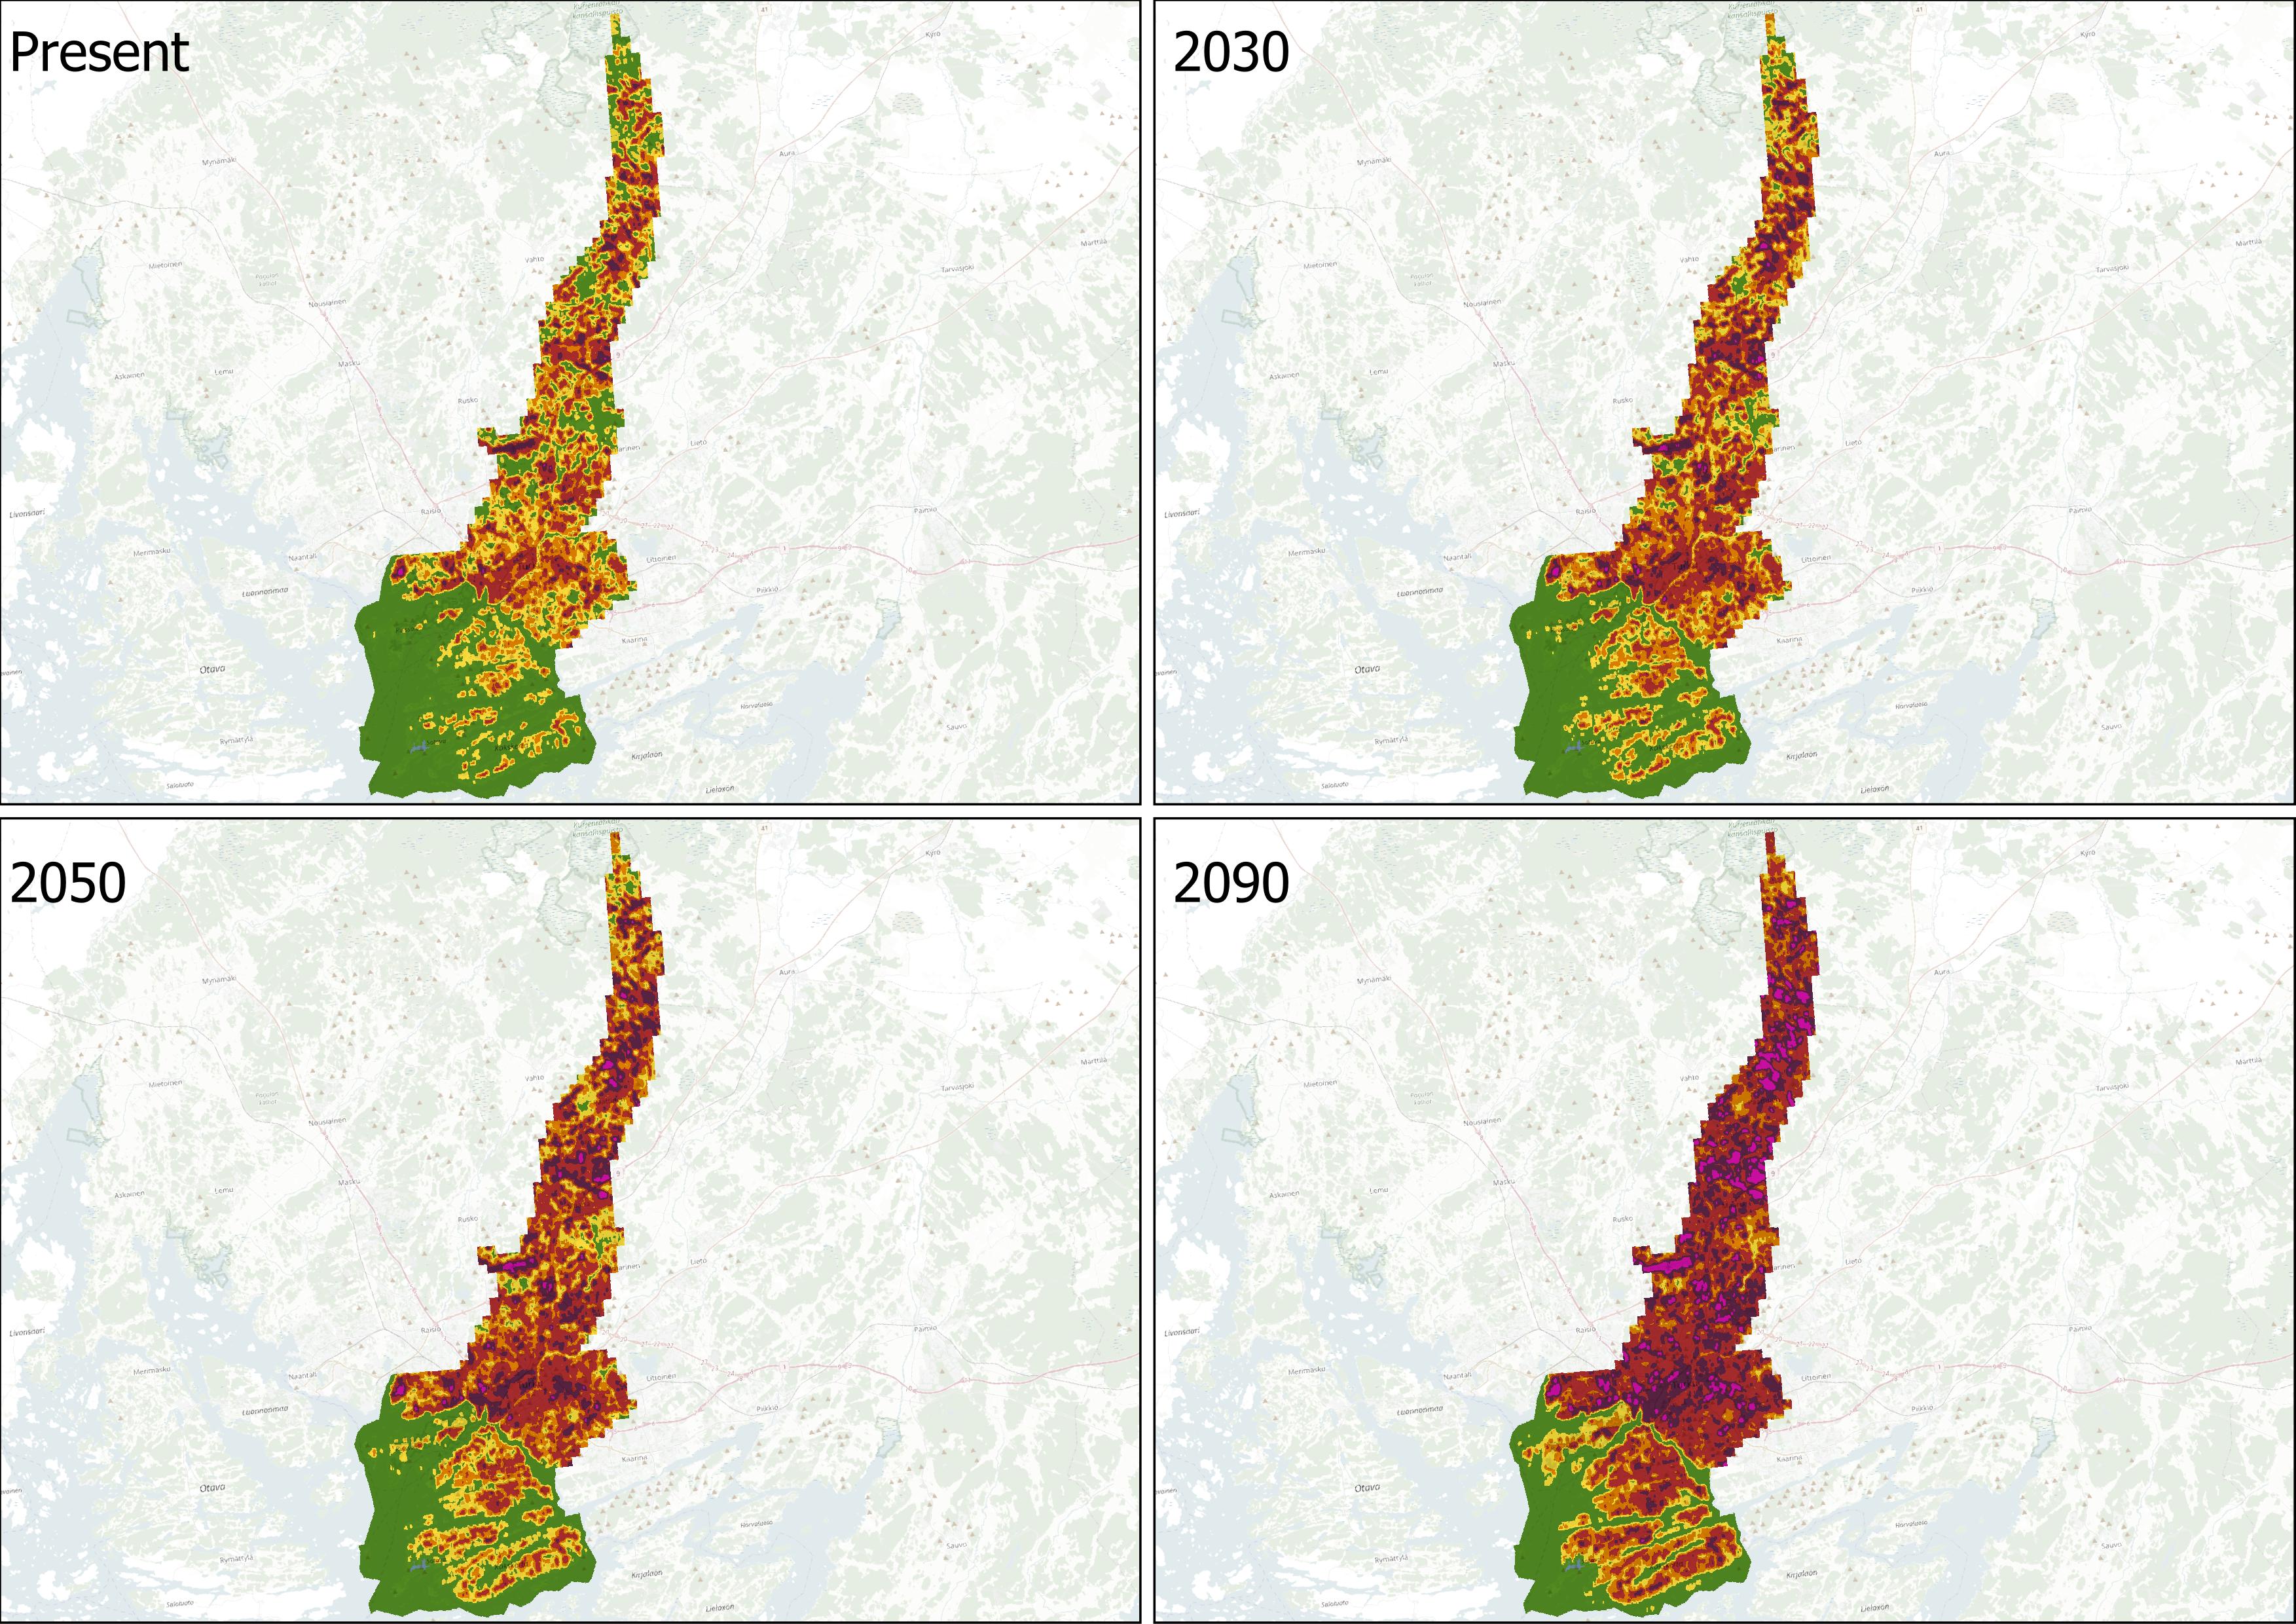
Figure 53. Scenario illustrating the shifts in climate and their correlation with optimal tree habitats across Turku municipality. This visualisation emphasises how changing climate conditions affect areas best suited for tree growth, providing insights into the sustainability and adaptability of urban forestry in the region.
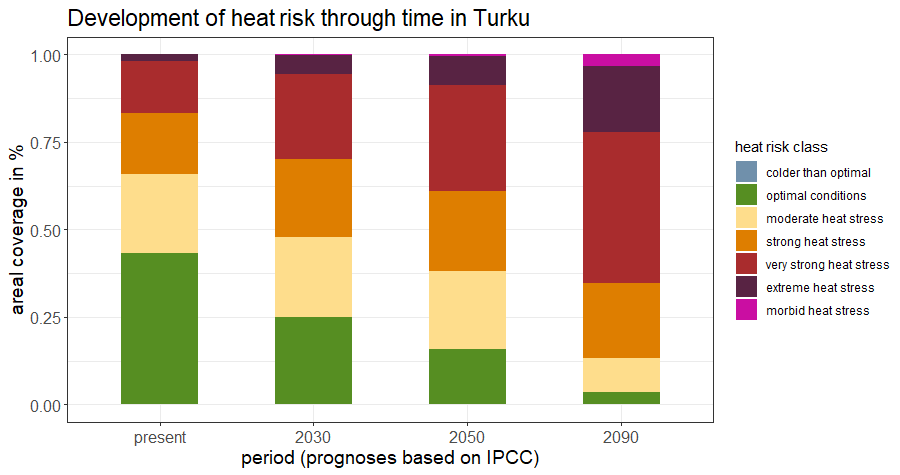
Figure 54. Percentage of Turku municipality classified within each category and its changes over time.
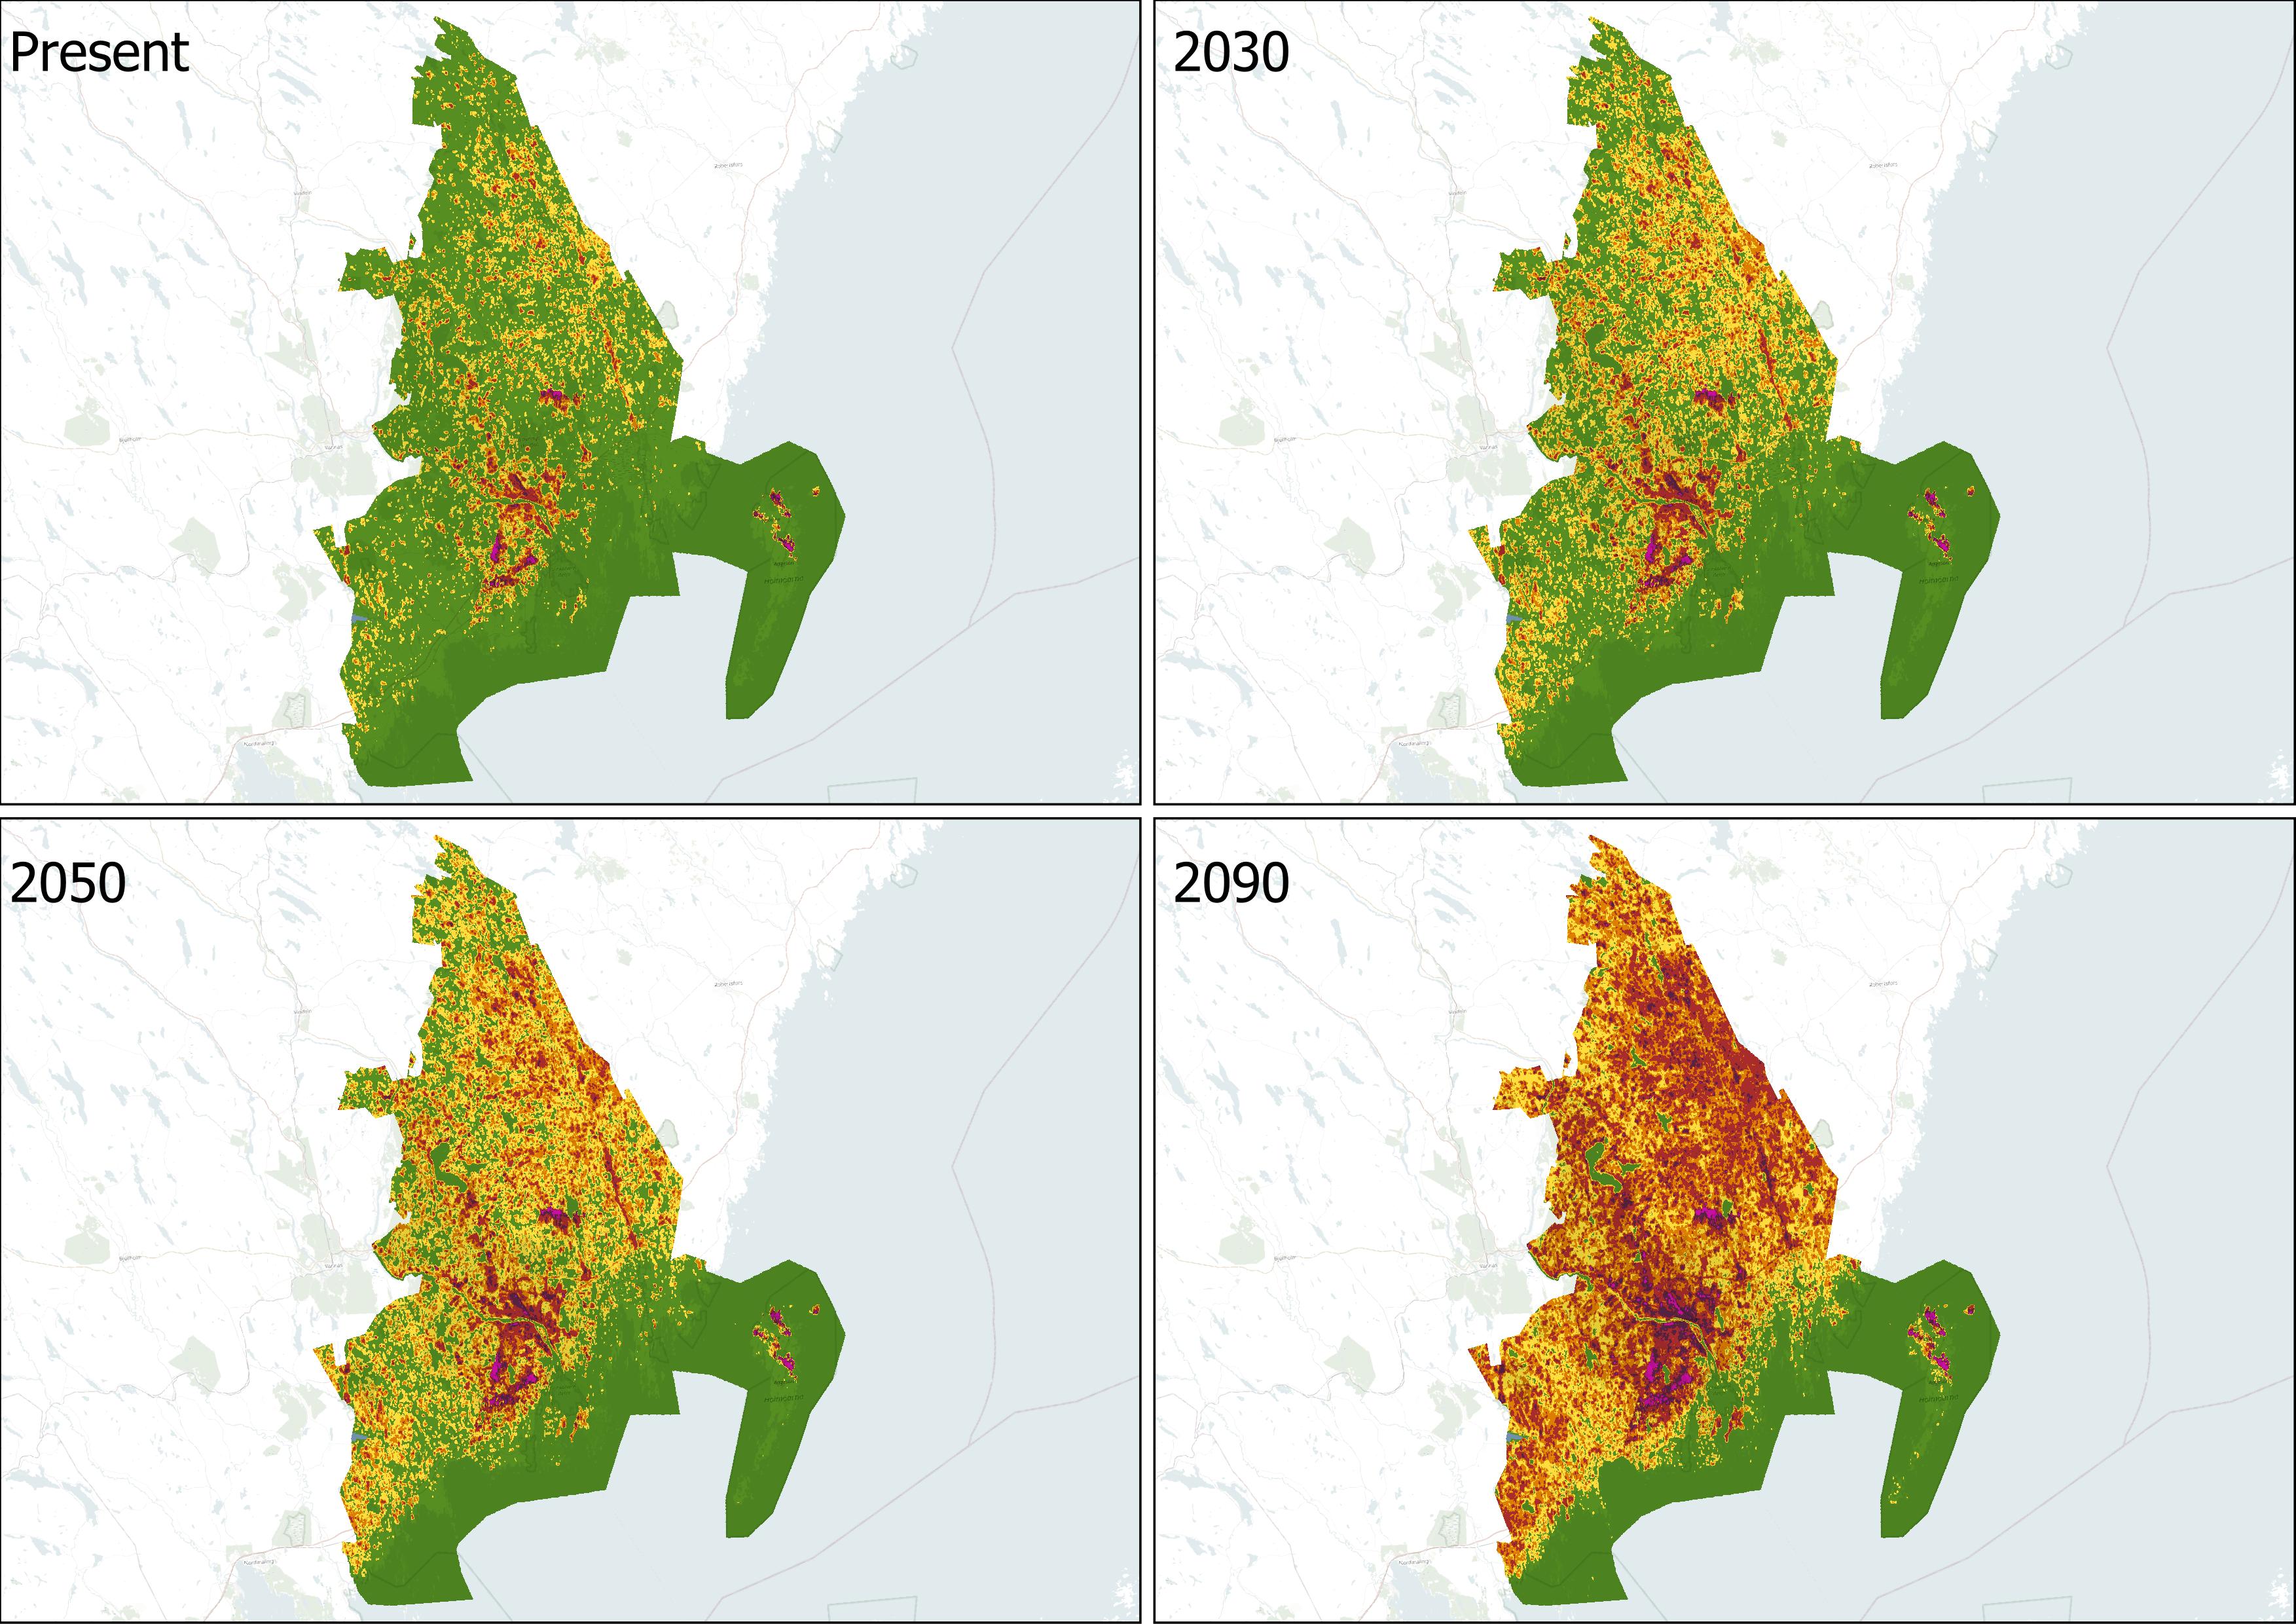
Figure 55. Scenario illustrating the shifts in climate and their correlation with optimal tree habitats across Umeå municipality. This visualisation emphasises how changing climate conditions affect areas best suited for tree growth, providing insights into the sustainability and adaptability of urban forestry in the region.
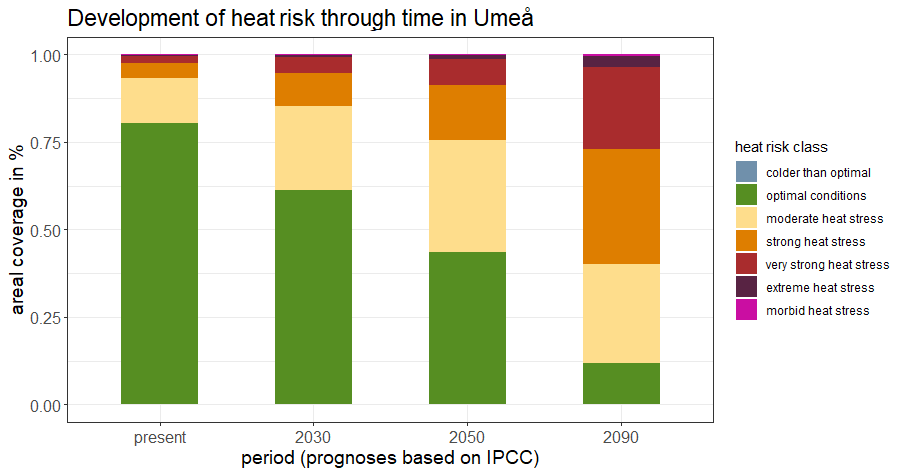
Figure 56. Percentage of Umeå municipality classified within each category and its changes over time.