6. Assessment of selected Norwegian measures
6.1 Electricity support for households
By far, the largest support scheme in Norway is the electricity price support to all households.
Note that there was also an electricity cost support component for households eligible for receiving housing support. This also depend on electricity prices. We do not analyse that scheme here (see e.g., Dalen and Halvorsen 2022, chapter 7)
Figure 5 Electricity prices (øre /kWh) in Norway last 10+ years (quarterly) and electricity support. Note: Weighted average prices across different price zones. Source: NVE/SSB
The support scheme has undergone several changes, but the initial version provided an ex-post monthly support of 55 percent of the electricity costs of households (not recreational homes/cabins) when the market price was on average 70 øre/kWh or more (exclusive of VAT) per month. A ceiling was also adopted, set to 5000 kWh per household per month. In January 2022 the compensation level was increased from 55 to 80 percent. In March 2022, it was announced that the scheme would be extended for a year to March 2023. In September 2022 the compensation level was increased again to 90 percent.
In November 2022, it was decided to extend the support scheme to the end of 2023, where the 90 percent support level would start from October until December 2023, and 80 percent from April until September. Finally, in May 2023 a larger revision was announced. Instead of providing support based on the average monthly electricity price, the support would now be based on the spot price, hour by hour. Hence, for every hour the spot price is higher than 70 øre/kWh in the price zone of the household, 90 percent would be compensated (all year). In addition, the scheme was extended through 2024, with price ceiling increased to 73 øre/kWh, and the consumption ceiling of 5000 kWh left unchanged. For 2023, it was estimated that the scheme would pay out around 18 billion NOK,
6.1.1 Distributional impacts
The scheme is general, rather than targeted at specific groups, providing support to all households based on the price in their area of the country. Electricity consumption is highly correlated with household income and (even more so) with house size (Dalen & Halvorsen, 2022), as electricity is the main source of heating. The absolute size of the electricity support increases with income. For example, in December 2021 it was more than twice as high on average for households in the highest income decile, compared to the lowest (Dalen & Halvorsen, 2022). The figure below shows how electricity costs vary predictably between different deciles of household income in Southern Norway, the highest decile consuming 2–2.5 MWh more than the lowest decile per month.
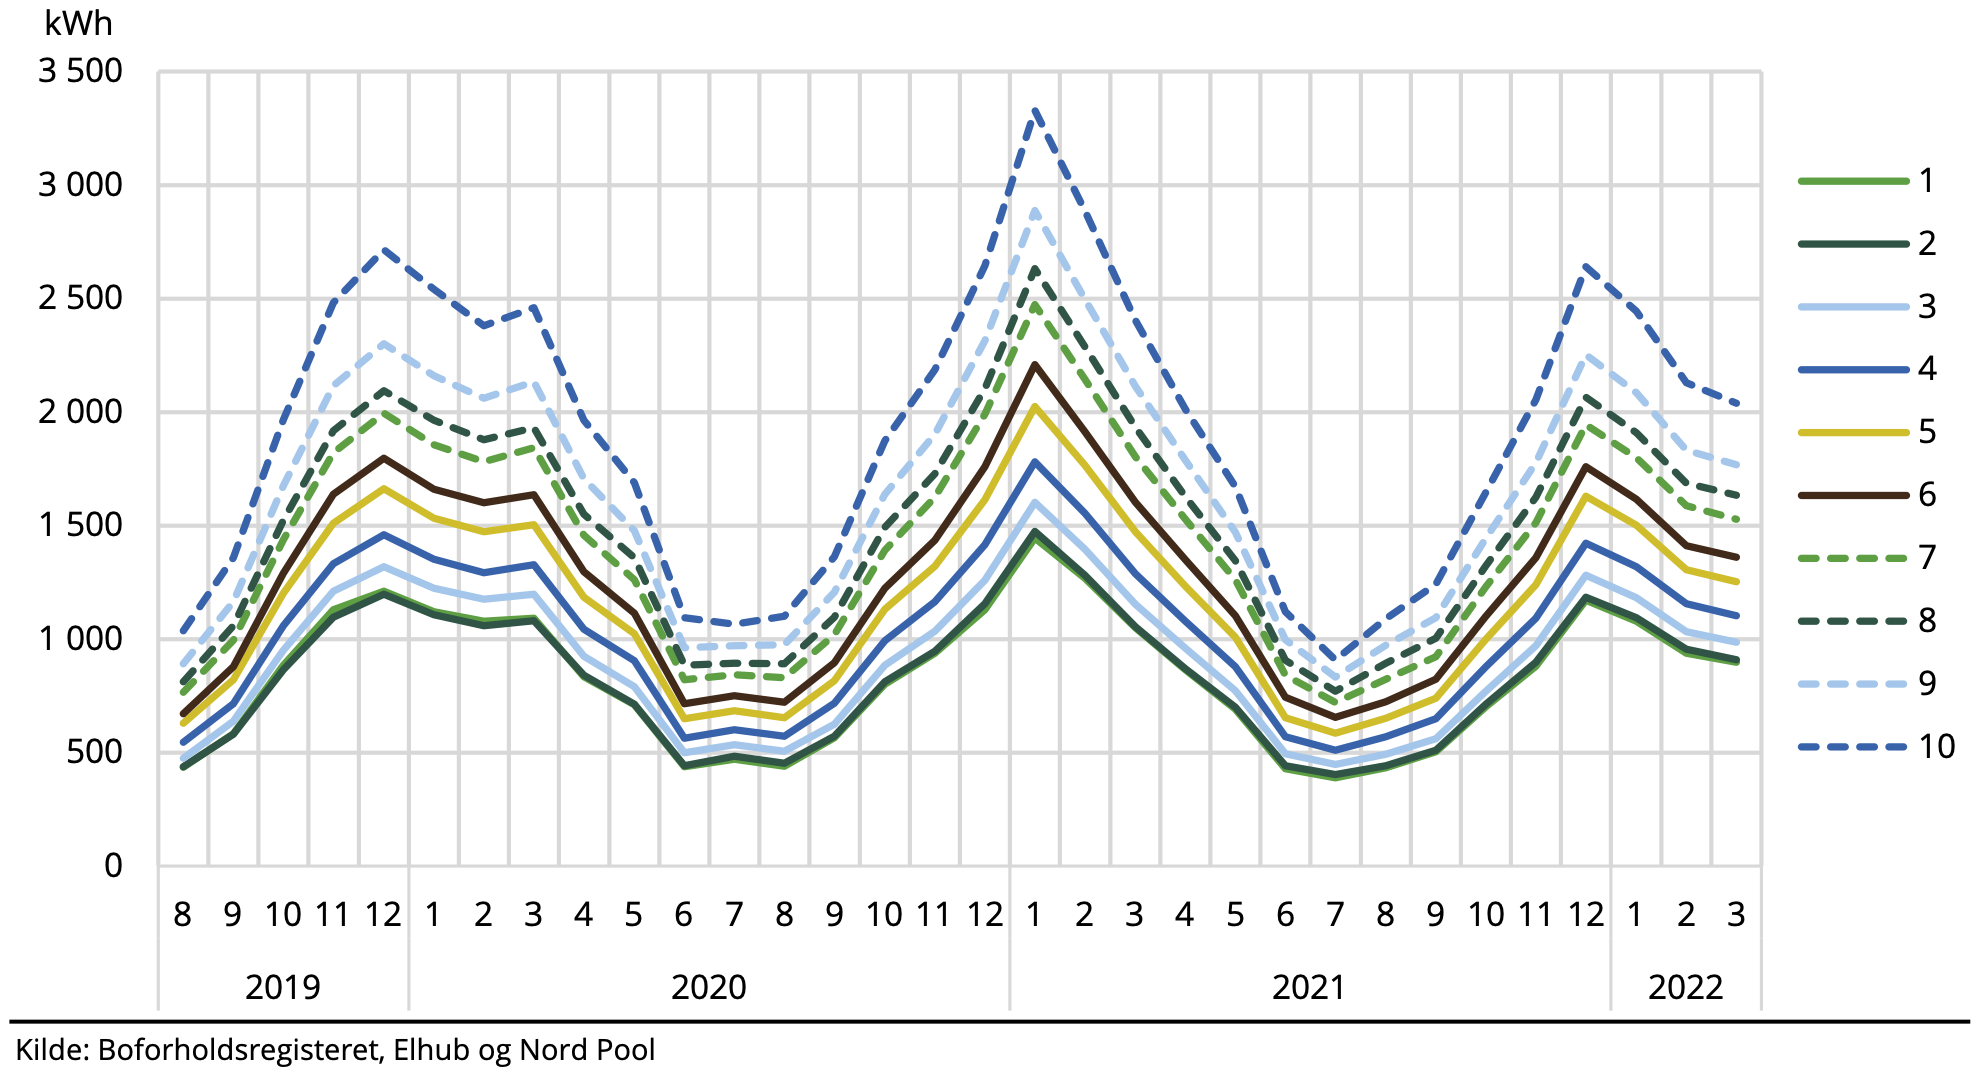
Figure 6 Average electricity consumption per household by disposable income decile (marked from lowest,1, to highest, 10, decile) August 2019 – March 2022, Southern Norway, kWh. Source: (Dalen & Halvorsen, 2022)
As analysed by Dalen & Halvorsen (2022), the budget shares for electricity costs varied from 2–3 percent for the highest income decile, to 11 percent for the lowest decile, during the winter months of the 2021/22 period. The corresponding shares during the 2019/20 and 2020/21 periods were well below 0.5 percent for the highest decile, and 2–3 percent for the lowest. This indicates that the spread of income shares across income groups has increased substantially during the electricity crisis, and that the price increases in the last period were a particularly heavy burden for the lowest income households. The electricity support did, during the winter of 2021/22, move the budget shares spent on electricity from around 11 percent to 7.7 percent in the lowest income decile. For the highest income decile, the budget share decreased from between 2–3 percent to below 2 percent. Note that Dalen and Halvorsen (2022) end their analysis in the third month of 2022, so it does not capture later changes in the scheme or its effect. However, the most pronounced effects were the highest the first winter, where prices were at their highest compared to previous years.
The numbers above illustrate the immediate effect of the electricity support among income groups but does not give a complete picture. This is because we have not factored in how households can change their behaviour and reduce electricity costs, e.g., by saving electricity in response to high prices. Such an analysis requires, as noted in Chapter 2, some view of the counterfactual without electricity support. Dalen & Halvorsen (2022) make a rough assessment and find that households across all income groups likely conduct some electricity savings in response to the price increases, which is likely dampened somewhat due to the support. They also find that households tend to reduce consumption of other goods and services more to account for increases in electricity prices, since electricity is a necessary good, and hence costs are difficult to reduce in the short run. The support is relatively more important for the lower income groups.
6.1.2 Climate and environmental impacts
As noted previously, it is a highly complex task to assess the impacts of the support scheme on electricity consumption, and ultimately emissions. This is further complicated by all the adjustments made in the scheme. Theoretically, a price support scheme like the one implemented will disincentivize energy savings, all other things equal. Since the support scheme was announced in a staggered way, paid out ex-post, relatively complicated and not fully transparent for everybody, it is likely that the behavioural response was far from what could be expected by fully rational economic agents. However, it is also likely that once the scheme had been communicated and experienced by consumers, they would gradually learn and adjust their behaviour more according to standard demand models when prices change. Unfortunately, none of the studies we have found have tried to estimate the likely effect.
Based on theory and anecdotal evidence, the measure, especially in its initial phase when support was based on an average monthly electricity price, had some clear boosting effects on electricity consumption. For example, the initial design had the perverse effect that households could gain increased support by consuming more electricity during low price periods during the month, especially if they had a fixed price agreement. There were high profile media cases showing people inviting neighbours around for free electric vehicle charging, and examples of wasting electricity (e.g., keeping hot tubs on max temperature etc). For this reason, a later change to the measure linked the support to spot prices. All in all, it is likely that the support increased electricity consumption compared to a situation without the support, but the size of this increase is uncertain. How this change has, in turn, impacted emissions is even more uncertain. Electricity production is part of the EU ETS, so emissions are capped through that system. However, this CAP allows for some temporal storage, weakening such direct effects.
As electricity is important for heating in Norway, the electricity price increase resulted in hoarding and increased use of firewood, an important substitute for heating purposes. The burning of firewood is not covered by the EU ETS, but changes in the carbon stock in forests due to potentially reduced stock captured in the LULUCF accounting. Furthermore, as mentioned in Chapter 4.3.2, the net climate change effect of increased biofuel use is debated, and small-scale household use of biofuels is associated with relatively large emissions of fine particulate matter with associated health impacts (Gustafsson et al., 2022 and Savolahti et al., 2019).
6.1.3 Coherence with existing policies
The support measure is coherent with other distributional policies, except that it, in an absolute sense, benefits higher income groups more than lower income groups. The measure is not explicitly designed to impact people’s energy consumption behaviour, so in this sense it is not coherent with the aims of saving energy and the need to speed up the green transition.
6.2 Electricity support for businesses
The Norwegian government introduced an energy support measure (“Energitilskuddsordningen”) as a temporary arrangement to help companies with extraordinary electricity costs.
6.2.1 Distributional impacts
According to ENOVA’s own statistics,
Energitilskuddsordningen, 2023. https://www.energitilskuddsordningen.no/statistikk-for-energitilskuddsordningen
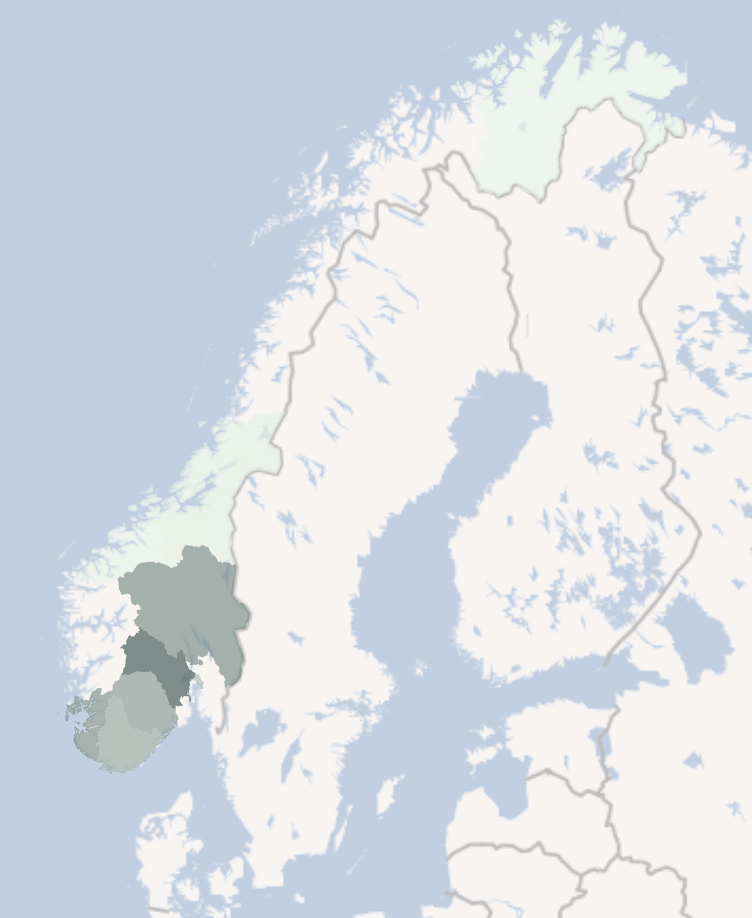
Figure 7 Overview of areas of Norway where companies received electricity support (darker colour, more companies). Source: (Energitilskuddsordningen, 2023)
6.2.2 Climate and environmental impacts
As with other support measures, it is hard to estimate the environmental impact of the measure. For this measure it is relevant both to consider whether the support itself increased energy consumption through dampening of the price signal to save on electricity use (as for the household support measure above), and whether the energy saving solutions would have been installed regardless of the measure or not. For the price effect, the same arguments as made above for households are, in principle, valid here. However, in this case the support measure was announced in September 2022, with the calculation basis for refund being the first six months. So, unless companies had some clear expectation early in the first half of 2022 that they would receive electricity support, they are unlikely to have increased their electricity consumption. For the majority of companies this is likely the case, though we have found no studies analysing this question. Hence, this support measure likely did not impact companies’ electricity consumption or behaviour more generally (e.g., substituting electricity with other energy sources for heating etc.). To our knowledge, as the measure is temporary and not in operation in 2023, there are only small effects on expectations for future support.
In terms of support for investments in energy saving solutions, this is trickier to assess. According to ENOVA, 8081 energy saving investments received support, which as noted above, constituted around 83 percent of the total support. Out of the 8081 solutions, the top five types of solutions (number of solutions in brackets) were energy efficient lighting (LED) (1328), solar panels (1006), heat pumps (air to air) (936), changing windows (705) and energy management systems etc (674). Considered in isolation, such investments are of course positive in that they reduce energy consumption. The question is how many of the solutions would have been implemented anyway, given the high electricity prices. In practice, some probably would have been, but far from all, so the net effect is positive.
6.2.3 Coherence with existing policies
It is less common to provide support to disadvantaged companies than to households, though there are of course a number of subsidy schemes available for individual sectors and to stimulate rural settlements, etc. (e.g., in agriculture). In this sense, the measure is similar to and coherent with other support schemes for companies. Since the measure was unlikely to dampen the price signals for saving energy, and in addition, offered support for investments in energy saving solutions, the support measure is coherent with other environmental and climate policies trying to reduce electricity consumption.