Appendix B. Visual representations of open-ended associations per country
The word clouds below show a visual representation of the most frequent 10 words or concepts per country, based on the frequency with which the different codes were mentioned in the respective country. The bigger the text, the more frequently the concept was mentioned. Therefore, only the size of the text in the visual representation carries meaning related to the frequency of mentions. The word clouds have been made using Word It Out https://worditout.com/.
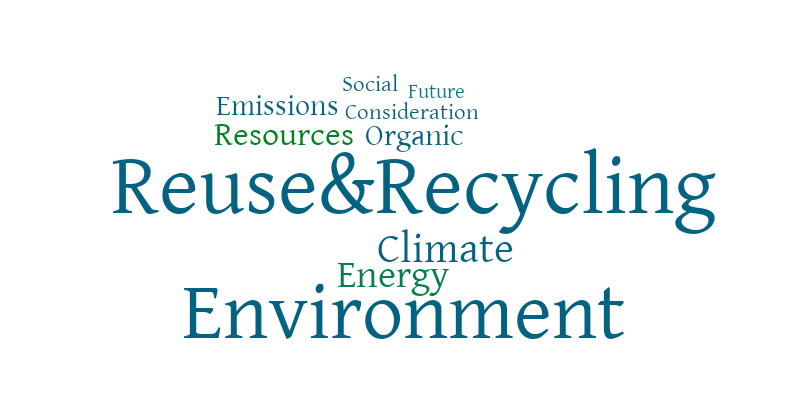
Figure 5. Word cloud of the ten most frequently mentioned codes in relation to sustainability (i.e., bæredygtighed) in Denmark.
Note. This is a visual representation where the size of the codes reflects the frequency with which they were mentioned, thus larger size reflects higher frequency.
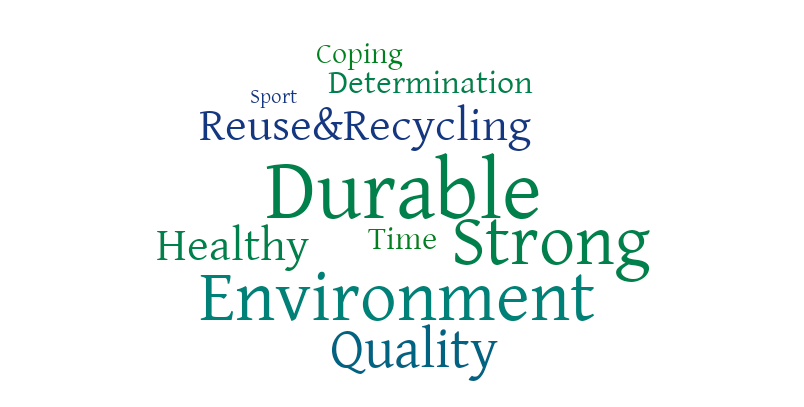
Figure 6. Word cloud of the ten most frequently mentioned codes in relation to sustainability (i.e., kestävyys) in Finland.
Note. This is a visual representation where the size of the codes reflects the frequency with which they were mentioned, thus larger size reflects higher frequency.
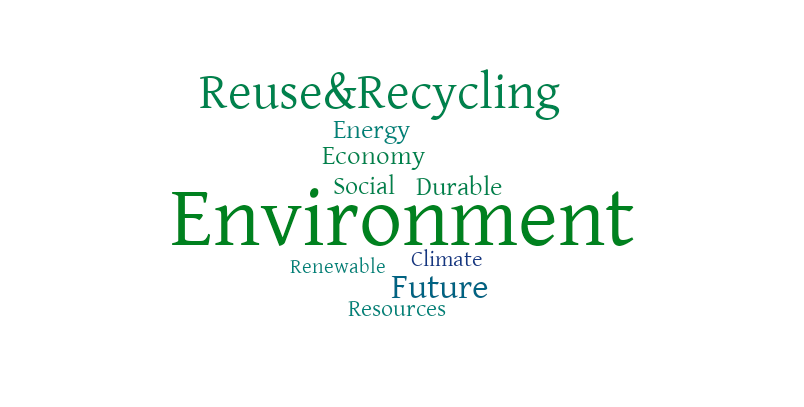
Figure 7. Word cloud of the ten most frequently mentioned codes in relation to sustainability (i.e., bærekraft) in Norway.
Note. This is a visual representation where the size of the codes reflects the frequency with which they were mentioned, thus larger size reflects higher frequency.
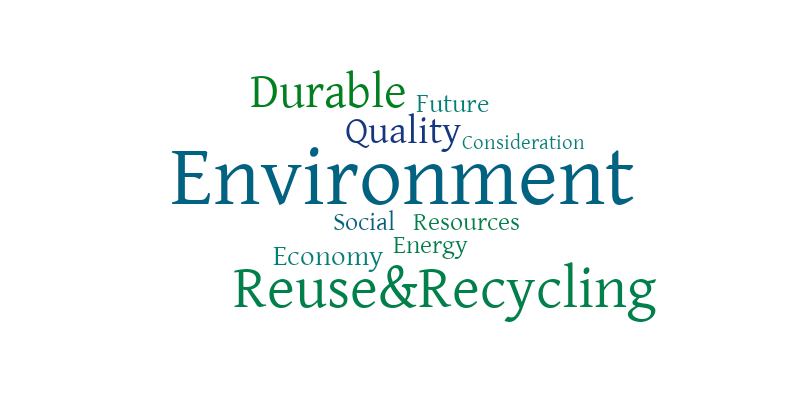
Figure 8. Word cloud of the ten most frequently mentioned codes in relation to sustainability (i.e., hållbarhet) in Sweden.
Note. This is a visual representation where the size of the codes reflects the frequency with which they were mentioned, thus larger size reflects higher frequency.
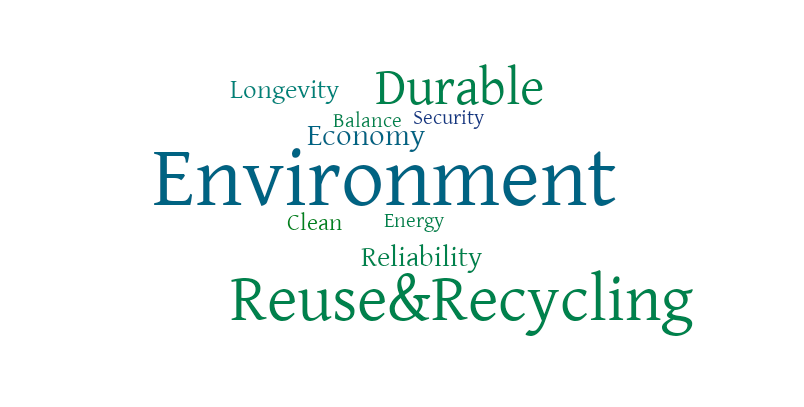
Figure 9. Word cloud of the ten most frequently mentioned codes in relation to sustainability (i.e., tvarumas) in Lithuania.
Note. This is a visual representation where the size of the codes reflects the frequency with which they were mentioned, thus larger size reflects higher frequency.
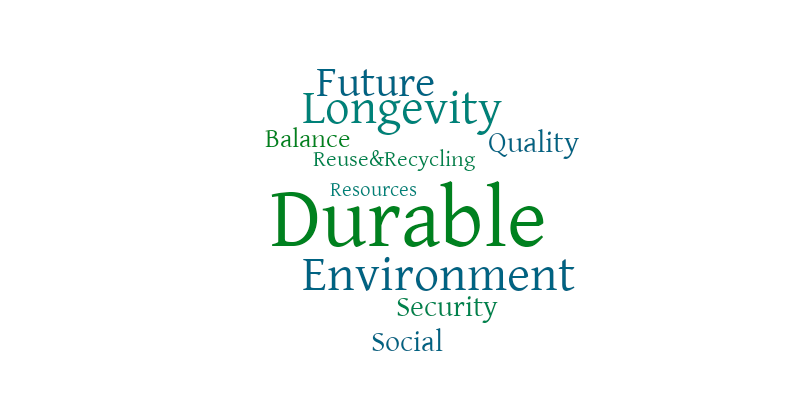
Figure 10. Word cloud of the ten most frequently mentioned codes in relation to sustainability (i.e., ilgtspējība) in Latvia.
Note. This is a visual representation where the size of the codes reflects the frequency with which they were mentioned, thus larger size reflects higher frequency.
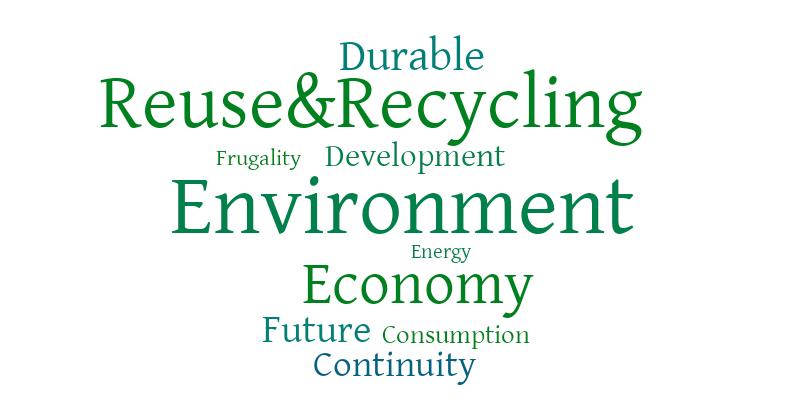
Figure 11. Word cloud of the ten most frequently mentioned codes in relation to sustainability (i.e., jätkusuutlikkus) in Estonia.
Note. This is a visual representation where the size of the codes reflects the frequency with which they were mentioned, thus larger size reflects higher frequency.