2. Domestic tourism in the Nordics and effects of Covid-19 pandemic
This chapter presents an overview of the domestic tourism in the Nordic countries before, during and after the Covid -19 pandemic. The overview is mostly based on statistical analysis and enriched by findings from the country cases, the interviews, and the survey. The chapter begins with an overview of domestic tourism in the Nordic countries, followed by a more specific examination of the situation of each country. After this, we take a closer look at domestic tourism in the autonomous areas in the Nordics: the Faroe Islands, Greenland and Åland. Another sub-chapter deals with the issue of domestic same-day visitors, a group that is significant in the domestic tourism market. The chapter ends with an examination of the situation of domestic tourism in the Nordic countries and autonomous areas in the current, post-pandemic times.
Main findings in this chapter are:
- Domestic tourism is important for the Nordic countries. In the continental Nordic countries, domestic tourists’ share of all the tourist overnights has been over 60 per cent before, during and after the Covid-19 pandemic. In Iceland and autonomous areas, the share is smaller, but domestic tourism has still been significant for the industry especially during the pandemic.
- The increased volume of domestic tourism was a remarkable factor in keeping the tourism industry in the Nordic countries and autonomous areas afloat during the zenith of pandemic in 2020 and 2021.
- According to the overnight statistics, the year 2022 was an exceptionally good year for Nordic tourism, and domestic tourism played a role here, as the number of domestic tourists was higher than before the pandemic in both relative and absolute terms.
- Before the pandemic, domestic tourism was not paid much attention in comparison to inbound tourism. The pandemic emphasized domestic tourism’s significance, but the methods of its governance are still quite basic and vary greatly by country.
- Those tourism enterprises that have been able to increase number of domestic customers compared to pre-pandemic situation are also twice as likely to be doing better economically in terms of revenue, number of employees and number of customers in general compared to enterprises that have the same number or less domestic customers than before the pandemic.
- Investing in domestic tourism has helped tourism enterprises in the Nordic countries not only to survive the Covid-19 crisis, but also to be able to grow during it. In the survey, 58 per cent of those companies that have invested more into domestic tourism compared to pre-Covid situation also reported to have more domestic customers, whereas only 22 per cent of those companies who have not invested more report to have more domestic customers.
2.1. Domestic tourism in the Nordic countries
This chapter provides a short overview of domestic tourism and its significance in each Nordic country. In these overviews, the most comparable data available on overnights and tourism consumption will be used. In addition, a summary of the main features of domestic tourism governance in each country will be made. For more detailed information and additional statistical indicators the reader is encouraged to look up the individual country reports included in the annexes.
The overlook of domestic tourism in the Nordic countries is mainly based on statistical analysis. There are some differences between how each country records their statistics; therefore, the examination focuses on country- and region-specific statistics instead of comparing them with each other too heavily. The most widely available and comparable data is accommodation statistics. Data on overnight stays is compiled in all the Nordic countries and autonomous areas, and it is more up to date compared to other types of tourism-related statistical data.
At the time of writing this report, the latest statistical data about overnights available from most Nordic countries was from December 2022 with the exception of Sweden, which only had data available until October 2022. As a source of overnight data, we mainly use a Nordic-wide data set compiled by Visit Finland, since it gives the most comparable view of overnights in all the Nordic countries
Database can be accessed here: https://www.visitfinland.fi/suomen-matkailudata/matkailun-kehitys-pohjoismaissa
In order to have more comparable data from each country, Visit Finland has only included the number of registered overnights in hotels, holiday resorts, youth hostels and camping sites. This data offers the best indicator to measure the differences in the Nordic countries, but it excludes overnights in commercial holiday cottages and commercially arranged rentals in private cottages and apartments. These can be significant for domestic tourism in some countries, but the data available and methods of estimating the numbers of these overnights vary significantly between Nordic countries.
Visit Finland site also includes an interactive PowerBI tool with which to examine the data. For more information about the data and what is included in it, see the glossary on the tool slide 7 here: https://app.powerbi.com/view?r=eyJrIjoiNDY3YzA2YTgtYzE0YS00YTg4LTk0NjItZDcxMWIwYzBkNTA2IiwidCI6IjdjOTRhMjQ4LWVjZjItNDFiNi05YjQyLTkyMzY1MTExNGIwNCIsImMiOjh9
This data also excludes the nights spent in private dwellings, for example, when people stay with friends or relatives or in private cottages. In the case of domestic tourism, these stays can form a significant share of the tourism volume. Unfortunately, since they are not registered, there is very little data available about non-commercial overnights in any of the Nordic countries and comparisons cannot be reliably made. Additionally, same-day visitors make up a sizable part of domestic tourism, but only little data on this group is available. The same-day domestic visitors is examined in Chapter 2.3.
There are also different types of tourism-related data available in the Nordic countries through both official statistical services and individual research projects creating data that is often published in separate reports or journal articles. In these, the methods, timespans and definitions vary, and their comparability is often questionable at best. The most comparable data is presented in Tourism Satellite Accounts (TSAs). The TSA is a standard statistical framework and the main tool for the economic measurement of tourism. The TSA has been developed by the United Nation’s World Tourism Organization (UNWTO), the Organisation for Economic Co-operation and Development (OECD), the Statistical Office of the European Communities (Eurostat) and the United Nations Statistics Division.
For more, see the publication by the UN Department of Economic and Social Affairs (2010b).
In principle, TSAs should only include standardised and comparable data, yet there are still a number of issues and discrepancies between the Nordic countries
These discrepancies which are discussed in detail in a recent Nordregio report Regional Tourism Satellite Accounts for the Nordic Countries (Karlsdóttir & Sánchez Gassen, 2021).
Even with their limitations TSAs provide the best available data with which to examine the economic significance of domestic tourism. They are therefore used in this chapter to illustrate the differences between the Nordic countries but are presented on a country-specific level. Additionally, the examination of economic data in this report is on most parts limited to the years 2019–2020 since those are the years for which data is available from all the Nordic countries. Fortunately, this still allows to see the effect of the Covid-19 pandemic in tourism consumption.
2.1.1. Comparison of domestic tourism in overnights in the Nordic countries and autonomous areas
It is possible to examine the similarities and differences in the significance of the domestic tourism in different Nordic countries through the overnight data. The developments of tourism in mainland Nordic countries resemble one another quite closely. Domestic tourism’s share of nights spent in each country held steady before the pandemic and rose clearly in all the Nordic countries during the Covid-19 crisis. In Denmark, the share of domestic tourists has been somewhat lower than in Finland, Norway and Sweden. This might be attributed to geography, which makes Denmark more accessible from mainland Europe. Iceland and the autonomous areas have more variance in their trends. In Åland, the small population and geographical area makes it a rather unique case in regards of domestic tourism and the domestic tourists’ share of the total nights spent is just a fraction of the total number of nights.
Figure 1. Domestic tourists’ share of overnights in hotels, holiday resorts, youth hostels and camping sites in the Nordic countries and autonomous areas during 2017–2022. (Source: Statistics Denmark, Statistics Greenland, Statistics Faroe Islands, Statistics Finland, Statistics Iceland, Statistics Norway, Statistics Sweden, Statistics Åland).
2.1.2. Denmark
Domestic tourism is very significant for the Danish tourism industry. Before the pandemic, in 2019, tourism accounted for DKK 139.1 billion (EUR 18.7 billion), representing 4.2 per cent of GDP. Domestic tourism consumption constituted 55.8 per cent of total tourism consumption. After the steep drop in the number of inbound tourists in 2020, domestic tourism’s share of total tourism consumption rose to 74.0 per cent. (Figure 2).
Figure 2. Tourist consumption in Denmark, 2019–2020 (in billion EUR). (Source: Fonnesbech-Sandberg & Runge 2022).
When examining the nights spent in Denmark, it may be observed that the number of nights spent by tourists rose slowly during the 2010s. During the Covid-19 pandemic, the number of nights spent declined but rebounded rather quickly. The total number of nights spent in Denmark by tourists not only reached 2019 levels in the second half of 2021 but has surpassed them in 2022. (Figure 3). This is largely due to an increase in domestic tourism.
Figure 3. Total nights spent in hotels, holiday resorts, youth hostels and camping sites in Denmark by all tourists. (Source: Statistics Denmark).
Before the pandemic, the share of domestic tourists was on a slow decline. As the amount of nights spent by inbound tourists in Denmark declined in 2020 and 2021, the share of nights spent by domestic tourists increased vastly. During the springs of 2020 and 2021, domestic tourists’ share of nights spent was over 90 per cent while in 2019 it was roughly 66 per cent. The distribution has been steadying toward the pre-Covid levels as, in the summer season of 2022, the shares of nights spent by foreign and domestic people in Denmark was at the same level as in 2019. (Figure 4).
Regionally, Danish domestic tourists head outwards from big urban centres, though the capital region is particularly important for all types of tourism, domestic tourism included. Yet, data shows that the region that had the highest number of domestic overnight stays in 2019, 2020 and 2021 was the Syddanmark region in the south of Jutland, the continental area of Denmark, and the lowest number of domestic overnight stays for the three years is for Sjaelland region that includes the Sjaelland and adjacent islands outside the capital region.
StatBank Denmark, 2022.
Karlsdottir and Bogason, 2022.
Figure 4. Domestic tourists’ share of nights spent in hotels, holiday resorts, youth hostels and camping sites in Denmark in 2010, 2015 and during 2019–2022. (Source: Statistics Denmark).
2.1.2.1. The effects of Covid-19 pandemic in Denmark
During Covid-19, Denmark closed its borders around mid-March 2020 and had restrictions that applied to inbound tourists from March 2020 until the end of 2021. During this period, the restrictions varied from screening arrivals, quarantines for some or all geographical regions, banning arrivals from some geographical regions to total border closure. Even if there were no longer any general restrictions in Denmark in the autumn of 2022, one might still be met with a requirement to show one’s Covid-19 certificate onboard airplanes. Also, some Covid-19 restrictions and requirements (such as using face masks) apply in certain premises as Danish businesses and private cultural institutions are allowed to enforce their own requirements regarding measures taken to mitigate the spread of infections.
Due to the restrictions, the number of inbound tourists declined dramatically compared with 2019. However, the number of domestic tourists did not suffer such a steep decline and their number was already higher in the summer of 2020 compared with 2019. Ever since the summer of 2021, apart from the end of the year, the number of monthly overnight stays by domestic tourists has been around 20 per cent higher compared to same month in 2019. The number of overnight stays made by foreign tourists was at a lower level for quite some time but had returned to its 2019 levels in the spring of 2022. (Figure 5).
Figure 5. Level of monthly nights spent in hotels, holiday resorts, youth hostels and camping sites in Denmark, by nationality (2020-2022 compared with the same month in 2019). (Source: Statistics Denmark).
2.1.2.2. Domestic tourism governance in Denmark
In Denmark, the Ministry of Industry, Business and Financial Affairs oversees the tourism industry. The ministry collaborates with several other ministries (namely the Ministry of Environment and Food; the Ministry of Transport, Building and Housing; the Foreign Ministry; and the Ministry of Culture) in issues concerning the tourism sector.
The multi-level governance system for coordinating domestic tourism activities in Denmark can be viewed as a hierarchy. On top is the Ministry of Industry, Business and Financial Affairs, along with the Danish National Tourism Forum and the Danish Tourism Board. The Danish Tourism Board can best be understood as different task force groups that, for example, are in charge of developing the national tourism strategy. Below the top level are four national bodies: three development organisations and one organisation that focuses on marketing. These are the Danish Coastal and Nature Tourism Organisation, the Danish City Tourism Organisation, Meet Denmark and Visit Denmark. At the local level, the coordination is centralised through Danish Destinations.
According to an interview, Denmark focused mostly on inbound tourism before the pandemic and the domestic tourism market was neglected before the pandemic. During the pandemic, greater interest was given to domestic tourism as the domestic tourism market grew bigger. Visit Denmark and Danish Destinations had a shared responsibility for domestic tourism marketing in 2020, and in 2021, Danish Destinations took over most of the responsibility for domestic tourism marketing. The higher priority of domestic tourism in a post-Covid world is evident in Denmark’s strategy for tourism, published in 2022, as the siginificance of the domestic market is highlighted in the strategy.
Erhvervsministeriet, 2022.
2.1.3. Finland
Tourism has a significant effect on the Finnish economy and employment, and domestic tourism is an important part of the tourism economy in Finland. In 2019, the direct share of tourism of the Finnish GDP was 2.7 per cent and the total demand for tourism was EUR 16,3 billion. The share of domestic tourism of the total demand of tourism in Finland was 67.4 per cent. In 2020, the GDP share of tourism decreased to 1.7 per cent and the total demand decreased to EUR 9.7 billion due to the pandemic. However, the share of domestic tourism of the total tourism demand increased to 84.1 per cent in 2020. (Figure 6). According to the estimates of the 2021 trends, the total demand recovered to EUR 11.2 billion, mainly thanks to the growth in domestic tourism. The share of the domestic tourism of total demand is expected to rise to almost 90 per cent in 2021.
Ministry of Economic Affairs and Employment of Finland, n.d.
Figure 6. Tourism demand in Finland (in billion EUR). (Source: Statistics Finland).
The total nights spent by tourists in Finland was rising slowly throughout the 2010s, mostly due to rise in inbound tourism.
Ministry of Economic Affairs and Employment of Finland, n.d.
Figure 7. The total nights spent in hotels, holiday resorts, youth hostels and camping sites in mainland Finland, all tourists. (Source: Statistics Finland).
As in the other Nordic countries examined, the share of nights spent by domestic tourists has been higher in 2020 and 2021 than it was in 2019, but the gap has narrowed greatly in 2022. It is evident that the Finnish tourism industry relies more heavily on inbound tourism in the winter seasons, and it may be observed that the share of inbound tourism in overnights has increased closer towards its 2019 level during the 2021–2022 winter, though it has yet to reach the pre-pandemic level. (Figure 8).
Regional differences in the domestic tourists’ share of all tourists were also visible before the pandemic. In more rural areas in Eastern and Central Finland, the share of the domestic tourists was above average, whereas the share of domestic tourists was lowest in Lapland where the main season is winter.
Ministry of Economic Affairs and Employment of Finland,2019.
Data obtained directly from the Ministry of Economic Affairs and Employment of Finland.
Figure 8. Domestic tourists’ share of nights spent in hotels, holiday resorts, youth hostels and camping sites in mainland Finland in 2010, 2015 and during 2019–2022. (Source: Statistics Finland).
2.1.3.1. The effects of Covid-19 pandemic in Finland
After the beginning of the Covid-19 pandemic, the Finnish borders were closed to foreign tourists in March 2020. The gradual opening of borders began in summer 2020: in June, entry was permitted from Norway, Denmark, Iceland and the Baltic countries (but not Sweden), and in July 2020, entry was permitted from 24 other countries. After this, the conditions of entry were alternately tightened and loosened, depending on the current pandemic situation in different countries. In January 2021, all non-essential inbound travel was prohibited, and traveling was limited to essential work-related travel and visiting relatives for 30 days. After this, the travel restrictions were again gradually dismantled during 2021. All border controls in the internal borders of the Schengen area ceased on 31 January 2022, and all health security measures and restrictions on external border traffic were lifted by 30 June 2022. After June 2022, travellers entering Finland were no longer required to present Covid-related documents or to have had a Covid test. Domestically there were also restrictions in traveling, number of people gathering and for example in the opening hours of restaurants and bars. These fluctuated according to the pandemic situation in 2020 and 2021 from mandated restrictions to recommendations to avoid crowds. In March 2020, the government restricted traveling from the capital region and surrounding counties to elsewhere in the country for three weeks. Later, there were recommendations to avoid unnecessary traveling within the country, which are probable causes for lower numbers of domestic tourism overnights in 2020.
The restrictions are visible when examining the monthly overnight data in Finland from 2020 to 2022 with year 2019 as comparison point. The number of nights spent by inbound and domestic tourists decreased significantly in the spring of 2020. The number of domestic overnights rose close to the 2019 level already in the summer of 2020 and increased by one fifth in the summer of 2021. The number of overnights by inbound tourists, however, has not reached pre-pandemic levels. This is partly explained by the decrease of tourists from Russia in 2022. Russian citizens have been a sizable segment in the Finnish tourism economy, but due to the Russia’s invasion of Ukraine, Finland closed its borders to Russian tourism in September 2022. However, the loss of inbound tourists has been offset by the increase in domestic tourism and the total number of monthly overnights spent in Finland was very close to the 2019 levels in the summer and autumn 2022. (Figure 9).
Figure 9. Level of monthly nights spent in hotels, holiday resorts, youth hostels and camping sites in mainland Finland by nationality (2020-2022 compared with the same month in 2019). (Source: Statistics Finland).
2.1.3.2. Domestic tourism governance in Finland
There is not a single operative responsible for national-level coordination of the development of domestic tourism in Finland. The interviewees considered the most important operatives in terms of domestic tourism development at the moment to be the Ministry of Economic Affairs and Employment and High-Level Working Group on Tourism (Matkailufoorumi in Finnish), serving as an expert advisory body on strategy related to tourism development, appointed by the Ministry of Economic Affairs and Employment and chaired by the Minister of Economic Affairs. The Ministry of Economic Affairs and Employment oversees tourism development and supports the development of domestic tourism. The ministry has conducted several studies on domestic tourism and has supported financially the national-level domestic tourism marketing campaign for several years. The main national tourism development and promotion organisation Visit Finland is responsible for implementation of the national tourism strategy and is financed from the government budget, but its mandate explicitly excludes promoting domestic tourism. Unlike similar organisations in other Nordic countries, its mandate was not expanded during the Covid-19.
Below the national level, domestic tourism development is mainly carried out by regional tourism organisations and tourism companies. According to a 2019 report on the operational models of the Finnish tourism organisations, the procedures of tourism development vary greatly on an organisational level in their emphasis on either domestic or inbound tourism. In certain regions, the organisations were solely concentrating their efforts on increasing the international demand; in other regions, there was more emphasis on increasing domestic demand.
Ministry of Economic Affairs and Employment of Finland, 2019.
Metsähallitus is a Finnish state-owned enterprise that produces environmental services.
2.1.4. Iceland
Regarding domestic tourism, Iceland differs somewhat from continental Nordic countries. Tourism became Iceland’s most important export industry after the 2008–2011 financial crisis. Before the Covid-19 pandemic in 2016-2019, tourism's average share of GDP was 8.1 per cent. In 2020, the share of tourism fell to 3.6 per cent of the GDP. According to preliminary results in the Icelandic TSA, in 2021 it recovered slightly to 4.2 per cent of the GDP. Total internal tourism consumption was ISK 556 billion (EUR 3.7 billion) in 2019. This includes inbound tourism expenditure (ISK 385 billion, EUR 2.5 billion) domestic tourism expenditure (ISK 143 billion, EUR 0.9 billion) and other components of tourism consumption (ISK 28 billion, EUR 0.2 billion)
Statistics Iceland 2023. Other components include imputed rental value of summer houses and employers' expenses for business trips of their employees that form around 5 percent of total consumption.
Expenditure of domestic tourism in Iceland was approximately ISK 143 billion (EUR 0.9 billion) or about 27.1 per cent of the total internal tourism expenditure. Both inbound and domestic tourism expenditure decreased considerably in 2020. However, domestic tourism expenditure’s share of total internal tourism expenditure rose to 54.9 per cent in 2020 and has never been higher since the beginning of the time series (in 2009). (Figure 10). The share of domestic tourism in internal tourism consumption grew significantly in 2020 and 2021 compared with 2019, especially in the fields of accommodation and food and beverages. In comparison, the outbound consumption of Icelanders is normally higher than domestic consumption; it was ISK 185 billion (EUR 1.2 billion) in 2019 but it decreased during the pandemic to ISK 69 billion (EUR 450 million) in 2020 and ISK 98 billion (EUR 640 million) in 2021, parallel to fewer outbound trips.
Statistics Iceland 2023.
Figure 10. Tourist expenditure in Iceland 2019–2020 (in billion EUR). (Source: Statistics Iceland).
The number of nights spent in hospitality services in Iceland fell into a steep and long-lasting slump from the spring of 2020 until the spring of 2022, despite a huge rise in nights spent by domestic tourists when compared with pre-pandemic levels. The number of nights spent by domestic tourists compared with those of foreign tourists was so low that, despite the huge relative increase in nights spent by domestic tourists, the effect on the total nights spent was rather low. (Figure 11).
Figure 11. The total nights spent in hotels
Icelandic monthly data includes only overnights in hotels.
Domestic travel has been a regular habit for a large proportion of the population for a long time as the ratio of domestic travellers has remained stable. During the pandemic, the number of outbound trips decreased dramatically (by 69%) and the number of outbound trips had never been lower.
Gallup, 2022; Icelandic Tourist Board, 2022a; 2022b.
The regional share of domestic overnight stays is not equally distributed. The capital area and south Iceland each accounted for 26 per cent of domestic overnight stays in 2019 and 18 per cent of domestic overnights stays were in North-East Iceland. A smaller share of overnights was attributed to other regions. During the pandemic, the share of overnights decreased significantly in the capital area but increased in North-East, East and South Iceland. The difference in the share of the domestic tourism may be even greater between municipalities. For instance, the north Icelandic municipality of Akureyri (the largest town outside the more populated south-west corner, with 19,000 inhabitants) has long been one of Iceland’s most popular domestic destinations. In places like Akureyri, seasonal fluctuations in the overnight stays of inbound tourism can be considerable, although seasonality had decreased in the years before the pandemic. Even if domestic overnight stays in Akureyri have been considerably fewer than those of inbound tourists, their numbers have remained stable, especially in the late-winter season and early spring, with the number of domestic overnight stays ranging from 5–6,000 each month.
Bjarnadóttir, 2021.
Figure 12. Domestic tourists’ share of nights spent hotels in Iceland in 2010, 2015 and during 2019–2022. (Source: Statistics Iceland).
2.1.4.1. The effects of the Covid-19 pandemic in Iceland
The Icelandic border remained open throughout the pandemic, although with some restrictions. In March 2020, Iceland implemented temporary travel restrictions until July, imposed for the Schengen Area and the European Union. Quarantine measures of up to 14 days quarantine and PCR testing were implemented for international arrivals. The rules on quarantine, isolation and screening at the border changed concurrently as the pandemic and vaccinations progressed. As of February 2022, all infection prevention rules for Covid-19 were lifted at the Icelandic border, regardless of tourists’ vaccination status. Domestically, the government kept requirements on social distancing and gatherings since autumn 2020, but the domestic restrictions varied during the Covid-19 pandemic in accordance with the circumstances. Looking at the overnight data, they have probably impacted domestic tourism during spring and fall 2020 and early 2021. All domestic restrictions were lifted in summer of 2021.
The number of nights spent in Iceland by tourists plummeted in 2020. Given the higher share of inbound tourists in overnights, the decrease in monthly overnights due to the pandemic was steeper in Iceland compared to mainland Nordic countries. The situation began to improve in summer of 2022. The number of monthly overnights finally reached and surpassed pre-pandemic levels in the spring of 2022. Even if the number of monthly nights spent by domestic tourists have remained much higher after the pandemic compared to 2019, the most important factor has been the recovery of inbound tourism. (Figure 13).
Figure 13. Level of monthly overnights spent in hotels in Iceland by nationality (2020-2022 compared with the same month in 2019). (Source: Statistics Iceland).
2.1.4.2. Domestic tourism governance in Iceland
The Ministry of Culture and Business Affairs of Iceland is responsible for developing overall tourism policy and coordinating governmental bodies’ work. The Department of Business Affairs and Tourism is the lead department and oversees the operation and performance of the Icelandic Tourist Board (ITB), an independent authority under the auspices of the Ministry of Culture and Business Affairs. The ITB’s responsibilities include implementing government tourism policy, planning and supporting regional development, licensing and monitoring licensed activities, data collection, processing and presentation, safety, quality and consumer protection in tourism, and administration of the Tourist Site Protection Fund. In 2021, on behalf of the government, the ITB and the regional authorities committed to operating special destination management and marketing offices (DMMOs) in each region of Iceland. In addition, there is the Tourism Cluster Initiative, a network of travel agents, tour operators, hotels, attractions and activities, restaurants, airlines, public relations etc. Its main objective is to promote competitiveness and value creation within the Icelandic tourism industry and to develop a co-operating forum for different stakeholders in which the main focus is on linking them together and opening up interaction between them.
However, interviews with stakeholders confirmed that specifically when it comes to the development of domestic tourism, the responsibility for management and marketing is at present not formally in anyone’s hands. From 2015 to 2019, no funding was allocated to domestic marketing, but in 2020 and 2021, the minister of tourism allocated ISK 40 million (EUR 270 000) to the ITB to encourage Icelanders to travel domestically and buy domestic goods and services. Beyond this, stakeholders identified the DMMOs as possible backers for the domestic tourism developement and some stakeholders pointed out that it was critical to put domestic tourism development better on the agenda. The domestic market has only had a small part in some projects by ITB and DMMOs earlier and no special focus has been placed on it. It was pointed out in a stakeholder interview that tourism marketing does not always have the purpose of selling something, it is also an educational tool regarding Icelandic tourism. The current agreements between ITB and the DMMOs do not mention obligations towards the domestic market and ITB or DMMOs have no funding is allocated to the domestic market. However, some DMMOs have expressed interest to manage the domestic tourism marketing and development within their operating area, but since they have no funding to do it, they have settled for promoting domestic tourism on their websites and social media.
2.1.5. Norway
Domestic tourism is an important part of the tourism industry in Norway. Before the pandemic, economic contribution of the whole tourism sector was steadily growing and was 3.6 per cent of total GDP in 2019
OECD, 2022.
Figure 14. Tourist consumption in Norway 2019–2020 (in billion EUR). (Source: Statistics Norway).
When looking at the overnight data from Norway, it is possible to see the growth of the tourism sector especially in the second half of the last decade. In the peak month of July, there were almost a million more overnights in 2019 compared to 2015. Covid-19 pandemic affected the tourism sector in Norway heavily. The initial drop in nights spent by tourists in Norway in the spring of 2020 was drastic as in April 2020 it was only 15.5 per cent of the number of nights spent just a year earlier. The nights spent in Norway by all tourists already reached pre-pandemic levels in the summer of 2021, though there was a significant decrease later in the year. The nights spent in Norway by foreign tourists had not yet reached the pre-pandemic levels by the end of 2022, but the slightly increased share of nights spent by domestic tourists is keeping the total values at their 2019 levels. (Figure 15).
Figure 15. The total nights spent in hotels and camping sites
Norwegian overnight statistics does not include nights spent in youth hostels and holiday dwellings. Additionally, given the changes in production of statistics, data before 2013 is not fully comparable to data after 2013.
Before the pandemic, domestic tourists’ share of overnights was around four fifths outside the peak season in the summer, when the share usually decreases below 70 per cent. In the pandemic affected years of 2020 and 2021, the share of domestic tourists was around 90 per cent for most of the year. (Figure 16). High volume of domestic tourism during the summer seasons of 2020 and 2021 helped to keep the total numbers of overnights in the summer months close to the same levels they were before the pandemic even though on annual level the total number of overnights was clearly lower.
There are regional differences in the size and share of domestic tourism in Norway. According to an interviewee, domestic tourism is concentrated in the south of Norway and the larger cities and relatively fewer domestic tourists visit northern Norway. Looking at the overnight data, the difference in the number of domestic visitors staying overnight in commercial establishments in Norway between 2019 and 2020 varied between regions. Southern Norway recorded an increase in domestic visitors and so did the southern part of Northern Norway and the northern part of Western Norway. The rest of the country recorded an overall decrease in the number of domestic visitors staying overnight between 2019 and 2020. In a Nordic comparison, Norway stood out as the only country in which the capital region experienced an increase of overnight stays by domestic visitors in 2020 compared with 2019.
Nordregio, 2022.
Figure 16. Domestic tourists’ share of nights spent in hotels and camping sites in Norway in 2010, 2015 and during 2019–2022. (Source: Statistics Norway).
2.1.5.1. The effects of the Covid-19 pandemic in Norway
General restrictions to mitigate the spread of the Covid-19 infection were enforced in Norway for about two years, with the first restrictions being introduced on 12 March 2020. Throughout the pandemic, restrictions in Norway included, for example, quarantine for all visitors coming into the country, the closing of all educational institutions and the discontinuation of sport events. During certain periods, inbound travellers and aircrafts from locations with expansive outbreaks of Covid-19 were prohibited from landing or traveling in Norway. Leisure travel was discouraged, and Norwegians were prohibited from travelling domestically to their country houses during parts of the pandemic. Norway removed most restrictions on 25 September 2021, though some restrictions remained in place until 12 February 2022. Restrictions in Svalbard were lifted on 1 March 2022. In October 2022, there were no longer any restrictions applying to domestic traveling or international tourists travelling to Norway.
When comparing the monthly numbers overnights by all tourists to 2019, they reached the pre-Covid levels in 2022, signalling a recovery process from the slump caused by the pandemic. Domestic tourism played significant part in the recovery. Foreign tourists’ share of nights spent in Norway has not yet reached the 2019 levels, though the gap between the 2019 level has been narrowing since the second half of 2021. On the other hand, number of monthly overnights by domestic tourists stabilised in the spring 2022 to a slightly higher level compared to per-Covid levels. (Figure 17).
Figure 17. Level of monthly nights spent in hotels and camping sites in Norway by nationality (2020-2022 compared with the same month in 2019). (Source: Statistics Norway).
2.1.5.2. Domestic tourism governance in Norway
In Norway, no government agency is tasked with overseeing and coordinating activities aimed at developing domestic tourism specifically. However, during 2020 and 2021, due to the pandemic, these activities were included in the overall coordination of international tourism activities through Innovation Norway, a government agency functioning as an international tourism administration body.
Visit Norway, 2022.
Árnadóttir, 2019.
Regions and municipalities are important stakeholders for developing domestic tourism in Norway. They are responsible for local regulations and planning, infrastructure, national parks and attractions. Norway’s regions and municipalities often have their own tourism strategies, outlining activities and goals related to tourism development. These are rarely aimed at domestic tourism specifically but rather aim at promoting tourism in general. It is common for Norwegian regions and municipalities to support regional or local tourism organisations.
OECD, 2022.
2.1.6. Sweden
In Sweden, domestic tourism constitutes an important portion of the tourism sector.
Tillväxtverket, 2022.
OECD 2022.
The tourism-related consumption in Sweden in 2019 amounted to SEK 306 billion (EUR 27.3 billion). Domestic tourists accounted for 70,0 per cent of this total consumption. In 2020, the consumption decreased by a third to SEK 215 billion (EUR 19.2 billion) and at the same time share of domestic tourism rose to 77,7 per cent of the total consumption. (Figure 18). The latest available number show a slow recovery, and in 2021 the tourism consumption rose to SEK 249 billion (EUR 22.2 billion). The recovery was driven by increased domestic consumption, since domestic tourism still accounted for two thirds of the total consumption illustrating its significance for the sector and the economy as a whole.
Tillväxtverket, n.d..
Tillväxtverket, 2022.
Figure 18. Tourist consumption in Sweden in 2019 and 2020 (in billion EUR). (Source: Tillväxtverket, 2022).
When examining the total nights spent by all tourists in Sweden during the previous decade, it can be observed that there was a steady rise in the amount of tourist overnights from 2010 to 2015 and from 2015 to 2019. During the pandemic, the numbers lowered significantly in 2020 and the first half of 2021, but after that rose soon to the pre-pandemic levels. Summer, especially July, remained the high season throughout the examined period. (Figure 19).
Figure 19. The total nights spent in hotels, holiday resorts, youth hostels and camping sites in Sweden, all tourists. (Source: Statistics Sweden).
As mentioned earlier, the role of domestic tourists in maintaining tourism levels, when measured in nights spent, rose to importance when inbound tourism dwindled. The share of domestic tourism of the total overnights was elevated in both 2020 and 2021compared with the pre-pandemic levels of 2019. In 2022, the share of nights spent by domestic tourists returned close to the level of 2019. (Figure 20).
There are regional variations in the share of domestic tourism. In 2021, the largest shares of domestic overnights were in Västmanland, Dalarna and Halland counties, and smallest in the capital region, southern counties of Kronberg and Blekinge and, on the other hand two northernmost regions with high tourism, Norrbotten and Västerbotten.
Tillväxverket, 2022.
Figure 20. Domestic tourists’ share of nights spent in hotels, holiday resorts, youth hostels and camping sites in Sweden in 2010, 2015 and during 2019–2022. (Source: Statistics Sweden).
2.1.6.1. The effects of the Covid-19 pandemic in Sweden
The tourism sector in Sweden was heavily impacted by the Covid-19 pandemic. In March 2020, the government introduced entry ban form outside the EU on non-essential traveling. This ban clearly decreased the number of inbound tourists. Travel restrictions were modified several times especially during 2021 according to the pandemic situation in country of origin and the progress of vaccine coverage. As of 1 April 2022, there were no longer an entry ban to Sweden.
Visit Sweden, 2023.
Tillväxtanalys, 2021.
Government offices of Sweden, 2022
The initial impact of the Covid-19 pandemic and restrictions to tourism industry is noticeable in Sweden when examining the overnight data. Yet, it is not as drastic as in other Nordic countries and regions. When comparing the monthly nights spent in 2020 with that of the monthly data in 2019, the nights spent in Sweden’s hospitality services were under 50 per cent of pre-pandemic levels only for two months. Domestic tourism played its part in maintaining tourism levels measured in nights spent, as foreign tourists took until the summer and autumn of 2021 to return to Sweden. As of October 2022, the nights spent by foreign tourists in Sweden were still behind the pre-pandemic levels of 2019. (Figure 21).
Figure 21. Level of monthly overnights spent in hotels, holiday resorts, youth hostels and camping sites in Sweden by nationality (2020-2022 compared with the same month in 2019). (Source: Statistics Sweden).
2.1.6.2. Domestic tourism governance in Sweden
The system of stakeholders that coordinate, finance and promote domestic tourism in Sweden is, generally speaking, the same as for the sector in general. As such, there is no formal distinction between the actors coordinating and funding domestic tourism activities and international tourism activities respectively on a national level.
At the national level, the Swedish Agency for Economic and Regional Growth is the main government agency responsible for developing the tourism sector. Visit Sweden, a state-owned company, is responsible for marketing the country as a tourism destination internationally. In response to the pandemic, the company was given a formal, extended mandate by the Swedish parliament to market Sweden to Swedes, accompanied by extra funding. It is the only activity mentioned in the Swedish Government’s tourism strategy as an activity aimed specifically to developing domestic tourism.
Swedish Ministry of Enterprise and Innovation, 2022.
Visit Sweden and the Swedish Agency for Economic and Regional Growth both report to the Ministry of Enterprise and Innovation. The Swedish Agency for Economic and Regional Growth has a significant role in distributing EU funds (e.g. European Structural and Investment Funds), which constitute a large proportion of the development funding going to tourism sector development. Furthermore, the agency is responsible for the production and dissemination of tourism knowledge, official tourism statistics and for collaborating with other government agencies. In addition, the agency’s mission includes supporting the country’s twenty-one regions in developing their respective tourism industries.
Ordinance (2009:145) instructing the Swedish Agency for Economic and Regional Growth.
With regard to regional and local arrangements, the Swedish Association of Local Authorities and Regions is a key actor, providing a network with which to share knowledge and coordinate tourism development activities. The regions, with their legal responsibility for regional development in Sweden, play a crucial role in the regional development of the tourism industry. The twenty-one regions are organised in several tourism-specific networks under the coordination of the Swedish Association of Local Authorities and Regions, and the Swedish Agency for Economic and Regional Growth, respectively. The municipalities are also important actors in marketing and supporting tourism sector development through their municipality-owned DMOs.
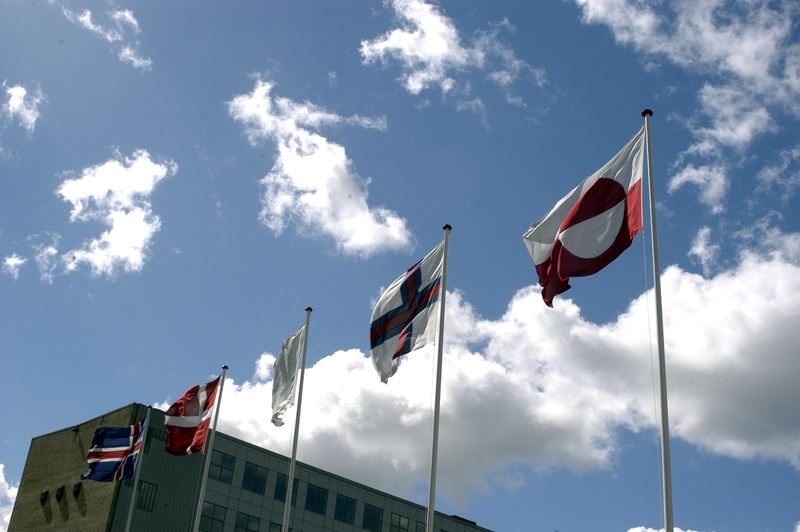
2.2. Domestic tourism in the autonomous areas
In this chapter, we examine the domestic tourism and effect of Covid-19 pandemic on it in autonomous areas. Domestic tourism in autonomous areas is very different from the mainland Nordic countries. Additionally, they all have unique characteristics regarding their domestic tourism market. Greenland is the world’s largest non-continental island and covers over one and a half times more land area than all the other Nordic countries combined. Yet, the population of Greenland is a little over 56,500, a mere 4000 more than the population of the Faroe Islands. Hence, due to the much smaller area of the Faroe Islands, the population density in the Faroe Islands is more than a thousand times higher than in Greenland. Åland resembles the Faroe Islands in its population density, but its geographical location is completely different. Whereas both Greenland and the Faroe Islands are secluded and far away from their mainland of Denmark – and far away from any other destination for that matter – Åland is located in between Sweden and Finland with easy access from both countries. These differences give a very different context to domestic tourism in each autonomous area.
It is important to note how we use the concept of a domestic tourism in autonomous areas. Often when looking at autonomous areas, domestic tourism is thought to include tourism from the mainland, especially in the case of Åland. Yet, to be consistent with the use of the concept in this report, we will explore the internal tourism in the autonomous areas (i.e. Faroese traveling in the Faroe Islands, Greenlanders traveling in Greenland and Ålanders traveling in Åland). Given the small population in each autonomous area, the possible target group here is, by definition, small.
Yet, according to the country reports conducted for this study, domestic tourism is much more important in all the autonomous areas than the mere size of the target group suggests. Even though their preferences differ somewhat, domestic tourists still mainly use the same services that inbound tourists use. Hence, domestic tourists can help tourism companies stay in operation during off-seasons or in times of crisis when the number of inbound tourists is lower than usual. Moreover, when domestic tourists can utilise the same services as inbound tourists, it makes the tourism industry more socially acceptable amongst the local people. Both these effects were pronounced during the Covid-19 pandemic when the number of domestic tourists multiplied in the autonomous areas.
Next, we provide an overview of domestic tourism in each of the autonomous areas. Statistical data on tourism aggregated to inbound and domestic components is not widely available for autonomous areas. Most available data is about registered overnight stays. Especially in the case of the Faroe Islands and Åland, overnight data leaves much information about the domestic tourism invisible. Given their small geographical size, a lot of domestic tourism happens in day trips or via staying at a relatives’ or friend’s house, or via privately owned cottages. However, looking at the data available, we can examine the main trends in domestic tourism in the autonomous areas.
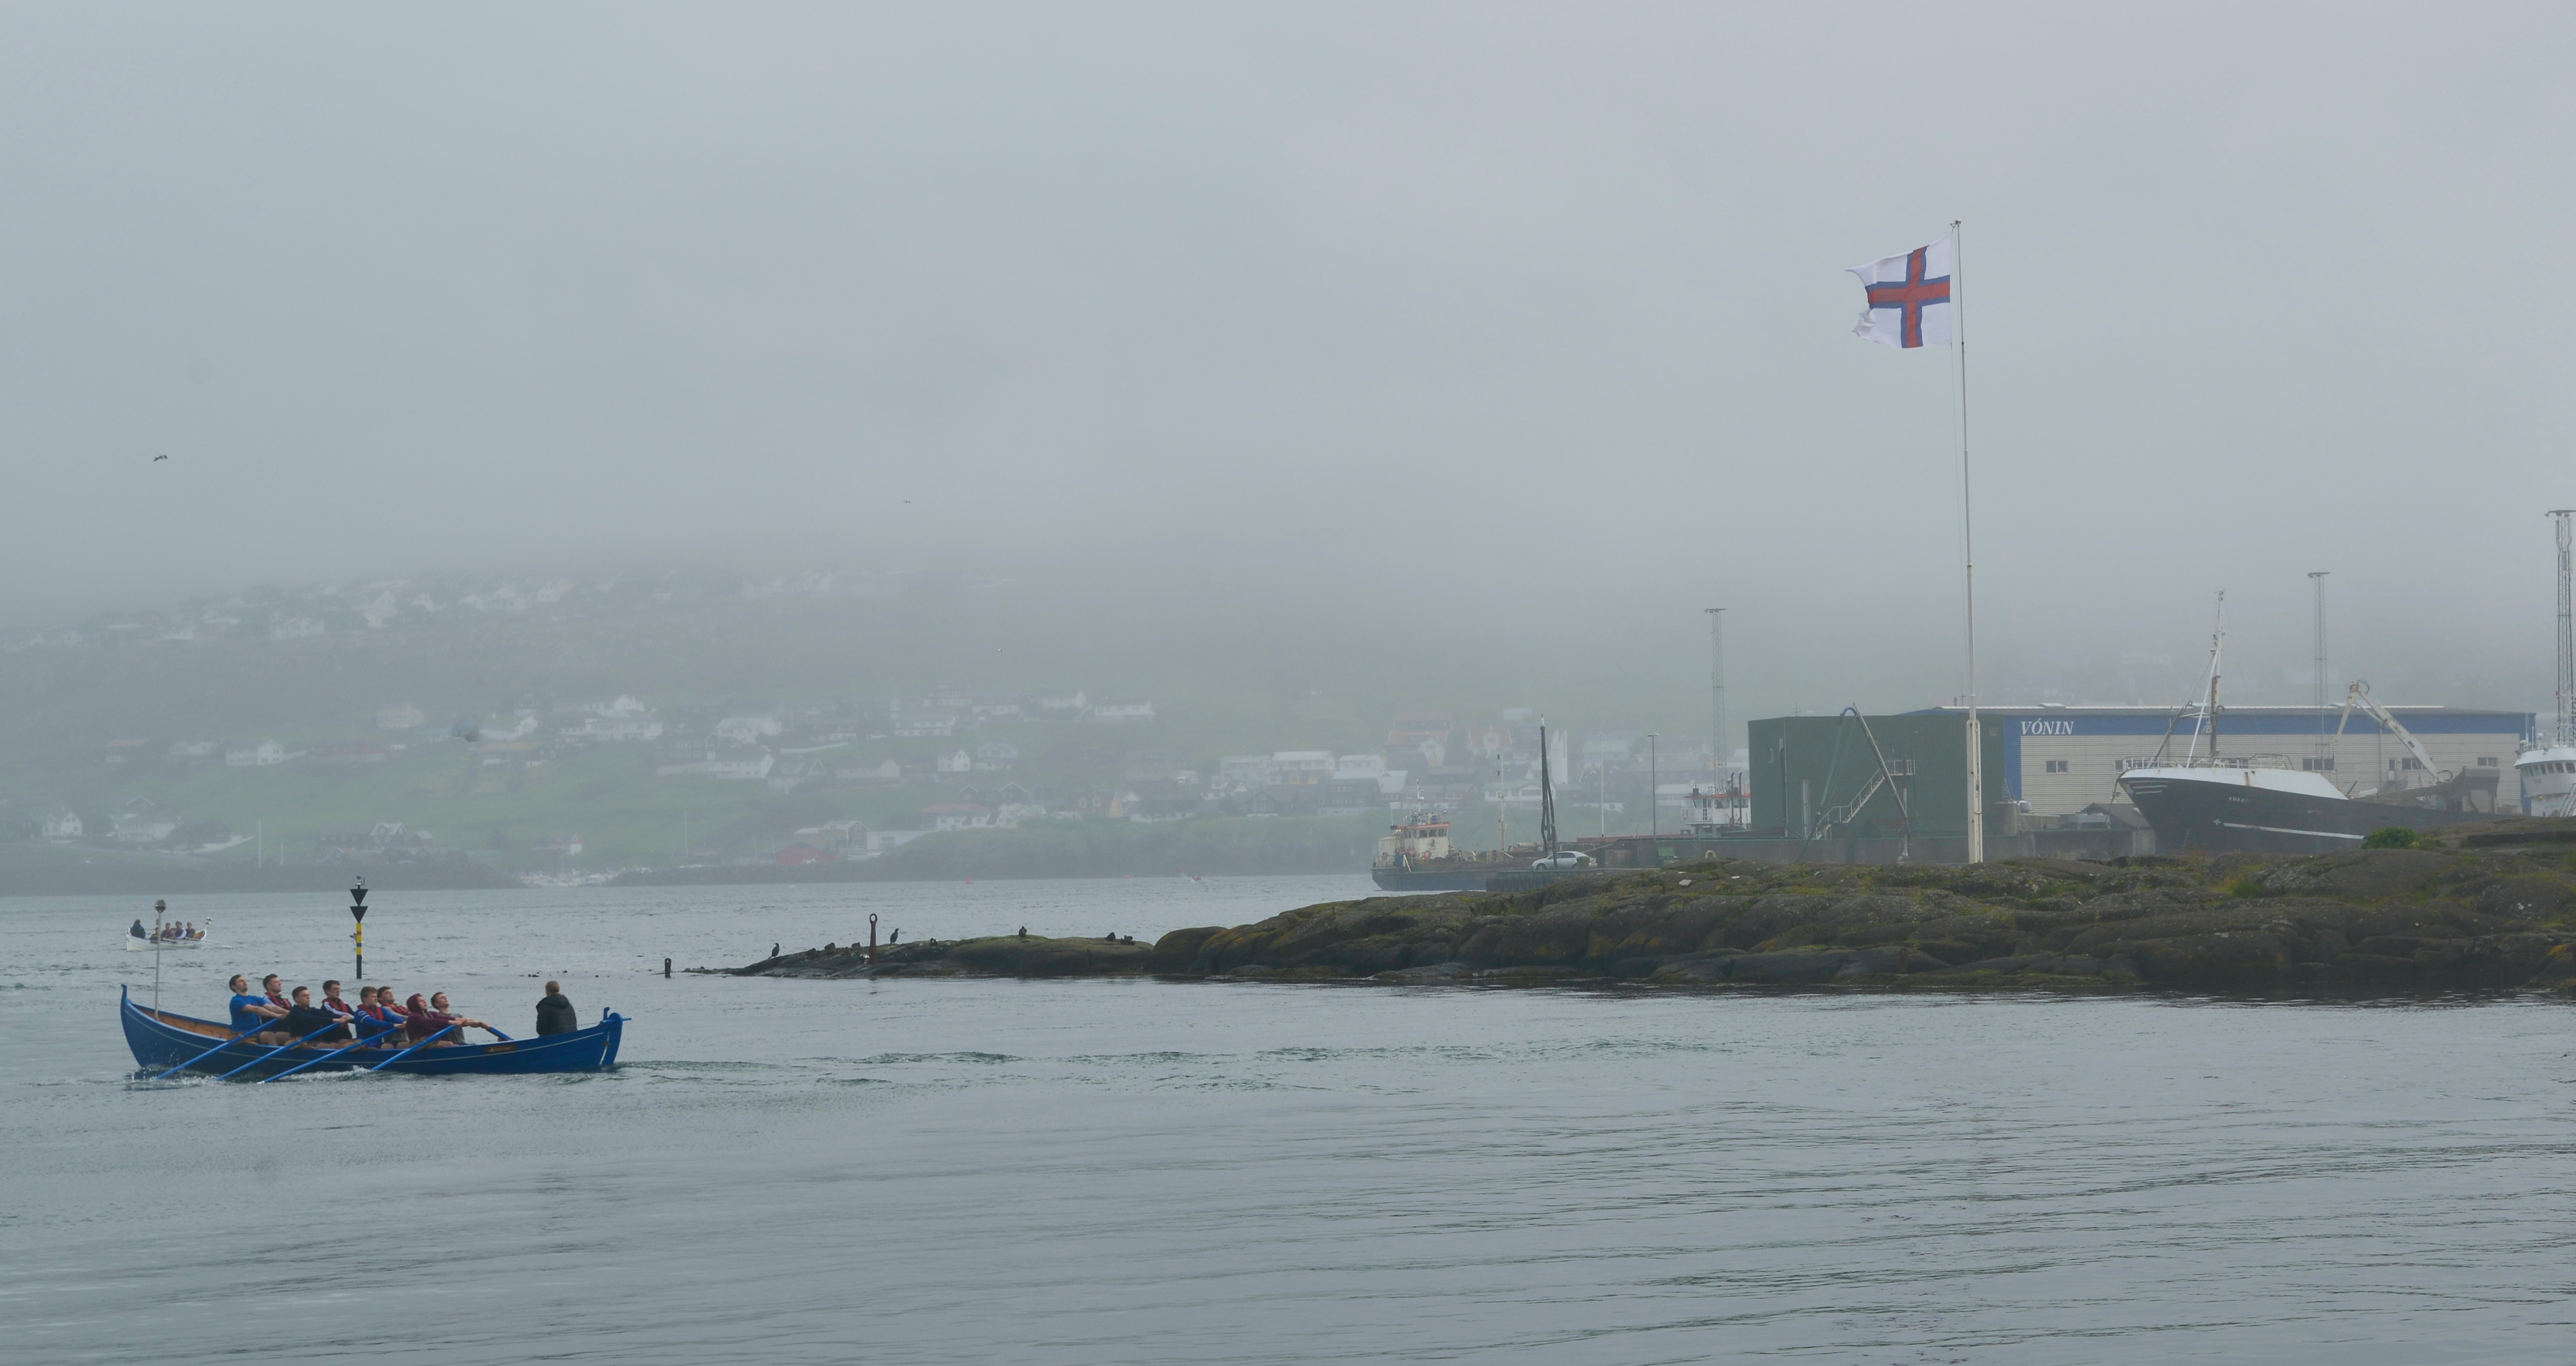
2.2.1. The Faroe Islands
Data on domestic tourism in the Faroe Islands is limited since the Faroe Islands have not yet developed TSA. However, data is available for the number of overnight stays, the turnaround rate and the tourism workforce. The tourism sector in the Faroe Islands was rising in importance before the pandemic. In 2019, the direct contribution of tourism was 1.9 per cent of the GDP of the region, rising from 1.2 per cent at the beginning of the 2010s. During the pandemic, the share of tourism declined to 0.6 per cent in 2020 and recovered to 0.9 percent in 2021.
Statistics Faroe Islands 2023.
This is reflected in the nights spent in the Faroe Islands. The total number of nights spent in the Faroe Islands’ commercial accommodation almost doubled from 2013 to 2019. The Covid-19 pandemic interrupted the growth, though only temporarily, and the number of total nights topped pre-pandemic levels in the summer of 2021 and has since been noticeably higher than before. (Figure 22).
Figure 22. Total nights spent in the Faroe Islands in hotels, hostels and guest houses
Overnight data from Faroe Islands does not include camping sites.
Just by looking the overnight statistics, the significance of domestic tourism in the Faroe Islands looks quite small. However, this is due to the Faroe Islands being a small island region, where overnight stays in commercial accommodations among the locals are rare in comparison to same-day trips. According to an interviewee, domestic same-day visitors have great economic importance, along with summer cottage rentals.
Yet, even in the overnight statistics, domestic tourism rose in significance during the Covid-19 pandemic. Domestic overnight stays in the Faroe Islands accounted for approximately 18 per cent of the total number of overnight stays in 2019. The number of domestic visitors staying overnight in commercial establishments increased between 2019 and 2020. The number of domestic overnight stays was 33 496, accounting for a share of 35 per cent of all nights spent. There was a steep increase in domestic tourism in 2021, where the number of overnight stays amounted to 57 454 making 33 per cent of the total number of overnight stays. (Figure 23).
Figure 23. Domestic tourists’ share of monthly nights spent in hotels, hostels and guest houses in the Faroe Islands in 2013, 2015 and during 2019–2022. (Source: Statistics Faroe Islands).
2.2.1.1. The effects of the Covid-19 pandemic in the Faroe Islands
The Faroe Islands had international travel restrictions in place from March 2020 until March 2022. The restrictions varied from screening arrivals, quarantines for some or all regions, banning arrivals from some regions and a ban on all regions or total border closure. The Faroe Islands only had a short period at the beginning of the pandemic when travellers from all regions were banned or when a total border closure was enforced. All Covid-19-related restrictions were removed by the Faroese Government as of 1 March 2022.
The number of nights spent in the Faroe Islands by tourists decreased in the beginning of 2020 compared with 2019 but rebounded quickly. Domestic tourism played a large part in the recovery, as can be seen in the large relative increase of nights spent by domestic tourists in Faroe Islands. The summertime appears to be an important time for Faroe Islands’ inbound tourism as the share of nights spent by foreign tourists was not dramatically reduced, even in the summers of 2020 or 2021. Otherwise, the share of nights spent by domestic tourists rose to higher levels than previously. The distribution between these two groups was back to a normal in 2022, though the total number of nights was considerably higher compared with pre-pandemic levels. (Figure 24).
Figure 24. Level of monthly nights spent in the Faroe Islands in hotels, hostels and guest houses by nationality (2020-2022 compared with the same month in 2019). (Source: Statistics Faroe Islands).
2.2.1.2. Domestic tourism governance in the Faroe Islands
Given the small size of the tourism economy in the Faroe Islands, there is no separate governmental organisations for domestic tourism governance or development. Domestic tourism is administered as a part of the general tourism governance structure. The Ministry of Foreign Affairs and Trade oversees tourism in the Faroe Islands. In specific issues, there are collaborations with other ministries, such as the Ministry of Culture and the Ministry of Environment. In certain matters, such as transportation and aviation, the tourism sector falls under Danish regulations. At the local level, regional tourist agencies are responsible for promoting growth in the tourism industry. The Visit Faroe Islands Tourist Board oversees the development of the travel industry in the Faroe Islands through its subsidiary, Visit Faroe Islands. In 2018, a new development department was set up and integrated within Visit Faroe Islands. The main task of this department is to better organise the tourism industry in the Faroe Islands. In addition, the development department oversees national campaigns, such as a webpage that was set up to highlight new travel packages specifically for domestic tourists. The North Atlantic Tourism Association is another relevant organisation, with a mission of promoting tourism in the west Nordic nations of the Faroe Islands, Greenland and Iceland
2.2.2. Greenland
Data on domestic tourism in Greenland is limited as Greenland has not yet developed TSAs. Available statistics regarding domestic tourism concern the number of rented rooms, number of overnight stays, occupancy rate, capacity and the number of guests.
The summer seasons clearly play a large role in tourism for Greenland. Overnight data reveals high peaks during the summer months before the pandemic. There was a clear growth in overnights from 2015 to 2019. Covid-19 affected the emerging tourism sector and the night spent decreased steeply in 2020 and 2021. However, the recovery from the pandemic has been fast and nights spent in 2022 already surpassed those of 2019. (Figure 25).
Figure 25. Total nights spent in the Greenland in hotels, hostels and other tourist accommodations
Statistics Greenland describes the data to include “overnight stays at the 51 hostels and other tourist accommodations in Greenland that Statistics Greenland receive reports from.” It is not clear if this includes, for example, camping sites.
There were fewer inbound tourists in Greenland during the pandemic, but the decrease seems to be temporary. In 2019, domestic tourism’s share of nights spent in paid accommodation was 64 per cent. In 2020, the domestic share was 79 per cent and in 2021 the share was back to 63 per cent. (Figure 26). Even though there was an increase in the domestic share of overnight stays in 2020, the total number of overnight stays decreased from 2019 to 2020. However, there was a 20 per cent increase of domestic overnight stays between 2020 to 2021, even if their share of total overnights did not grow due to the recovery of the inbound tourism latter part of the 2021.
There are regional differences in the domestic number of overnight stays in Greenland. The region with the highest domestic number of overnight stays in 2021 was the capital region (with 51 915 overnight stays). The region with the lowest domestic (and overall) number of overnight stays in 2021 was East Greenland (with 603 domestic overnight stays). Looking at the changes from 2020 to 2021, the greatest increase in domestic overnight stays was in South Greenland, where the increase of domestic overnight stays was 30 per cent.
Visit Greenland, 2022. Tourism Statistics report 2021 Greenland.
Figure 26. Domestic tourists’ share of monthly nights spent in hotels, hostels and other tourist accommodations in Greenland in 2010, 2015 and during 2019–2022. (Source: Statistics Greenland).
2.2.2.1. The effects of the Covid-19 pandemic in Greenland
Greenland had international travel restrictions from March 2020 until May 2022. The restrictions varied from screening arrivals, quarantines for some or all regions, banning arrivals from some regions to a total border closure. In the early stages of the Covid-19 pandemic, as well as from December 2020 to June 2021, Greenland banned arrivals from all regions or had a total border closure. In the later stages of the pandemic, Greenland switched to screening arrivals. In May 2022, all travel restrictions relating to the pandemic were lifted.
The larger slump in nights spent in Greenland by tourists due to the Covid-19 restrictions was short lived. This can be seen when observing the monthly number of nights spent there compared with those of 2019. However, it took until the autumn of 2021 to surpass the number of monthly nights spent in Greenland in 2019. The role of domestic tourism was higher than normal during 2020 and 2021. It took until the winter of 2021–2022 for inbound tourism to return to its former, pre-pandemic levels. In 2022, overnight data show a clear growth for both domestic and inbound tourism compared to pre-pandemic situation and the number of overnights is trending upwards. (Figure 27).
Figure 27. Level of monthly nights spent in hotels, hostels and other tourist accommodations in Greenland by nationality (2020-2022 compared with the same month in 2019). (Source: Statistics Greenland).
2.2.2.2. Domestic tourism governance in Greenland
The Ministry of Industry and Energy oversees the tourism sector in Greenland. Greenland’s tourism sector also falls under some Danish regulations, for example, regulations concerning transportation and aviation. The task of marketing Greenland as a tourism destination is under the purview of Visit Greenland, which is a national tourist board and government-owned organisation. Visit Greenland also monitors domestic tourism and serves as a national tourism resource centre for Greenland. The North Atlantic Tourism Association is another relevant organisation for Greenlandic tourism.
2.2.3. Åland
Åland has a limited amount of data available on the domestic tourism of Åland residents. The autonomous island region is part of the TSAs of Finland, but in these statistics, the domestic tourism includes tourists from mainland Finland as well. To be consistent with the use of concept of a domestic tourist in this report, we examine Ålanders travelling within Åland. The only aggregated data about Ålanders is available from Statistics Åland and concerns overnight statistics, beginning from the year 2019.
Despite these limitations, there are some more general data available about tourism in Åland. Tourism is extremely important for the autonomous area. In 2019, tourism constituted 20.8 per cent of Åland’s GDP and 21.5 per cent of all employed persons worked in tourism industries.
Statistcis Åland, 2022.
Tourism has been important economic sector for Åland for long. This is also visible in overnight statistics, where the number of nights spent in Åland stayed quite stable from 2010 until 2019. As there was very little domestic tourism to buffer the effects of the pandemic, the total nights spent in Åland by tourists halved in 2020 and stayed well below average in 2021. The number surpassed pre-pandemic levels in spring 2022 by a small margin, displaying recovery from the slump seen in 2020 and 2021 during the most acute phases of the pandemic. (Figure 28).
Figure 28. Total nights spent in hotels, holiday resorts, youth hostels and camping sites in Åland by all tourists in 2010, 2015 and during 2019–2022
Figures for 2022 are preliminary.. (Source: Statistics Finland).
Since there are only about 30,000 inhabitants in Åland, the share of domestic tourism is very small, and the tourism industry in the region is very dependent on inbound tourism – especially tourists from Finland and Sweden. According to an interview, local Ålanders usually say that there is no domestic tourism, though this is not completely true. There is no data available about domestic same-day visitors, but the significance of day trips on such a geographically small area can be assumed to be higher than domestic tourists making overnight trips. For example, domestic tourism is extremely important for restaurants in the off-season. According to an interview, in the wintertime the restaurants in Åland survive thanks to the local people.
This is reflected in the share of domestic nights spent in Åland. In 2019, before the Covid-19 pandemic, there were 189 490 overnight tourists in Åland’s commercial accommodation (including hotels, guesthouses, cottage villages and campsites). Of these, 2073 were domestic overnight tourists, which represents a mere 1.1 per cent of all overnights in Åland. In the midst of the Covid-19 pandemic in 2020 and 2021, there was a surge in the domestic tourism and the number of domestic tourists’ overnights increased three-fold. Especially at the times of severe travel restrictions that were in place in the spring of 2020 and 2021, the share of domestic tourists rose to over 20 per cent of total monthly overnights. (Figure 29). Sill, annually, domestic tourism constituted little over 4 per cent on total overnights in both 2020 and 2021.
Figure 29. Domestic tourists’ monthly share of nights spent in hotels, holiday resorts, youth hostels and camping sites in Åland in 2010, 2015 and during 2019–2022
Figures for 2022 are preliminary.
2.2.3.1. The effects of Covid-19 pandemic in Åland
The number of overnights spent in Åland was low from March 2020 until the spring of 2022, despite a sudden rise at the end of 2021 relative to the end of 2019. By 2022, nights spent by inbound tourists had stabilised to a somewhat higher level compared with pre-pandemic times. For domestic tourism the very small number of domestic overnights before the pandemic makes comparisons with 2019 quite infeasible. When comparing pre- and post-pandemic domestic monthly overnights, the results vary wildly month by month. On some months, the number of domestic overnights has been over 15 times higher compared to the same month in 2019. It seems that Covid-19 pandemic started bit of a boom in domestic tourism in Åland. Yet, even with exponential growth, domestic tourism overnights form just a fraction of total nights spent in Åland. Figure 30 illustrates this. When comparing the differences in overnights by nationality to 2019, the line for foreign overnights and total overnights overlap almost completely and are indistinguishable from each other in the given scale. This is due to the low volume of domestic tourism in Åland compared to inbound tourism in overnight data. (Figure 30).
Figure 30. Level of monthly nights spent in hotels, holiday resorts, youth hostels and camping sites in Åland by nationality (2020-2022 compared with the same month in 2019)
Figures for 2022 are preliminary.
2.2.3.2. Domestic tourism governance in Åland
Legislation on tourism in Åland stems both from Åland local legislation as well as Finnish laws and regulations. Finnish legislation that affects the Åland tourism sector includes tax policies and labour laws.
Arnadóttir, 2019.
2.3. Domestic same-day visitors
In the domestic market, the same-day visitors make up a considerable portion of both trips for leisure and for business, but the aggregated information about them is rarely collected. TSAs should include same-day visitors in the numbers of visitors and spending by same-day visitors in tourism consumption (both inbound and domestic) data, but they rarely give aggregate data on tourists and same-day visitors. One of the key recommendations in the recent Nordregio report about the Nordic TSAs was to break down the information into overnight tourists and same-day visitors in key statistics.
Karlsdóttir & Sánchez Gassen 2021, p. 36.
No aggregated data about same-day visitors was found for Norway and the autonomous areas. In Iceland
In Iceland, the TSAs separate between tourists and excursionists (same-day visitors) in the number of trips and overnights, but this only applies to inbound tourism. All domestic and outbound tourists are categorised as excursionists.
Due to the lack of data available, it is not possible to make direct comparisons about the significance of domestic same-day visitors in the Nordic countries and autonomous areas. Even less is known about the impact of the pandemic on domestic same-day visitors in different Nordic countries. The data that is available is usually created in separate projects with varying methods. Typically, these studies do not include data sets that span over time but are more of a snapshot of the situation at the time of the study. Additionally, definition of a same-day visitor, the method used to estimate number of same-day visitors and the sources of data vary. Keeping these limitations in mind, the numbers available can reveal some general patterns about the significance of same-day visitors in the domestic market in the Nordic countries.
2.3.1. The number of same-day trips
The number and share of the trips made domestically by same-day visitors is very significant. The most comprehensive data on domestic same-day visitors is available from Finland. Statistics Finland’s database includes information about the number of same-day trips for two years: 2018 and 2021. In 2018 there were 16.2 million same-day trips, both for leisure and business, in Finland (2.9 trips per person). In the year 2021, the amount was almost doubled to 31.9 million same-day trips (5.8 trips per person).
Statistics Finland, 2022a.
Statistics Finland, 2023.
Gallup, 2022.
In 2021, same-day visits constituted 51 per cent of all domestic trips for leisure in Finland and 68 per cent of all domestic trips for business in Finland. This is comparable to same-day visits’ share of domestic trips in Sweden in the same year: 54 per cent of domestic trips for leisure were done by same-day visitors and 76 per cent of the business-related trips were same-day trips in 2021. In absolute terms, the number of same-day trips in Sweden was considerably larger comapred to Finland. In 2021, Swedes made 123 million trips domestically. 58 per cent of these domestic trips were made by same-day visitors. This amounts to 71 million trips (6.8 trips per person).
Tillväxtverket, 2022.
Figure 31. Annual number of same-day trips per person in Finland, Iceland and Sweden in years when data is available. (Source: Statistics Finland, Gallup 2022, Tillväxverket 2022).
2.3.2. Domestic same-day visitors’ contribution to the economy
The contribution to the economy by the same-day visitors is relatively smaller than their share of the trips. It seems that domestic same-day visitors spend less money on their trips than domestic overnight visitors – which comes as a no surprise, since they use less services (for example, they do not need accommodation). Yet, the share of same-day visitors in economic terms is far from negligible. Statistics Finland aggregates same-day visitors and overnight visitors in their data about domestic tourism expenditure. Unfortunately, this data is only available up until 2019, so the effects of the Covid-19 pandemic cannot be seen. In the year 2018, there is also data about the number of trips of same-day visitors in Finland, according to which 35.7 per cent of all domestic trips were made by same-day visitors. In the same year, same-day visitors’ share of total domestic tourism expenditure was 19.5 per cent, and they spent EUR 1.67 billion in products and services on their trips. In 2019, the year before the pandemic changed the tourism market, the expenditure of domestic same-day visitors rose to EUR 1.72 billion, but its share was the same: 19.5 per cent of total domestic tourism expenditure.
Visit Finland, 2022a.
Additionally, Denmark has data available about domestic same-day visitors’ share of consumption. In 2020, domestic same-day trips for leisure contributed DKK 15.3 billion (EUR 2.1 billion), which constitutes 20 per cent of total domestic tourism consumption in Denmark. Business-related domestic same-day visitors contributed DKK 12.9 billion (EUR 1.7 billion) or 17 per cent of total domestic tourism consumption. In total, the consumption of all same-day visitors (including inbound and domestic) on leisure trips decreased 20 per cent and the consumption of those on business trips decreased 12 per cent from 2019 to 2020.
Fonnesbech-Sandberg, & Runge, 2022, p. 10.
2.4. Domestic tourism in the Nordic countries after Covid-19 pandemic
During the pandemic, the number of domestic tourists grew significantly in the Nordic countries and autonomous areas. In Iceland and the autonomous areas, the number of domestic overnights multiplied many times over compared to pre-pandemic times, which is due to the small initial number before the pandemic. In Norway and Denmark, the level of domestic overnights topped pre-pandemic levels already in the summer of 2020 and in Finland and Sweden, the pre-pandemic level was reached during summer of 2021. Given the simultaneous drop in the number of inbound tourists, the rise in the relative share of domestic tourists was even greater. However, the surge in the number of domestic tourists was not reported to be enough to entirely compensate for the decrease of the inbound tourists in the early phases of pandemic in any of the Nordic countries or autonomous areas. Likewise, according to all the country reports, the tourism industry has not yet entirely recuperated from the pandemic, although the number of inbound tourists has been rising. Meanwhile, in late 2022 the number of domestic tourists in the Nordic countries and autonomous areas is, in both relative and absolute terms, higher than before the pandemic but lower than during the most pandemic-affected years of 2020 and 2021.
An interesting aspect here is that, according to the results of the survey, the effects of the Covid-19 pandemic on a company level seem far more ambivalent. Both in revenue and in the numbers of employees and customers, the share of those respondents reporting their situation as better than before the pandemic is at quite the same as that of those reporting their situation is worse. This at the first glance seems contradictory to the situation of the tourism industry in the Nordic countries, which seems generally weaker compared to the pre-pandemic situation. However, we still don’t have full picture of the recovery. Additionally, the survey results may be explained by the fact that it includes only respondents whose company has survived the pandemic, not respondents whose company went bankrupt. Even though the time during the pandemic was rough, especially for enterprises serving mostly inbound tourists, it forced companies to develop new practices with which to cope with the crisis, for example, digitalisation and new marketing solutions for domestic tourism. Additionally, given that the sample of enterprises who answered the survey is not representative, in the survey those companies that are doing better and are more interested in domestic tourism can be overrepresented and hence the results can give overtly positive outlook. On the other hand, both the survey and the country reports indicate an increased interest in the domestic tourism markets.
In the survey, the tourism enterprises in the Nordic region were asked how their situation has changed in comparison with before the Covid-19 pandemic across six different categories. These include three indicators measuring the economic success of the company: revenue, number of employees and number of customers. Additionally, there were three indicators for measuring the significance of domestic tourism after the pandemic: number of domestic customers, investment in domestic tourism and interest towards domestic tourism.
In most categories the share of ‘smaller/fewer’ and ‘larger’ responses combined is roughly equal. This implies that, while some respondents have exceeded the pre-pandemic levels in many categories, some are still struggling with the negative effects of the pandemic. (Figure 32). Regionally, the proportion of ‘it is significantly larger’ responses are notably higher in the categories ‘Revenue’ and ‘Number of customers’ in Iceland and ‘Investment in domestic tourism’ in Finland. In Sweden the share of ‘somewhat smaller/fewer’ responses in the category ‘Number of employees’ is significantly higher compared to average.
Figure 32. The effects of the Covid-19 Pandemic in tourism companies (private enterprises only, N=343).
Closer examination of the survey results reveals a strong correlation between the changes in number of domestic customers and indicators measuring the success of the company. Those tourism enterprises that have been able to increase the number of domestic customers compared to pre-Covid situation have more often also been able to increase their revenue, number of employees and number of total customers. Of enterprises responding that the number of domestic customers is somewhat or significantly larger, 60 per cent reported that their revenue was also larger compared to time before Covid-19 pandemic. This is significantly higher share compared to those who report that the number of domestic customers has stayed the same of is smaller, since only 29 per cent of these enterprises reported that their revenue was higher. The same pattern can be observed in number of employees, where 41 per cent of enterprises who have increased number of domestic customers have also more employees, over twice the share compared to those enterprises that don’t have more domestic customers (18%). Unsurprisingly, larger share (61%) of companies who have more domestic customers compared to pre-pandemic situation also report that total number of customers is somewhat or significantly larger compared to the companies who report not to have more domestic customers (31%). These results suggest that the companies that were successful in attracting more domestic customers during the pandemic are now in better shape economically.
Another interesting correlation can be observed between investment in domestic tourism and number of domestic customers. The enterprises reporting somewhat or significantly larger investment in domestic tourism compared to pre-pandemic times also report more often that the number of domestic customers is higher. Well over half, 58 per cent of those companies that have invested more into domestic tourism also reported to have more domestic customers, whereas only 22 per cent of those companies who have not invested more reported to have more domestic customers. Investing in the domestic tourism thus mostly seems to have had desired impact and had attracted more domestic customers. Increasing the number of domestic customers during the pandemic have meant better economic performance for enterprises, so our results indicate that investing in domestic tourism has helped tourism enterprises in the Nordic countries not only to survive the Covid-19 crisis, but also to be able to grow during it. Given the explorative nature of our research and possible biases in our sample of enterprises, this result is not conclusive, but at the least observation merits more research. If this observation is validated in further studies, it would be interesting to examine for example what the companies that have been successful in increasing the number of domestic tourists have in common.
Additionally, the DMOs were asked to compare the situation now with time before Covid-19 in their region. A significant proportion of the respondents reported either somewhat larger or significantly larger change in the ‘Number of domestic tourists’ and ‘Interest in domestic tourism markets’ categories. According to the answers, investment in domestic tourism has not changed significantly and the share of ‘smaller/fewer’ and ‘larger’ answers are somewhat equal. (Figure 33).
Figure 33. The effects of the Covid-19 pandemic in the region (destination management organisations only, N=53).
When comparing the responses of private enterprises and DMOs, it can be observed that, in general, the DMOs see the number of domestic tourists and interest towards domestic tourism markets to have grown in the region significantly more than private enterprises saw them to have grown in their own business. Interestingly, there is much smaller difference between DMOs and private enterprises when asking about investment in domestic tourism: 27 per cent of DMOs thought that there is more investment in domestic tourism in the region compared to 25 per cent of private enterprises (excluding those companies that did not exists before the pandemic) think they have invested more into domestic tourism. It seems that the respondents working in DMOs think that the number of domestic tourists has grown more organically without significant additional investments in the region compared to the experiences of respondents working in private enterprises, who more often think that growing the number of domestic customers has required more investments in domestic tourism.