Automate & Scale
This chapter includes the following capabilities:

Automate & scale
Data sharing model, technology & platforms
“Focus on using technology to solve a problem – not the other way around. If you start with technology in search of a problem, you will end up with a useless solution.”
– Cognite, Nordic Circular Accelerator participant
Data sharing model, technology & platforms
“Focus on using technology to solve a problem – not the other way around. If you start with technology in search of a problem, you will end up with a useless solution.”
– Cognite, Nordic Circular Accelerator participant

Introduction
Why use technology to share data?
Technology plays an essential role in the success of data-sharing collaborations. It enhances efficiency and can bolster security through various safety measures.
Data sharing model
Before selecting technologies, you must agree on a data sharing model. A data sharing model is an abstract model that outlines how data is shared between actors in the collaboration. Where a data model organizes different types of data and how they connect, a data sharing model focuses especially on the sharing across actors and is crucial for a data sharing ecosystem to work.
Technology solutions
Various technology solutions enable circular data sharing. Data marketplaces let participants buy and sell data, data lakes store and process large amounts of data securely, blockchain facilitates secure decentralized data sharing with a distributed ledger, and data platforms handle the full process from data collection to business insights extraction.
Data platforms
There are multiple types of data platforms e.g., shared platforms and standalone platforms. A quality data platform collects multiple data from multiple sources in multiple formats through multiple carriers, then ingests, filters, and aggregates the data before exporting it for business purposes. Understanding the value chain scope and data requirements of your collaboration is crucial in selecting the appropriate data sharing platform.
Key learnings
- Seek to automate wherever possible, reducing human intervention to mitigate human errors and the need for manual work
- Define key selection criteria up front in the collaboration (e.g., type of data model, budget, level of integration) to inform your technology choice(s)
- Consider your desired output (i.e., types of analytics and insights) when choosing a data-sharing technology solution
- Avoid focusing too early on technical details (e.g., latency, data replication) as this can delay and complicate project progress - rather ensure your technology solution is flexible and fit for the future
- Do not underestimate the cost and difficulty in scaling a data sharing solution – existing tech debt and legacy systems might make the technical scaling more cumbersome
- Consider your existing technology solutions (e.g., ERP system) and make sure any data sharing technologies of the collaboration integrates smoothly with your existing setup

Get started with your data sharing model, technology & platform
Get started with your data sharing model, technology & platform
Key questions to ask your collaboration in this step: | ||||||
1 | Choose a data sharing model Evaluate the various data sharing models and select the one that best suits the use case and data requirements of your collaboration. |
| ||||
2 | Agree how to share data between your organizations Consider how you will enable data sharing between your organizations and internal systems by outlining necessary integration methods (e.g., APIs) and carriers (e.g., product identification numbers). |
| ||||
3 | Evaluate your existing technology setup Assess your current technology infrastructure to determine if it – for now – can support your use case and data sharing activities. This will help you keep technical complexity low and allow you to get started. |
| ||||
4 | Select data sharing solution If the existing setup does not accommodate your data sharing needs – or you aim to scale your efforts on the short term – refer to the types of data sharing platforms to determine the most suitable data sharing technology for your collaboration. Decide if you want to build a platform or pick an off-the-shelf solution from the market. |
| ||||
Defining the data sharing model informs the selection of your data sharing platform – and the technology choices of your collaboration
Successful circular data sharing requires a suitable data sharing model and an appropriate platform.
There are four types of data sharing models:
- One step up, one step down: Circularity data is stored locally and shared when requested with immediate value chain actors
- Cumulative: Circularity data is generated upstream and moved forward alongside the product flow
- Centralized repository: Circularity data is stored and shared through a central system
- Decentralized repository: Circularity data is kept in local systems and shared via a decentralized network as responses to queries
Tip! Detail the internal data models of the value chain actors before deciding on the shared data model.
Accenture framework | ||||||||||||||||
1. One step up, one step down | 2. Cumulative | 3. Centralized repository | 4. Decentralized repository | |||||||||||||
 |  |  |  | |||||||||||||
Actor 1 | Actor 2 | Actor 3 | Actor 1 | Actor 2 | Actor 3 | Actor 1 | Actor 2 | Actor 3 | Actor 1 | Actor 2 | Actor 3 | |||||
Types of data sharing platforms | ||||||||||||||||
OEM own platform | OEM consortium with its suppliers | OEM consortium with other OEMs and shared suppliers | Consortium with other OEMs and open to all suppliers | Independent third-party governed open platform | ||||||||||||
+ Low complexity - Uncertain adoption beyond tier 1 | + Medium complexity - Upstream adoption beyond Tier-2 uncertain | + Economy of scale - High complexity - Upstream adoption beyond Tier-2 uncertain | + Economy of scale - Very high complexity | + Suppliers publish data once to share it multiples + Low complexity, low barriers to adoption - Constraints on platform control | ||||||||||||
Your data sharing model should be decided based on desired value chain coverage, value chain interaction, and ease of ERP integration
Data sharing platforms offer pros and cons – specifying your needs will assist you to select the right one.
To minimize complexity and get started, we recommend beginning with your existing technology setup. If your current setup is not sufficient, there are several methods for establishing a data sharing platform, such as creating a new one, or utilizing an independent third-party governed platform. Each has advantages, e.g., lower complexity levels, and disadvantages, e.g., difficulty in encouraging suppliers to use the solution for data sharing.
When choosing the appropriate type of platform, there are three main factors to consider:
- The level of value chain coverage desired
- The way the platform will interact with the value chain (e.g., proprietary versus open standard)
- The ease of integrating data from the platform into the existing ERP system
Other considerations could include budget, skills available to operate the platform, etc.
Accenture framework | ||||||||||||||||
Types of data sharing models | ||||||||||||||||
1. One step up, one step down | 2. Cumulative | 3. Centralized repository | 4. Decentralized repository | |||||||||||||
 |  |  |  | |||||||||||||
Actor 1 | Actor 2 | Actor 3 | Actor 1 | Actor 2 | Actor 3 | Actor 1 | Actor 2 | Actor 3 | Actor 1 | Actor 2 | Actor 3 | |||||
OEM own platform | OEM consortium with its suppliers | OEM consortium with other OEMs and shared suppliers | Consortium with other OEMs and open to all suppliers | Independent third-party governed open platform | ||||||||||||

Case in point
Boliden, Ericsson Connected Recycling, Telia, Transtema & Eltel
Case in point
Boliden, Ericsson Connected Recycling, Telia, Transtema & Eltel
“Our vision is to become the world's most climate-friendly and respected metal provider. To achieve this, we must lead in innovation and digitalization. The collaboration with Ericsson is essential for enabling enhanced circularity and for supporting our vision.”
– Raymond Langevoort, Director Raw Materials at Boliden
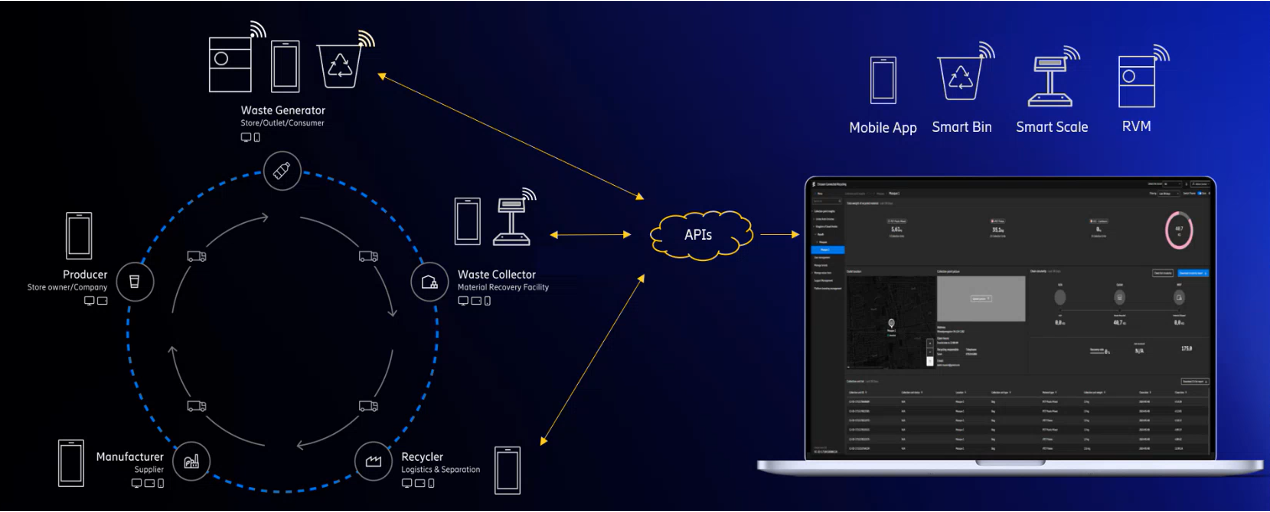
Boliden, Ericsson, Telia, Transtema & Eltel collaborated to use the existing Ericsson Connected Recycling (ECR) platform to drive material traceability, encourage reuse and recycling, and facilitate data-driven decision-making in the telecom industry.
The platform enables the sharing of structured data on material composition, volumes, and movement across the telecom value chain – from waste generators to recyclers and back to manufacturers. APIs and smart devices are integrated to automate data capture and reporting. This supports traceability, helps validate circular material loops, and guides process optimization.
One major challenge was aligning data formats and ownership across multiple stakeholders. The use of a common digital platform helped establish a shared framework and governance for data input, access, and use. Workshops and pilot site visits were key to defining system needs, identifying technical gaps, and co-creating digital solutions tailored to real operational flows.
- ECR enables secure, real-time data sharing across the telecom value chain to track materials from end-of-life to reuse
- Smart devices and APIs automate data collection and feed directly into a unified portal for visibility and reporting
- A co-created governance model ensures data ownership, and interoperability across manufacturers, recyclers, and telcos

Exercise

Exercise
Participants 5 - 10 | Duration 2.0 hrs |
Participants
5 - 10
5 - 10
Duration
2.0 hrs
2.0 hrs
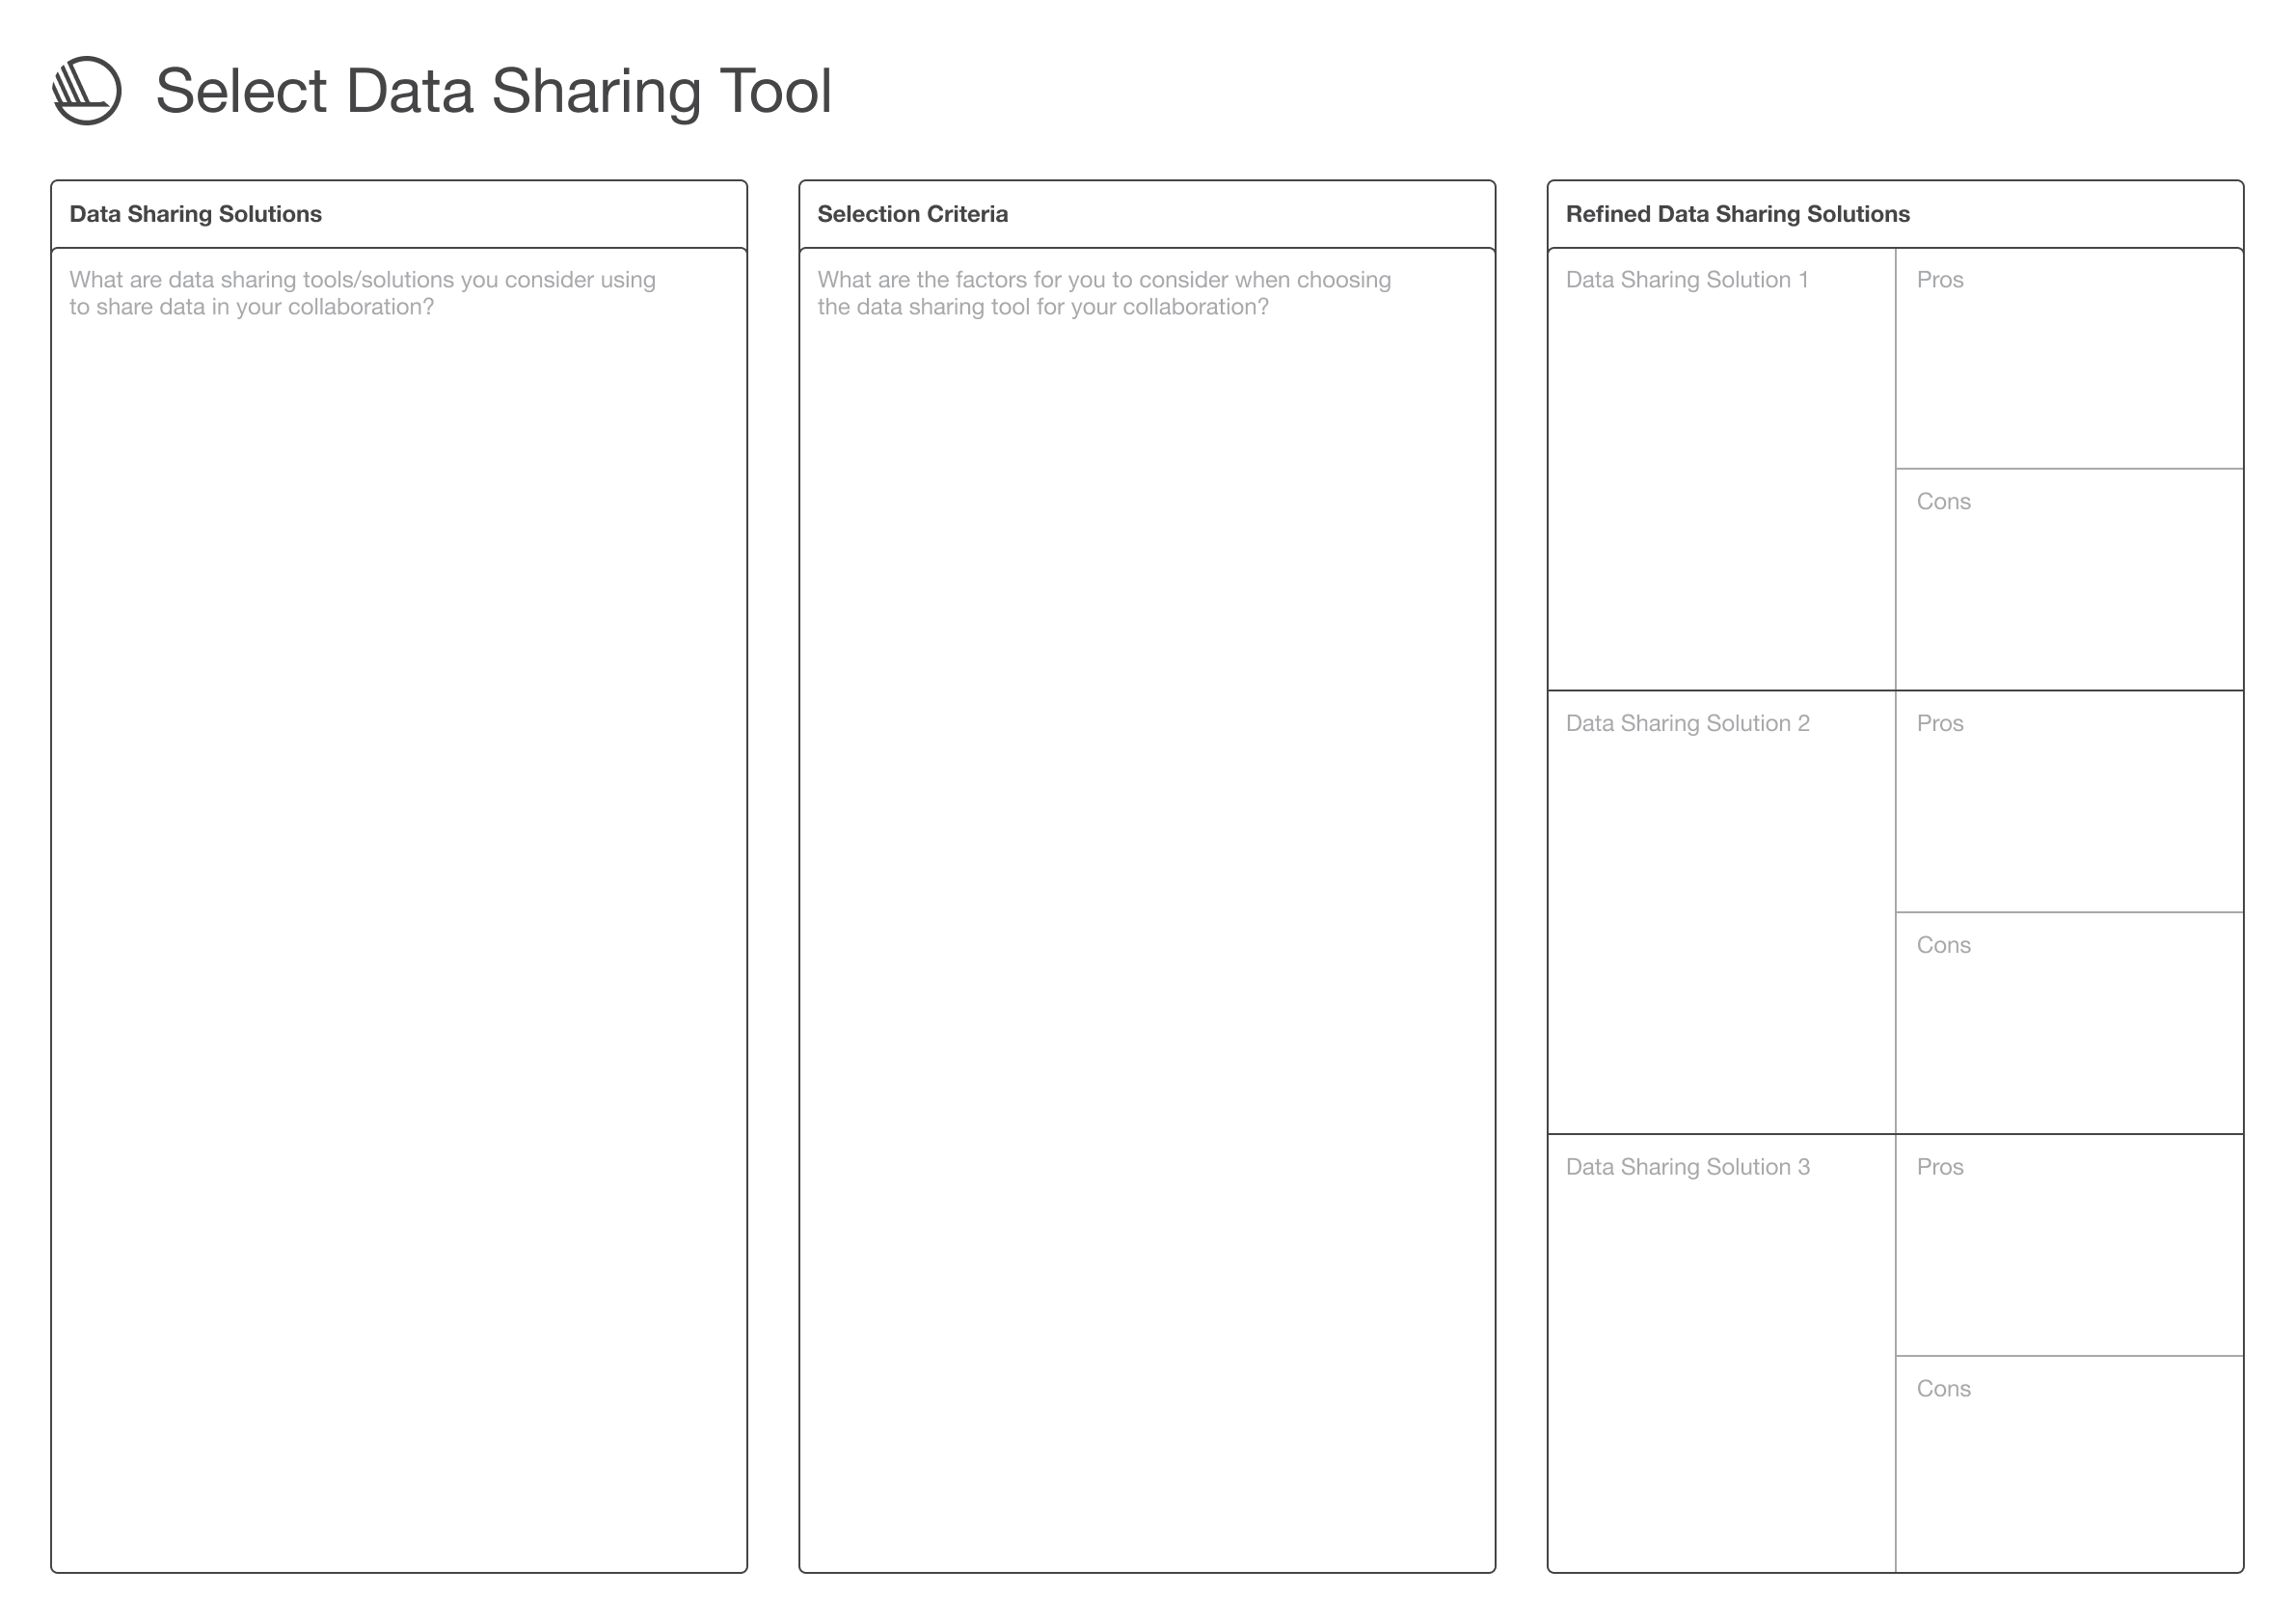
Instructions
Decide the criteria for selecting a data sharing tool for your collaboration and document them on the worksheet.
Next, list potential data sharing tools by considering both existing and new options. Add these on post-its on the worksheet. Use the selection criteria to narrow down to three tools. List them on the short list section of the worksheet and detail the pros and cons of each.
Next Steps
Identify the necessary steps to determine a technological solution (e.g., develop a business case, assess technical feasibility) and rank them in a prioritized roadmap.
Data analytics & insights
“Utilizing circularity data and insights enables us to create new customer value, increase profitability, and drive sustainability.”
– IOXIO, Nordic Circular Accelerator participant
Data analytics & insights
“Utilizing circularity data and insights enables us to create new customer value, increase profitability, and drive sustainability.”
– IOXIO, Nordic Circular Accelerator participant

Introduction
Why are data analytics & insights important in a data sharing collaboration?
Circularity data insights are what enable you to capitalize on your investment in data sharing capabilities, thereby maximizing both environmental and business value. Without these insights, no real progress can be made, and sharing data is pointless. These insights empower proactive future planning rather than reactive responses.
Data analytics
To get to the insights you perform data analytics. Here you move from the “where are we” to the “what do we need to do” by discovering patterns from the data. Depending on the maturity of your collaboration, you can use algorithms and AI tools to unlock the insights from vast interconnected data sets, such as machine learning to predict
maintenance patterns to extend product lifespans or GenAI to propose alternative materials for improved recyclability.
Data insights
Analytics offer many narratives, but insights direct your focus. They enable you to move from circular data sharing to sustainability and business actions. Insights are often presented in a user-friendly dashboard to simplify the understanding of the insight and visualize the expected business impact. Typically, dashboards are developed internally or within individual business units. However, sharing circularity data can facilitate the distribution of insights across the ecosystem, ensuring that all stakeholders have access to the information necessary to make informed business and environmental decisions.
Key learnings
- Get the data model right – the more time you spend on modelling the data correctly, the quicker you can derive actionable insights and realize value
- Focus on data quality and reliability as it is the paramount for any data analytics and insights – if you torture bad data enough, and it will confess to anything
- Be smart about the investment in AI tools – when applied effectively, they will accelerate and enhance your data analytics, but it is possible to start on a smaller scale without them
- Seek insights that can influence decision-making and foster business growth, rather than merely focusing on compliance and reporting tasks
- Create feedback mechanisms that connect insights back to the original vision and value proposition of the collaboration, ensuring that the collaboration continues to produce value over time
- Establish a culture focused on data beyond collaboration to integrate business knowledge, sustainability expertise, and data insights throughout the entities within the ecosystem

Get started with your data analytics & insights
Get started with your data analytics & insights
Key questions to ask your collaboration in this step: | ||||||
1 | Collect, clean & analyze data Consolidate data from value chain partners relevant to your agreed use case. Harmonize definitions, formats, and quality to ensure insights can be trusted and compared. |
| ||||
2 | Design & set up user-friendly frontend data visualizations Use tools like Power BI to create a shared dashboard that visualizes key insights for your use case. Ensure the dashboard reflects multiple stakeholder perspectives—enabling joint decision-making on the defined use case. |
| ||||
3 | Test with partners & iterate together Validate the dashboard with users from each partner organization. Gather feedback on clarity, usability, and relevance to the use case—then iterate the design and data logic together to improve adoption and value creation. |
| ||||
4 | Close the loop by revisiting the shared value case Close the loop by using insights to revisit the original purpose and ambition of the collaboration. Assess progress against the shared value case (see the chapter on Data sharing vision, ambition & value casing), and calibrate expectations and goals where alignment is lacking |
| ||||
Data analytics and insights extract sustainability impact and business value from your data sharing collaboration
Data analytics transforms your circularity data into actionable insights – aligning your data sharing objectives with business value.
Establishing data analytics and insights capabilities is the final phase of establishing a successful data sharing ecosystem.
With a clear understanding of the collaboration purpose, data and data sources are identified and analyzed to produce insights that will guide actions across the value chain and generate business value and impact.
Keep in mind – different stakeholders and partners will need different types of insights depending on their roles, decisions, and data maturity. These should be clarified early and revisited as collaboration evolves.
Tip! Use feedback loops to understand if the data collected, shared, and analyzed generates the expected value as established in the original value case.
Objective | |||
Data Transformation | Data sources | e.g. Bill of Materials; Materials Management; Product Lifecycle Management; Supplier Data; Third Party Solutions (e.g. LCA tools) | |
↓ | |||
Data cleansing and transformation | e.g. Categorising materials into circular input types (renewable, recycled, sustainably sourced and non-circular) based on market standards | ||
↓ | |||
Data analysis and manipulation | e.g. Applying formulas based on index methodology; and connecting internal / external data sources for calculation (e.g. intensity factors) | ||
↓ | |||
Business and circularity insights | Automated user interface and visualization IN DASHBOARD | ||
Value | Baselining and progress measurement | Business & environmental impact visualization | Forecasting, prediction and scenario modelling |

Case in point
A solution to demonstrate the value of tool recycling to customers
Case in point
A solution to demonstrate the value of tool recycling to customers
“Through collecting and analyzing data, we realized the critical importance of high-quality, reliable data – especially when it comes to sustainability.”
– Sandvik Coromant, participant in the Nordic Circular Accelerator
“Through collecting and analyzing data, we realized the critical importance of high-quality, reliable data – especially when it comes to sustainability.”
– Sandvik Coromant, participant in the Nordic Circular Accelerator
Sandvik Coromant, SKF and Wolfram
With an established customer recycling business for used carbide tools, Sandvik Coromant teamed up with SKF (customer) and Wolfram (recycling partner) to create a customer facing dashboard to visualize the value provided by recycling.
The key objectives included identifying data and customer needs, developing a proof-of-concept, and exploring the recycling value stream.
A key enabler of the project was in-person collaboration, including site visits and hands-on research. This made it possible to trace the product’s journey in real life and clearly identify the data required.
Key learnings from the project showed that while accessing raw data was relatively straightforward, challenges remained around data handling, security, and formatting. Over time, the perceived value of recycling also shifted – from an initial focus on financial outcomes to a greater emphasis on sustainability data and its relevance to the customer.


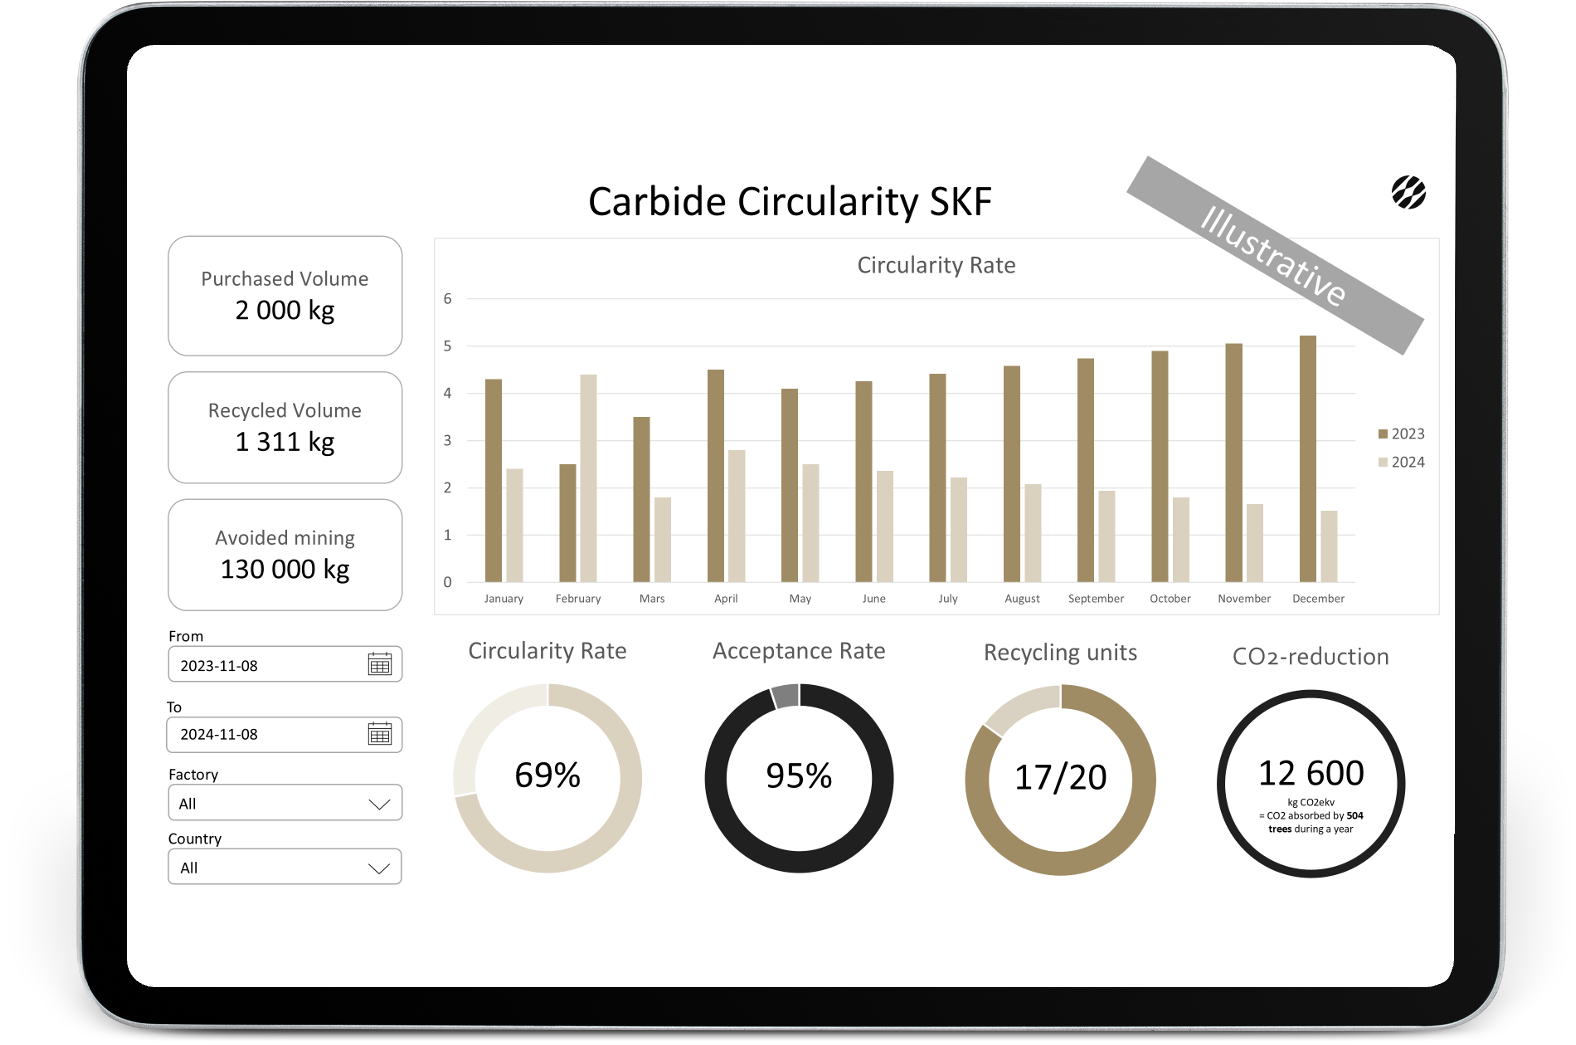

- The project involved analyzing data from recycling flows
- Specific data points included customer return patterns, and material recovery rates
- This data was used to map value creation, enable traceability, and support sustainability reporting
- Visualization and insights are being developed using Power BI

Exercise
Exercise
Participants 5 - 10 | Duration 1.0 hrs |
Participants
5 - 10
5 - 10
Duration
1.0 hrs
1.0 hrs
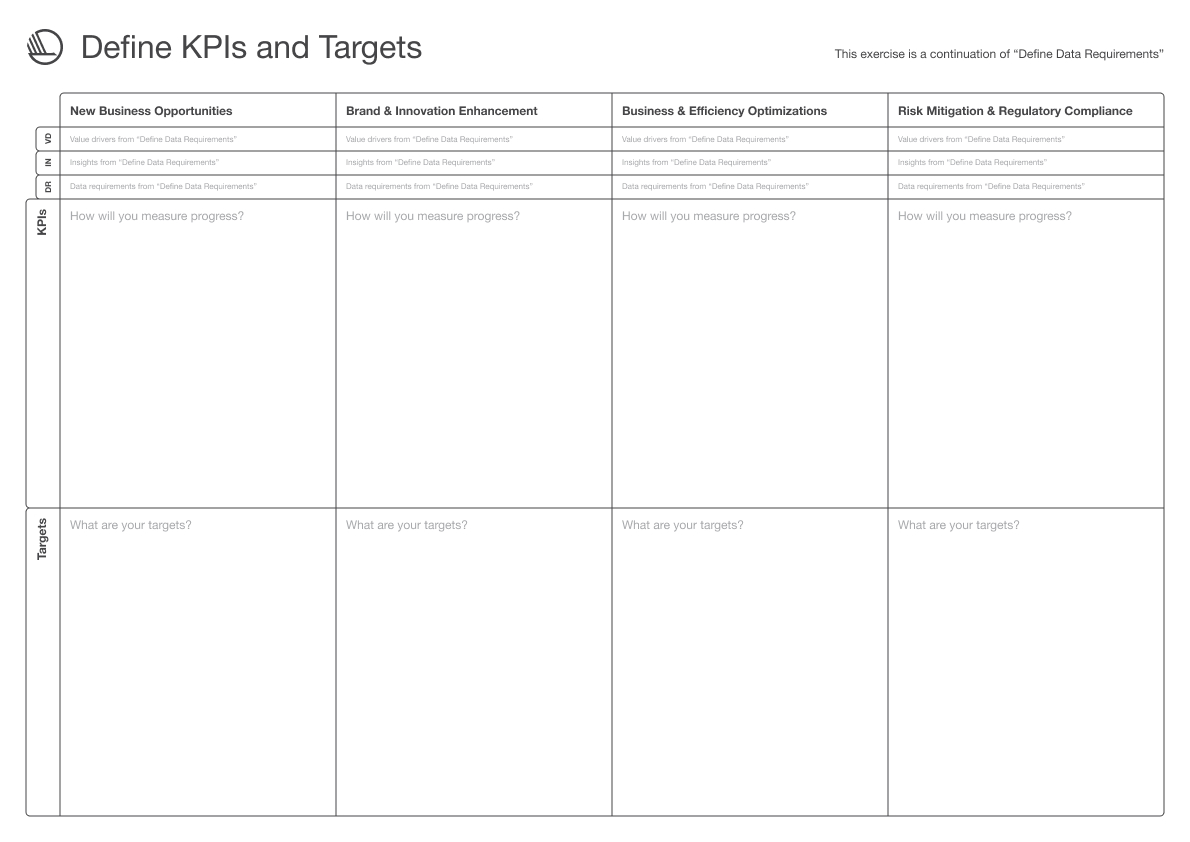
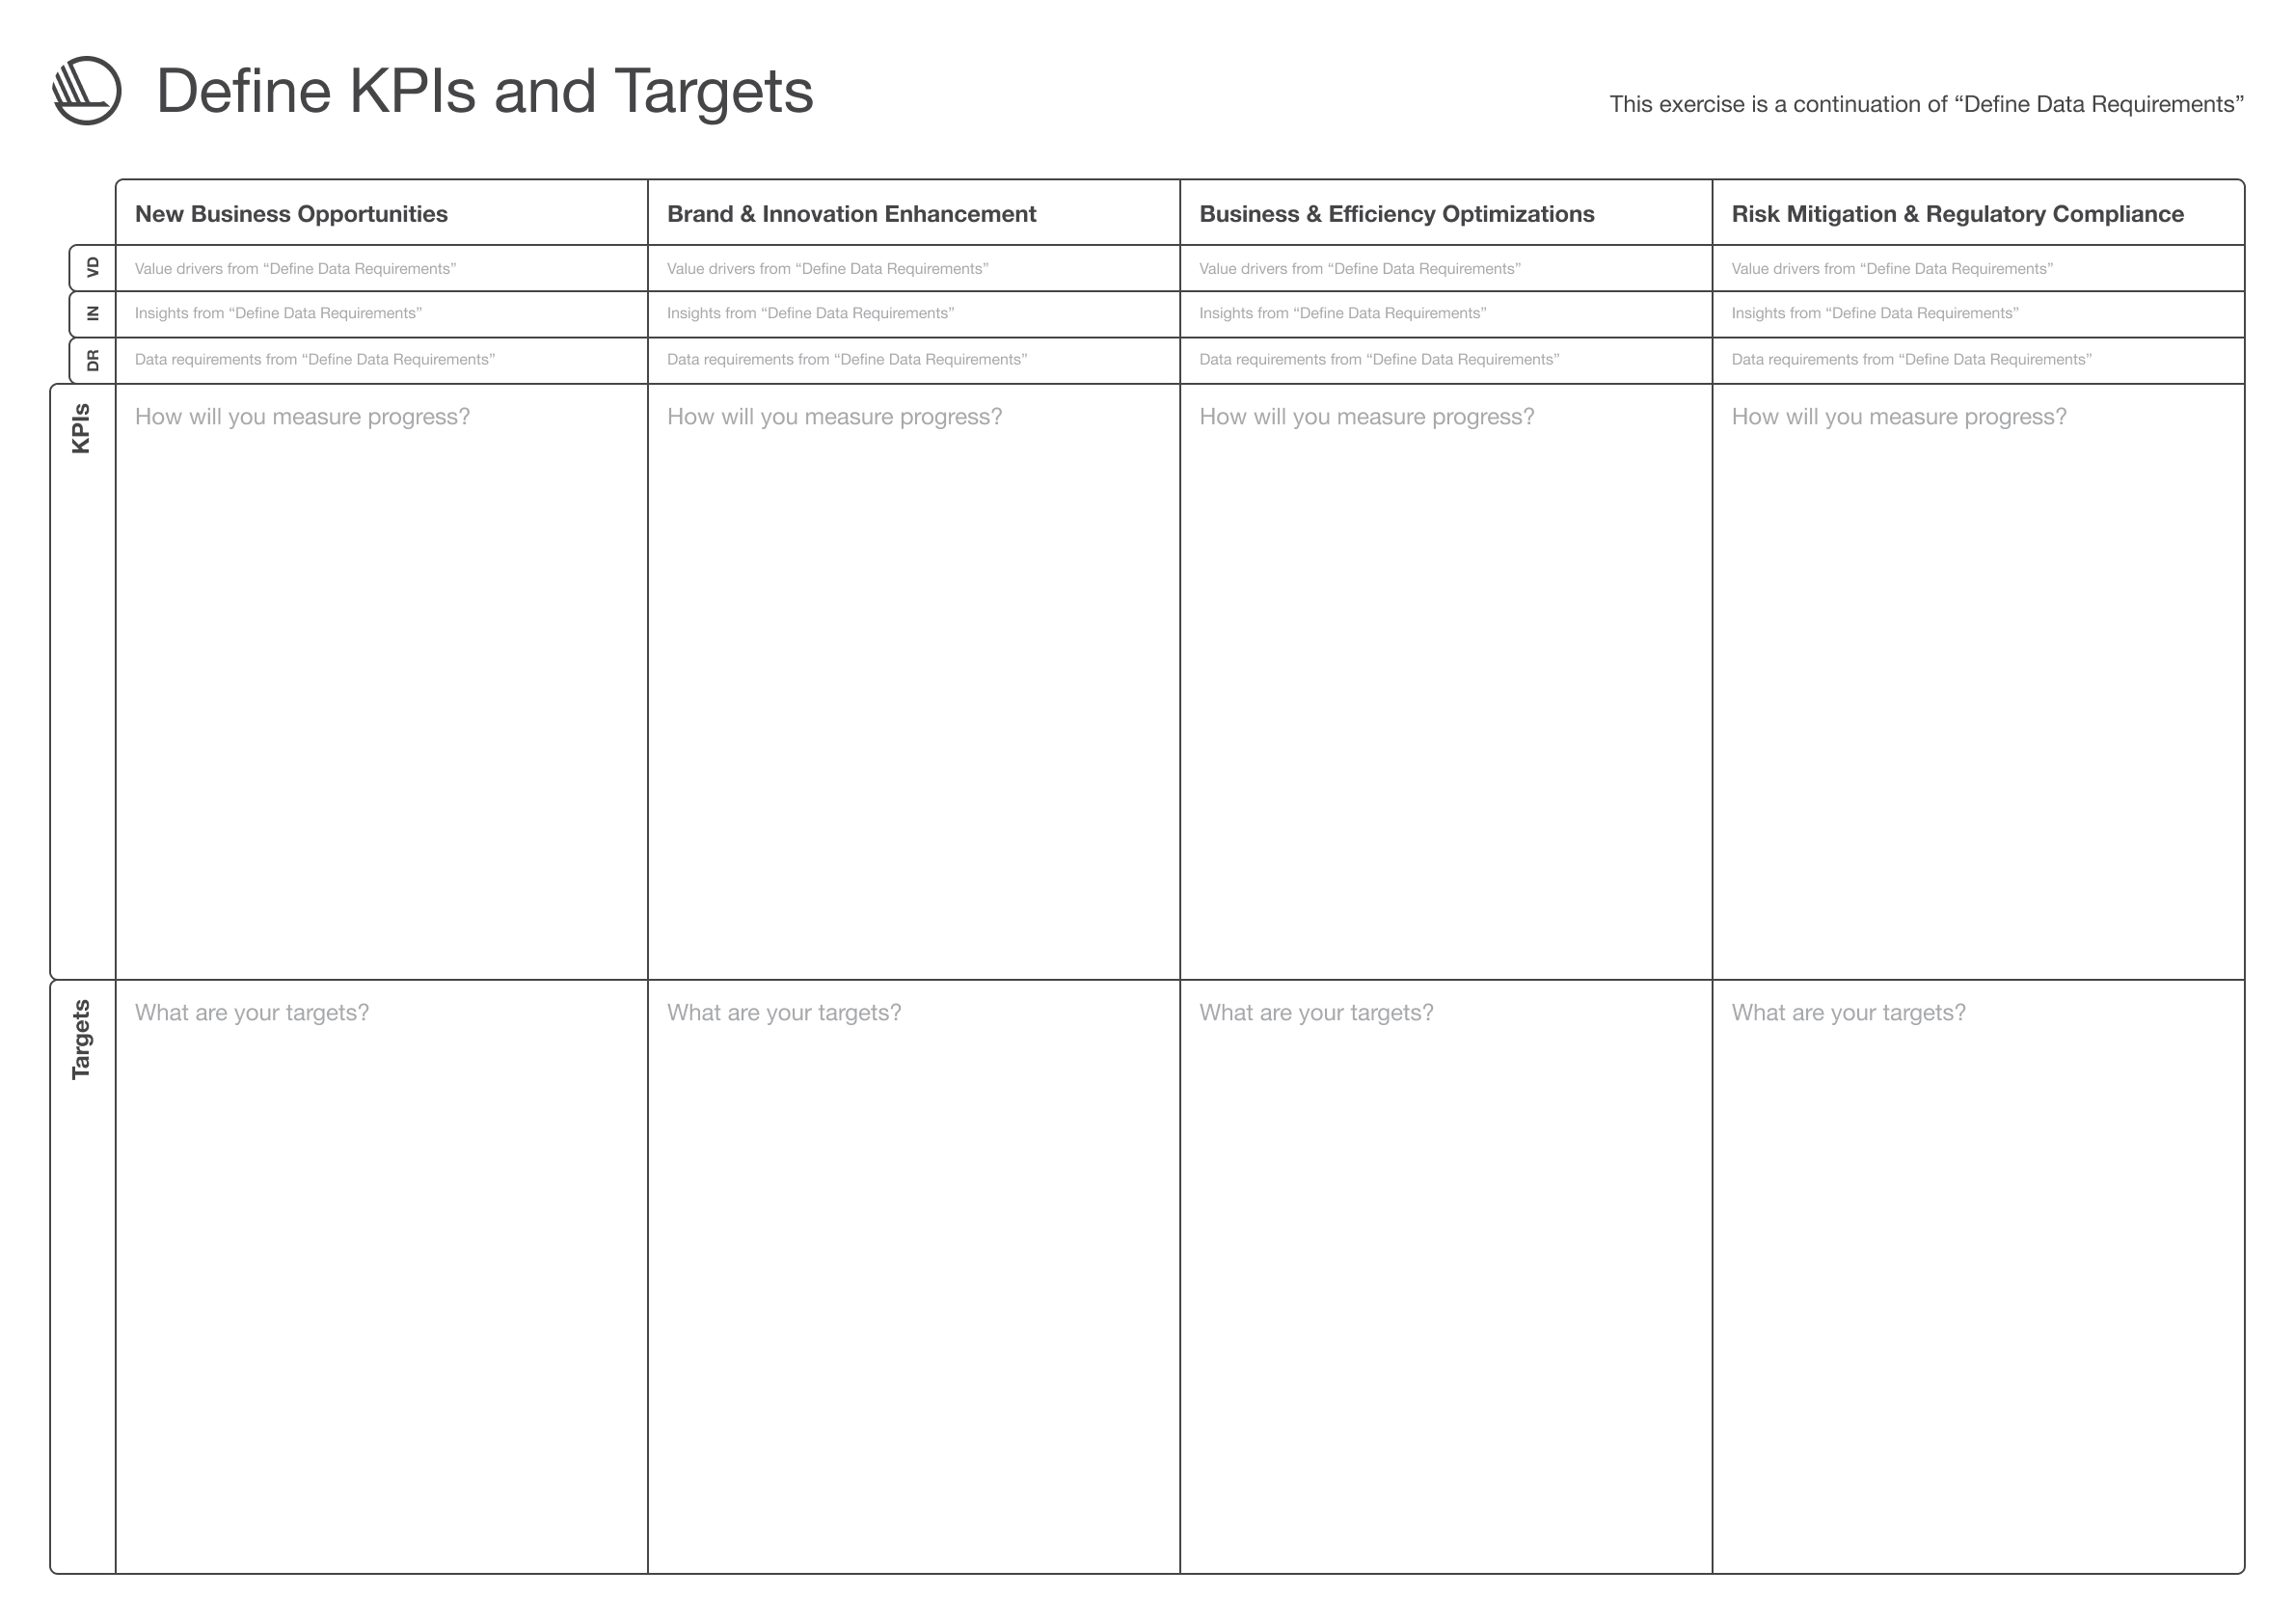
Instructions
Build on the value drivers and data points from earlier exercises. In small groups, define how to measure progress for each value category.
Use post-its to capture: a) KPIs that reflect progress toward your circularity use case and value case; b) Targets that match the ambition level of your collaboration. Then, come together as a full group to share and cluster ideas. Aim to align on 2–3 key KPIs and targets per category.
Next steps
Use the agreed KPIs and targets to inform dashboard development and track progress. Revisit them regularly to stay aligned with your shared goals and evolving use case.