9. Understanding barriers to energy efficiency and households’ energy behaviour in the Nordic region
This chapter describes two key tasks:
- A questionnaire designed to investigate barriers to implementing energy efficiency measures, focusing on three areas: awareness of national and EU regulations, strategies for driving energy efficiency, and the effectiveness of government incentives. It included both open-ended and multiple-choice questions, targeting 22 responses from consumers, businesses, and industry professionals in the Nordic building and industry sectors.
- A web-panel survey conducted to analyse household energy behaviour before, during, and after the 2021–2023 energy crisis, targeting 3300 respondents across the six Nordic countries. The survey included mainly multiple-choice, covering socio-demographics, energy use attitudes, behaviour changes during the energy crisis, energy efficiency measures, and future preferences, with the final section using the Stated Preference method to assess preferences for future energy efficiency investments and factors influencing respondents' decisions.
9.1 Barriers to energy efficiency
9.1.1 Background
Despite the technological advancements and policy incentives aimed at promoting energy efficiency, there remains a significant gap between the potential for energy savings and its actual achievement. This discrepancy is often attributed not just to economic or technical challenges but also to a range of psychological and behavioural barriers that impede the adoption of energy efficiency measures by consumers, businesses, and industry professionals. Understanding these barriers is crucial for developing effective strategies to encourage the uptake of energy efficiency solutions. Consumers, the end-users of energy in buildings, often face hurdles such as a lack of awareness
E. Hirst and M. Brown, “Closing the efficiency gap: barriers to the efficient use of energy,” Resources, Conservation and Recycling, vol. 3, no. 4, pp. 267–281, Jun. 1990, doi: 10.1016/0921-3449(90)90023-W.
A. Trianni, E. Cagno, E. Worrell, and G. Pugliese, “Empirical investigation of energy efficiency barriers in Italian manufacturing SMEs,” Energy, vol. 49, pp. 444–458, Jan. 2013, doi: 10.1016/j.energy.2012.10.012.
N. Hanus, G. Wong-Parodi, M. J. Small, and I. Grossmann, “The role of psychology and social influences in energy efficiency adoption,” Energy Efficiency, vol. 11, no. 2, pp. 371–391, Feb. 2018, doi: 10.1007/s12053-017-9568-6
Similarly, businesses and industry actors encounter their own set of barriers. These range from the organizational inertia that resists changes in established procedures to the split incentive problem, where the benefits of energy efficiency investments are not fully accrued by the investing party. Additionally, market actors such as industry professionals and practitioners often face a lack of information or misaligned incentives
N. Hanus, G. Wong-Parodi, M. J. Small, and I. Grossmann, “The role of psychology and social influences in energy efficiency adoption,” Energy Efficiency, vol. 11, no. 2, pp. 371–391, Feb. 2018, doi: 10.1007/s12053-017-9568-6
The interplay of these psychological and behavioural barriers presents a complex challenge for the widespread adoption of energy efficiency measures in the Nordic building and industry sectors. This chapter aims to delve deeper into these barriers, drawing on insights from a survey designed to understand the underlying reasons for resistance to energy efficiency.
9.1.2 Questionnaire framing
The goal of the questionnaire was to gain insights on three categories that not only constitute barriers but can also help address those barriers towards a more widespread implementation of energy efficiency measures.
- Awareness and familiarity across practitioners: Focuses on understanding how industry professionals and practitioners are influenced by national and EU regulations promoting energy efficiency in their sectors.
- Addressing Change: Examines how the efforts of the building and industry sectors can be directed towards greater energy efficiency through effective strategies.
- Incentive Schemes: Looks at how government incentive programmes can be improved to be more effective in encouraging energy efficiency adoption among consumers and industries.
Within each of the three categories, there is one main question to be answered, as illustrated in Figure 8. Then, several questions are included in each category to provide a more founded background for answering the three main questions. The categories and questions are designed based on findings from the literature, e.g. the work of Bagaini et el. on barriers to energy efficiency implementation in buildings in several European countries, or the report by United Nations Economic Commission for Europe focusing on overcoming barriers to investing in energy efficiencyUnited Nations, Ed., Best policy practices for promoting energy efficiency: a structured framework of best practices in policies to promote energy efficiency for climate change mitigation and sustainable development . in UNECE Energy Series, no. 53. New York and Geneva: United Nations, 2017. [Online]. Available: https://unece.org/DAM/energy/se/pdfs/geee/pub/Promoting_EE_ECE_ENERGY_100_Rev.1_pdf_web.pdf#:~:text=impact%20policies%20and%20measures,%20which%20will%20help%20policy%20makers%20in . The category “Awareness and familiarity across practitioners” consists of six questions, whereas the categories “Addressing change” and "Incentive schemes” have seven and fifteen questions respectively. Both open-ended and multiple-choice questions were included, to gather comprehensive insights without conducting direct interviews.
A. Bagaini, F. Colelli, E. Croci, and T. Molteni, “Assessing the relevance of barriers to energy efficiency implementation in the building and transport sectors in eight European countries,” The Electricity Journal, vol. 33, no. 8, p. 106820, Oct. 2020, doi: 10.1016/j.tej.2020.106820.
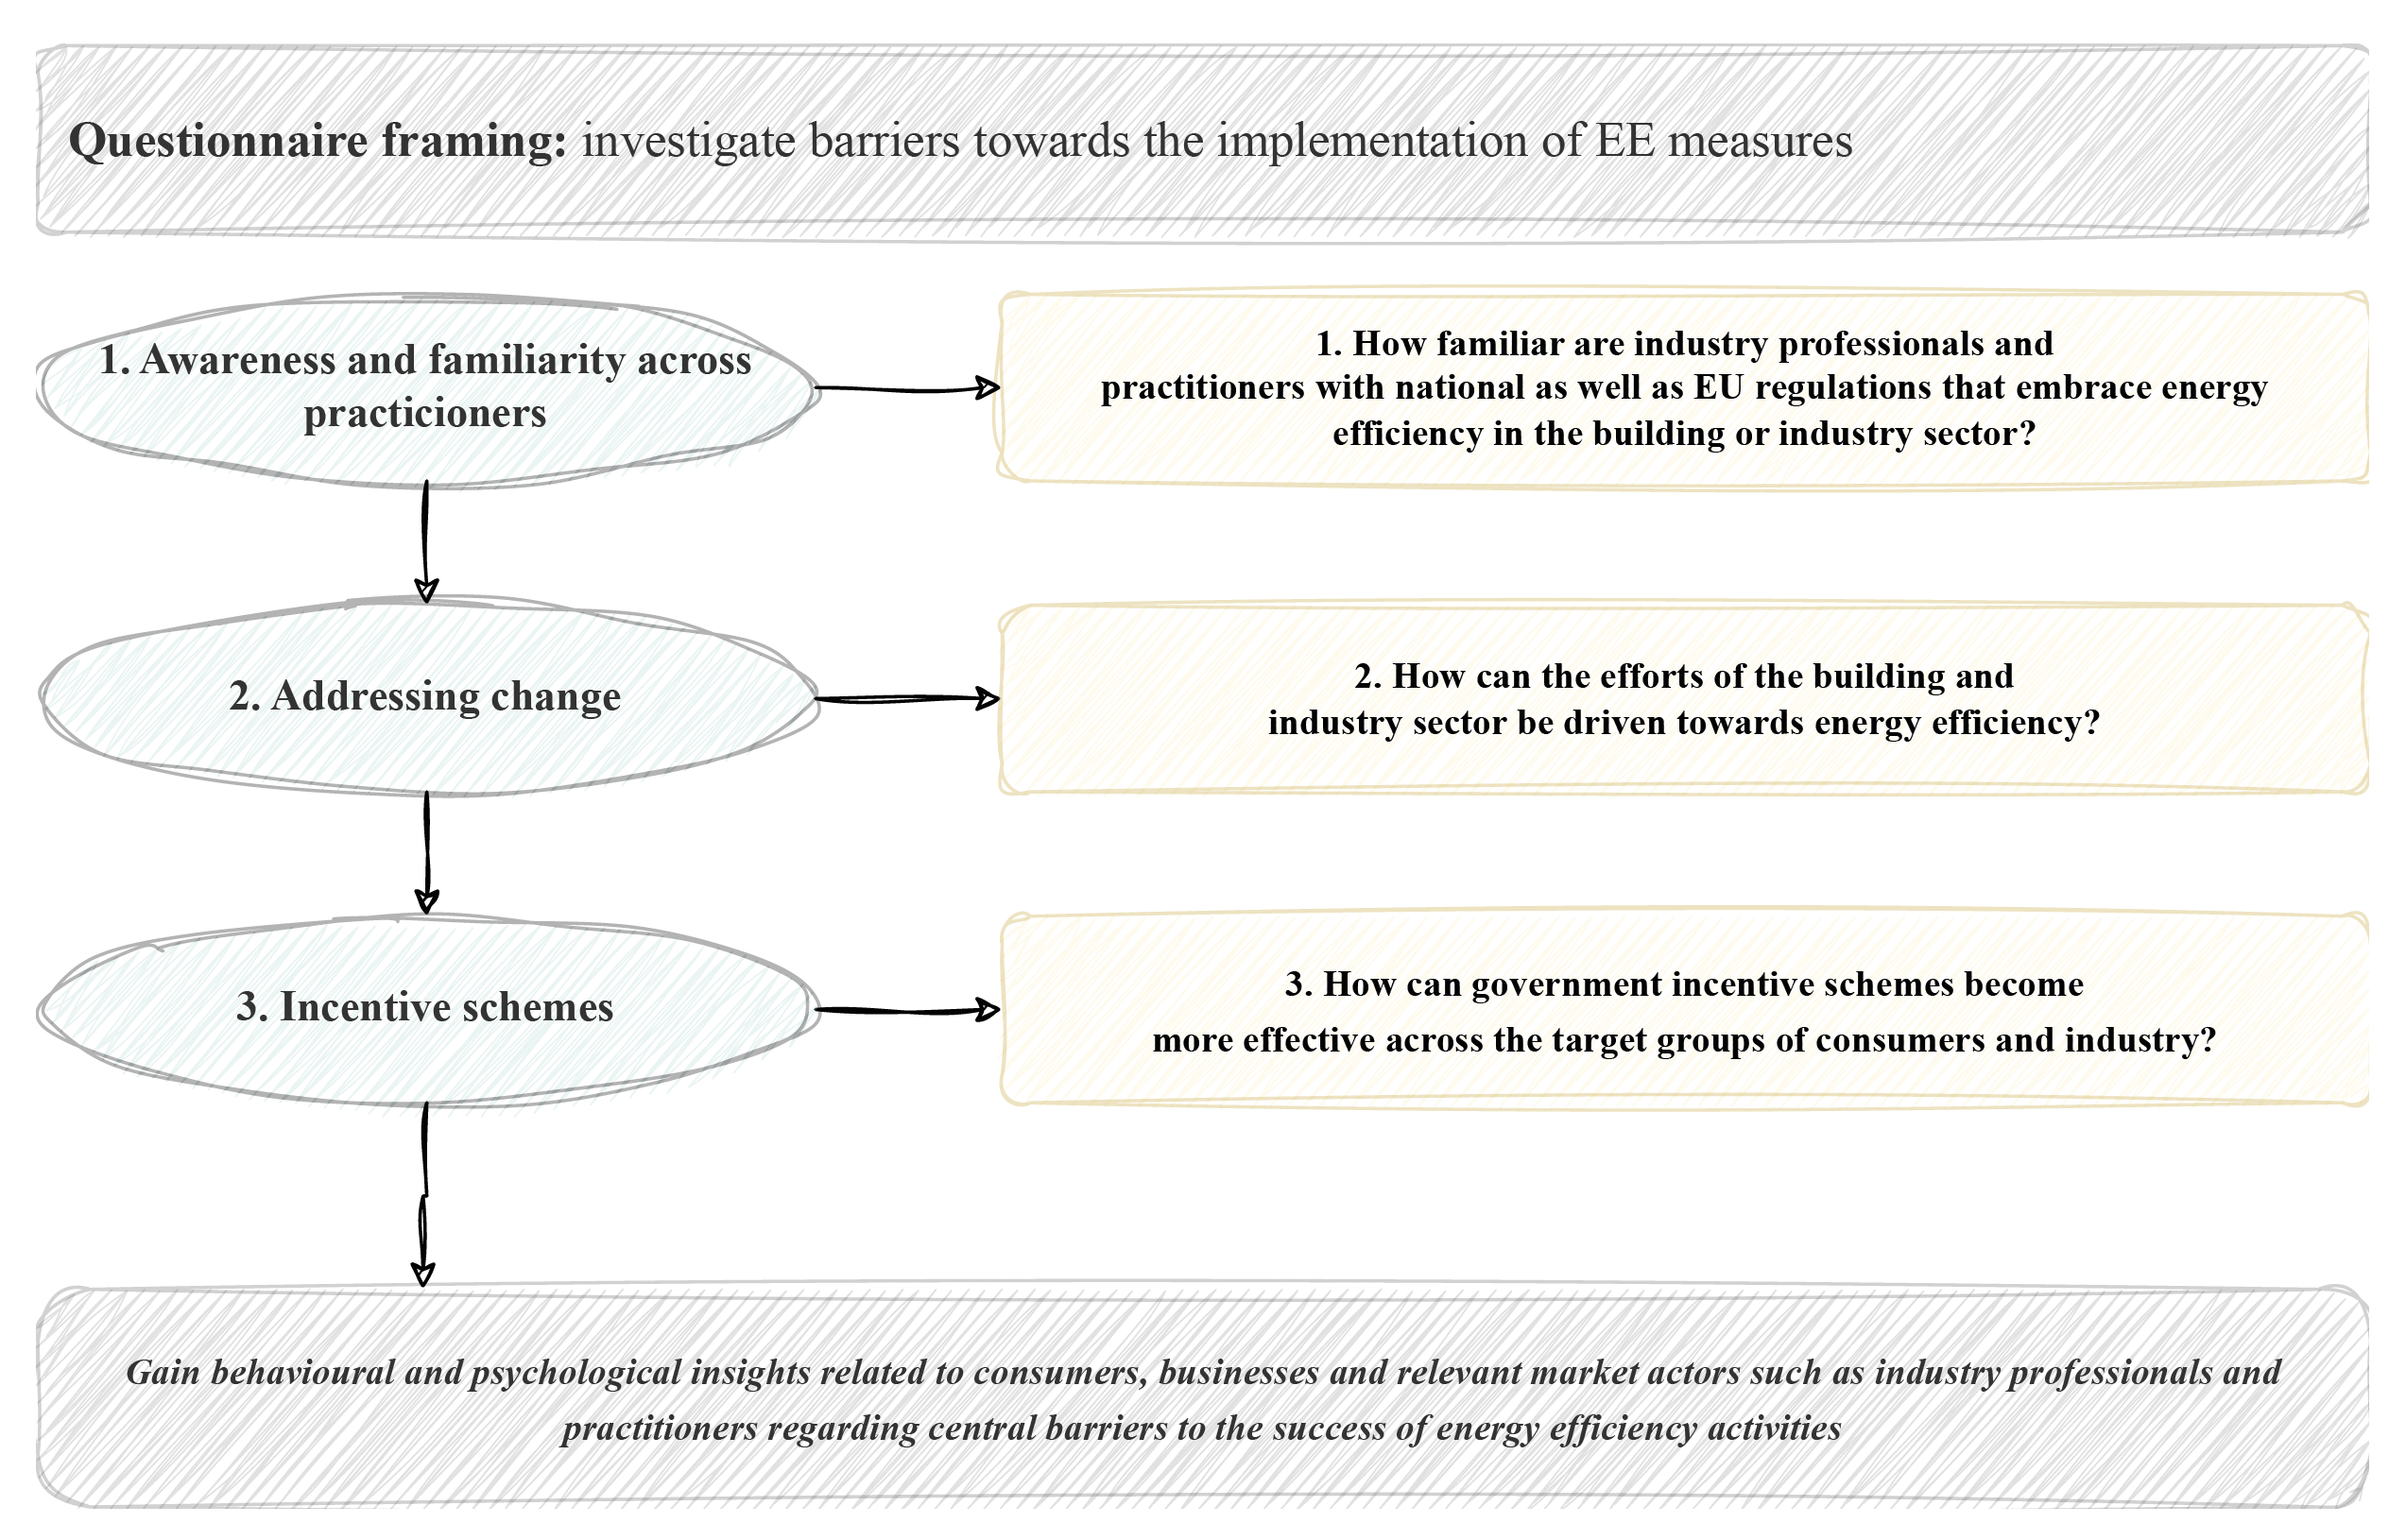
Figure 8. Questionnaire framing to investigate barriers towards the implementation of energy efficiency measures.
The target audience of the questionnaire were consumers, businesses, and relevant market actors such as industry professionals and practitioners from the building and industry sector in the Nordic countries.
The questionnaire was conducted over the period from February 21 to April 30, 2024. It was prepared as a Google Form in English and distributed via email to several relevant experts working in the Nordic countries, aiming to receive at least two responses per country, ideally with one respondent from the building sector and one from the industry sector. The complete questionnaire is provided in the Appendix.
9.1.3 Summary and discussion on findings
The total number of valid responses was 22. Approximately 10% of the respondents were female. Reponses were received from each Nordic countries, specifically 3 answers from Denmark, 4 each from Norway, Iceland and Sweden, 5 from Finland and 2 answers from the Faroe Islands. For each country, except for Faroe, at least one of the respondents is from the building or industry sector respectively. Most of the experts (45%) represent national federations and research working within both or one of the two sectors, followed by 33% that represent the industry sector and 24% from the building sector.
Key findings from the questionnaire are presented below for each category. For a detailed analysis of the responses, including a question-by-question overview, the reader is referred to the Appendix.
9.1.3.1 Awareness and familiarity across practitioners
Based on the first part of the questionnaire, it can be concluded that respondents show moderate to high familiarity with both national and EU regulations, such as the EED and EPBD. However, regional differences exist, with respondents from Iceland and the Faroe Islands reporting lower familiarity due to their non-EU status. Professionals engage with these regulations through official notifications, industry associations, and direct interaction with regulatory bodies, supplemented by participation in conferences, webinars, and courses.
The responses highlight government incentives that support energy efficiency awareness, though there's a need for more accessible, user-friendly resources and stronger government-industry collaboration. Successful strategies, like energy efficiency agreements and public awareness campaigns, demonstrate the effectiveness of these regulations. While industry professionals are generally well-informed, continued efforts are needed to improve access to information and foster greater collaboration between the government and industry. This will ensure effective implementation of energy efficiency measures.
Figure 9, Figure 10 and Figure 11 illustrate some of the key findings from this questionnaire category.
Figure 9. Actions to promote energy efficiency awareness.
Figure 10. Common methods to stay updated on energy efficiency regulations.
Figure 11. Options to improve mechanisms to keep industry professionals updated on EE regulations.
9.1.3.2 Addressing change
The second part of the questionnaire explores factors influencing the adoption of energy-efficient practices, focusing on behavioural and psychological barriers. Many respondents report moderate to high energy efficiency implementation, with key motivators including return on investment, environmental responsibilities, corporate social responsibility (CSR), and regulatory compliance. However, psychological and behavioural barriers hinder progress. Financial constraints, mainly budget limitations, project prioritization, and uncertainties around return on investment (ROI) are mentioned as major obstacles. Additionally, short-term priorities often overshadow long-term sustainability, with a lack of expertise and inadequate incentives also cited as challenges.
To overcome these barriers, respondents recommend combining strict regulations with financial incentives, such as national support schemes and stronger regulations at both national and EU levels. Regular energy audits and sharing successful case studies can also drive change. Communication strategies like storytelling, ROI metrics, and benchmarking are seen as effective tools for reducing resistance and increasing urgency. Figure 12, Figure 13, Figure 14 and Figure 15 present some key findings from this questionnaire category.
Figure 12. Motivating factors for implementation of energy efficiency measures.
Figure 13. Barriers for the implementation of energy efficiency measures.
Figure 14. Main challenges for shifting towards more energy-efficient solutions in the building and industry sector.
Figure 15. Efforts to make energy efficiency a core element of business models and operations.
9.1.3.3 Incentive schemes
To improve the effectiveness of government incentive schemes, understanding existing measures and their impact is essential. Feedback shows positive views on programmes promoting energy efficiency, though mixed reviews on regulatory frameworks, particularly in Iceland, suggest a need for adjustments. A major concern is the perceived lack of support at regional and local levels, pointing to misalignment across government tiers. This calls for more coherent policies to support energy efficiency.
Barriers such as bureaucratic complexity, competing priorities, long payback periods, and regional energy costs hinder scheme effectiveness. Suggestions for improvement include increasing funding, offering tax incentives, simplifying applications, and enhancing public awareness. Performance-based incentives linked to measurable outcomes were also proposed.
For better outcomes, schemes should align across government levels, adapt to market needs, and streamline processes. Engaging stakeholders early and showcasing successes can help design more widely accepted incentives. Figure 16, Figure 17 and Figure 18 present some key findings from this questionnaire category.
Figure 16. Legislative and policy support for energy efficiency measures.
Figure 17. Barriers and limitations of government incentive schemes for energy efficiency.
Figure 18. Main barriers for companies to investing in energy efficiency measures.
9.2 Changes in households’ energy behaviour in relation to the 2021–2023 energy crisis
9.2.1 Background
Understanding the complexities of energy use within households is paramount, considering its pivotal role in both individual lifestyles and broader environmental sustainability efforts. The decision-making processes underlying energy efficiency enhancements are multifaceted, often influenced by a myriad of internal and external factors. Previous studies, such as by Faiers et al.
A. Faiers, M. Cook, and C. Neame, “Towards a contemporary approach for understanding consumer behaviour in the context of domestic energy use,” Energy Policy, vol. 35, no. 8, pp. 4381–4390, Aug. 2007, doi: 10.1016/j.enpol.2007.01.003.
P. C. Stern, “New Environmental Theories: Toward a Coherent Theory of Environmentally Significant Behavior,” Journal of Social Issues, vol. 56, no. 3, pp. 407–424, Jan. 2000, doi: 10.1111/0022-4537.00175.
C. J. Correia, T. A. Benson, and K. B. Carey, “Decreased substance use following increases in alternative behaviors: A preliminary investigation,” Addictive Behaviors, vol. 30, no. 1, pp. 19–27, Jan. 2005, doi: 10.1016/j.addbeh.2004.04.006.
A. Prakash, “Green marketing, public policy and managerial strategies,” Bus Strat Env, vol. 11, no. 5, pp. 285–297, Sep. 2002, doi: 10.1002/bse.338.
In addition to individual predispositions, habitual patterns and external stimuli also exert notable influences on energy-related decisions. Salmela and Varho
S. Salmela and V. Varho, “Consumers in the green electricity market in Finland,” Energy Policy, vol. 34, no. 18, pp. 3669–3683, Dec. 2006, doi: 10.1016/j.enpol.2005.08.008.
D. F. DiClemente and D. A. Hantula, “Applied behavioral economics and consumer choice,” Journal of Economic Psychology, vol. 24, no. 5, pp. 589–602, Oct. 2003, doi: 10.1016/S0167-4870(03)00003-5.
L. H. Pedersen, “The dynamics of green consumption: a matter of visibility?,” J. Environ. Policy Plann., vol. 2, no. 3, pp. 193–210, Jul. 2000, doi: 10.1002/1522-7200(200007/09)2:3<193::AID-JEPP53>3.0.CO;2-5.
Given the dynamic interplay of these factors, the survey is structured to comprehensively explore various dimensions of household energy dynamics. By delving into socio-demographic profiles, attitudes, motivations, and intentions surrounding energy consumption and efficiency measures, the survey aims to provide nuanced insights into the intricate tapestry of energy-related behaviours. Through this approach, it seeks to not only elucidate current consumption patterns but also inform future strategies aimed at promoting sustainable energy practices within households.
9.2.2 Questionnaire framing
Structured into five distinct sections, with a majority of multiple-choice questions, the survey is designed to provide a comprehensive understanding of various facets of household energy dynamics, encompassing socio-demographic profiles, attitudes, motivations, and intentions concerning energy consumption and efficiency measures. At its core, the survey seeks to gather insights into respondents' energy consumption patterns, their perspectives on energy efficiency, and their willingness to adopt energy-saving practices, even amid the global energy crisis of 2021-2023.
When formulating the questions of the survey, several scientific works were consulted, as detailed in each section below. In addition, we partially aligned with a survey developed for the Norwegian context within the research project Role of energy behaviour in the low-carbon transition (BEHAVIOUR), 2020-2025
IFE, “Role of energy behaviour in the low-carbon transition (BEHAVIOUR).” Accessed: May 10, 2024. [Online]. Available: https://ife.no/en/project/role-of-energy-behaviour-in-the-low-carbon-transition-behaviour/
C. Lavin and H. Julienne, “Behavioural Energy and Travel Tracker. Results report 1- heating season 2022/2023,” Sustainable Energy Authority of Ireland, 2023.
The main sections of the survey are described below.
Section 1 – Background
This segment focuses on gathering information related to socio-demographic factors and housing characteristics. Questions span a wide range of topics, including age, gender, education level, employment status, household composition, income, housing type, occupancy status, floor area, energy efficiency rating, year of construction, heating systems, among others
This segment focuses on gathering information related to socio-demographic factors and housing characteristics. Questions span a wide range of topics, including age, gender, education level, employment status, household composition, income, housing type, occupancy status, floor area, energy efficiency rating, year of construction, heating systems, among others
R.-A. Corbos, O.-I. Bunea, and D.-C. Jiroveanu, “The effects of the energy crisis on the energy-saving behavior of young people,” Energy Strategy Reviews, vol. 49, p. 101184, Sep. 2023, doi: 10.1016/j.esr.2023.101184.
P. Dato, “Investment in Energy Efficiency, Adoption of Renewable Energy and Household Behavior: Evidence from OECD Countries,” The Energy Journal, vol. 39, no. 3, pp. 213–244, May 2018, doi: 10.5547/01956574.39.3.pdat.
S. Halleck Vega, E. Van Leeuwen, and N. Van Twillert, “Uptake of residential energy efficiency measures and renewable energy: Do spatial factors matter?,” Energy Policy, vol. 160, p. 112659, Jan. 2022, doi: 10.1016/j.enpol.2021.112659.
Section 2 – Attitudes / Motivations
In this section, we aim to explore respondents' attitudes and motivations surrounding energy usage. The questionnaire delves into concerns about environmental impact, considerations of cost, willingness to conserve energy, interest in adopting energy-efficient housing solutions, awareness of energy consumption, and flexibility in adjusting energy usage patterns
In this section, we aim to explore respondents' attitudes and motivations surrounding energy usage. The questionnaire delves into concerns about environmental impact, considerations of cost, willingness to conserve energy, interest in adopting energy-efficient housing solutions, awareness of energy consumption, and flexibility in adjusting energy usage patterns
F. Hanke, K. Grossmann, and L. Sandmann, “Excluded despite their support - The perspectives of energy-poor households on their participation in the German energy transition narrative,” Energy Research & Social Science, vol. 104, p. 103259, Oct. 2023, doi: 10.1016/j.erss.2023.103259.
G. Trotta, “The determinants of energy efficient retrofit investments in the English residential sector,” Energy Policy, vol. 120, pp. 175–182, Sep. 2018, doi: 10.1016/j.enpol.2018.05.024.
Section 3 – Behaviour
Here, the focus is on understanding the behaviour changes in the households, particularly during the energy crisis period of 2021-2023, correcting for the measures they already adopted before the energy crisis. Questions probe into behaviours such as temperature adjustments, changes in showering habits, reduction of appliance usage, and exploration of alternative heating sources. Additionally, we evaluate participants' perceptions of the impact of these actions on energy and cost savings, as well as their willingness to sustain these behaviours over time
Here, the focus is on understanding the behaviour changes in the households, particularly during the energy crisis period of 2021-2023, correcting for the measures they already adopted before the energy crisis. Questions probe into behaviours such as temperature adjustments, changes in showering habits, reduction of appliance usage, and exploration of alternative heating sources. Additionally, we evaluate participants' perceptions of the impact of these actions on energy and cost savings, as well as their willingness to sustain these behaviours over time
S. Seebauer and A. Wolf, “Disentangling household and individual actors in explaining private electricity consumption,” Energy Efficiency, vol. 10, no. 1, pp. 1–20, Feb. 2017, doi: 10.1007/s12053-016-9435-x.
European Commission, “Playing my part. Key energy saving actions.” Accessed: Jan. 05, 2024. [Online]. Available: https://energy.ec.europa.eu/topics/markets-and-consumers/actions-and-measures-energy-prices/playing-my-part_en
M. A. Tovar Reaños, D. Meier, J. Curtis, and A. Pillai, “The role of energy, financial attitudes and environmental concerns on perceived retrofitting benefits and barriers: Evidence from Irish home owners,” Energy and Buildings, vol. 297, p. 113448, Oct. 2023, doi: 10.1016/j.enbuild.2023.113448.
Section 4 – Energy Efficiency Measures
This section investigates medium to long-term energy efficiency measures either adopted or planned by respondents during the energy crisis or within the upcoming 2-3 years, correcting for measures they implemented before the energy crisis occurred. Topics cover investments in energy-efficient appliances, insulation enhancements, heating and ventilation system upgrades, and the installation of monitoring systems. We assess perceived energy and cost savings resulting from these measures, as well as intentions to seek financial support for their implementation
This section investigates medium to long-term energy efficiency measures either adopted or planned by respondents during the energy crisis or within the upcoming 2-3 years, correcting for measures they implemented before the energy crisis occurred. Topics cover investments in energy-efficient appliances, insulation enhancements, heating and ventilation system upgrades, and the installation of monitoring systems. We assess perceived energy and cost savings resulting from these measures, as well as intentions to seek financial support for their implementation
G. Trotta, “The determinants of energy efficient retrofit investments in the English residential sector,” Energy Policy, vol. 120, pp. 175–182, Sep. 2018, doi: 10.1016/j.enpol.2018.05.024.
A. Schueftan, C. Aravena, and R. Reyes, “Financing energy efficiency retrofits in Chilean households: The role of financial instruments, savings and uncertainty in energy transition,” Resource and Energy Economics, vol. 66, p. 101265, Nov. 2021, doi: 10.1016/j.reseneeco.2021.101265.
Section 5 – Future Intentions
Lastly, we delve into participants' preferences regarding the implementation of medium to long-term energy efficiency measures and factors influencing their decisions. The Stated Preference (SP) method was used in the elaboration of this part of the questionnaire. This method is a well-established approach commonly employed in environmental assessment, transportation planning, and market research, which helps elucidate individuals' preferences, choices, and decision-making processes regarding specific attributes of goods, services, or policies. This method is based on the random utility maximisation, which assumes that a person chooses the option which gives them the greatest utility, where the utility is influenced by the attributes of the alternatives
Lastly, we delve into participants' preferences regarding the implementation of medium to long-term energy efficiency measures and factors influencing their decisions. The Stated Preference (SP) method was used in the elaboration of this part of the questionnaire. This method is a well-established approach commonly employed in environmental assessment, transportation planning, and market research, which helps elucidate individuals' preferences, choices, and decision-making processes regarding specific attributes of goods, services, or policies. This method is based on the random utility maximisation, which assumes that a person chooses the option which gives them the greatest utility, where the utility is influenced by the attributes of the alternatives
K. Train, “Discrete Choice Methods with Simulation.” Cambridge University Press, 2002. [Online]. Available: https://eml.berkeley.edu/books/train1201.pdf
There are different techniques to design SP questions, being the attribute-based stated choice is the most used in the last decades, given its advantages in relation the possibility to design the scenarios and choice alternatives, including hypothetical options, and the control for the choice sets to allow quantitative analyses statistically efficientV. Adamowicz and P. Boxall, “Future Directions of Stated Choice Methods for Environment Valuation,” Jan. 2001. . Th is methodology involves creating choice scenarios, each characterized by various alternatives, simultaneously each alternative consists of some attributes and different attribute levels. Respondents are then presented with these scenarios and asked to express their preferences by selecting their preferred alternative. Some of the challenges of this methodology, are the lack of realism in the choices, or high complexity, leading to great cognitive effort, fatigue, and thus bias choices
E. Cherchi and D. A. Hensher, “Workshop Synthesis: Stated Preference Surveys and Experimental Design, an Audit of the Journey so far and Future Research Perspectives,” Transportation Research Procedia, vol. 11, pp. 154–164, 2015, doi: 10.1016/j.trpro.2015.12.013.
The analysed medium-long term energy efficiency measures are:
- Install Energy-Efficient triple-glazed Windows
- Add Extra Insulation to External Walls
- Use Energy Monitoring System (EMS)
- Implement night temperature lowering system
- Install Balanced Ventilation System with Heat Recovery
The attributes considered for the selected measures are:
- Investment cost for implementing the energy efficiency measures.
- Energy Saving through the adoption of the measures.
- Investment Support to offset the initial expenses associated with implementing the energy efficiency measures.
For the attributes of energy savings and investment cost, assigning a precise value to each analysed measure that would be suitable for all Nordic countries is challenging. To address this, a nuanced approach was employed, using color-coded bars to denote low, medium, and high levels for energy savings and price related to each measure. These levels were derived from an extensive analysis conducted by NVE and Multiconsult
Multiconsult, “Kostnader for energieffektivisering i bygg [Costs for energy efficiency in buildings],” NVE external report No. 6/2021, 2021.
It is worth noting that the numbers (1-10) associated with colours for each attribute were not considered as absolute values. Instead, they were defined as relative to the other measures. This was achieved by normalizing all energy saving and investment cost values to the maximum value available for each of these two attributes across all measures.
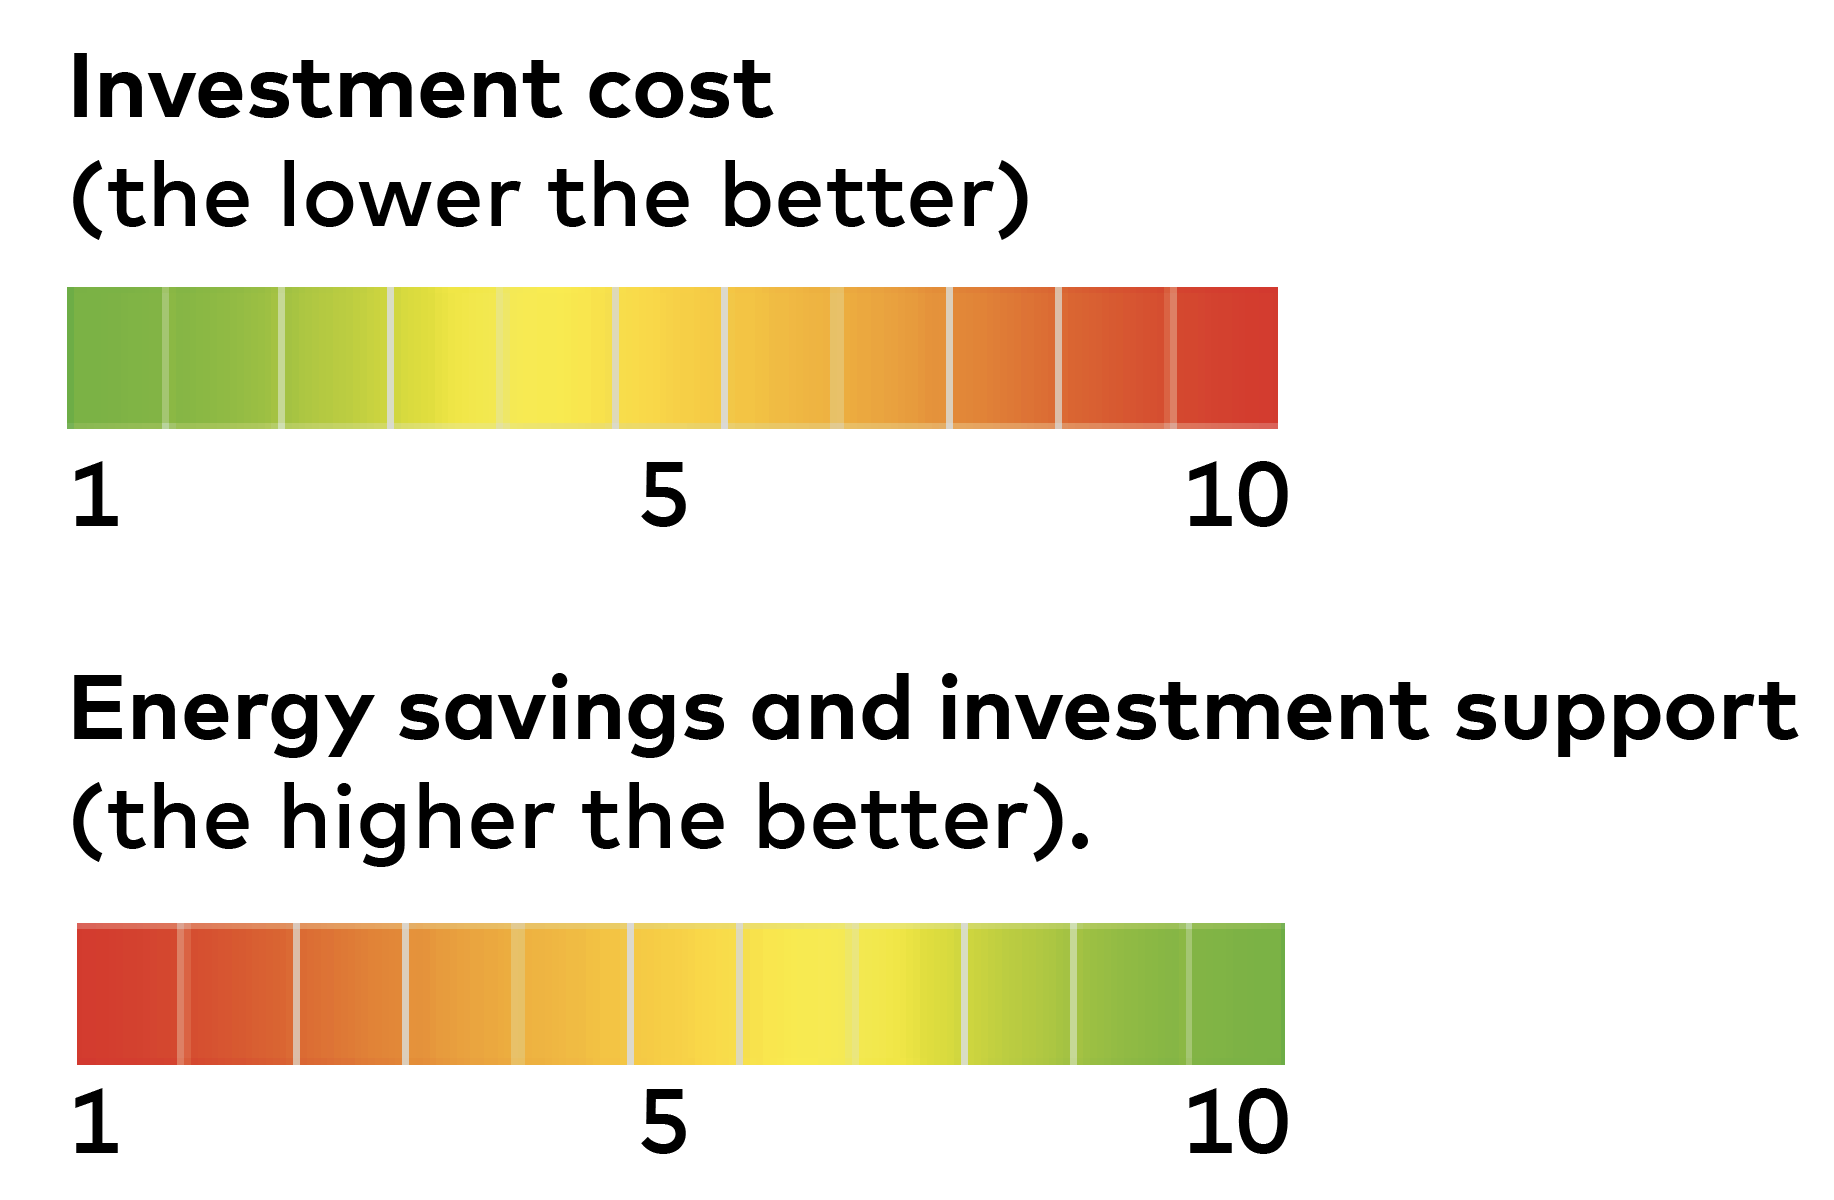
Figure 19. Color-coded bars used in the web-panel survey to denote attribute values for energy efficiency measures.
Finally, for the investment support attribute, three levels were considered with the following percentages: 0%, 15%, and 35%.
Each choice set was designed including two potential measures with different levels for the attributes, and a "do nothing’ alternative. This prevent respondents to select a random alternative if none of the alternatives is clearly preferred. There are several combinations of the measures, and levels for each attribute, following a D-efficient design, the combinations (choice sets) were reduced to eight, ensuring a D-error lower than 0.01. The software NGENE [300] was used to compute the efficient design, following a Federov algorithm to allow accounting for the selection of two out five measures and a "do nothing" alternative in each set. These choice sets were organized into blocks, each containing four sets, randomly presented to the respondents, in addition the sets in each block were also randomly presented to avoid bias due to order effects. The complete survey is provided in the Appendix.
9.2.3 Summary and discussion of findings
9.2.3.1 Behaviour and measures before, during and after the global energy crisis in 2021-2023
Examining behavioural patterns across different countries before, during, and after the energy crisis reveals notable trends. The results imply that the crisis impacted respondents in Nordic countries to varying degrees, influencing their awareness of energy consumption at different levels (Figure 20).
Figure 20. Differences between respondent is Nordic countries on whether energy crisis in 2021-2023 led to higher awareness of energy use.
Correspondingly, energy-saving behaviours also varied, reflecting differences in awareness and response across the countries. Households in Norway implemented acute measures during the energy crisis and respondents reported changes in their showering habits, shifting appliance usage to different hours, adjusting home temperatures, and slightly reducing appliance use. In Denmark, Finland, and Sweden, there was a significant shift in appliance use to off-peak hours with lower electricity prices, along with widespread temperature adjustments. These respondents also reported a slight reduction in appliance usage. In contrast, respondents in the Faroe Islands and Iceland exhibited minimal behavioural changes during the studied period. In addition to examining short-term energy-saving behaviours, we explored medium- to long-term energy efficiency measures adopted or planned by respondents. The findings indicate that during all phases—before, during, and after the energy crisis—respondents primarily focused on investing in energy-efficient appliances, often considered a straightforward and accessible measure. Looking ahead to the next two to three years, respondents show a growing interest in implementing energy monitoring systems and consulting energy experts to better manage their consumption over the long term.
Regarding energy-saving behaviours, most respondents expressed a willingness to continue their efforts despite perceiving the impact as small or moderate. This trend is illustrated in Figure 21.
Figure 21. Respondents perception of impacts for short-term energy saving behaviour and long-term energy saving measures.
Although respondents view the impact of long-term energy efficiency measures as significant, they do not plan to apply for investment support (Figure 22). Understanding the reasons behind this choice is crucial, as it may reveal how respondents in each country perceive and engage with support schemes for energy-saving initiatives. This insight could help tailor future programmes to better align with user expectations and needs.
Figure 22. Intention to apply for support to implement medium to long term measures.
More detailed information of the responses is provided in the Appendix.
9.2.3.2 Future intentions with stated preference analysis
In this stated preference (SP) survey, respondents were presented with options characterized by three key attributes: investment costs, energy savings, and investment support level. Based on their choices, the parameters associated with each attribute were estimated. The objective is to determine the relative importance of these attributes to respondents in different countries, among different age groups and education levels, offering insights into their future intentions to adopt energy-saving measures. A simple logit model, using the maximum likelihood method, was employed to estimate the parameters, as summarized in the table below. The sign of each parameter indicates its effect on the likelihood of an alternative being chosen: a positive sign suggests a positive impact, while a negative sign indicates the opposite. Statistical significance is denoted by stars, with two stars indicating 99% significance level and one star representing 95% significance level.
COST | Saving | Support | Alt_2 | ALT_3 | ALT_4 | ALT_5 | ||
Countries | Norway | -0.0004 | 0.0537** | 0.0123* | 0,34 | -0,03 | 0,12 | 0,49 |
Faroe | -0.0001 | 0.0649** | 0.0087 | 0.34 | -0.03 | 0.12 | 0.49 | |
Iceland | -0.0005** | 0.0639** | 0.0028 | 0.34 | -0.03 | 0.12 | 0.49* | |
Denmark | -0.0003** | 0.0698** | 0.0069 | -0.05 | -0.48* | -0.57* | -0.27 | |
Finland | -0.0003** | 0.0391** | 0.0015 | -0.67** | 1.65** | 1.41** | 1.6** | |
Sweden | -0.0003** | 0.0485** | 0.0091* | -0.09 | -0.56** | -0.65** | -0.19 | |
Age | 18-29 | -0.0004** | 0.0700** | 0.0047 | 0.34** | -0.01 | -0.02 | 0.25* |
30-49 | -0.0003** | 0.0556** | 0.0043* | 0.04 | -0.14* | -0.29** | 0.10* | |
50-69 | -0.0003** | 0.0144** | 0.0083** | -0.11 | -0.71 | -0.70** | -0.30** | |
Over 70 | -0.0003** | 0.0000 | 0.0043 | -0.27 | -1.24** | -1.04** | -0.80** | |
Education | Low | -0.0002* | 0.0254 | -0.0085 | 0.26 | -0.32* | -0.52** | -0.17 |
Middel | -0.0003** | 0.0354** | 0.0062** | -0.01 | -0.56** | -0.59** | -0.22** | |
High | -0.0003** | 0.0444* | 0.0046* | 0.03 | -0.45** | -0.43** | -0.11 | |
Country heterogeneity: The findings reveal that energy savings attribute is consistently important across all countries. In contrast, the investment support level significantly influences respondents’ choices only in Norway and Sweden. Meanwhile, the price attribute plays a statistically significant role in decision-making for respondents in Iceland, Denmark, Finland, and Sweden.
We also examine whether respondents exhibit a pre-existing preference for any alternative, regardless of its investment costs, energy savings, and investment support level. To capture this potential bias, fixed parameters were introduced into the model. These parameters reflect the respondents’ tendency to favor certain options independently of the attributes.
The results indicate that respondents in Finland and Sweden demonstrate such biases. In Finland, ‘Using an energy monitoring system’ is the preferred choice, while respondents in Sweden favour ‘Installing energy-efficient windows for the entire home’, regardless of variations in the defined attributes. This suggests that cultural or contextual factors may influence these inherent preferences.
Age group heterogeneity: Analysing the heterogeneity and variation in choices across age groups reveals that age groups between 30-49 years and 50-69 years old consider all three attributes when choosing an alternative. While the youngest age group, i.e. 18-29 years old put more weight on investment costs and the amount of energy saving, the importance of the factors among oldest age groups is not statistically significant; their decisions are more influenced by pre-existing preferences and perceptions of the alternatives.
Education level heterogeneity: Individuals with lower education levels appear less influenced by the specific attributes of alternatives, relying more on pre-existing preferences. In contrast, higher-educated groups consider all attributes, showing statistically significant responses influenced by their preferences. Understanding this discrepancy requires further investigation into factors such as housing type and annual energy costs, which may be lower for less-educated respondents. These contextual factors could explain their decision-making patterns.
The stated preference survey requires detailed analysis to identify the optimal policy set tailored to specific target groups. Enhancing the examination of heterogeneity is essential to uncover preferences within the defined main target group. While the current results offer a broad categorization of respondents, more nuanced sub-groups can be established to design policies that address the needs of a specific group.