Photos: iStock
Data on gender presence in fisheries, aquaculture and the blue economy
Having been tasked with focusing on gender statistics and the maritime sector (fisheries and aquaculture), we started out by defining areas in which gender-disaggregated data were available in each of the Nordic countries. The first round of data collection involved contacting the national statistical offices. In the case of Iceland and Finland, we liaised with special representatives for gender statistics in those organisations. In some other cases, we realised that responsibility for statistics on fisheries and aquatic-related employment, ownership etc. had been transferred from national statistical agencies to sectoral authorities (such as the fishery directorate in Norway, or the Swedish Agency for Marine and Water Management). In many cases, data on fisheries and aquaculture in national statistical accounts are primarily economical (export value, landing prices, FOB value etc.) or technical (volumes, vessel sizes), while the manpower aspect of the maritime sector in officially available statistics is either not available or non-existing, except in the case of the number of staff involved in harvesting or in fish processing.
We started by looking for data from 1990 and onwards, keeping in mind former recommendations that statistics should be comprehensive and reflect developments over time.
In this report we examine pan-Nordic gender statistics in the maritime sector. Gender distribution among fishers and staff in the primary production section of the maritime sector and aquaculture is known for most places and well researched. However there is a lack of available statistics in other parts of the economic sector (horizontal pattern) as manifested in individual parts of the value chain and the various dimensions of the maritime economy. There is furthermore no insight into how quotas are allocated (who is in charge – gender representation) or women’s presence at the top level of businesses (vertical pattern). The statistics we have referred to in order to provide an overview allowing for comparison between countries (using national statistics) are as follows: A) Gender distribution in fisheries (harvest) and the aquaculture sector in practice; B) Gender distribution in fisheries and aquaculture ownership; C) Gender distribution in related branches (land-based activities that base their existence on fisheries and aquaculture or are innovative spin-offs in the maritime economy/value chain); D) Gender distribution in secondary education, steersperson training in aquaculture and other vocational training, fishery technology etc. and E) Gender distribution in relevant higher education (veterinary, marine biology, fishery and aquaculture disciplines at universities).
The main challenge with respect to comparability of the available data across the Nordic Region is the difference in how disaggregated the data are. That is particularly pronounced for some of the statistics such as educational data. When it comes to vocational training and secondary education, we find fairly specific data that prove helpful, but it can be difficult to harmonise the data across the Nordic Region. When it comes to data on tertiary education, in some cases the data are highly aggregated and limited to degree courses within universities rather than disciplines allowing for a selection proving relevant to activities and employment in maritime professions. Some disciplines are more obviously relevant, such as degrees in marine biology, maritime engineering and maritime business, but in most cases it remains guesswork as to which graduates will go on to work in the blue bioeconomy, so the evidence needs to be supplemented to a high degree by qualitative evidence.
Regular global statistics on fisheries compiled by the Food and Agriculture Organization of the United Nations (FAO) from country information contain only sporadic information on gender participation, although the FAO (2003) referred to broadening the scope of statistics to include, among other things, social and economic information. In the FAO’s State of World Fisheries and Aquaculture reports, published biennially since 1996, Williams (2010) found that the word “women” appeared only 1, 2, 11, 3, 8, and 36 times in the years 1996, 1998, 2000, 2002, 2004, and 2006 respectively. The most recent report of World Fisheries and Aquaculture still largely omits gender issues, only mentioning women marginally and only containing statistics on the number of processors by gender from Denmark, Sweden and Finland in the period 2010-2019 (FAO, 2021).
In some cases, we have retrieved data from websites of organisations and companies on leadership on gender ratios among expert staff by counting (and thus our statistics is limited by what is available on the net), or presence in boards (by annual reports, companies, institutions, or public authorities websites).
Table 1. Available statistics on nordic gender representation in the blue economy – timeline.
FISHERIES, AQUACULTURE, FISH PROCESSING (practice) | FISHERIES, AQUACULTURE, FISH PROCESSING (ownership) | Related Branches Value Chain | Secondary Education | Relevant Higher Education | Access to decision-making | |
DK | 2008-2021 & 1994-2000 | NA | 2012-2020 (Shipping) | 2005-2022 | NA | 2023 |
GL | 2008-2020 | NA | NA | 2003-2022 2013-2022 | 2003-2022 2013-2022 | 2023 |
FO | 1985-2022, 1985-2022, 1985-2022 | ? | 1985-2021 (Shipping) 1985-2022 (wages) | 2008-2021 | NA | NA |
IS | 1991-2021 1991-2021 1991-2021 | 2005-2006 2011 2015 2017 | sporadic | 1995-2021 | 1995-2021 | 2004, 2017, 2021 |
NO | 1983-2019 1994-2021 2016-2022 | 2005 2023 | 1983-2019 (Age & county) | 2012-2022 | Fiskerihojskolen | 2022 sporadic |
SE | 2005-2018 2019-2020 2005-2013 | NA (highly aggregated) | Sporadic shipping | Yrkesgrupperegistret 2012-2018 | 2023 | |
FI | 2010-2020 | NA | Sea transport employees 2020 | 2004-2021 | Uni marine tech Uni fisheries | NA |
AX | 2021 | NA | 2020 | 2023 | 2023 | NA |
On a pan-Nordic level, we have retrieved data on the five Nordic countries; Norway, Iceland, Denmark, Sweden and Finland in relation to fishing, annual catches 2000-2021. Those data show volumes and relative importance of the fisheries in each country in this period but are not disaggregated by sex.
Figure 4. Fisheries volumes (tonnes) in the Nordic countries, 2000-2021.
Source: Nordic statistical database
Source: Nordic statistical database
Pan-Nordic statistics on gender ratio are also available for chief executives at the largest companies listed on the stock exchange, as well as an overview of executives in the period 2012-2022. Those statistics reveals inequal gender distribution when it comes to access to decision-making. As the following graphs show, the proportion of female CEOs in Norway has increased, especially since 2017, while the percentage of female CEOs in Iceland decreased from 2015 but increased in 2022 by 3%. The proportion of female CEOs in Finland peaked at 8% in 2018, but has been on the decrease. The proportion of female CEOs in Denmark increased from 2015/6 and has stabilised at 12% since 2021, while the proportion of female CEOs in Sweden was at its highest in 2016 and 2022 at 12% of Swedish CEOs.
Figure 5. Share of women as CEO´s largest listed companies in the Nordic countries, 2012-2022. Source: Nordic statistical database
Comparing the graphs, it is evident that men dominate when it comes to decision-making roles at the largest listed companies in the Nordic countries in this period.
Figure 6. Share of male CEOs at the largest listed companies in the Nordic countries, 2012-2022. Source: Nordic statistical database
Members of the executive team within a company can have a variety of titles. Key positions like managing director (MD) and chief executive officer (CEO) have distinct functions and ways in which they affect the direction and leadership of a business or company. An appreciation of the differences between these two senior roles is part of understanding company structure and how a business is run at a senior level and how CEOs affect the firm’s performance and daily approaches and decision-making (Quigley et al., 2021).
Figure 7. Share of women executives in the Nordic countries, 2012-2022. Source: Nordic statistical database
A variety of companies are involved in the seafood business, with some of the largest seafood organisations and aquaculture companies being publicly traded companies registered on the stock exchange. However, a substantial proportion of businesses are smaller, often being family-owned and private companies. This overview therefore provides an aggregated view of the directors and executives by gender in the Nordic countries, and specifically in the maritime sector. It can however form the basis for comparison when we take a closer look at the maritime sector.
Women accounted for around 15% of the total of 61,04 million people engaged in the primary sectors of capture fisheries and aquaculture worldwide (FAO, 2021). Comparatively, women across the Nordic Region accounted for 6-20% of the manpower involved in fishing and aquaculture in 2020, with womens ratio highest in Åland or 21% ((2021) ÅSUB, 2023). The three maps below show the proportion of women in both fishing and aquaculture in 2010, 2020 and the change in between 2010-2020 in seven Nordic countries.
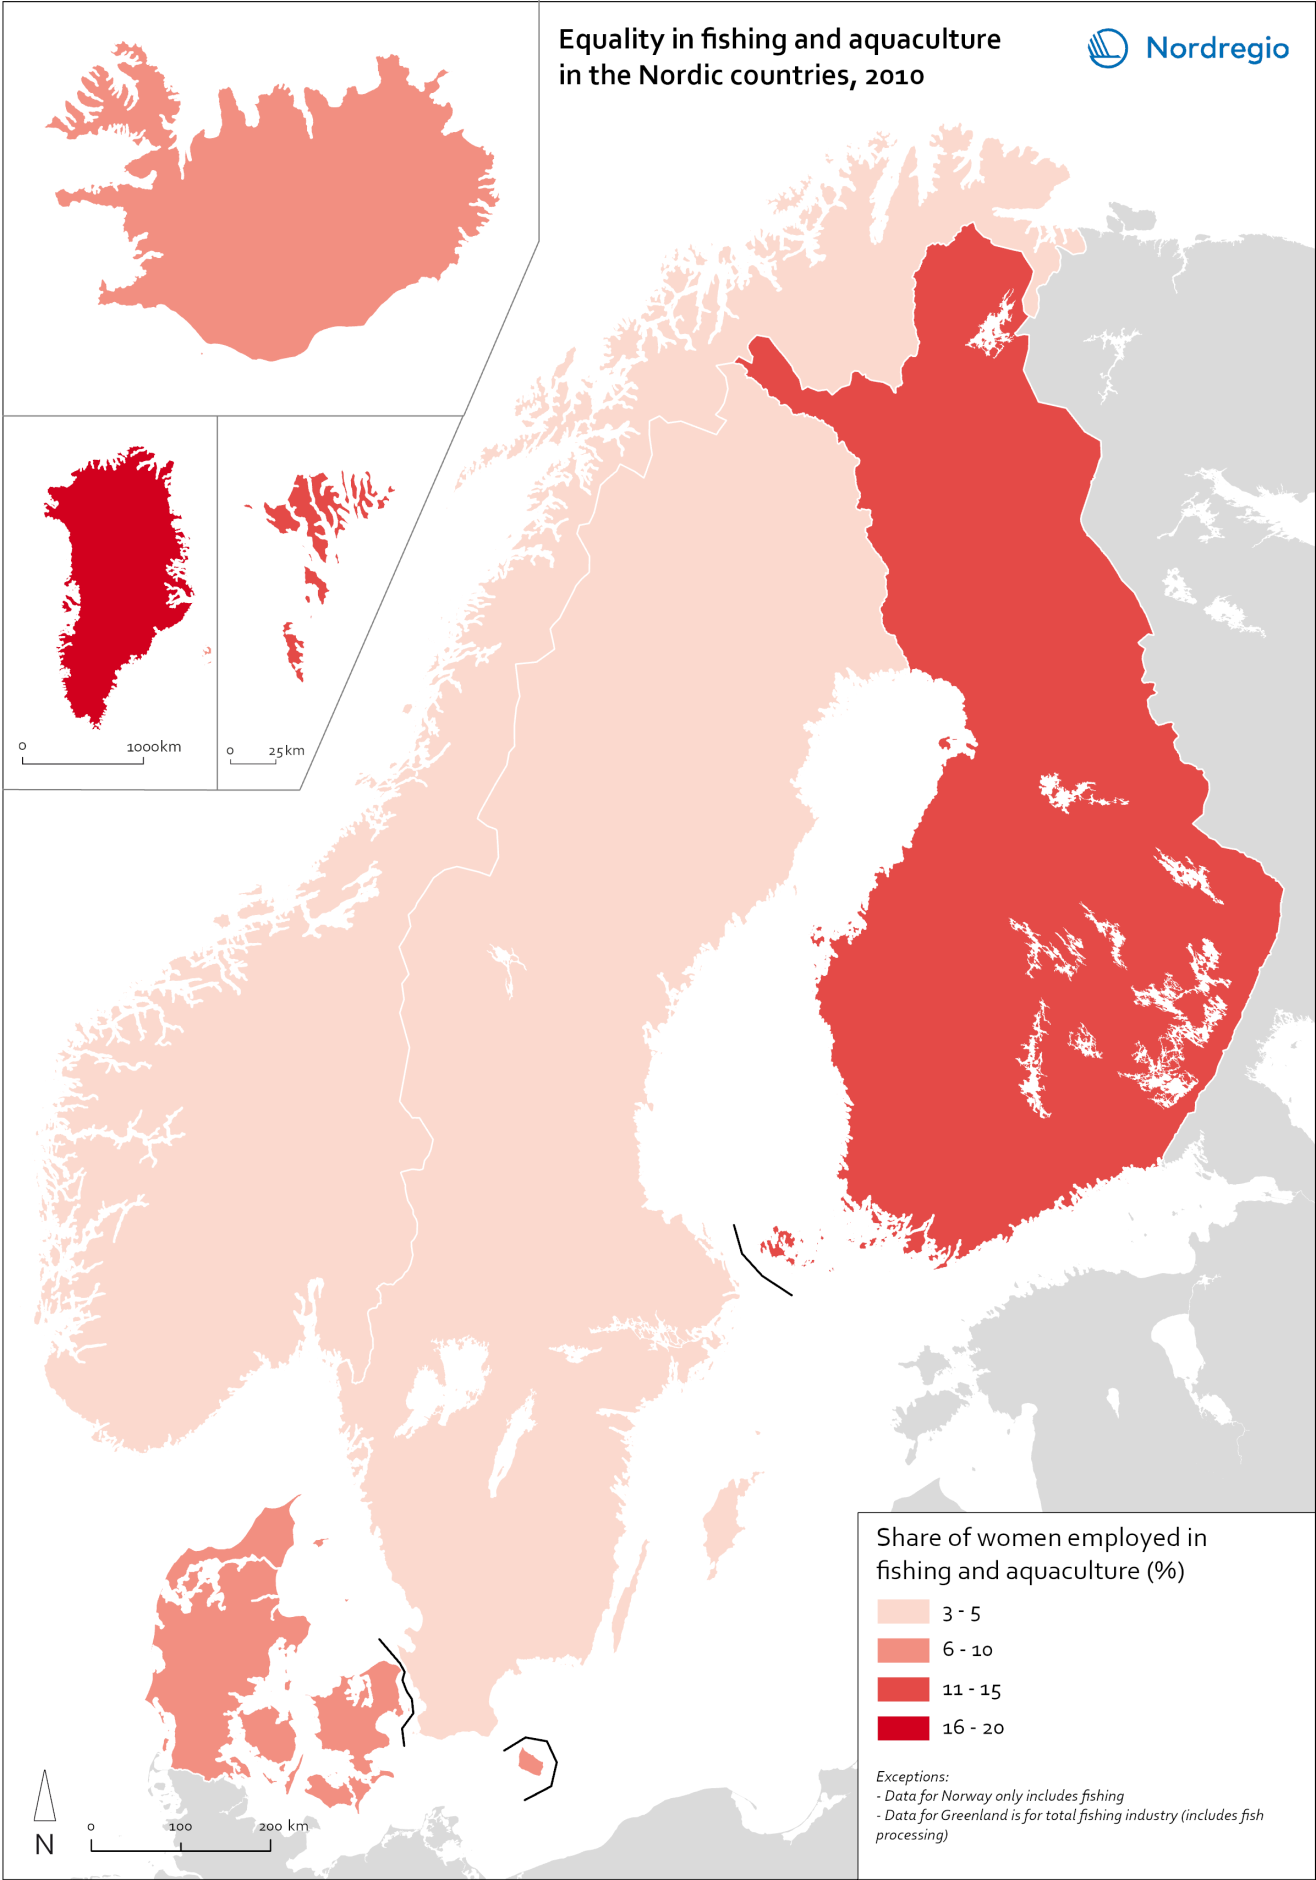
Figure 8. Proportion of women in various jobs in fishing and aquaculture, 2010.
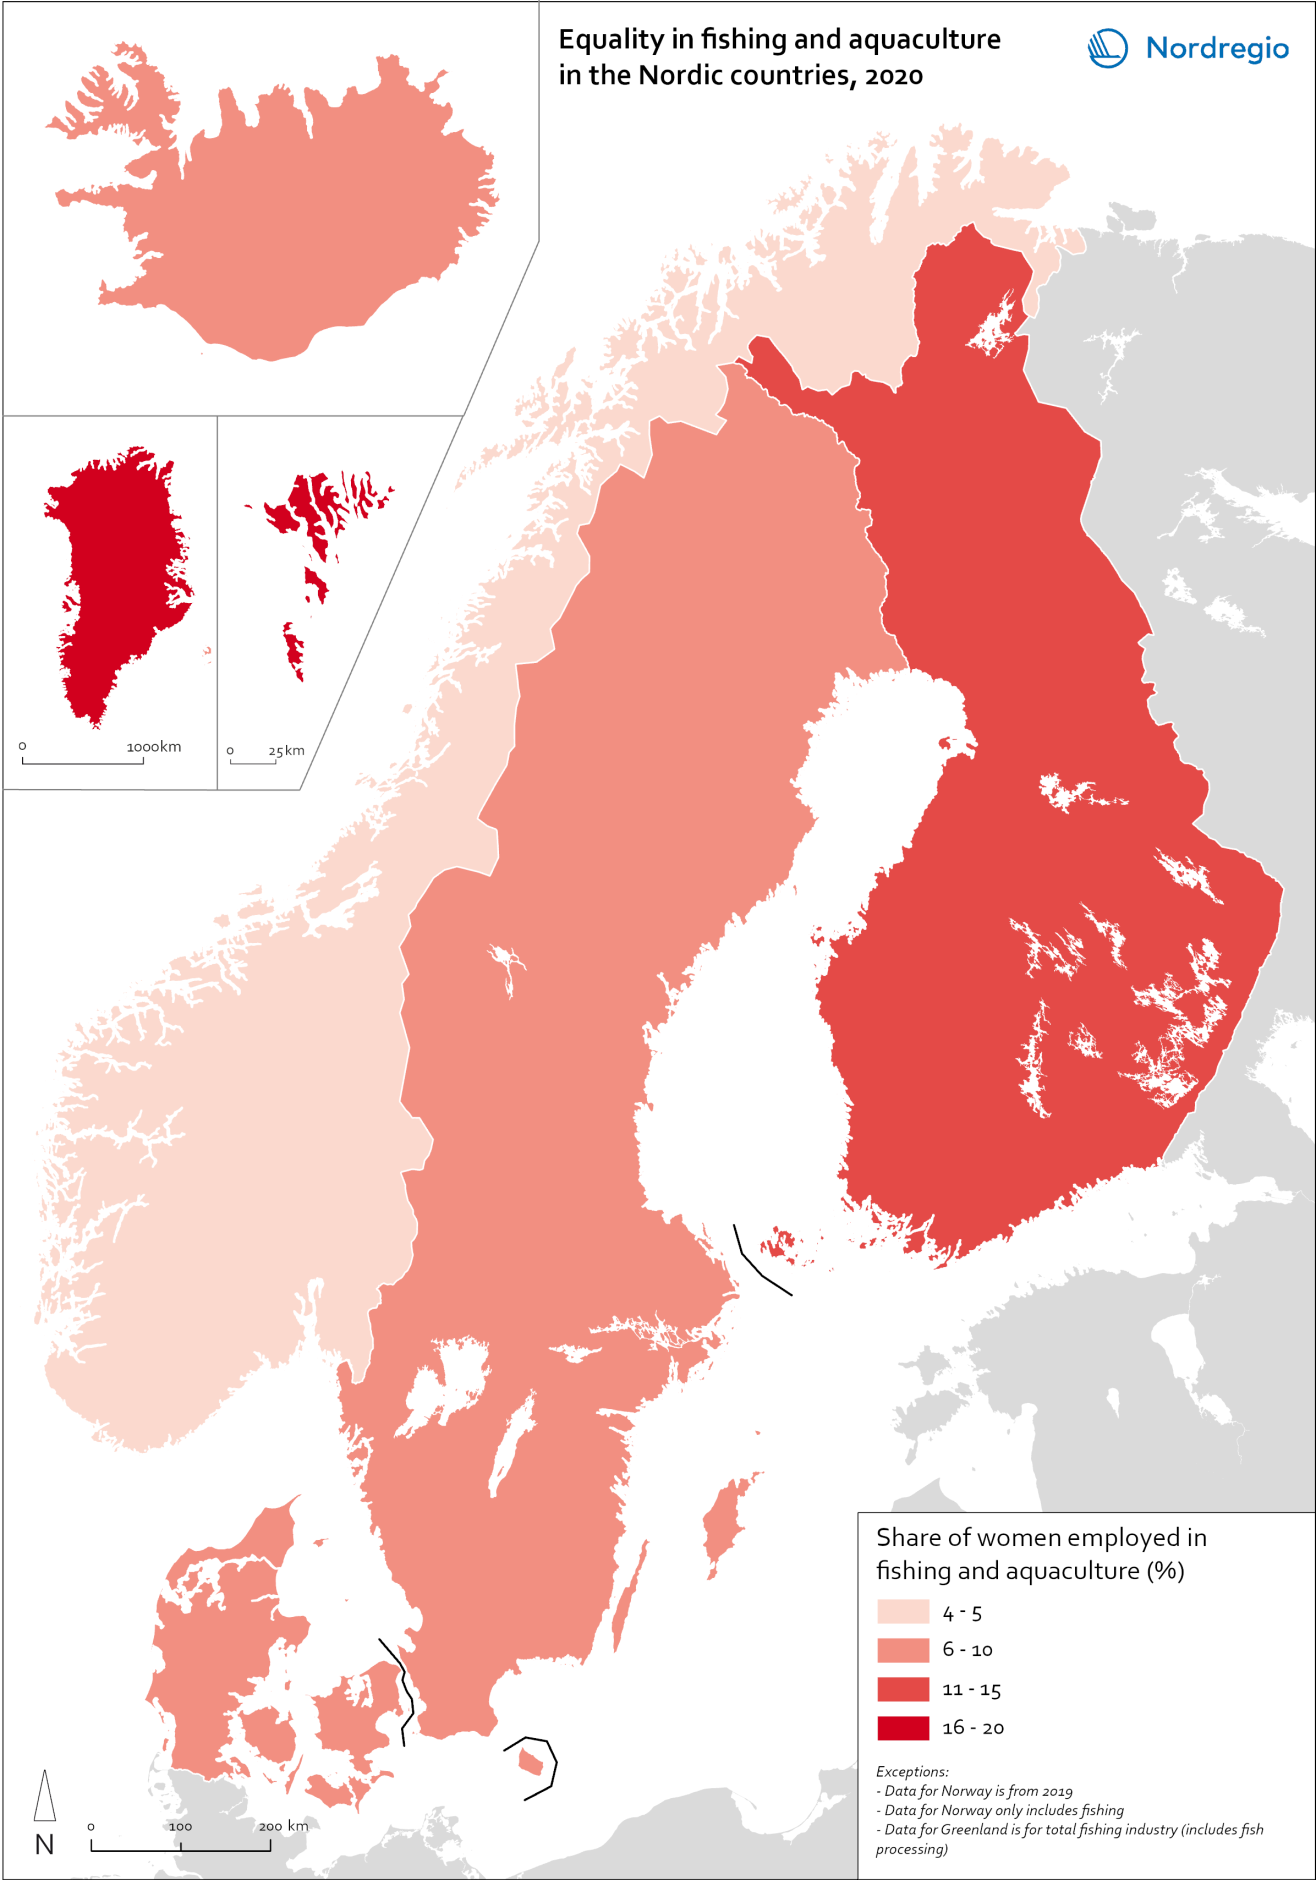
Figure 9. Proportion of women in various jobs in fishing and aquaculture, 2020.
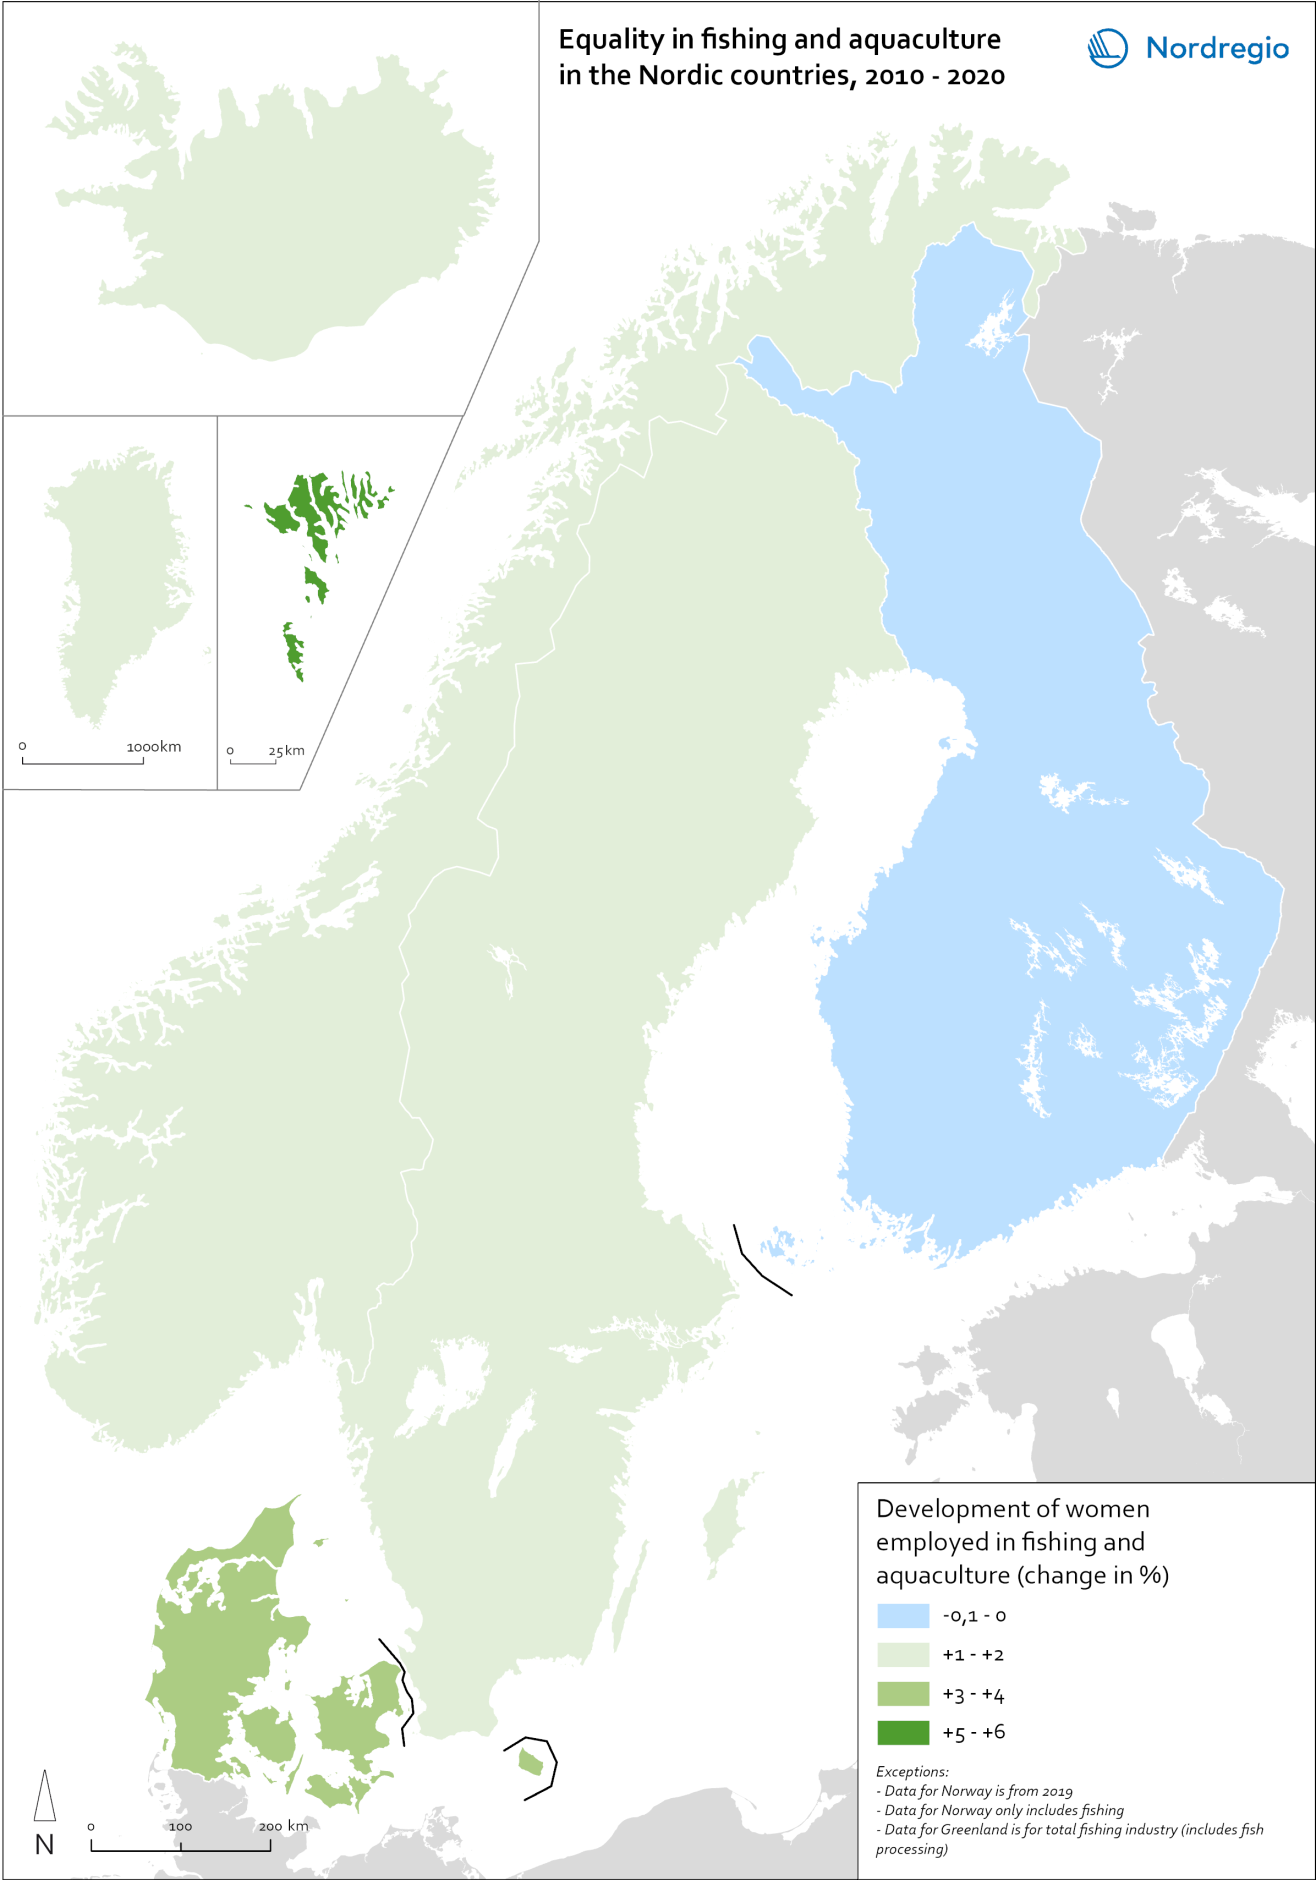
Figure 10. Proportion of women in various jobs in fishing and aquaculture, 2010-2020.
Over a decade the share of women as labour in fisheries and aquaculture has declined in Finland and Åland, and increased slightly in other Nordic countries. Mostly in Faroe Islands (+5-6%) and little less in Denmark (+3-4%).