Nordic Economic Policy Review 2023
National and EU climate policies in conflict: Lessons from three sectors in Finland
Matti Liski and Iivo Vehviläinen
Abstract
This article reviews and responds to policy frameworks across three sectors with the intention of efficiently reconciling national and EU climate-policy targets. The rationale behind national policies stems both from national policy ambitions and sector-specific commitments, but these may prove incompatible with broader EU policies such as the EU emissions trading system (EU ETS). Consequently, disparities between national and EU policies must, in turn, be adjusted accordingly, sector by sector. We show that reconciling differing policies does not necessarily rule out market-based instruments but that the efficient implementation of national targets can, in fact, build on and expand them.
Keywords: Emissions trading; transport; buildings and construction; electricity
1. Introduction
This article is informed by policy structures in three sectors: transport, buildings and construction, and electricity. From 2019–2022, the authors worked with the relevant ministries and advised on decision-making proposals related to carbon-neutrality targets. We have focused on market-based policy proposals and their impact on the implemented legislation and finally offer some suggestions as to how national policies can be efficiently integrated into EU policies.
Our key takeaway is that carefully defined national market-based mechanisms can, and sometimes even should, overlap with EU market mechanisms. These could take the form of a system based on either taxation or tradable emission rights or, as we outline in some of our proposals, a combination of the two.
The rationale behind national policies stems both from national policy ambitions and sector-specific commitments, but these may prove incompatible with broader EU policies such as the EU emissions trading system (EU ETS). National and EU policies must then be reconciled, sector by sector. We demonstrate that this alignment does not rule out market-based instruments but can build on them through the efficient implementation of national targets.
The transport sector forms the basis for our first case study, in which national emissions targets cannot be reached by relying solely on EU regulation. Incorporating the transport sector into the EU emissions trading system may prove efficient in terms of achieving the EU goals, but the plan contains no provision for national goals that may not be met when the EU has reached its target. In such a situation, member states could still resort to market-based solutions to achieve their national goals. We have developed a policy proposal in AEI (2019)
The report was prepared by Aalto University’s economics working group, consisting of Matti Liski, Oskari Nokso-Koivisto, Eero Nurmi and Iivo Vehviläinen.
The buildings and construction sector provides our second case study, illustrating a very different interdependence between national and EU regulations. Based on our AEI (2021) report
The report was prepared by Aalto University’s economics working group, consisting of Matti Liski, Oskari Nokso-Koivisto, and Iivo Vehviläinen.
Our final case study is the electricity sector, in which the starting point for policies has been EU-wide emissions trading, involving a common price for emissions from power generation. This policy, combined with the ‘energy only’ market for wholesale electricity, is a concept that has guided decarbonisation investments and planning in Finland as part of the Nordic and European markets for electricity. We have witnessed a European trend that has, in part, reversed the idea of the common price for energy and emissions: through the adoption of additional policy tools, member states have implemented national targets for renewables and other carbon-free technologies. Essentially, the capacity portfolios are based on and follow national ambitions and needs. We discuss how this development manifests itself in Finland and in the Nordic Region, and we extrapolate future a development in which there are separate markets for capacity and wholesale electricity. In the greater scheme of things, EU emissions trading may become an aggregate backstop instrument for aggregate emissions reductions that will no longer be binding should national ambitions and results supersede the set (EU) targets.
The policy conclusions for the electricity sector concur with those of the other two sectors: The emergence of national goals and their implementation does not spell an end to the use of markets for attaining those goals. National capacity portfolios can be efficiently realised by using market-based capacity mechanisms. The EU-level energy-only market and emissions trading are still important elements for allocative efficiency.
We focus specifically on market mechanisms to emphasise their usefulness in implementing national policies as part of a larger policy design. However, almost by definition, distributional goals and policies for their implementation occur at a national level. We supplement our transport sector case study by illustrating the distributional burden of carbon prices across income groups in Finland by using detailed micro data on vehicles, kilometres driven and individuals’ socioeconomic variables. We also describe some rebate schemes introduced to alleviate the cost burden on low-income groups. This description builds on our report to the Ministry of Transport and Communications (AEI, 2020).
The report was prepared by Aalto University’s economics working group, consisting of Arttu Ahonen, Matti Liski, Oskari Nokso-Koivisto, Eero Nurmi and Iivo Vehviläinen.
In our concluding remarks, we focus on efficiency and competitiveness. The policy designs suggested in this article are intended to improve allocative, and sometimes distributional, efficiency, which can help the economy grow and improve ‘competitiveness’ in a broader sense. We conclude by pointing out the need for fundamental regulatory reform of the basic energy infrastructure (the electricity networks, which can best be described as one of society’s most important infrastructures). This role will become even more prominent as society becomes increasingly electrified and transitions to a carbon-neutral future. What is the most efficient way to organise monopoly regulation for the energy transition and relevant sectors? As will be revealed, the answer to this question calls for a fundamental reform of the current policies.
2. Transport
2.1 Background
The EU requires Finland to reduce its greenhouse gas emissions by 50% in the designated burden-sharing sector by 2030, compared to the 1990 level. The burden-sharing sector includes emissions from transport, agriculture, heating, and waste management, among other areas. According to the Finnish government’s programme, the medium-term climate plan and the national climate and energy strategy will be updated to achieve these emission reductions. The measures are evaluated from the point of view of efficacy and cost-efficiency, taking regional differences and employment effects into account.
This burden-sharing target is binding. Traffic is responsible for 40% of the burden-sharing sectors’ emissions and 20% of Finland’s greenhouse emissions. The government programme commits to halving traffic emissions by 2030 and concludes that the greatest potential for reducing greenhouse gases lies in the emissions from road traffic. The government’s stated goal is consistent with the mid-term climate policy plan published in 2017. With the implementation of the 2030 goal, Finland intends to be carbon neutral by 2035. This will lead to heavy pressure to reduce traffic emissions.
Emissions from traffic can be understood as the combined effect of three factors. Total emissions depend on the number of kilometres driven, the energy efficiency of the means of transport, and the carbon content of the fuel used per energy unit. Traffic emissions can be reduced by influencing one or all these factors. Emissions caused by vehicles are not evenly distributed. In 2016, for which we have comprehensive vehicle microdata, over 6,000 kilotons of CO2 emissions were accumulated from almost three million vehicles in private use, half of which was produced by the group of approximately 750,000 most polluting vehicles (see Figure 1).
AVERO data from the Government research unit includes vehicles subject to vehicle tax used privately in Finland in 2016 and the people who used them. For about 75% of the vehicles, the 2016 mileage has been obtained directly from readings during inspections, while for 9%, data from the previous or following years has been used. For the remaining 16%, the kilometres driven have been estimated using statistical reasoning. The emissions by vehicle are calculated by using the model-specific emission rates.
Figure 1. Cumulative emissions of the private car stock in 2016
The total emissions produced by the fleet can be divided into sections according to the age groups of the cars. Figure 2 shows how emissions in each age group depend on the number of cars, their use, and their technology. Average emissions increase with age as a function of these factors, reaching their peak just before the tenth year of the cars’ lifetime. Although the emissions per kilometre of older cars (over 20 years old) are higher than those of new ones, their average annual emissions are lower because they are driven less.
Based on Figures 1–2, the mid-term target cannot be reached by incentivising carbon-neutral choices in the new car market, and in addition, the government is forced to severely reduce emissions from the old car fleet.
In the AEI report of 2019 (AEI, 2019), we evaluated different regulatory measures that can be implemented at national level to achieve broad emission reduction goals within the transport sector. In addition to a more general description of the instruments available, the report presented a model by which emission reductions could be achieved in a cost-effective and predictable manner. This model would ensure the achievement of emission reduction in accordance with the agreed commitments while guaranteeing consumers and companies the widest range of opportunities to adapt to the changes effected by these emission targets.
The main features of the proposal include:
- A licensing scheme for fuel sales in Finland to reduce all road traffic emissions by 50% by 2030. The scheme would set quotas for the carbon content of fuels.
- This quota system has several important advantages compared to non-market instruments for reducing emissions. It is a cost-effective way to achieve emission reduction goals. In addition, the system makes it certain that the goal will be reached, as the quotas can be set at the desired level. The quota system would enable consumers and companies to adapt flexibly to emission reductions and can be practically implemented through regular auctions. It can also be modified to account for any economic uncertainty caused by fuel price fluctuations through the application of both a price floor and a ceiling.
Figure 2. Emissions analysis of the private car stock
2.2 Justification for the Proposal
National targets: The emission reduction targets for the transport sector represent Finland’s national target. The emission reduction methods employed must be initiated at a national (not EU) level if the governmental control in achieving these goals is the desired outcome. The proposed solution is, therefore, a specific tailormade solution for the Finnish conditions.
Technology frontier: Finland is unable to directly influence which transport sector technology will become globally dominant. New vehicle technology is determined exogenously. For example, in the Finnish context, subsidies for the purchase of electric cars cannot be justified by domestic technological developments in the country. Should a specific technology become internationally dominant, it may become necessary to enhance local networks, for example, by investing in distribution networks or by subsidies to promote the spread of the technology (see, e.g., Springel, 2021). If, on the other hand, there are ongoing uncertainties surrounding a given technology, one may end up supporting the ‘wrong breakthrough’ technology. The national quota system ensures flexibility in making cost-efficient choices on the technology frontier, or, more precisely, these choices will be delegated to the market.
Public funding: The limited nature of public funding must be considered when planning emission-reduction measures. Financial subsidies are likely to prove an expensive way of achieving the emission reduction goal and provide no certainty of reaching it. In contrast, the quota system generates revenues for the public budget that can be used to reach the general public sector spending objectives, including dealing with distributional objectives that may be affected by the zero-emission targets in the transport sector.
Multiple adjustment channels: Consumers and companies have different ways of tackling change in the regulatory environment. Measures adapting to traffic-reducing emissions policy could include some of the following:
- Changing place of residence (e.g., location in relation to the workplace)
- Changing place of work
- Changing mode of transport (e.g., private car, train, bicycle, etc.)
- Changing vehicle to a less energy-consuming model
- Combining trips and increasing vehicle utilisation levels (e.g., ridesharing)
- Reducing driving
- Organisation of work (e.g., remote work, video conferencing)
- Adapting leisure activities
- Changing energy carrier (e.g., petrol/diesel, biogas, electricity)
Technology standards, subsidies for certain technologies and scrappage programmes only target the last adjustment channel listed above
Cash for Clunkers programmes can lead to costly emissions reductions. See, e.g., Hoekstra et al., 2017
Comparison to tax instruments: The price signal can be achieved in two ways; through a carbon tax, which defines a certain price level for carbon content, and through a fuel quota system, which would define the total limit for emissions
In 2016 carbon tax was ca. 16.25 eurocents/litre.
We argue that the need to reach the quantity target justifies using the quota system as a basis for our proposal. However, it is possible to combine elements in the permit system that would take the uncertainty of future permit prices into account. This could be achieved by creating a price collar within the system, in which the price of permits could vary. This would prevent the permit price and the associated costs of emission reductions for society from becoming unreasonably high. In practice, this would combine quantity regulation with price regulation. In essence, the government would announce a price floor, at which retailers can sell quotas back to the government, and a price ceiling, at which the government will sell additional quotas. This price collar could, however, create some uncertainty about how the system will reach the government’s goals for emissions reductions.
2.3 Details of the proposal
Finland’s goal is to significantly reduce traffic emissions in a timely manner. To facilitate this, the policy should be aimed directly at emissions. The price should, therefore, directly target the source of the emissions, i.e., the carbon content of fuel.
When aiming for emission reductions, it is not worth setting a price on elements such as driving performance, traffic, or the technology used to travel. These choices are best left to private actors, as they are probably the most aware of the most effective way to reduce fossil fuel use in any given situation. This ensures the cost effectiveness outlined above. In addition, what can be considered the most effective method may change over time, depending on how different technologies evolve.
The strength of the quota system lies in predictability in terms of emissions, as the number of emission permits traded within the quota system can be set to any desired level. One mechanism for creating a quota system that fulfils the emission reduction goal would be the introduction of a system of fuel-sales licenses, under which the distributor buys a license from the state for each litre of fuel sold, tied to the carbon content of the fuel. The permit system should target distributors to ensure the price signal reaches all end users.
The permit system would be relatively easy to implement under current Finnish conditions: other industries covered by emissions trading already face similar regulatory environments. The permit system would undoubtedly reach the goal if the number of permits was to decrease over time and the number available was tied specifically to that goal. There is plenty of international experience available regarding the issuing and selling of permits through regular auctions, for example, EU emission trading. When planning auction arrangements, it is essential to ensure sufficient competition, for example, by organising auctions at regular intervals to ensure the continuous availability of permits so that the market share owned by a single operator does not grow too large.
The key benefit of the permit system is cost efficiency. It puts a price on the input causing the problem, which in this case is the carbon content of fossil fuel. The idea is that the emission reduction goal converts to price signals faced by consumers and producers, which in turn guides their behaviour in each situation. A particularly positive aspect of the mechanism is that while it guides and encourages each company and consumer to adopt their own best solution, it also directs the reduction of consumption to those actors who can achieve it at the lowest cost.
The permit system makes it possible to achieve the reduction goal flexibly so that the financial burden is evenly distributed over different years. This can be achieved by issuing permits generously in the early years of the programme and allowing the market to decide how many permits will be used now and how many will be saved for the future.
For the sales license system to work effectively, no changes to the current vehicle or fuel taxation or the mandatory distribution of biofuels would be required. If the rest of the regulation were kept in place in its current form, the quota system would act as a backstop and ensure that the goals can be achieved. The price of a fuel-sales permit would equal the difference between the price determined by the quota level of the sales-permit system and the price implied by current regulations.
The two scenarios described below illustrate this point. In Scenario 1, the price of the quota system falls below the price implied by the current regulation, so the price of permits becomes zero. Conversely, this would also mean that traffic emissions would decrease by more than the 50% target by 2030.
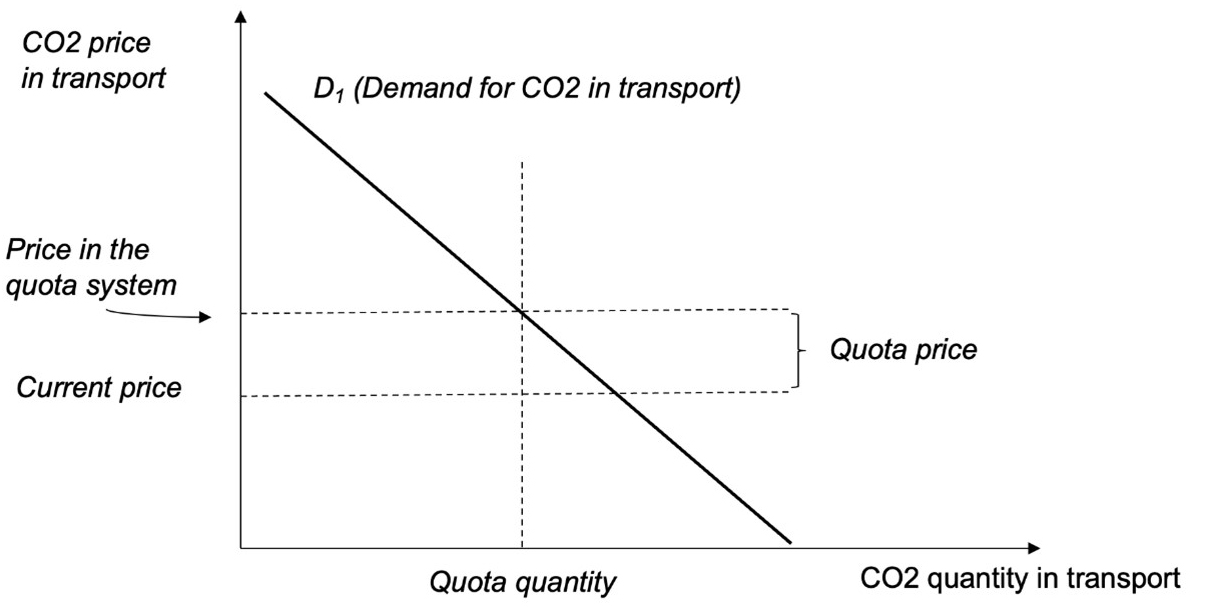
In Scenario 2, the price of the quota system is higher than the price of emissions according to the current regulation. The price of the sales license is then the difference between the two. In this scenario, the emission-reduction goals would not be met without the introduction of the quota system.
Figure 3. Scenario 1: Quota prices below current CO2 price
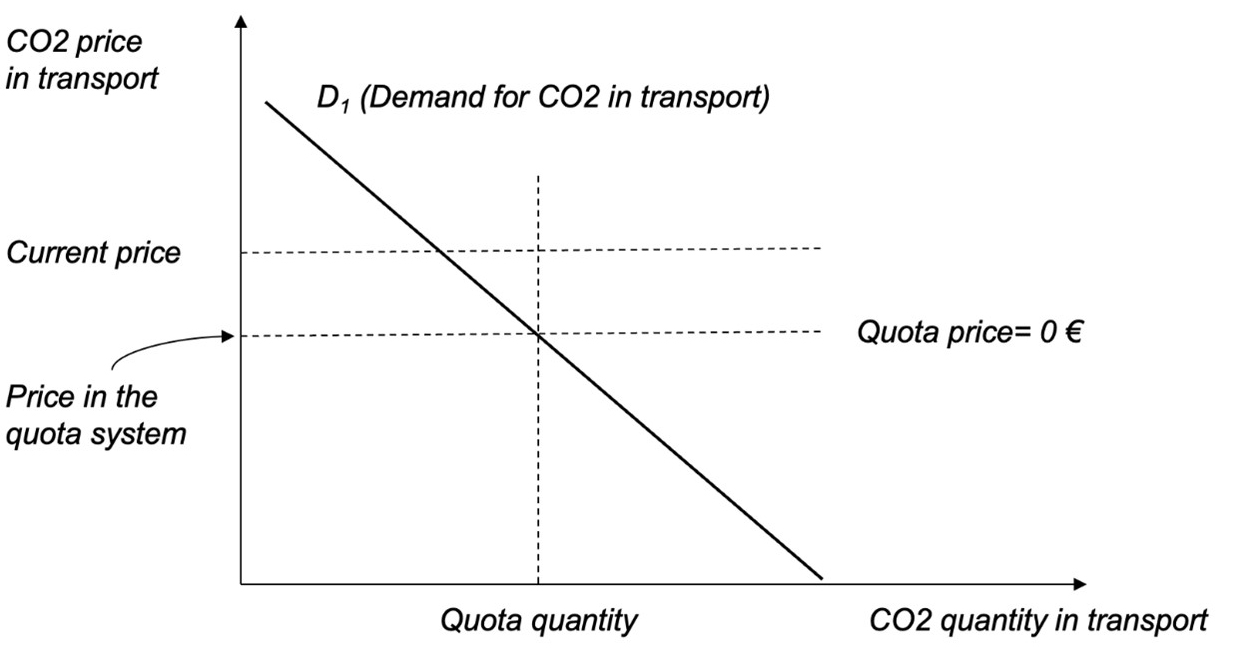
Figure 4. Scenario 2: Quota price exceeds current CO2 price
2.4 Conflict of National vs EU-level policies: Lessons from the transport sector
National road transport emissions trading is a feasible alternative regardless of EU trade in them.
The justification is simple: The goals of the transport sector are binding, and Finland does not have the option to use the EU emissions-trading system to reach national goals. Trading in the EU means that the Finnish transport sector can increase emissions without restrictions through the import of emission permits, and there is no automatic mechanism built into the system to ensure that the national goals are reached. Relying solely on an EU programme would lead to a situation where, in addition to EU emissions trading, the transport sector would have to be controlled through varied and undoubtedly economically expensive means (e.g., scrapping payments, purchase subsidies, outright bans, etc.).
National emissions trading ensures the emissions reduction goal will be reached in a predictable and cost-effective way. It is administratively inexpensive because it displaces other control measures while generating income for the state. Finally, it can be directly linked to the EU emissions trading regime should a different or expanded EU mandate be introduced at a later date.
To elaborate on this last point, we will explain how a national target could be maintained while remaining fully linked to EU-level emissions trading. It must be borne in mind, however, that the starting point for planning should be the national emissions target, not so much the linking to the EU emissions trading system: The target sends a clear message about the number of permits in circulation in Finland during the target period (e.g., by 2030 in which the emissions should be 50% lower). This means a commitment to an implementation method such that the effect of the EU’s emissions trading on the number of permits in Finland is neutralised. How could this neutralisation be achieved in practice?
If a national system is set up in Finland and there is no EU equivalent, then the number of permits to be used in Finland would be obvious. If, however, an EU system is created for transport, the number of permits in Finland will still correspond to the country’s target if a two-price system is created for emission permits as follows. Permits put into circulation in Finland will be openly available at the market price. However, imported transport emission rights will require an import permit issued by the emissions trading authority monitoring Finland’s emissions target. A market price for the import permits will be formed, which is higher the greater the gap between the country’s realised emissions and its targets. The price of import permits will drop to zero if Finland reaches its goal directly as part of the EU’s emissions trading system.
As we can see, implementing a national system within the framework of the EU system is possible. In this case, the EU system would indicate a market-level price signal. To protect the economy from price spikes, a ceiling price could be set for import permits. The number of permits available would therefore enable and be tied to achievement of the annual target.
3. Buildings and Construction
The policy proposals related to emissions from the buildings and construction sector paint a very different picture than that of transport: The impact of existing EU-level emissions regulations should be identified, isolated, and carefully utilised when designing domestic market-based regulations for this sector.
3.1 Background
Emissions from the real-estate sector can be divided into three time-based elements: the construction phase, the use of the building, and its demolition. When developing regulations, it is also important to ascertain what kind of regulations are already in place for each emission source, where these occur and how to measure them.
Construction phase emissions can be roughly divided into those from building materials and the energy used in construction (e.g., electricity and fuels).
Building materials are subject to separate EU-level emissions regulations. It is worth noting that uncertainty exists in relation to building materials’ emissions and the calculation methods used. For example, regarding the life-cycle emissions of wood vs concrete, different conclusions can be reached depending on how the wood is used (cf. the carbon sink debate).
Energy use during construction, including both electricity and fossil fuels, is subject to existing emission regulations that are independent of policies for the construction sector. The same is true of embodied emissions during a building’s use: Most of these, primarily relating to electricity and heating, are covered by other existing emission-control policies.
Energy production is almost exclusively covered by the EU emissions trading system. Emissions trading creates a price signal that is transmitted to the prices of end products such as housing. In addition, national initiatives have already been put in place to ban the use of coal in energy production, and preparations are underway to end the use of peat. These measures are also reflected in the energy prices paid by consumers.
The demolition phase is primarily linked to the recycling of building materials, the quality of that recycling or the extent of their disposal. Waste legislation is the key regulatory instrument that addresses the external effects of the demolition phase.
3.2 Life-cycle regulation
Finland is currently preparing a renewal of the buildings and construction regulation; we have placed the regulation in preparation under the heading “life-cycle regulation”, in which the expected lifetime emissions of each building covered by the regulation must be below the limit value in use at the time of construction. Life-cycle emissions include emissions from the manufacture of building materials, emissions from construction, some embodied emissions during use, and emissions incurred at the end of the building’s life-cycle.
Emissions that result from the construction phase would be determined by the life-cycle estimates of the building materials involved and the emissions from energy use. Emissions during the in-use phase would be calculated using a formula that combines engineering estimates of the building’s energy use with administratively decided projections of the length of the building’s life cycle and predicted energy production emissions.
The current proposal for regulation is problematic from the point of view of efficiently reducing emissions because the proposal is based on:
- Administratively decided assumptions regarding the length of the regulated building’s life-cycle assessment period.
- Administratively decided assumptions about future emissions in energy production.
- Evaluation of the technical functionality of heating and insulation technologies.
If the administratively set emission factor for future energy use is too high, more materials might be used in the construction phase to reduce energy consumption than would be efficient. This could take the form of the use of excessive insulation leading to inefficient high emissions from the production of raw materials, for example. On the other hand, if the administrative emission factor is too low, it could make the building a greater source of emissions than the target level. Similar considerations hold true for the life-cycle decisions and the engineering estimates.
Reducing life-cycle emissions is cheaper in some locations than in others. Under the current plan, all locations are compelled to remain below the same threshold. In terms of emissions, however, the same results could be achieved at a lower cost if emissions were reduced in an environment where it is cheaper to reduce life-cycle emissions than in a location where it is demonstrably more expensive.
From the point of view of construction, there is remarkably little or no empirical evidence on the costs of reducing emissions. Although developers have the most detailed information about of the costs, obtaining this information through surveys is difficult due to the conflicts of interest inherent in sharing this data.
3.3 Alternative proposal: a market-based mechanism
We have proposed in AEI (2021) a national emission-rights system for building materials:
- The builder should acquire a number of emission rights corresponding to the carbon emissions of the building materials from a public auction or secondary market before the building is taken into use.
- Acquired rights and documentation of verified construction material emissions should be presented to the local authority at the time of the final inspection of the building. Submission of rights and documentation of emissions from construction materials would be a prerequisite for final approval and commissioning of the building.
The system that we have proposed would create a backstop for emission cuts that can be implemented in conjunction with current or upcoming regulations. This implementation would be based on the same database as the alternative or existing regulation.
This means that emissions cuts would be targeted more effectively than in the current regulatory proposals, which do not take into consideration builders’ knowledge and experience regarding the most efficient ways to reduce emissions. Choices available include materials, building designs, the amount of total construction, energy efficiency, and the use of new technologies. Although the system achieves emission reductions, it also leaves these decisions in the hands of private operators. The system’s price also signals direct consumption reduction to those actors who can achieve this at the lowest cost.
National emissions regulation can increase emissions in another sector or outside the country’s borders. This leakage can be prevented by acquiring or cancelling emission permits from emission markets where an overlap occurs.
3.4 Details of the proposal
The design of the market mechanism is based on the following goals: (i) reducing the CO2 emissions from construction, building use and demolition as efficiently as possible (lowest cost/emission unit); (ii) preventing the leakage of emissions to other sectors or areas. The market mechanism imposes a price on emissions from materials, although this could also be achieved by imposing a corresponding tax on emissions. As for the transport sector, if the policy objective is stated in terms of quantity reductions, a system of tradable permits will certainly achieve the quantity target.
The regulation of emissions should target materials because, during the time the building is in use, emissions from electricity and heat production are already under specific regulations. For this reason, including these in construction sector regulation is unnecessary. Likewise, energy-related emissions in the construction phase will fall under energy-sector regulation. In the case of demolition, it is important that, for example, the external effects of construction waste are priced correctly, and that possible market deficiencies in the demolition waste market can be corrected.
Given these parameters, national regulation of emissions from building materials would constitute a reasonable target for policy intervention. Figure 5 outlines the proposal, the steps of which are detailed below.
Figure 5. Proposed National emission-rigth system for building materials
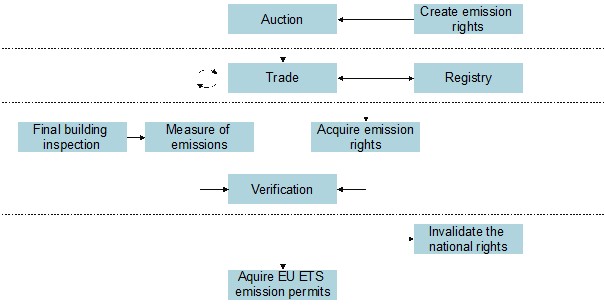
Creation of emission rights: The state creates a number of emission rights that corresponds to the emission targets set for building materials.
Auction and trading of emission rights: The state sells the emission rights it creates in regular auctions held, for example, once a month. These can be traded.
Measuring of emissions: The manner and stage at which generated emissions are measured lies at the heart of any emission regulation. A natural emissions control checkpoint could be part of the building permit process, for example, as part of the final inspection. At this stage, the developer must be able to demonstrate the emissions embedded in the building materials. Emissions can be measured using the same mechanism as the planned life-cycle regulation.
Acquisition and verification of emission rights: The developer acquires the number of emission rights corresponding to the greenhouse gas emissions of the building’s construction materials from the market and presents the emissions tally from the building materials and the corresponding emission permits to the national authority, which invalidates the emission permits.
Acquisition and cancellation of EU ETS emission permits: Since manufacturing of some building materials, for example cement, are subject to EU wide market-based emissions regulation, it is important to ensure that the reduction of emissions according to the national mechanism does not increase emissions in another sector or outside the country’s borders. This can be prevented by acquiring and cancelling permits from EU ETS where an overlap occurs.
3.5 Conflict of National vs EU policies: Lessons from buildings and construction
The above proposal demonstrates how the effects of EU-level policies should be isolated when designing domestic policies to avoid creating overlapping regulations. Nevertheless, national policy ambitions can motivate a market-based intervention that effectively puts a price on national aspirations and fulfils them in a cost-effective way. Next, we will elaborate on the link between EU emissions trading, national objectives, and the proposed mechanism
See Böhringer and Fischer (2020) for an analysis of various instruments to prevent leakage within a trading system.
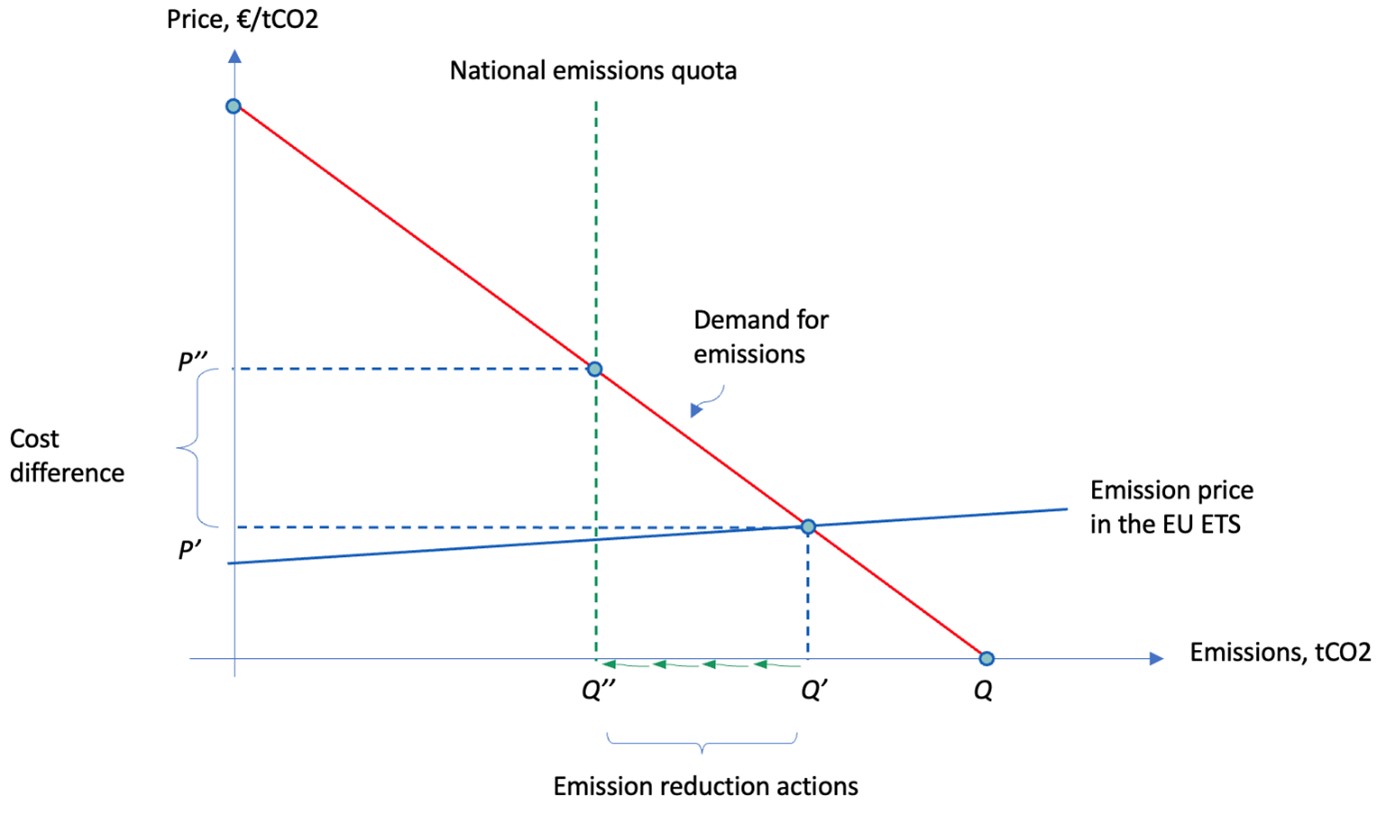
The diagram below Figure 6 illustrates the operation of the linked market mechanism. The graph shows the volume of emissions and the price of them for consumers and companies. In the diagram, consider first a situation in which no price has been set for the externality of emissions, and in this case the number of emissions from construction would be Q.
A reduction in emissions can be achieved through different mechanisms: (i) builders replace high-emitting materials and products with lower-emitting ones, (ii) buildings are designed so that the use of high-emitting materials is reduced, (iii) construction becomes more expensive so that the amount of construction is reduced, and (iv) new technologies are developed that reduce emissions.
A significant part of the emissions caused by the manufacture of building materials already falls under the EU emissions-trading system. This has raised the price of emissions so that construction emissions are now lower than they would be without the intervention of emissions trading. At this juncture, the volume of emissions has, therefore, already decreased to the level Q’, which is lower than the volume without any regulation (Q).
The national quota system raises the costs of construction emissions above the EU emissions trading level. It can be assumed that the emission quota Q” shown in the graph corresponds to the price level P” of domestic construction emission permits, which is higher than the price level of the EU emission trading.
At the same time, the price level informs the regulator directly of the additional costs of regulation, i.e., the cost difference between the price of national regulation and the EU emissions trading in the graph. This can be especially useful in a situation where a national level of ambition higher than the rest of the EU is maintained in a single sector.
Figure 6. Illustration of the market mechanism in the context of national objectives and EU emission trading
4 Electricity market
4.1 Background
The electricity sector is the main contributor to emissions and has historically been the principal target for EU climate action. As a result, it comes as no surprise that the design of the EU emissions trading programme (EU ETS) has had a considerable impact on the electricity sector. A single common price for emissions and the ‘energy-only market’ have been the guiding principle for electricity market integration in the EU.
Interestingly, the current European electricity market design has its roots in the Nordic market model of the 1990’s. The design principles underpinning the Nordic model included keeping the rules as simple and transparent as possible while trusting the market to make dispatch and investment decisions in the power system that would best serve society. By the early 2000’s, the EU had agreed highly ambitious policies for fully integrated internal energy markets. Since then, several regulatory steps have been taken to encourage member states to adopt similar rules and regulations regarding market organisation, and how electric system operations are managed. Today, there is an EU-wide price-coupling procedure that seeks to implement a system-level equilibrium by collecting the bids to buy and sell electricity from all European bidding zones.
The EU price-coupling procedure is documented in https://www.nemo-committee.eu/
The fully integrated energy market, including the integrated emissions market, is a landmark undertaking that is closely aligned with economists’ typical recommendations. Anticipation of this development was clearly evident, for example, in the reports supporting nuclear-power investments in Finland: an expectation that the higher central European electricity price level combined with higher emissions prices would prevail in the Nordic countries was seen to justify market-driven investments in low marginal cost and carbon-free technologies.
While progress towards an integrated market is ongoing, it has been partly slowed or reversed by supplementary policies directly related to a combination of increased climate concerns and the urgency of the Russian-imposed energy crisis. These policies tend to reduce the role of the market in guiding the longer-term development of the power system. The four priorities in the European Green Deal are: (i) energy efficiency; (ii) use of renewable resources; (iii) affordable energy supply, and (iv) integration and digitalisation of the markets.
It could be argued that electricity markets are not developing in a direction where market-based investments determine the technologies and associated capacities because various other policies determine the technologies that society wants. If investment needs are set by the policy objectives, it is natural to use markets to procure these investments efficiently, e.g., through various capacity mechanisms (see e.g., Grubb & Newbery, 2018; Joskow, 2019; Wolak, 2021). If this is the case, then the role of the energy and emissions markets would be primarily to deal with the temporal efficiency of allocations, not the long-term direction of the market.
We discuss how this development can be observed in Finland in the following section.
4.2 Finnish climate and energy policies
Finland has chosen a different path towards decarbonisation than its Nordic peers. Although the share of wind power is now increasing rapidly, at the beginning of the millennium, the emphasis was placed on nuclear power. In 2002, the decision was taken to build a fifth national reactor, Olkiluoto 3, followed in 2010 by decisions to build the sixth and seventh reactors. The belief was that increased market integration with Europe combined with stricter European climate policies would deliver long-term gains, from the carbon-free and stable baseload to the industry collectively building these plants. At the time, there was also less immediate pressure to invest in renewables.
Figure 7 documents the volume trends for the Finnish electricity market as rolling three-year averages of annual totals. The anticipated growth in demand has not materialised, rather, demand has been relatively consistent over time. Nuclear expansion has been slow due to delays and cancellations; under the original plans, nuclear output would have doubled by 2020. The total production of electricity in Finland has declined because of the dwindling thermal output; after 2015, the growth in wind power has equalled the decline in thermal. From a climate perspective, this is what we would want to see: a marked reduction in the use of polluting coal-, peat-, and gas-fired technologies.
Figure 7. Finnish electricity market volume
Note: The data presented is constructed from three-year averages of annual totals
To understand the decline of thermal units in Finland, it is instructive to look at the prices in Figure 8, which shows the three-year averages. In the past decade, the price level in Finland has continuously been higher than the average in the Nordic Region (the system price), but both took a downward turn after 2015. During those periods, Finland benefited from the integrated market through trade. Availability of cheaper imports, mostly from other Nordic countries where large-scale wind expansions were implemented at a much earlier stage, reduced domestic demand for thermal power, leaving many plants standing largely idle. In addition, the waiting time for the continuously delayed Olkiluoto 3 unit has added to the uncertainty of replacement investments for the other ageing plants. A ban on the use of coal in energy by 2029 has been introduced.
Figure 8. Finnish and Nordic electricity prices
Note: Data presented is constructed from three-year averages of annual totals
3.1 Conflict of National vs EU-level policies: Lessons from the electricity sector
The official energy policy in Finland has been consistent with the European project: market integration has been supported by government representatives, and the energy-only market model has become the predominant driver of investment decisions
The renewable subsidy programmes began in earnest in 2011, and though overly generous at the time, the market impact was not felt until the end of the decade.
Bearing in mind that the price difference in Figure 8 cannot solely be attributed to subsidies, it nevertheless illustrates the costs associated with the national ambitions: The price difference indicates an allocative inefficiency that should not arise in an integrated market. Similar inefficiency can be found in the transport and construction sectors if local ambitions override market outcomes; in these markets, the domestic price of emissions exceeds the EU price to support deeper domestic cuts of emissions than those otherwise reached because of the EU price.
The national electricity price may deviate from the price prevailing in the wider market area, depending on the type of locally implemented policy. For example, a higher-than EU price for emissions contributes to an increase in the cost of domestic electricity. By contrast, national ambitions related to certain types of supply-side technologies can motivate subsidies, which can lead to a fall in the local price.
The electricity market case is different from the transport and construction sectors in that it is difficult to design instruments that neutralise the impacts of national policies on other countries. For the emissions quota system, it is possible to ensure that the reduction of emissions due to the national mechanism does not increase emissions in another sector or outside the country’s borders. In contrast, by their nature, national subsidy schemes awarded to energy technologies ignore the spillover to neighbouring countries.
Our policy recommendation in this situation builds on the observation that the use of markets minimises the efficiency losses from national policy aspirations. For example, where local security-of-supply or carbon-emissions targets call for certain capacity portfolios that are not delivered by the current energy-only market, the portfolios can be efficiently built up by using market-based capacity mechanisms such as procurement auctions. The EU energy-only market and emissions trading are still important for allocative efficiency.
5. Carbon pricing and redistribution: illustration from transport
Redistributive policies affecting individuals are national, almost by definition. There is an emerging literature on how individuals could be compensated when climate policies lead to a potentially uneven distribution of cost burdens. However, limited data exists on the actual quantitative magnitudes of the cost burdens, although there is ample evidence from surveys where the policies and related costs are hypothetical (Grainger & Kolstad, 2010; Cronin et al., 2019). In this section, we shed light on the actual cost burdens arising from the existing carbon taxes on fuels in the transport sector. To this end, we examine the burdens on households using detailed microdata on vehicles and individuals in Finland. Here, the Nordic administrative data sets demonstrate their usefulness in evaluating the impacts of policies on emissions and in designing tools for mitigating these distributional impacts.
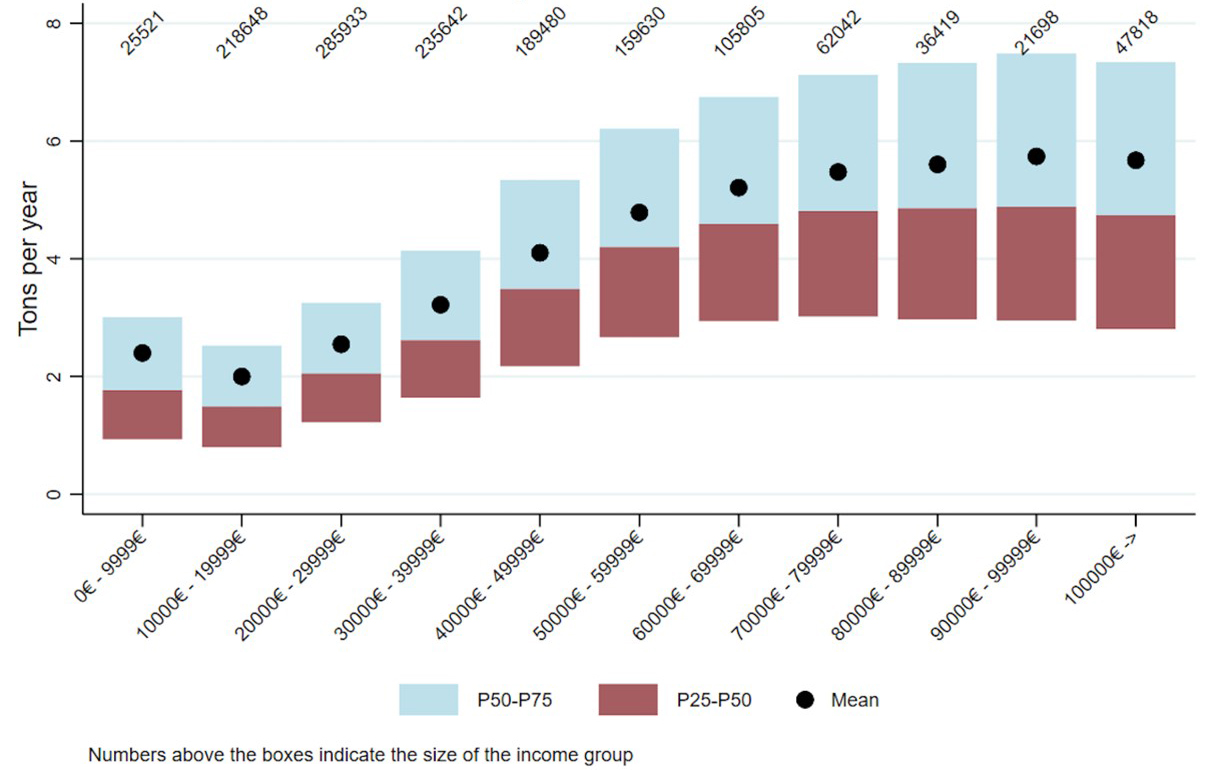
Figure 9. Household's CO2-emissions from driving by income
Only car-owning households
The quantitative analysis is based on our report to the Ministry of Transport and Communications (AEI 2020), in which we used data from 2016 detailing kilometres driven by each individual vehicle
AVERO data includes vehicles subject to vehicle tax used privately in Finland in 2016 and the people who used them. For about 75% of the vehicles, the 2016 mileage has been obtained directly from readings during inspections, while for 9%, data from the previous or following years has been used. For the remaining 16%, the kilometres driven have been estimated using statistical reasoning. Statistics Finland’s FOLK personal information data contains individual-level demographic structure and employment data for all persons living in Finland. Data from 2016 have been used in the illustrations.
The typical value (median) of emissions is around two tons of CO2 per year, up to an annual income of €30,000 per household, but rises sharply above this annual threshold. Above an annual income of €70,000, the typical value of emissions is closer to five CO2 tonnes per year. This is presented in Figure 9.
Figure 10. Vehicle's CO2 emissions per kilometer by household income of the owner
Only car-owning households
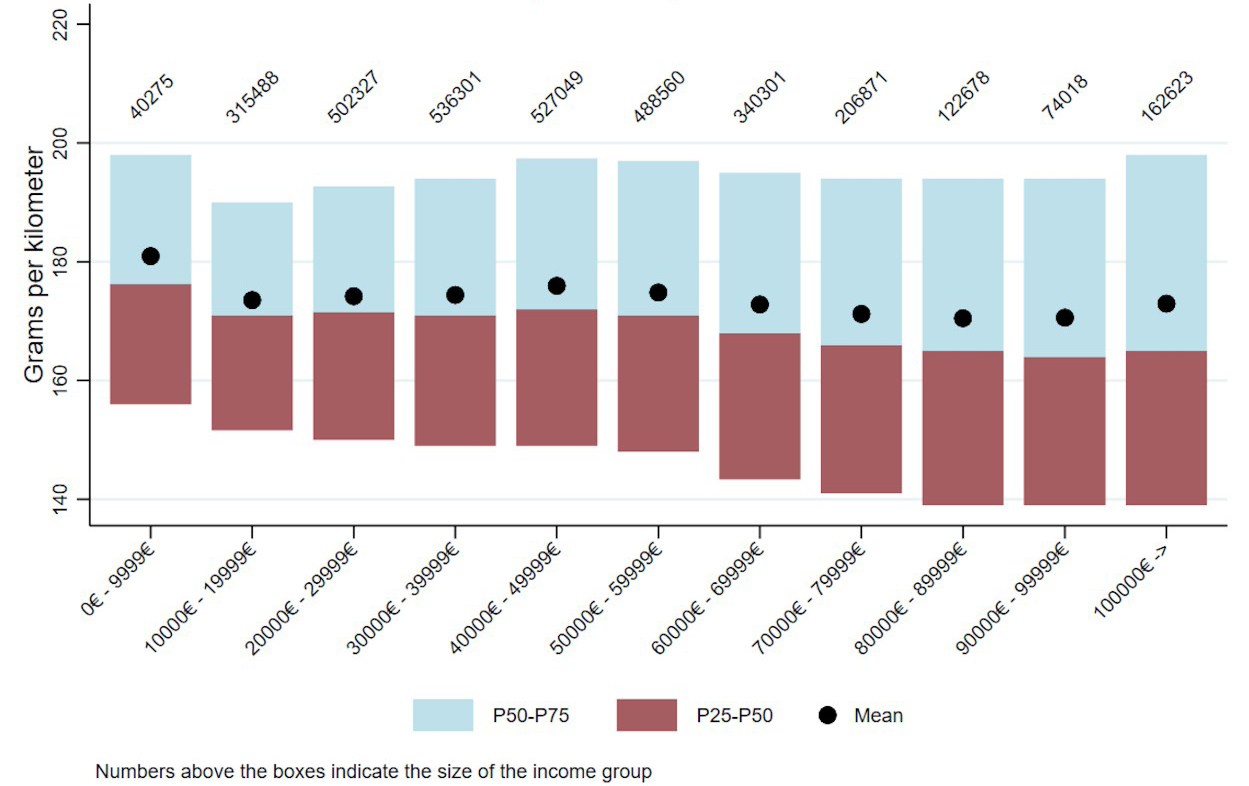
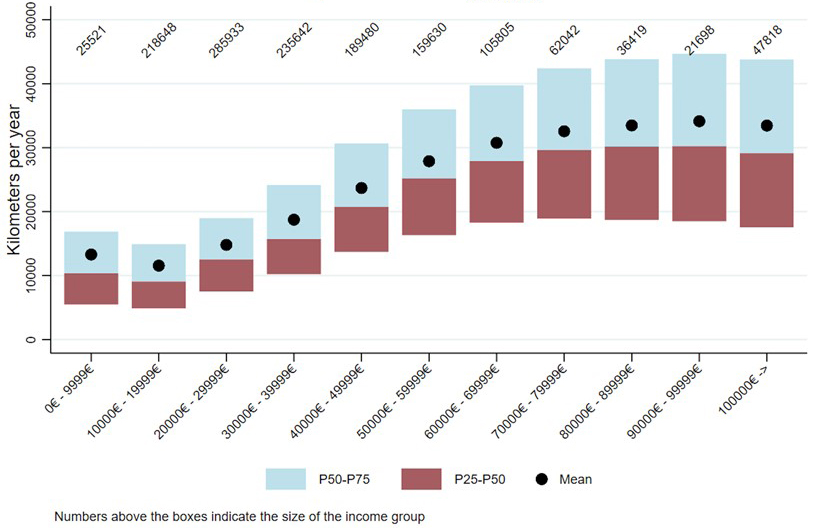
Emissions are affected by the intensity of use and the technology of the car. It emerges that typical car emissions (160-180 CO2g/km) do not vary much with income, although the range of high- and low-emission cars increases at the highest income levels (see Figure 10). Thus, the increase in emissions correlated to income is directly explained by the intensity of use: up to an annual income of €30,000, the typical number of kilometres per household is less than 15,000, but with an income of €80,000 that figure typically rises to 30,000 kilometres per year. This pattern is shown in Figure 11.
Figure 11. Household's kilometers driven by income
Only car-owning households
We will now present a hypothesis based on the stylised facts from Figs. 9–11. A national emissions trading, as described in the section Conflict of National vs EU-level policies: Transport sector, may not necessarily lead to adverse distributional impacts: The new emission-free technologies are most likely to be adopted first by individuals with relatively high incomes who also account for the highest current emissions. When the aggregate emissions goal is given, the adaptation of new vehicle technologies leads to downward pressure on the price of emissions which then automatically lowers the cost burden on low-income individuals. We could therefore predict that, in this market, a system of emissions trading could even out the cost burdens favourably in the long term. An emissions tax does not have this built-in property for levelling out private cost burdens unless the tax is flexibly adjusted downwards in response to aggregate emissions.
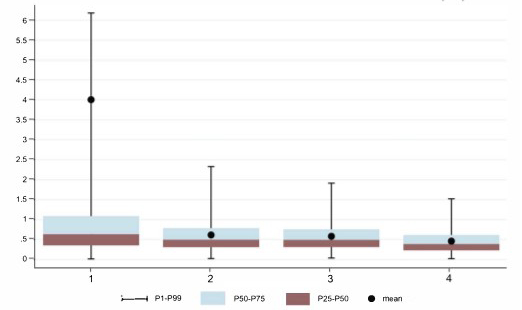
Let us turn to the actual emission costs from the carbon tax, in place since 2016, which stood at €16.25 cents/litre. Based on the kilometres driven, we can calculate the carbon tax paid per household. The tax burden can be described in relative terms by relating it to the household’s disposable net income. We divide the car-driving households into four groups based on income (see Figure 12). The internal distribution of each group is described by a boxplot, where the lower edge of the box is the upper limit of the lowest quarter of the distribution, the middle line is the median, and the upper limit is the lower limit of the upper quarter. Half of the distribution, therefore, sits inside the box. There are whiskers on each side of the box, which fit the entire distribution except for the top and bottom percentiles. In addition, there is a black dot for each box representing the mean value of the distribution.
In the bottom quartile, the average tax share of income is precisely 4%, which is much higher than the group median. This is partly explained by the fact that in the lowest income category, there are cases with very low reported incomes, in which case the carbon tax they pay can be multiple times compared to their income. In the top group, both the mean and the median are close to 0.5%. The lowest group also has the largest dispersion, as 1% of households pay more than 6% of their income in tax, while in the highest income group, this top group is already reached with an income share of 1.5%. The boxes containing half of the households reduce as income increases, which further shows a decrease in dispersion as income increases.
The carbon tax on fuel is regressive: low-income earners pay a higher percentage of their income in tax than high-income earners. However, the regression is quite mild, except for the very lowest-income housing units. From their point of view, it is important to bear in mind that the graph only covers one year’s income, which may include a significant number of housing units that in that year happened to earn less than usual – due to unpaid leave, for example – but did not dramatically reduce the number of kilometres driven.
In addition to the carbon tax, the consumer price of fuel consists of the energy content tax (which is higher than the carbon tax), the security of supply fee, and the tax-free price and the value added tax that comes on top of the previous ones. Adding these expenses to the picture would raise, but not change the differences between the levels.
Figure 12. Income groups
People on low incomes pay more carbon tax to drive, but in absolute terms, high-income people clearly pay more in total: the calculated total tax revenue from private driving, based on the 2016 data and tax level, is about €0.5 billion, of which the lower-income households account for 25%. Figure 13 shows how the tax amount is collected from households (vertical axis), whose incomes are summed up in order of magnitudes on the horizontal axis. For example, in the middle of the vertical axis, 50% of the tax has been accumulated, but 75% of the total households have been reached. The wealthiest 25%, therefore, pays the remainder, i.e., 50% of the total tax revenue collected.
Figure 13. Carbon tax revenues and household income distribution
Tax rebates can be used both to determine how much households ultimately pay for emission cuts and how redistribution could be implemented. The simplest refund is a flat rebate of the entire tax. This is not efficient because tax revenues should preferably be saved for alternative uses in the public sector, but the calculation is a useful point of comparison for other rebate models. A full equal refund rewards low-income households, i.e., their cost increase at the petrol pump will be lower than the tax refund: motorists at a higher income level finance this higher gain through their increased tax payments. However, the regressive nature of the tax can be removed with a much smaller, more precisely targeted return; for example, 15% of the total tax collection would be sufficient for this purpose if the refund is allocated only to the lowest income groups. We elaborate on these rebate methods in our report AEI 2020.
6 Concluding remarks
The policy designs introduced in this article are guided, on the one hand, by a desire to respect national commitments for emissions reductions and, on the other, by an intention to improve both allocative and distributional outcomes that will boost the economy and improve 'competitiveness' in its broadest sense. We conclude by noting the connection to, and the importance of, electricity across all sectors. The use of electricity will significantly increase in the future through the electrification of traffic and heating, and increases in the production of various electricity-based fuels and hydrogen.
Current trends point to a rapid large-scale expansion in renewable electricity generation. More recently, during this transition, the Russian attack on Ukraine and the resulting international energy repercussions have intensified the role of national interests, and it is unlikely that the member states will leave it to the single European energy market to guide their energy infrastructure investments. More plausible is a continued procuring of the investments needed for the national renewable transition, e.g., through long-term contracting. In that scenario, the role of the energy and emissions market would be to maintain the efficiency of short-term allocations.
Finally, the success of electrification depends critically on how electricity networks act as a technology-neutral platform that enables sustainable development, helps in fully utilising renewable energy, facilitates the development of efficient electricity systems, and provides critical infrastructure. The distribution networks are local monopolies, but current regulations do not sufficiently reflect the full set of services that society expects from them. Regulatory goals should be derived from the entire vertical structure, starting with the generation of electricity, and ending with transmission via the network to the end user.
An appropriate approach to regulation should start by asking if the network to be regulated is in a steady state or in a state of transition. The broad goals for security of supply and climate and energy policy mean that there will be a need for investment and possible unforeseen changes in the services expected from the grid company. If this is the case, the approach to regulation should be different compared to a stable operating environment (Armstrong & Sappington, 2007). Price regulation is best suited to situations where the operating environment is stable and the quality requirements for operations are well-defined. In practice, price regulation sets the rules for how price changes are made based on general inflation and industry-efficiency metrics. Price regulation results in a very strong incentive to cut costs because the monopoly company receives all the possible cost savings, ultimately to its own benefit.
Unlike direct price regulation, cost-based regulation is based on observable costs. This model includes the common rate-of-return regulation, which means that a pre-agreed return is paid for the capital tied up in the operation in addition to the operational costs. In principle, the regulatory model can compensate these costs as transfers, but in the case of electricity transmission, the established practice is to collect the costs directly from the end user of the network: the costs approved by the regulatory authority determine how much the company is allowed to charge the end user in the form of network usage fees (i.e., tariffs).
Cost-based regulation is suitable for situations in which a company is expected to implement a project with an outcome that is difficult to predict. Therefore, there are clear grounds for cost-based regulation in the transmission of electricity in the green transition: regulated operations are under significant pressure to change. The new quality goals set for operations, as well as broader goals for security of supply and climate and energy policy, may possibly result in unforeseen changes in the services that the grid company normally supplies. Cost-based regulation offers a solid basis for regulation in a changing operating environment, but only as a basis: a more comprehensive model would enhance its features to emphasise the interests of the network’s end users.
The regulatory model in Finland incorporates key features of the cost-based model, but the following fundamental problem remains
The most recent change in the law has emphasised the role of development plans, but without prior approval of investments and inclusion in the income framework, the change does not correct the basic problem targeted by the direct regulation of turnover.
Research suggests that adjusting the model would make economic sense so that, in addition to cost-based regulation, turnover could also be regulated directly as part of the approval process for operational planning. In practice, this would mean, for example, increasing the role, transparency, and obligations of national development plans. Careful public documentation of the process will also create the conditions for subsequent monitoring, which is of vital importance for all parties involved.
References
Armstrong, M., & Sappington, D. E. M. (2007). Chapter 27 Recent developments in the theory of regulation. Handbook of industrial organization, 3, 1557–1700.
AEI [Aalto Economics Institute]. (2019). AEI-raportti: kohti hiiletöntä liikennettä – ehdotus mekanismiksi. Taloustieteellinen tarkastelu liikenteen päästövähennyskeinoista [Towards carbon-free transport, proposal for a mechanism]. Aalto University. Retrieved from https://www.aaltoei.fi/wp-content/uploads/2019/10/AEI-raportti_Kohti-hiiletöntä-liikennettä.pdf
AEI [Aalto Economics Institute]. (2020). AEI-raportti: Kohti hiiletöntä liikennettä – analyysi tulonjakovaikutuksista. Empiirinen tarkastelu hiilidioksimaksun vaikutuksista kotitalouksiin [Towards carbon-free transport, an analysis of income distribution effects.]. Retrieved from: https://www.aaltoei.fi/wp-content/uploads/2020/10/AEI_raportti.pdf
AEI [Aalto Economics Institute]. (2021). AaltoEI-raportti: Kohti hiiletöntä rakentamista. Taloudellinen näkökulma. Aalto-yliopiston taloustieteen työryhmä [Towards carbon-free construction]. Retrieved from: https://www.aaltoei.fi/wp-content/uploads/2021/03/Kohti-hiiletöntä-rakentamista.pdf
Böhringer, C., & Fischer, C. (2020). Kill Bill or tax: an analysis of alternative Co2 price floor options for EU member states. CESifo Working Paper No. 8631. http://dx.doi.org/10.2139/ssrn.3715283
Cronin, J. A., Fullerton, D., & Sexton, S. (2019). Vertical and horizontal redistributions from a carbon tax and rebate. Journal of the Association of Environmental and Resource Economists , 6(S1), 169-208.
Grainger, C. A., & Kolstad, C. D. (2010). Who pays a price on carbon?. Environmental and Resource Economics, 46(3), 359-376.
Grubb, M., & Newbery, D. (2018). UK electricity market reform and the energy transition: Emerging lessons. The Energy Journal, 39(6).
Hoekstra, M. , Puller, S. L., & West, J. (2017). Cash for corollas: When stimulus reduces spending. American Economic Journal: Applied Economics, 9 (3), 1-35.
Joskow, P.L. (2014). Incentive regulation in theory and practice: electricity distribution and transmission networks. In N. L. Rose (Ed.), Economic regulation and its reform: What have we learned? (pp. 291–344). University of Chicago Press.
Joskow, P. L. (2019). Challenges for wholesale electricity markets with intermittent renewable generation at scale: the US experience. Oxford Review of Economic Policy, 35(2), 291–331.
Kervinen, E. & Teittinen, P. (2021, September 9). HS:n näkemät asiakirjat paljastavat, mistä ilmastotoimista keskusta ja vihreät väänsivät – lopulta perälauta tuli, mutta ilman keinoja [Climate measures to be adopted by the Finish government]. Helsingin Sanomat. Retrieved from https://www.hs.fi/politiikka/art-2000008253500.html
Ofgem [Office of Gas and Electricity Markets, Great Britain] (2013). Strategy decision for the RIIO-ED1 electricity distribution price control: Outputs, incentives and innovation. Retrieved from https://www.ofgem.gov.uk/sites/default/files/docs/2013/02/riioed1decoutputsincentives_0.pdf
Springel, K. (2021). Network externality and subsidy structure in two-sided markets: Evidence from electric vehicle incentives. American Economic Journal: Economic Policy, 13(4), 393-432.
Wolak, F. A. (2021). Long-Term Resource Adequacy in Wholesale Electricity Mar- kets with Significant Intermittent Renewables. National Bureau of Economic Research Working Paper 29033.