Nordic Economic Policy Review 2023
Comment on F. Silbye & P. Birch Sørensen: National Climate Targets Under Ambitious EU Climate Policy
Lars Gårn Hansen
My thanks to authors Frederik Silbye and Peter Birch Sørensen for their very considered response to my comments. Any remaining errors and opinions are, of course, mine alone.
1. Introduction
This paper poses the question: what constitutes an optimal climate policy for an EU member state with climate ambitions after the recent ‘fit for 55’ policy reform? The authors focus on how an ambitious country’s climate policy interacts with the EU climate emission quota market (Emission Trading System: ETS) and what adjustments to its climate policy this interaction might entail. The paper offers three main contributions:
- Using an ETS simulation model, the authors find quota sector leakage rates will be ‘around zero’ in the period to 2032 but ‘close to 100%’ after that, assuming ETS rules and emission quota supply do not change.
- They argue that the ETS quota supply is unlikely to remain unchanged and, more importantly, that the political process around future ETS supply changes is systematically affected by the ambitious country’s prior unilateral ‘extra’ emission reductions, in a way that reduces leakage from these extra reductions, for example, so that leakage after 2032 is likely to be below 100%.
- Assuming that the ambitious country is not only focussed on its own climate emissions but also on the scale of global emissions, they find that the optimal policy is to set the total payment for emitting CO2 in the quota sector to:
WTP + ETS quota price – leakage cost
where “WTP” is the political willingness to pay for national climate emission reductions. The ETS quota price should not be deducted from the national carbon tax because the payment is to an external entity, the revenue from which (at the margin) does not accrue to the ambitious country. Finally, the carbon tax should be reduced proportionately to leakage to the extent that the country is also concerned about global reductions in emissions.
I enjoyed reading the paper. It is well written and argued and addresses an important policy issue facing the Nordic countries. I find the ETS leakage simulations to be a (very) useful contribution since this informs the discussion about ambitious EU member states’ climate policies. In the following, I will focus my review on the two latter contributions, where I have some reservations, before offering some concluding remarks on how an ambitious EU member state’s climate policy should be designed.
2. Leakage effects of endogenous ETS quota supply
The authors argue that the political process for making future ETS quota supply decisions is likely to reduce leakage caused by a unilateral decision to abate within the quota sector by an ambitious EU member state. Their basic argument (illustrated in Figure 4 of their paper and developed mathematically in Appendix A) is that the EU’s cost of emission reductions is lowered relative to the initial state when the ambitious country unilaterally undertakes extra abatement measures. Thus, when emission quota supply is reconsidered at some point in the future, it would be less costly to reduce quota supply than it would otherwise have been (all other things being equal). This causes the EU-level balancing of climate reductions against abatement costs (reflecting an underlying bargaining process between member states) to shift toward even more reductions, assuming that the EU-level trade-off evaluation between costs and emissions reductions remains the same. This is an appealing argument – perhaps in part due to its simplicity. It may, however, be too simple.
While unilateral emissions reductions in the ambitious country unequivocally reduce EU abatement costs, it is not clear that this will leave the EU-level trade-off between emissions and abatement costs unaffected. In the following, I offer an example where this trade-off is affected in such a way that quota supply is increased, not reduced.
I assume that the EU-level trade-off between emission reductions and costs is the result of a Nash bargaining process between an ambitious and an unambitious block of member states, illustrated in Figure 1. Initially, both blocks have the same abatement cost curves, labelled A- and UA-MAC in Figure 1. Emissions are measured from the right, and the point where the A- and UA-MAC curves cross the horizontal axis (labelled O1) indicates the level of emissions when the price of CO2-emissions is zero (no regulation). As the price of emissions (indicated on the vertical scale) increases, each block’s emissions are reduced, as indicated by its MAC curve. Adding the two emission curves horizontally gives the EU emissions curve labelled EU MAC. Emission reductions for the EU and for each block are correspondingly measured from the left, starting at points O and O1, respectively. Horizontally adding each block’s emission reductions measured in this way, as indicated by the blocks’ MAC curves, gives the EU emissions reduction indicated by the EU MAC curve.
The ambitious and unambitious blocks have a willingness to pay for their own reductions, labelled A-WTP and UA-WTP, respectively (willingness to pay for reductions in the other block is assumed to be zero). Initially, the only difference between the blocks is that the ambitious block has a higher level of WTP, as indicated by the two WTP lines in Figure 1.
I assume that the Nash bargaining equilibrium that results from the negotiation process is the quota supply (labelled ‘bargaining equilibrium ETS supply’ in Figure 1), where each block has the same bargaining-power-adjusted welfare loss compared to its preferred quota supply. I also assume that the bargaining process rules outside payments through quota grandfathering so that quotas are grandfathered to each block in a proportion that ensures no revenue/quotas are transferred between blocks in the resulting equilibrium. Given this, each block’s preferred quota supply is the one that results in a quota price that implements its own preferred level of reductions, indicated by the blue and green dots, respectively, in Figure 1. The blue and green triangles are the welfare loss for each block resulting from the bargaining solution ETS supply indicated by the red dot in Figure 1. Thus, Figure 1 illustrates a bargaining solution in which the ambitious block has greater bargaining power and, in turn, the bargaining equilibrium leaves them with a smaller welfare loss than the unambitious block.
After the implementation of this bargaining solution, the ambitious block decides to unilaterally implement policies that ensure its own preferred abatement level, which is illustrated in Figure 2. This could be by imposing a local carbon tax equal to its equilibrium WTP (WTP at the blue dot indicated in Figure 2) minus the quota price (labelled A-block tax in Figure 2), for example. If the quota price is lower than equilibrium WTP, the abatement incentive equals the equilibrium WTP. If it is greater, the abatement incentive equals the quota price. After implementation of this policy, the A-block MAC curve shifts to the indicated vertical line under the equilibrium WTP since these abatements have already been undertaken. The result is that quota prices under this level no longer affect the abatement efforts of the ambitious block. This results in a corresponding shift in the EU MAC (total EU quota demand) curve and so causes a fall in the quota price, as indicated by the downward shift of the red dot in Figure 2 (consistent with the authors’ assumption).
Figure 1
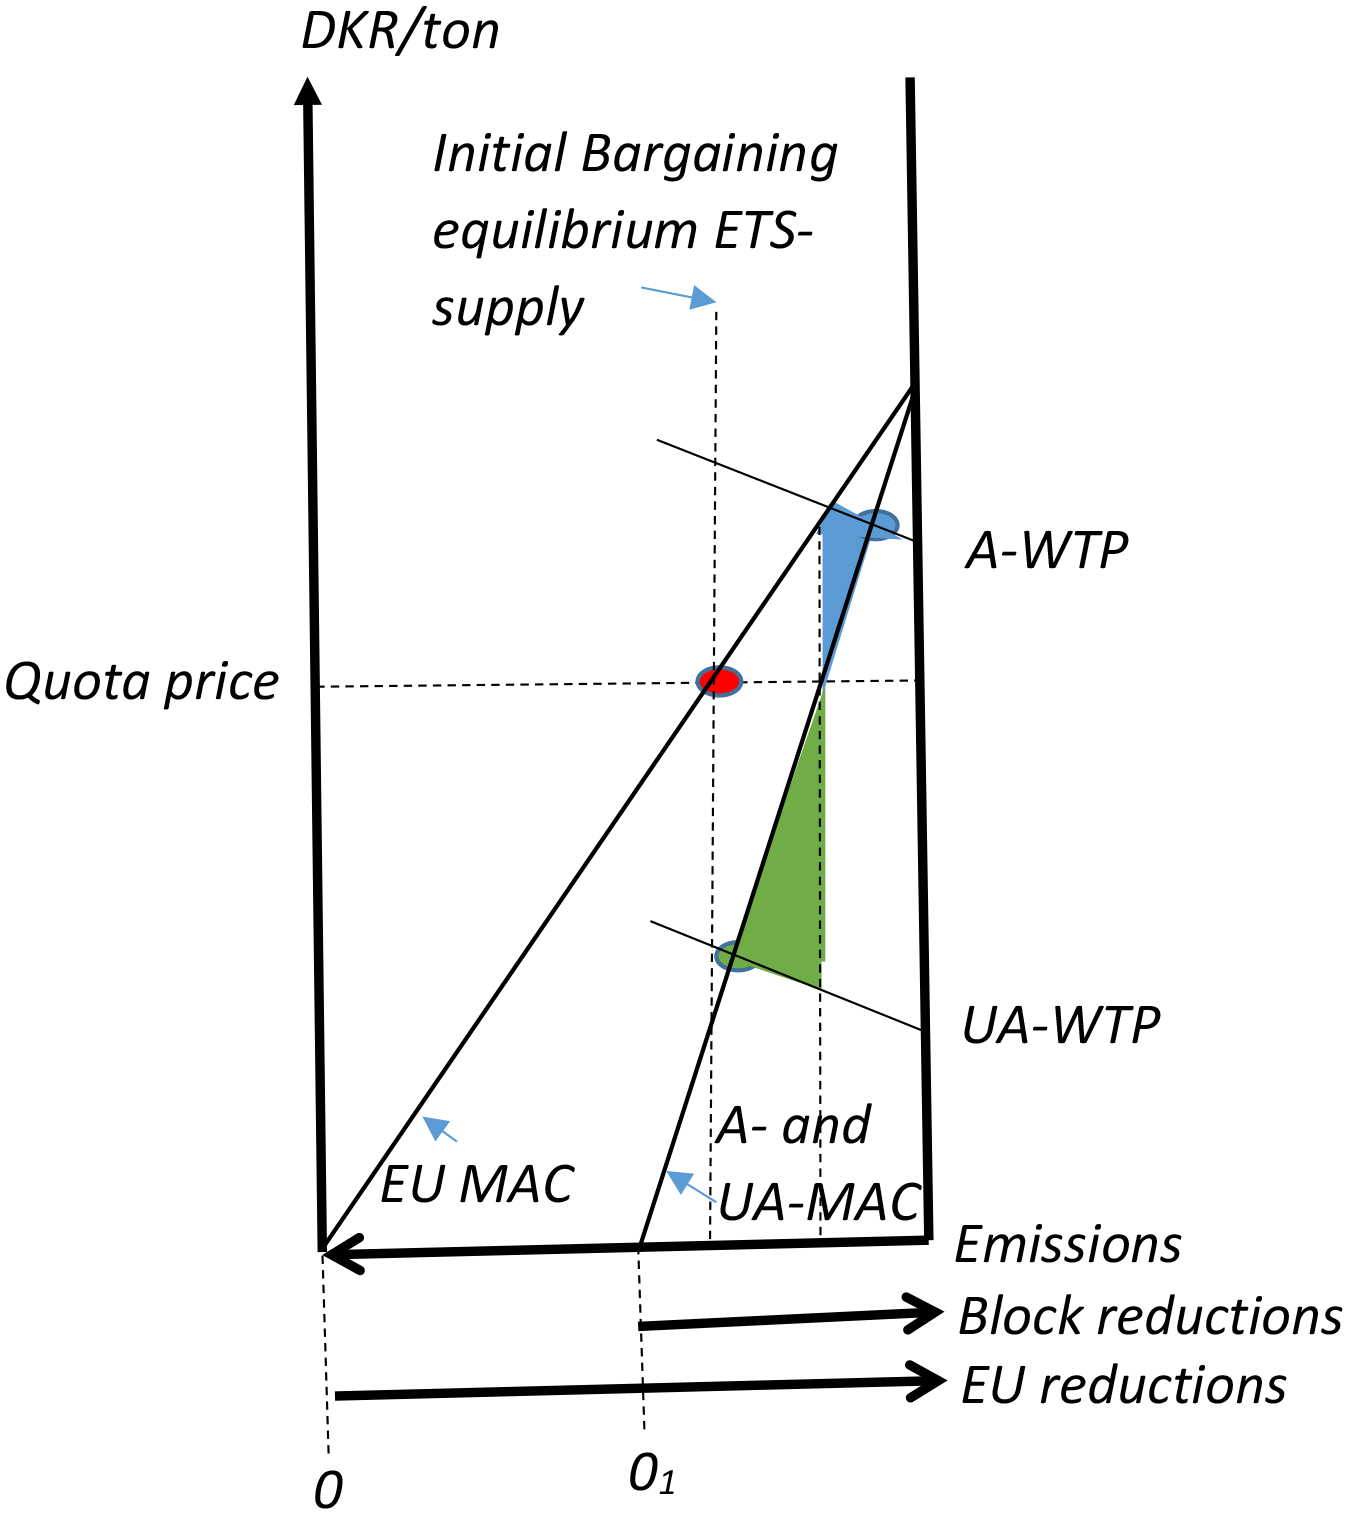
Figure 2
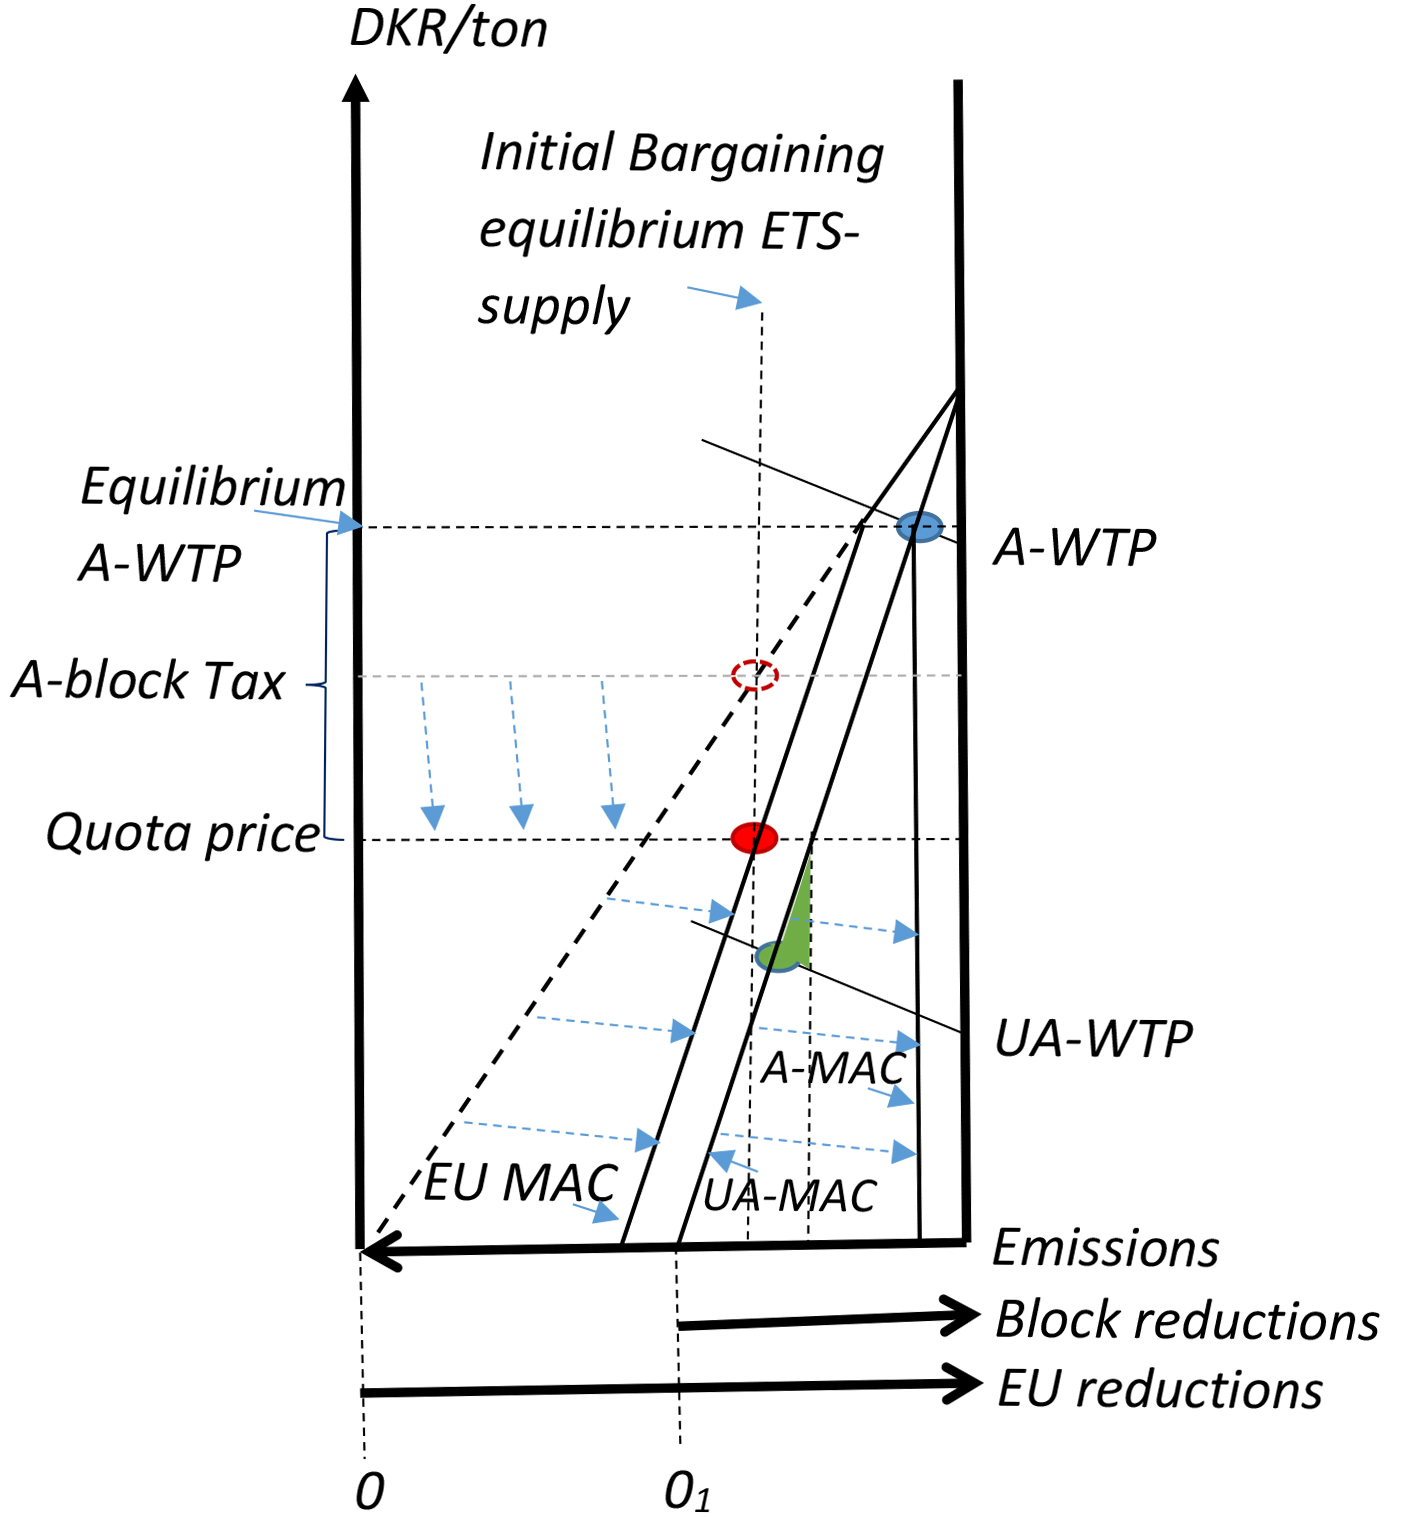
Now suppose there is a renegotiation of quota supply (after the unilateral abatement of the ambitious block has been fully implemented) following the same bargaining process as the initial negotiation and with no side payments. The resulting quota supply will again be the one that equalises the blocks’ bargaining-power-adjusted welfare loss relative to their preferred supply. Looking at Figure 2, we see that the preferred abatement levels are the same as before. Let us consider the current quota supply as a candidate for the new ‘bargaining-equilibrium ETS supply’. The welfare loss of the unambitious block is now lower than under the last negotiation (as indicated by the smaller green triangle in Figure 2) because of the lower equilibrium quota price, and correspondingly lower abatement level for this block. However, there is still a strictly positive welfare loss. The ambitious block’s welfare loss is, on the other hand, reduced to zero because it now has policies in place that reduce its own emissions to their preferred level. In fact, the ambitious block now has no preference as to which ETS quota supply is chosen as long as it does not induce a quota price greater than their equilibrium WTP. Thus, the resulting negotiation will increase quota supply relative to the current supply level until the unambitious block’s remaining welfare loss is also eliminated. Essentially, the ambitious block is no longer interested in the common ETS policy since it is no longer driving its emissions. Instead, the common policy is decided by the unambitious block, which is the only remaining agent with a stake in the outcome of the negotiation. Thus, the EU-level trade-off between abatement and costs is negatively affected, causing quota supply and leakage to increase.
Although this is just one example, it seems plausible that the positive effects on quota supply of unilateral climate policy can be shown for a (wide) set of negotiation scenarios. Of course, other assumptions regarding bargaining power, WTP for emission in the other block, side payments, etc., might well lead to a negative effect on endogenous supply, as the authors suggest. That the negotiation process could lead to a reduction in supply and leakage, as put forward by the authors, is therefor in no way ruled out by the example I give here. However, it does suggest that even the sign of the effect of a unilateral climate policy on endogenous ETS supply (and thus leakage) cannot be determined theoretically: Empirical evidence is needed before drawing any conclusions about the sign of this effect. Given that our understanding of political negotiation processes is limited, I would hesitate to factor in such an ‘endogenous supply’ effect.
3. Incentives in the quota sector
The paper’s third contribution is to structure the policy design problem of an ambitious member state that values national as well as global emission reductions and only has carbon taxation as an instrument. Assuming that this is the case, the paper structures the design problem concisely and illuminates two important points. The first is that payment for ETS quotas is a real cost borne by the emitting country, essentially because its revenues from quota sales are unaffected by the marginal quota purchase of its polluters. Thus, the marginal cost of abatement should be reduced by the emission quota price when a cost-minimising policy is designed. The second point, illustrated by Figure 6 in the paper, is that the core of the ambitious country’s policy decision problem lies in allocating reductions between polluting sectors and that the optimal distortion of this allocation away from the standard uniform-incentive baseline depends on differences in quota prices and differences in leakage rates between sectors. The authors acknowledge that differences in leakage rates could be more efficiently addressed through production subsidies (and corresponding consumption taxes) but assume that this instrument is not available.
Under the assumed frontrunner policy goals, the paper concisely frames the policy decision problem faced by an ambitious EU country, as noted above. However, as the authors also acknowledge, the Kantian moral imperative ‘to act in the way one would like others to act’ and the more common practical motive of ‘inspiring other countries by setting an example to follow with low costs’ could imply other frontrunner policy goals. Specifically, if it is important for the frontrunner country to exemplify policy that other countries can follow, it becomes correspondingly important that its policy design is scalable and that its costs reflect those that potential emulators would face. If, for example, the EU as a whole, were to consider copying a Nordic frontrunner’s climate policy, then policy-design features such as being optimized to reduce leakage through the EU ETS and to capture gains from quota sales to other EU members would not be relevant, while any resulting cost savings would be misleading. This is because there would be no ETS leakage nor any possibility of reducing costs by selling quotas at EU level. This would also be the case if the frontrunner wants to inspire non-EU countries, which account for almost 90% of all greenhouse gas emissions.
To demonstrate the consistency issue, imagine a situation where the EU decides to become just as ambitious as the frontrunner country and to achieve this in an efficient manner (presumably what the frontrunner is hoping for). If the frontrunner has implemented a uniform carbon tax with full deduction for the quota price, then this will happen seamlessly as its extra carbon tax in the quota sector falls to zero and its carbon tax in the non-quota sector becomes just sufficient to meet EU reduction demands. On the other hand, if the frontrunner has implemented an ETS-optimised policy in the way proposed by the authors, then the frontrunner’s abatement incentives will be distorted between the quota and non-quota sectors compared to the EU incentives. Letting this distortion continue would seem to clash with the Kantian moral imperative, though it would undoubtedly be economically advantageous for the frontrunner. Eliminating it would, on the other hand, beg the question of why the distortion was introduced in the first place. Thus, as the authors point out, the fundamental question of why precisely a country aspires to be a frontrunner is a critical prerequisite for a discussion of how its policy should be designed.
4. How should an ambitious EU country’s climate policy be designed?
The authors present the relevant policy decision problem for an ambitious EU-member country assuming that national and global reductions (and not scalability) are the key policy goals. Focussing on the situation after 2032, this decision problem depends critically on leakage through the EU quota system, which will also encompass the transport, buildings and construction sectors following the latest reform. The authors’ first contribution shows that leakage will be close to 100% if the endogenous quota supply effect is ignored. This suggests a rather narrow frontrunner strategy primarily focused on agricultural emission reductions. If we assume a (substantial) leakage reducing endogenous quota supply effect, this narrow focus could be moderated, and the authors' recommendations go in that direction. However, as they also point out, optimising frontrunner climate policy design in line with their proposals is difficult because of substantial uncertainties about leakage rates in general and endogenous ETS supply effects in particular. For this reason, the approach risks opening the door to permanent tax reductions/exemptions rooted in concerns such as the special interests of certain companies, etc., under the guise of securing global CO2-reductions/reducing leakage. Doing this might be tempting if securing such special interests is considered less legitimate by the general public compared to securing global CO2-reductions/reducing leakage.
Another way to argue for a more balanced frontrunner policy design is to require scalability. This would imply ignoring gains from quota sales, ETS leakage, and, I would argue, ignoring leakage in general since, the country is a frontrunner for a world where most other countries also undertake climate policy, and as a result, leakage is minimal. If this is the starting point, then arguing for tax reductions/exemptions becomes more of an uphill battle, and there is a strong case for making these measures temporary. However, the authors highlight an important point, stressing that such an approach comes with a welfare cost in the form of underutilisation of the gains from ETS quota sales to other EU-member countries and potentially underutilised opportunities for global emission reductions (to the extent that there is a WTP for these in the ambitious country).