5. CBAM and the green transition in the Nordics
CBAM is not a climate mitigation instrument in itself, but a trade-related mechanism designed to support the EU ETS by preventing carbon leakage. While the EU ETS caps total emissions within the EU and thereby drives the green transition, CBAM influences the carbon content of imports and may affect trade patterns and competitiveness, with indirect implications for industrial investment and production location. CBAM aims to mitigate carbon leakage within the EU by putting a price on imported goods covered by the regulation, making importers pay a levy equal to the EU-ETS price. It aligns the price of the embedded carbon content with the price of EU-ETS quotas to level the playing field between European and third-country producers. Taking trade data from 2022, only 3% of EU imports from non-EU countries are covered by the CBAM sectors, but were estimated to represent 0.31% of global GHG emissions in 2022 (OECD, 2025a). As such, the CBAM covers a small part of the overall trade, but targets sectors with relatively high embedded emissions and may therefore have a disproportionate impact on emissions embodied in international trade.
For Finland, Sweden and Denmark, the established focus on low-carbon technology in the production processes of the CBAM covered sectors shows potential for these sectors to improve relative competitiveness, reflecting lower emission intensity in CBAM covered production. However, any resulting emission reductions are determined by the EU ETS cap rather than by CBAM itself. The impact of CBAM will likely result in a shift in trade balances, reducing imports of CBAM covered (emissions intensive) products to the EU. However, the sectoral importance differs between the scope countries, meaning that some have more primary production than others, suggesting different level of impacts on the covered sectors. In addition, the Nordic countries have high input prices compared to the rest of the EU, which means that the impact on national production levels will depend on the carbon price. There may also be indirect effects for downstream users of CBAM products, as well as potential impacts on technological development and substitution patterns over time.
The next section will touch upon the overall position of Finland, Sweden and Denmark in terms of exposure, competitiveness and map out sectoral considerations for the scope countries.
5.1 Key mechanisms and macroeconomic impacts of CBAM
With the phase-out of free allowances under the EU ETS, European companies are at risk of losing business to carbon-intensive production in countries with little to no regulation, which will both increase global emissions and decrease the relative competitiveness of European companies. Before the introduction of CBAM, there was a risk of highly energy-intensive sectors included in CBAM relocating emissions to less regulated and therefore more economically profitable countries which would cause carbon leakages and economic losses for the regulated country (Kittel & Fahl, 2025). The intention of the CBAM is to send a price signal through the value chain, as the policy disproportionally increases the price of emission intensive inputs which will encourage firms to reduce the financial burden of the policy through greening of production processes (OECD, 2025a).
The enhanced price signals caused by CBAM can redirect investments back into European countries, as the national and European adopted climate targets and emission taxation of CO2 emissions under EU ETS have been encouraging industries to green their production and develop and apply low-emission technologies for years now (Kittel & Fahl, 2025). This could improve the relative competitiveness of producers with lower emission intensity, including some Nordic industries, depending on sectoral composition and trading partners rather than on systematically different import patterns (FIW, 2024; OECD, 2025a). Highly trade-exposed industries with high emission-intensity, where production technologies vary significantly will be most affected by the policy, as it will cause a significant price gap between clean and high-emission production processes (Zhong & Pei, 2022), as illustrated in figure 1 (CO2 IQ, 2025).
Figure 1. Differences in cost of CBAM products (CO2 IQ, 2025)
*At average EU-ETS price 2024: 65 EUR/tCO2
The price signal will increase with rising quota prices following the planned reduction of quotas under EU ETS, which will accentuate price differences between clean and ‘dirty’ production. Incentives to direct production towards less carbon-intensive countries, such as the Nordics where strict environmental regulations in many cases have caused CBAM industries to have lower-than-average CO2 emission intensity, will thus increase. In figure 2, the added costs of CBAM for all three scope countries and sectors show that with an ETS price of 72.8€/ton, Finland, Sweden and Denmark will only marginally be affected on their input prices due to CBAM, with the exception of iron and steel, that is modelled to expect price increases of up to 23.6%.
Figure 2. The effect on prices as impacted by CBAM in the scope sectors for all three countries
The size of the price signal is dependent on the value-added of the production process in which the CBAM-good is an input to. The CBAM tariff is placed at the very beginning of the value chain, which means that basic products and imports are most affected by the price increase. Highly processed high value added products will be relatively less impacted, as the CBAM input only constitutes a small share of the total value-added of the end product. As such, the size of the carbon fee relative to the total value-added of the product falls as you move up in the value chain (EsadeEcPol, 2022).
5.1.1 Fixed European emissions and shifting national emissions
With the EU ETS, companies that wish to increase production must either purchase emission certificates (thus removing them from the market) or shift production to a less emission-intensive manner. As such, any increase in production within EU countries associated with CBAM would occur under the constraints of the EU ETS and its carbon price, which provides the primary incentive for companies to adopt and implement low-carbon production technologies (Mendoza et al., 2024). CBAM does not reduce total EU emissions, which are determined by the EU ETS cap, but may influence where within the EU production takes place and which imports are displaced. While the policy caps the total emissions in the European Union, emissions will move to the producers with the highest utility of pollution, meaning companies that have a high output per pollution quota. This process will be further accentuated as free allowances are phased-out, and the subsequent rise in ETS prices. If the Nordic heavy industries have a higher-than-average utility of pollution, European pollution from CBAM industries might move to the Nordic countries.
5.1.2 Indirect cost compensation under the EU ETS
Under the EU ETS, Member States may grant compensation to certain electricity-intensive industries for indirect costs resulting from higher electricity prices caused by carbon pricing. This so-called indirect cost compensation aims to mitigate carbon leakage risks for sectors that are both trade-exposed and electricity-intensive. The compensation framework is governed by EU State aid rules and applies only to eligible sectors listed by the European Commission.
Importantly, indirect cost compensation is implemented at national level and varies across Member States in terms of coverage, generosity and budgetary allocation. As a result, the extent to which electricity-related ETS costs are passed through to industrial consumers differs significantly across countries.
For the Nordic countries, the relevance of indirect cost compensation varies. Finland and Sweden have implemented indirect cost compensation schemes for eligible sectors, while Denmark has historically applied more limited compensation. These schemes reduce the effective electricity-related carbon costs faced by industry and therefore play a decisive role in determining competitiveness impacts related to indirect emissions.
Consequently, the potential effects of including indirect emissions in CBAM on industrial competitiveness depend not only on electricity prices or the carbon intensity of power generation, but crucially on whether and to what extent indirect ETS costs are compensated at national level. This institutional feature is therefore more influential for competitiveness outcomes than differences in electricity generation mixes alone.
5.1.3 CBAM exposure index
How exposed each country is to the implementation of CBAM depends on two main factors:
- the reliance on imports from CBAM-covered sectors, and
- the scale of these imports relative to the size of the economy, measured by GDP.
The SPES project (SPES2025) uses these indicators to develop a CBAM short-term exposure index (Figure 3). The countries included in this study are all moderately exposed. Among them, Denmark shows the highest score, indicating a stronger dependence on industries affected by CBAM compared to Finland and Sweden. This suggests that while these sectors are present in the Nordic countries, they are relatively well positioned to adapt—either by diversifying or by shifting towards cleaner energy sources (SPES, 2025).
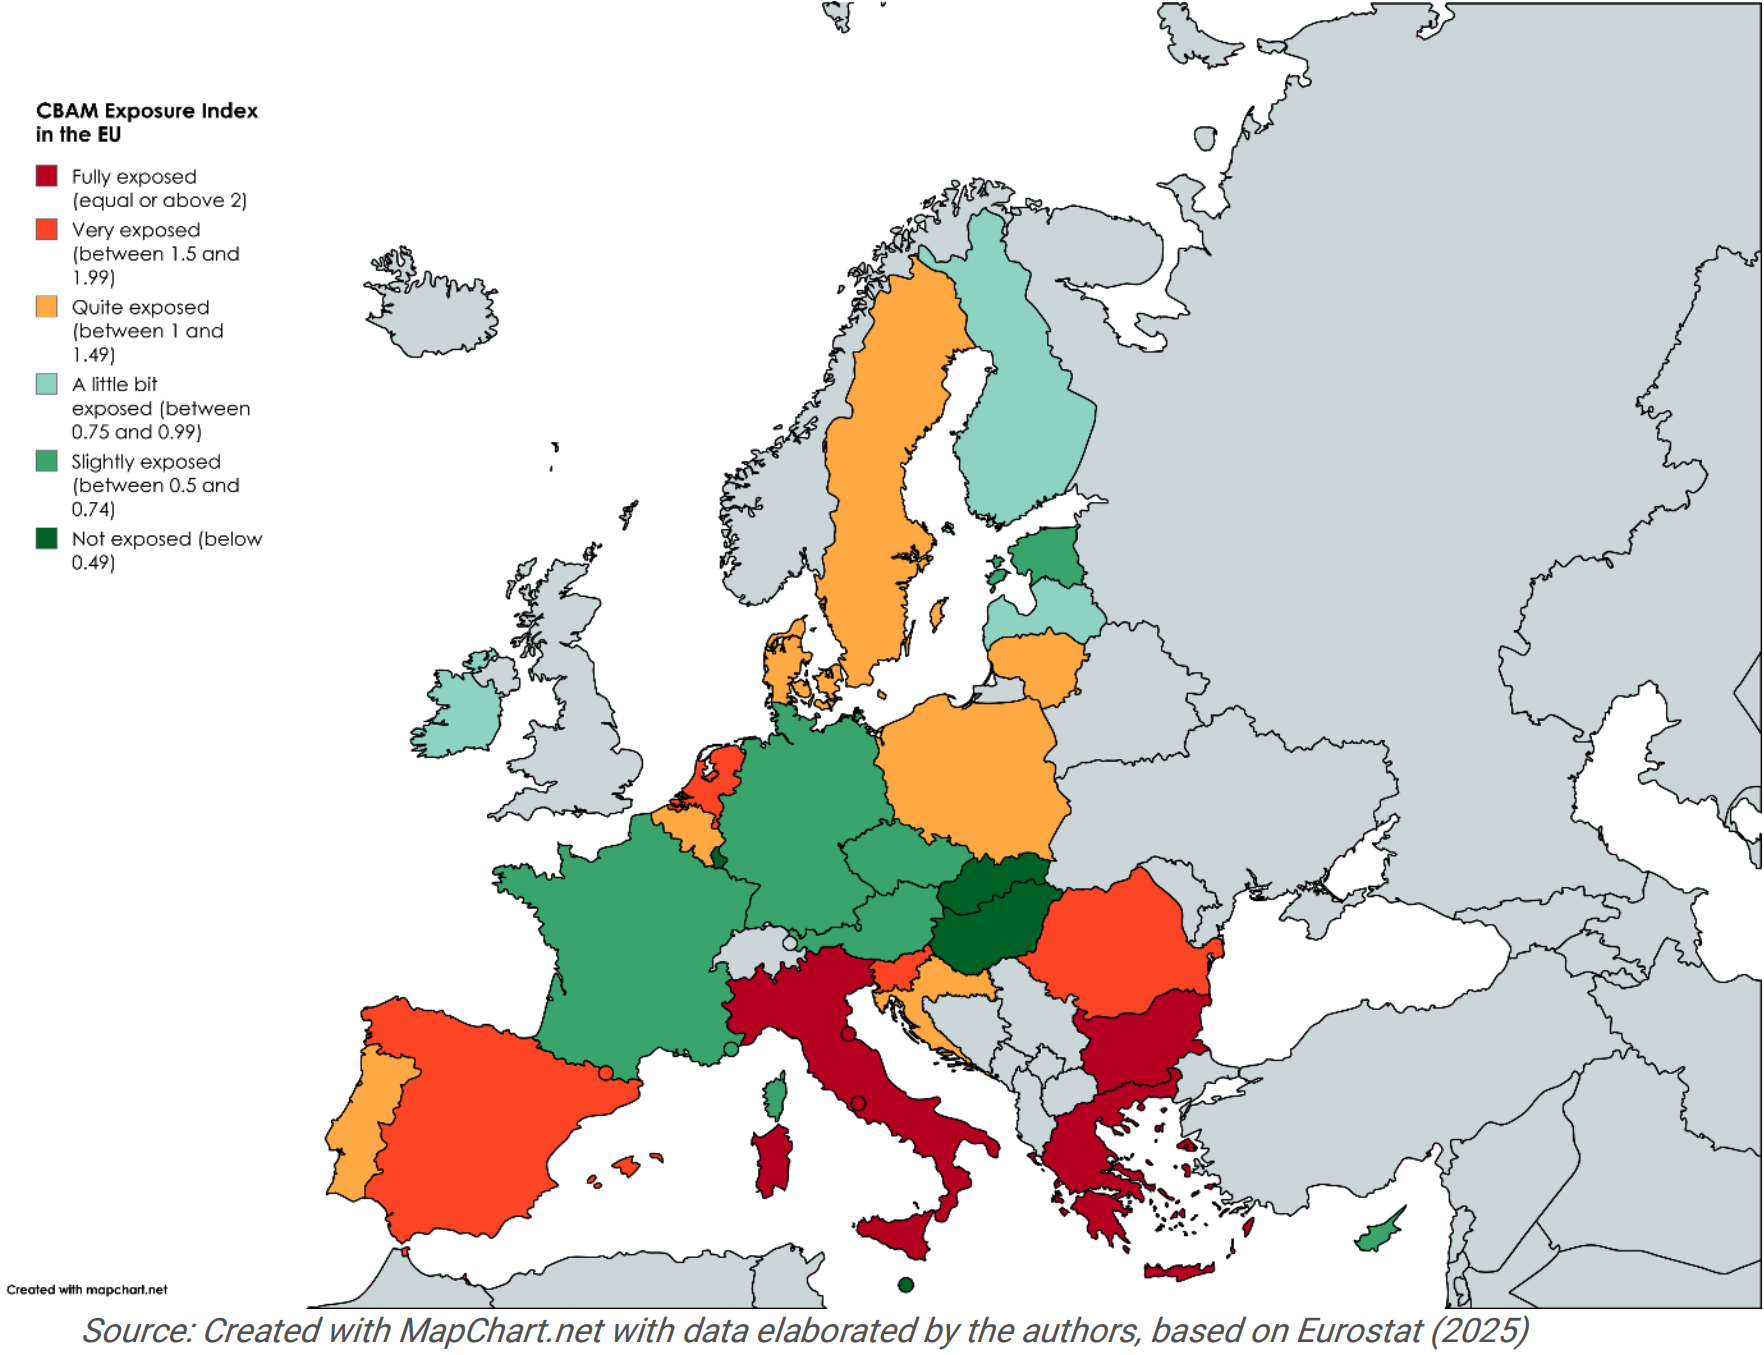
Figure 3. CBAM short-term exposure index. When red or orange, the Member State is likely to suffer more from implementing CBAM; when green or light green, the EU country is less exposed to the mechanism's direct effects (SPES, 2025)
However, In a study by Amendola, (2025), results showed that the intra-competitiveness of the European Union was unevenly distributed, with the Nordic countries showing a very small decline in GDP and Portugal and the Eastern European countries showing the highest loss in GDP. The same study showed that the Nordic countries have a low percentage change in production prices, compared to the rest of the EU countries, proposing a lower degree of exposure than SPES (2025).
5.2 Competitiveness in upstream and downstream industries
CBAM is expected to have two major effects on competitiveness; 1) Upstream effect: EU producers of goods covered by the CBAM (steel, aluminium, fertilizers etc.), can more easily compete on the EU market since imported materials will need to pay for embedded emissions. EU producers may hence increase their market share in the EU, see Figure 4. Exporters of materials covered by the CBAM are, however, not protected; 2) Downstream effect: EU producers of goods that are not included in the CBAM, but use significant amount of materials that are included (for instance vehicles using steel and aluminium or agricultural goods using fertilizers), will need to pay more for feedstock, thus making their products somewhat more expensive (The price increase on downstream products will however be much smaller than the price increase on materials included by the CBAM). The market share of downstream products in the EU may therefore decrease while imported goods may increase their market share due to lower production costs. Since EU produced goods using CBAM-included materials will become more expensive this may have a negative effect on exports. This could potentially lead to leakage - that EU producers move production outside the EU and that these products are imported. A remedy against this would be to include downstream products at risk (for instance vehicles and some agricultural products), in the CBAM scheme. This would, however, increase the complexity of the CBAM system.
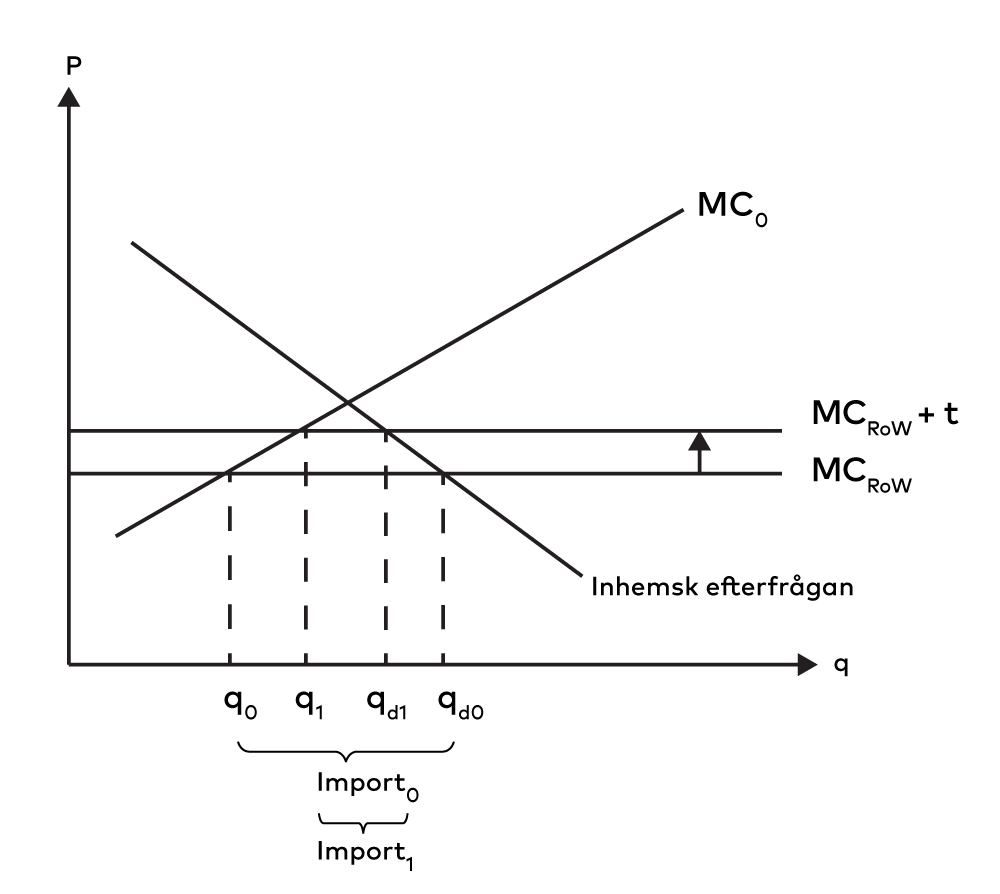
Figure 4. Effect on imports and consumption by introducing a CBAM (Dahlqvist et al., 2025)
In figure 4, MC0 is the marginal cost of production in the EU; “Inhemsk efterfrågan” is the EU demand for the product; and MCROW is the marginal cost of production in the world. We assume here that the world price is not affected by the EU. Without a CBAM, the EU will consume qd0, out of which q0 is produced in the EU and qd0–q0 is imported (Import0 in the Figure). With a CBAM, the world cost increases to MCROW+t, consumption will be reduced to qd1 of which q1 is produced in the EU and qd1–q1 is imported (import1 in the Figure) . In summary, the introduction of CBAM reduces total EU consumption of the product and simultaneously increases the share produced within the EU. As the cost of foreign production rises due to the carbon levy, imports decline, and domestic production becomes more competitive. This illustrates the core economic mechanism of CBAM: shifting demand toward lower-emission EU production while reducing reliance on carbon-intensive imports.
CBAM can address the competitive disadvantage of the European heavy-industry sectors relative to third countries’ sectors, caused by carbon pricing under EU ETS by aligning the price of embedded carbon in imports with the European carbon price, and thereby reducing the risk of carbon leakages. CBAM currently mainly covers basic materials in the value chain. This means that an analysis of the effects of CBAM roughly can be split in two: competitive gains in sectors covered by CBAM and production price increases in sectors downstream from the CBAM sectors.
5.2.1 Sectoral impacts of CBAM: Covered vs. downstream sectors
Industries covered in this study may see improved competitiveness where domestic production has lower emission intensity than that of imports from high-emission third countries. This effect depends on product composition and trading partners rather than on systematically different import patterns in the Nordic countries. When carbon pricing is introduced, the Nordic industries will be well positioned to supply low-carbon CBAM goods, which will boost competitiveness and therefore domestic production in the covered industries. An analysis by OECD (Dechezleprêtre et al., 2025) estimates that CBAM mitigates the economic impact of EU ETS, but only partially so; value-added losses caused by EU ETS in CBAM industries are reduced from -1.06% to -0.85% with CBAM. The reduced competitiveness in spite of the implementation of a Border Carbon Adjustment can be attributed to the fact that CBAM industries also consume CBAM-covered inputs and that downstream industries face increased production costs (A. Dechezleprêtre et al., 2025).
Downstream sectors encompass EU based companies that utilize CBAM-covered goods in their production process, such as wind turbine manufacturers importing steel for production. These non-covered sectors face increased production costs as prices of intermediary inputs rise, some of which will be passed onto customers (at least in the short run), resulting in a value-added loss and deterioration of competitiveness. This effect is small, but affects firms that make up 85% of the EU economy (OECD, 2025b). As a result of the price increase of CBAM goods, they might redirect consumption to domestic markets, as these have become relatively cheaper (Dechezleprêtre et al., 2025).
The positive effects of CBAM on covered industries are more pronounced than the negative effects on downstream industries, but the larger gains are distributed among a smaller number of covered firms than the smaller adverse downstream effects. As such, losses in downstream sectors almost perfectly balance out the gains in covered industries according to (OECD, 2025b). The opposing effects show on the sectoral level, too. For the iron and steel industry, which is covered by CBAM, losses resulting from the phase-out of free allowances under the EU ETS are almost three times lower with CBAM (-2.98% in value-added to -1%). These gains are contrasted by losses in the construction and machinery industry, which are among the most adversely affected (OECD, 2025b). The construction and machinery industry is a direct downstream industry from the iron and steel industry, and CBAM therefore raises production input costs, in some cases significantly. Because of this, it’s no surprise that covered industries typically lobby for a swift implementation of CBAM, while downstream sectors remain more critical of the policy. Figure 5 Illustrates this dynamic exemplified with iron and steel.
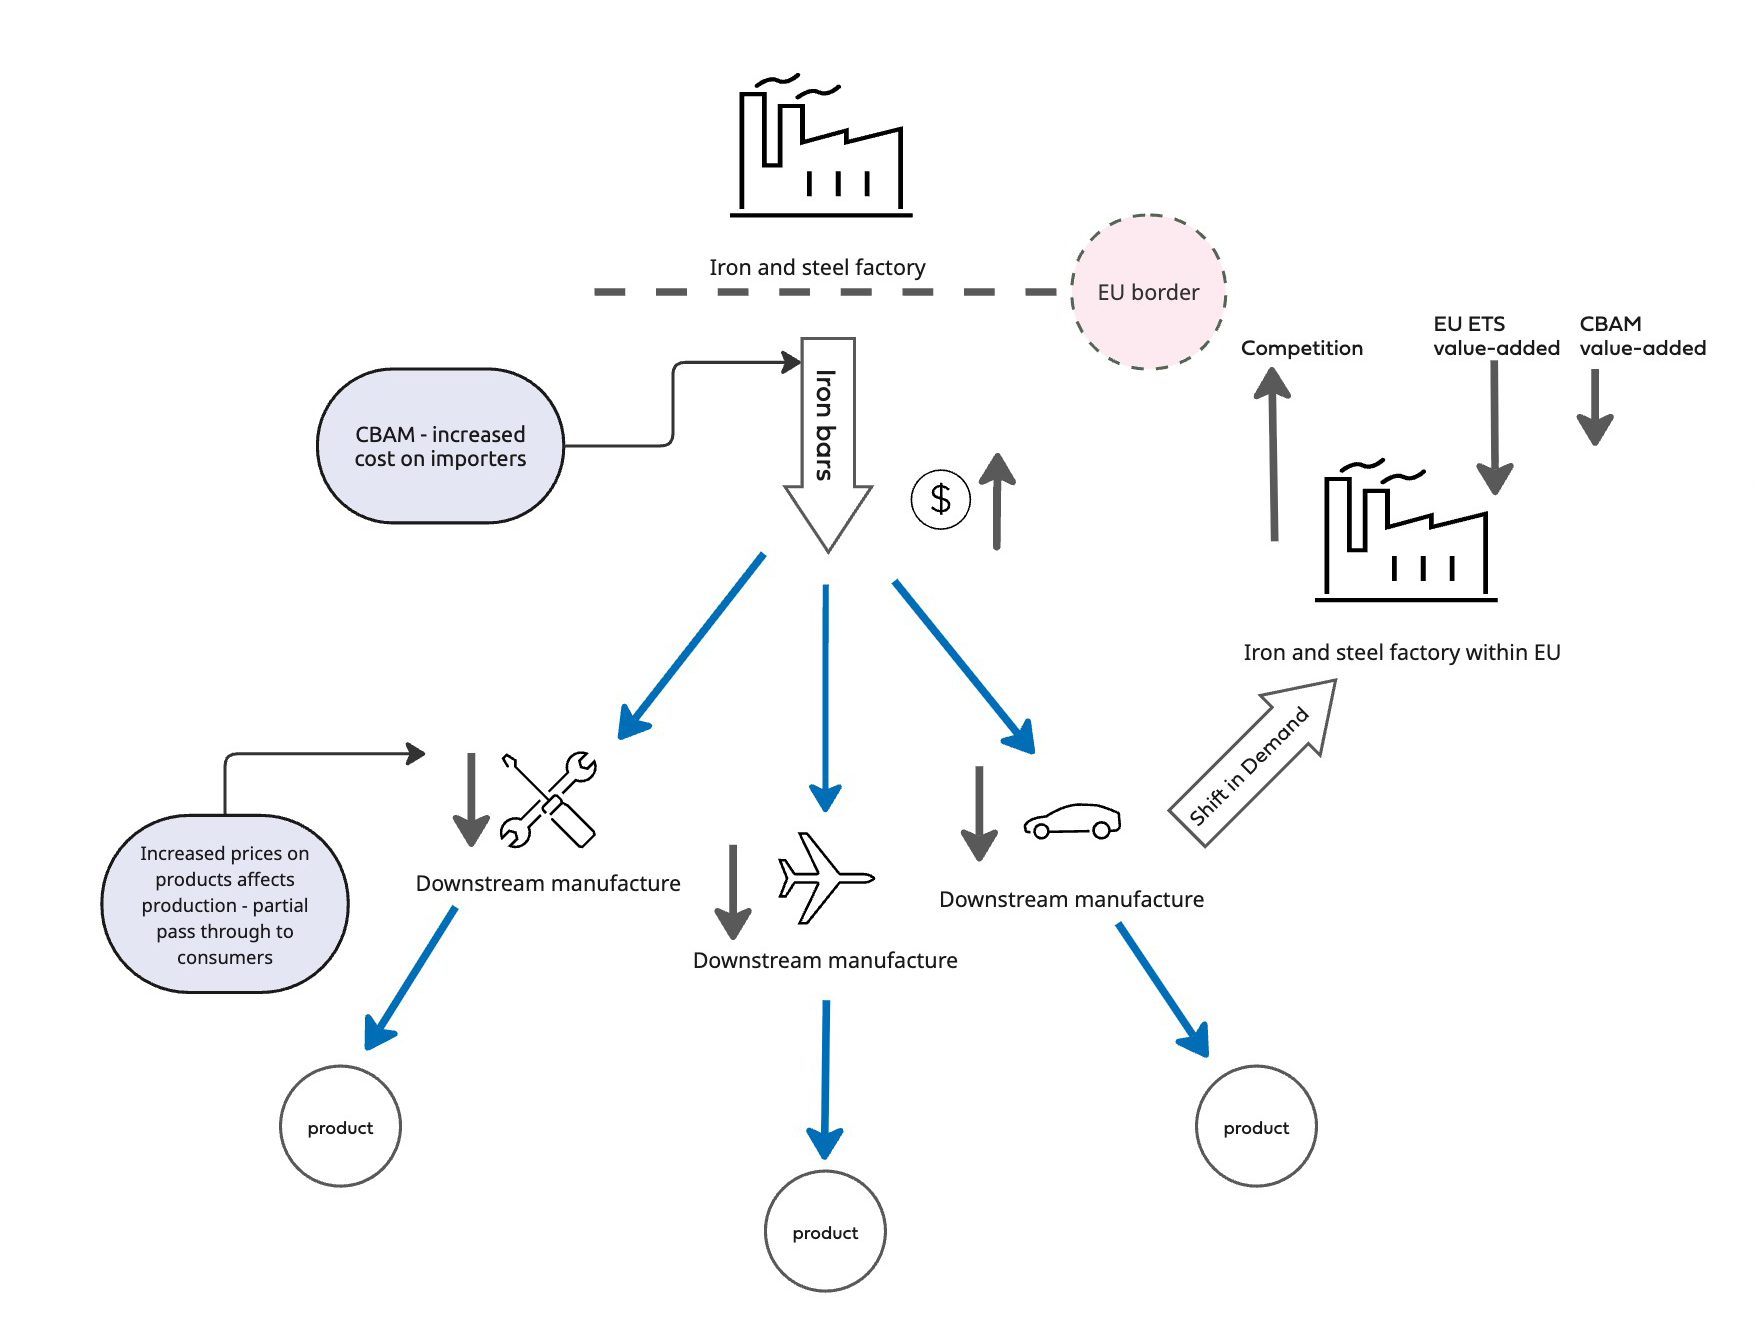
Figure 5. Illustrates the impact of CBAM across the value chain
5.2.2 Short-term and long-term perspectives
In the short term, economic adjustment is typically limited: factor inputs such as labour and capital, as well as technology, are largely fixed or only minimally flexible (Kenton & Potters, 2024). In contrast, the long-term perspective assumes that markets and production methods will adapt, with strategic changes focused primarily on maximising profits after the initial policy shock (Grant et al., 2023). Notably, the timeline for shifting from the short to the long run varies among producers, firms, and economies, depending on their size, ability to achieve economies of scale, and baseline technological capabilities—all of which influence how quickly they can move beyond the constraints of fixed inputs.
As CBAM directly influences the input prices of covered goods for EU producers, the short-run perspective primarily concerns shift in supply and demand through price mechanisms. In the short run, market conditions in upstream and producing sectors are likely to improve, as there is reduced competition in the production of CBAM-regulated goods. As a result, both CBAM producers and the suppliers of their intermediate inputs may benefit. However, it is noteworthy that this dynamic works to (partially) offset the negative impact associated with rising climate policy costs.
In the short run, downstream producers have limited ability to respond by altering their production processes or substituting intermediate products that are less affected by CBAM regulations. As a result, these sectors are likely to experience more significant negative impacts.
The extent to which increased downstream production costs are absorbed by the companies themselves, passed on to buyers, or shifted back to upstream industries depends on the relative elasticities of supply and demand along the value chain. The increasing prices will likely motivate intermediate input and consumption substitution towards less emission intense goods, as current input prices for producers importing emission-intensive CBAM products from non-EU countries will increase.
For the Nordic countries and less emission intensive production elsewhere, this means a competitive advantage, as their price on the market will be relatively cheaper than before. Additionally, sectors with low-carbon emission technologies will experience an increase in further investing in less-emission intensive technologies.
Long-run effects will depend on the adaptability of companies to the new regulation. In the long run, they might substitute inputs, collaborate with suppliers to green their production methods, develop and apply new technologies, use within-country reshuffling, backfilling and non-EU countries might implement new environmental laws (OECD, 2025b).
An example from the iron and steel sector, is the long-run adaptation from the Swedish steel production company SSAB, who is planning to shut down their blast furnaces (BOFs) and change their production to electric arc furnaces (EAFs), resulting in minimal carbon emission in their production by 2026 (SSAB, 2025). According to SSAB, this is a reaction to increased demand for sustainable steel production from companies, who want to label their products as low-emission products. According to Wu et al., (2023) investment in substitution of BOFs to EAFs in the steel industry is globally rising, partly as a reaction to the CBAM, indicating a global willingness to invest and adapt. Wu et al. (2023) estimate, that the share of EAFs in global steel production will increase from 28% in 2023 to 50% by 2050.
How much this will challenge the position of the Nordic countries as pioneers in low-carbon technological advancement, and thus their competitive advantage, depends on the level of further R&D investments, the effect of knowledge spill overs and the demand for continuously more low-carbon technology in the future (Miremadi et al., 2019). While Nordic companies might gain a competitive edge in the short and medium-term due to their lower emission-intensity of production, their production costs are still among the highest compared to the rest of Europe, with the scope countries positioning well above European average (Eurostat, 2025b). This might influence the Nordic countries competitive advantage in the long run, as countries with lower production costs have an incentive to increase public R&D and implement low-carbon measures, potentially gaining a greater share of the market.
Finally, it is important to note that the regulation is evolving gradually, initially manifesting as expectations of stricter policy and immediate administrative costs, with direct trade costs only arising at a later stage. Already now, reporting related to the CBAM can result in significant administrative costs for downstream companies importing the products. Obtaining and updating information on greenhouse gas emissions generated in the manufacture of countless products in different countries can be highly challenging. This could potentially influence trade significantly between the EU and third countries.
5.3 Implications for third countries and a just transition
Beyond its impacts within the EU, CBAM has important implications for third countries and global trade. These aspects are central to the environmental integrity and legitimacy of the mechanism and are discussed in this section.
5.3.1 Low-income countries
An important perspective in the discussion of CBAM concerns its implications for third countries, in particular low-income and capacity-constrained economies. While CBAM is designed to prevent carbon leakage and support the effectiveness of the EU ETS, it may also affect countries whose export structures are shaped by existing trade dependencies and limited access to capital and low-carbon technologies.
From the perspective of environmental integrity and the long-term legitimacy of CBAM, it is therefore essential that the mechanism is accompanied by policies that support a just transition at the global level. Without complementary measures, there is a risk that CBAM disproportionately affects countries with limited financial and technological capacity to decarbonise production, potentially reinforcing existing global inequalities.
These concerns have been repeatedly raised in international climate negotiations, including under the UNFCCC and at recent COP meetings, where the importance of climate finance, technology transfer and capacity-building has been emphasised as central to enabling developing countries to participate in the global transition. In line with these discussions, several EU Member States, including Sweden, have highlighted the need for the EU to use trade policy as a tool to support global decarbonisation while strengthening climate-related development assistance and investment frameworks.
Strengthening and better targeting climate finance, technical assistance and investment support for low-income countries could help ensure that CBAM contributes to global emissions reductions rather than merely shifting trade patterns. Such complementary measures may also enhance the legitimacy of CBAM and support its stated objective of encouraging cleaner production practices beyond the EU.
5.3.2 Global trade flows, carbon leakage risks and international coordination
Beyond its effects on the EU and individual Member States, CBAM also has implications for international trade flows and global carbon leakage risks. While the mechanism is designed to prevent carbon leakage into the EU, there remains a risk that production of carbon-intensive goods could shift to regions without carbon constraints and be redirected towards non-EU markets, rather than leading to global emission reductions. Addressing this risk is essential to ensure that CBAM contributes to environmental integrity at the global level, rather than merely redistributing emissions geographically.
From a strategic perspective, preventing global carbon leakage requires complementary international engagement alongside CBAM. This includes encouraging third countries to develop and implement their own carbon pricing mechanisms or equivalent climate policies, thereby reducing asymmetries in carbon costs across markets. In this respect, CBAM may serve as an external incentive for climate policy adoption, but its effectiveness depends on broader international coordination rather than unilateral EU action alone.
The EU and Nordic countries can support this process through a combination of trade policy, climate diplomacy and targeted support measures. These may include technical assistance, capacity-building and climate-related investment support to help third countries develop carbon accounting systems and low-carbon production technologies. Such efforts are increasingly discussed in international forums, including under the UNFCCC, and are consistent with EU and Swedish policy objectives to use trade policy as a lever for global decarbonisation.
Strengthening international coordination on carbon pricing and climate policies could also reduce the need for export support mechanisms for EU industries subject to the EU ETS. As long as carbon cost asymmetries persist, there may be continued pressure to compensate EU producers facing higher carbon costs, particularly through transitional and temporary support measures. Over time, broader international adoption of carbon pricing would help level the global playing field and reduce reliance on such compensatory instruments. For the Nordic countries, which are highly trade-exposed and strongly integrated into global value chains, these international dynamics are particularly relevant for the long-term effectiveness and legitimacy of CBAM.
5.4 Impact on national trade and emissions
CBAM increases prices of imports of emission-intensive products, and thus eliminates the possibility of substituting EU products subject to carbon prizing with cheaper, more emission intensive imports from unregulated regions (Kittel & Fahl, 2025). The tariffs result in an increase in demand for intermediate emission-intensive products produced in the EU, which drives EU companies to specialize in carbon intensive-industries, which can increase emissions nationally (Mendoza et al., 2024). This means that production is expected to shift from countries with more emission-intensive production to countries with low CO2 emission intensity. While this is anticipated to result in a reduction in overall CO2 emissions, this could mean a small and temporary increase in national emissions in the Nordic countries, if their emission intensity of production is lower than the EU and world average.
As the policy puts a price on carbon emissions, trade balances likely will shift globally – imports to the EU will be reduced, while the consumption of EU-produced products will increase. Third country trade partners which might have had lower production costs (not including the carbon cost) than the EU average, might lose or decrease their cost advantages as a result of the carbon pricing induced by CBAM, as illustrated by figure 6. It is important to note, that while some production is expected to shift due to the price signal induced by the CBAM, overall consumption is likely expected to lower to some degree, due to the increase in prices on CBAM products (Cammeo et al., 2025).
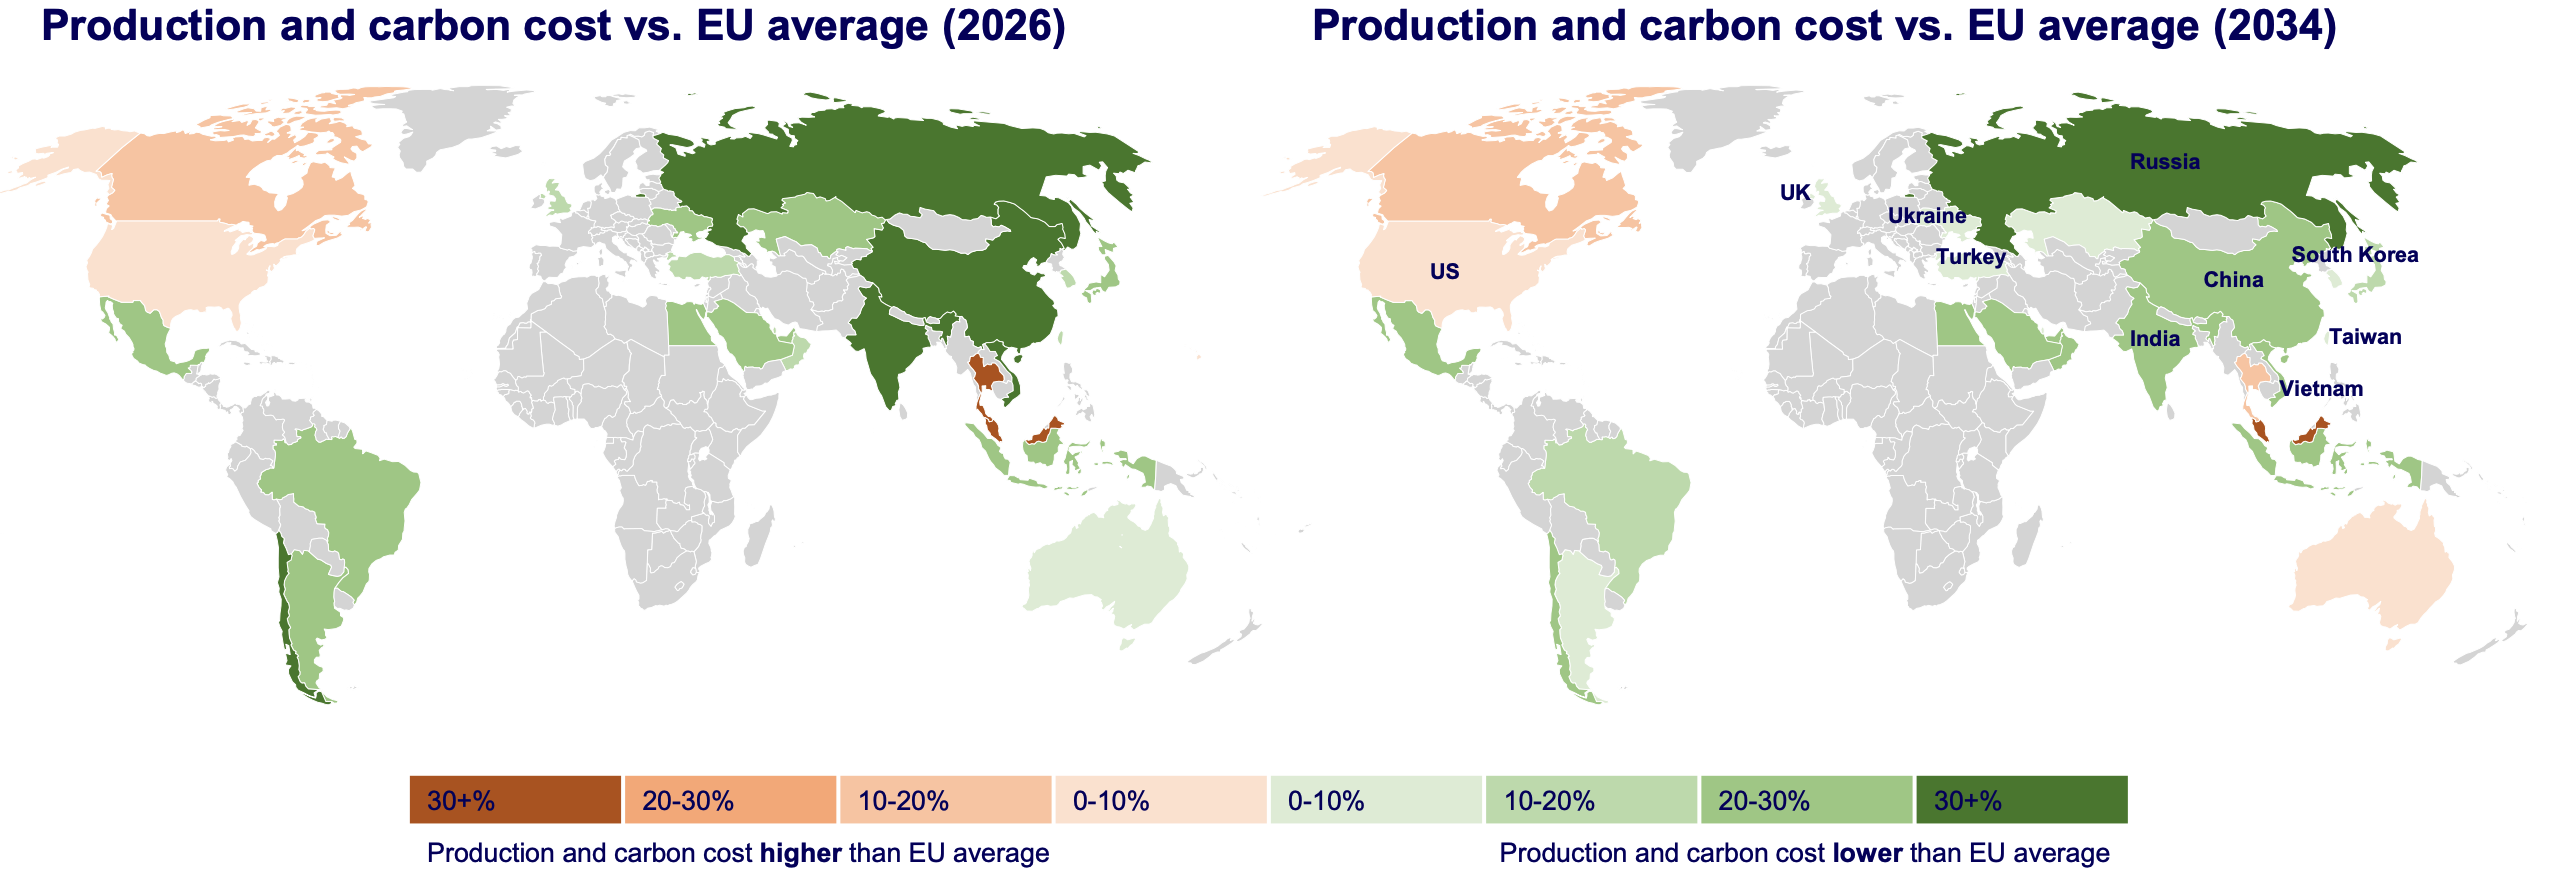
Figure 6. Shows how as CBAM is phased in, cost advantages shift toward countries with lower emission intensity of production (Wood Mackenzie, 2023a)
The Nordic countries have, in some cases significantly, higher industrial production costs than the EU average due to higher wages (Eurostat, 2025b), higher land prices, and more stringent regulation (CCPI, n.d). For CBAM to significantly increase production in the Nordics, the carbon price must be high enough to considerably shift demand to low-emission production, in which case the Nordic countries will have a comparative advantage despite higher production costs. In these cases, the Nordic countries may benefit from early investments in low-emission technologies and industrial innovation, supported by EU-wide climate regulation under the EU ETS as well as national energy and innovation policies. While emission standards for CBAM sectors such as iron and steel are largely harmonised at EU level, some Nordic producers have been early movers in adopting low-carbon production technologies, which can translate into a comparative advantage at higher carbon prices. Therefore, higher carbon prices can increase demand for Nordic heavy industry production despite their relatively higher production costs.
5.4.1 Export rebates
As the current design of CBAM only covers imported goods, companies importing carbon-intensive intermediate goods for production will experience a decrease in competitiveness when exporting outside of the EU. This leads to an increased risk of carbon leakage for EU-producers. Economic analyses have shown that expanding the mechanism to cover both imports and export could more effectively prevent carbon leakage (see e.g. Ambec et al., 2024; Cammeo et al., 2025). Since CBAM increases production costs in the EU, export companies could be offered compensation or a refund for emissions costs to compete fairly in international markets. This could mean partial refunds of carbon costs to companies exporting to countries without carbon pricing. However, including exports in the system could bring additional legal challenges in complying with WTO rules (Kuusi et al., 2020).
In July 2025, the European Commission announced a plan to address the risk of carbon leakage for exporters in CBAM. The proposal was expected to be made by the end of 2025, but was not yet made public by the finalisation of this report.
5.5 Sector-specific considerations
This section examines how CBAM affects key emission-intensive sectors in Finland, Sweden and Denmark—fertilizers, iron and steel, aluminium, and cement. The analysis focuses on trade exposure, emission intensity, and sectoral readiness for decarbonisation, while also outlining how CBAM may influence competitiveness and investment decisions. The depth of analysis varies across sectors and countries, reflecting differences in economic relevance and the availability of sector-specific data in the Nordic context.
5.5.1 Fertilizer
Fertilizer production is one of the most energy intensive industries in the world, being responsible for 3%–5% of global natural gas consumption every year (Song et al., 2018). CBAM includes five categories of fertilizers: nitric acid, ammonia, potassium nitrate, mineral or chemical nitrogen fertilizers and compound fertilizers (Martinez, 2025). The EU has about 120 fertilizer plants, which accounts for 8% of global nitrogen production – about one third of this production is for export markets (Fertilizers Europe, 2023; Martinez, 2025). Despite this significant domestic production, EU imports 45%, 46%, and 58% of its consumed inorganic nitrogen, phosphates and potash nutrients respectively (Carbon Trust, 2025).
Low-carbon alternatives to the emission-heavy production processes exist, but due to higher production costs, the scale of these technologies is often limited. However, with the price signal from EU ETS, low-carbon technologies such as fertilizers based on green ammonia which is produced from hydrogen derived from decarbonized energy are expected to become more profitable, which will result in a scaling-up of production (Martinez, 2025). This scaling up will ultimately provide economies of scale and consequently lower costs and reduce emissions in the sectors value chain, while continuing to encourage innovation in lower-carbon technologies, which can provide innovative startups with business opportunities (Carbon Trust, 2025). However, these opportunities will also require investments and upfront costs, which means higher prices in the short term. Importers of fertilizers might either substitute current suppliers with lower-carbon alternatives or support existing supplies in decarbonizing production, in a process known as ‘insetting’. This means higher prices in the short term, but in the long term these partnerships can enhance sustainability and supply-chain resilience, reduce the cost of CBAM certificates and improve the supplier's competitiveness while importers can gain reputational benefits due to positioning as leaders in a greener future (Carbon Trust, 2025).
The upstream/downstream effects described in section 3.2 are expected to be seen with the introduction of CBAM in the fertilizer sector, with the most prominent downstream sector being agriculture. Fertilizers represent about 6% of farmer input costs and up to 12% for arable crops farmers (European Commission, 2022b). Consequently, the agricultural sector could see rising prices from the increase in the price of fertilizers resulting from a carbon pricing on imports through CBAM, affecting farmers’ margins and/or be passed along the value chain to processors, distributors and consumers (Martinez, 2025).
All three scope-countries have emission intensity of fertilizer exports that are lower than the EU average (although Denmark currently does not have any production plants) (Jacob Jensen & Ida Auken, 2024). Because of this, it is expected that EU market fertilizer demand will shift in favour of production in the Nordic countries, and that production is further encouraged to implement greener technologies.
Denmark
Denmark imports and consumes a significant amount of fertilizer, since the country has not had a domestic production of synthetic fertilizer since 2004 (Jacob Jensen & Ida Auken, 2024). However, Denmark do have some production of organic fertilizers, e.g. from the company Daka, that produces fertilizers from bonemeal from Danish farm animals (Daka, n.d). Between 2018 and 2022 Denmark imported an average of 15% of fertilizers from outside the EU, the majority of which came from the Russian Federation (Chatham House, n.d.-a). Since Denmark does not have any synthetic fertilizer production, no upstream industry gains in competitiveness from the price alignments provided by CBAM will be seen. Moreover, the impact on national production-based emissions will virtually be non-existing.
Finland
The Finnish fertilizer market has traditionally operated somewhat independently from the rest of Europe, relying mainly on domestic production and imports from Russia (Luukkonen, 2023). A significant challenge for the sector is the import of nitrogen sources, particularly ammonia, from abroad—especially from Russia—which renders Finnish fertilizer production highly dependent on foreign raw materials. Efforts to diversify import sources have aimed to improve both the supply and availability of fertilizers.
Finnish fertilizer CBAM imports were valued at €693 million from January 2022 to September 2024 (Kaitila et al., 2025), of which €66 million would likely be under the forthcoming CBAM, mostly products coming from Russia.
In a general equilibrium assessment (Kaitila et al., 2022), the authors forecasts a decrease in imports from non-EU sources, notably Russia, and a corresponding increase in intra-EU trade. The imports of fertilizers could decrease by several dozens of percent, depending on the carbon pricing and the inclusion of indirect emissions. Kaitila et al. (2025) shows that there is a significant decline in the trade of Fertilizers in the inception period of the CBAM 2023 q4 onwards, coinciding with the predictions of the pre-impact assessments. This effect may, however, partly reflect the war in Ukraine despite that the methodology controls for external factors. Finally, a survey for Finnish firms suggests that the future expectations of the producer firms are aligned with these changes (Kaitila et al., 2025).
The reduction in imports would likely lead to an increase in domestic production of fertilizers within the EU, including Finland. The modelling results suggest that the production of fertilizers in Finland could increase as domestic producers benefit from reduced competition from non-EU imports. The increased costs may lead to higher prices for agricultural products and reduced competitiveness for Finnish farmers (Sivill & Länsisalo, 2025).
Sweden
Sweden has no domestic production of fertilizers, and imports approximately 750,000 tonnes per year from mainly Germany, Poland, France and Spain. 22 percent is imported from Russia and Belarus (Naturskyddsföreningen, 2023). Since Sweden as Denmark does not have any synthetic fertilizer production, there is no upstream industry that gains in competitiveness from the CBAM price alignments. Moreover, the impact on national production-based emissions will be non-existing.
5.5.2 Iron and Steel
The iron and steel industry is one of the most energy- and emissions-intensive sectors globally, and accounts for 7–9% of global anthropogenic CO2 emissions, (Worldsteel, 2021). Steel is a cornerstone of construction, transportation, industrial equipment, and appliances, and is vital in the production of wind- and solar power (European Commission. Joint Research Centre., 2020). Due to this high strategic importance, iron ore (of which 98% is used in steelmaking) is classified by the European Commission as a ‘critical raw material’. Although steel is highly recyclable and can be recycled many times without losing quality, global steel production has more than doubled between 2000 and 2018 (Springer & Hasanbeigi, 2019). This can be attributed to the high degree of global industrial and population development occurring over the past 20 years. The increase in demand and supply and subsequent increase emissions is therefore a critical focus of CBAM.
As mentioned in the introductionary chapter, most primary steel in the Nordics is produced via the BF–BOF route. EAF’s are also present and increasingly used. The Nordic region currently hosts three integrated steel plants and a number of EAF-based facilities. Importantly, several Nordic steel producers have announced or initiated major investments in fossil-free steelmaking, positioning the region as a potential frontrunner in decarbonizing this sector. The Nordic steel market is distinguished by a strong emphasis on the production and export of high-quality, specialized steel products, while simultaneously relying on imports of lower-grade and commodity steel to meet broader domestic demand.
Steel production in the Nordic countries—particularly in Sweden and Finland—is highly advanced and capital intensive, with a focus on niche products, high-strength steels, and customized steel solutions for sec- tors such as automotive, engineering, and construction. These value-added steel products are primarily exported to European and global markets, supported by strong industrial R&D and investments in fossil-free steel technologies. At the same time, the Nordic region imports a significant share of lower-grade, mass-produced steel, such as rebar, standard coils, and sheets. These imports typically come from countries with lower production costs and environmental standards, including some outside the EU.
While the carbon price encourages a green transition of production, both domestically in the EU and in third countries, a price increase in downstream intermediary and end products is to be expected. While the price signal might encourage a green transition of the industry itself, iron, steel and aluminium are core components of the building blocks of the green transition, such as renewable energy infrastructure, electric vehicles and charging points. A price hike throughout the steel supply chain can therefore increase the cost of the European green transition, potentially slowing it down (Carbon Trust, 2025; Wood Mackenzie, 2023a).
Denmark
Unlike Finland and Sweden, Danmark has no domestic iron extraction or large heavy industries to sell steel to. Therefore, mass-scale production is less present, as high wages makes generalized mass-production costly. Because of this, the Danish metal industry is characterized by a strong focus on highly specialized niche production, where large multinational players might not be present due to the size of the market. The industry has specialized, automated and refined these niches and has thus been able to maintain competitiveness (Jern- og Maskinindustrien, 2019). The key players of the Danish steel industry Is NMLK Dansteel and Duferco Danish Steel. However, in June of 2025 the closing of Durfercos Danish production site was announced, as a result of almost two decades of economic deficiency (Nørgaard, 2025). The administrative director of Duferco adds that it is part of a European trend in the iron and steel industry that the rise of input prices are putting the industry at risk and force factories to close their production (Nørgaard, 2025). As of now, NMLK Dansteel is still in production, but as the main part of their import is from the Russian Federation, they will be necessitated to shift their imports by 2028, where EU sanctions against import of Russian products will take place (Dietrich et al., 2024).
Despite the high value-added nature of Danish steel products, the industry remains sensitive to increases in input prices. This vulnerability stems from Denmark’s strong reliance on imported raw materials and semi-finished steel, as the country has no domestic iron extraction and limited large-scale production capabilities. The recent closure of Duferco Danish Steel in 2025 underscores this sensitivity, with rising input costs cited as a key factor behind the decision.
Since CBAM places a price on carbon-intensive imports—many of which originate from outside the EU—Danish producers are likely to face higher procurement costs than their Nordic counterparts. While niche production offers some competitive resilience, the industry may require access to low-carbon supply chains and supportive policy instruments to maintain its current position in specialised market segments.
Finland
The production of iron and steel in Finland is a significant industrial sector with a long tradition and a central role in the country’s economy. Most of the output consists of steel products, which are widely used in construction, infrastructure, and various industrial applications. Finland’s steel industry is shaped by two major producers, SSAB Europe and Outokumpu, both operating significant plants in Finland and aiming to contribute to the green transition. SSAB Europe produces carbon steel and runs Finnish plants in Raahe and Hämeenlinna, with annual employment more than 3,700 persons in Finland. Its global production capacity is about 8.8 million tonnes per year, and it specializes in advanced steels, strip products, and quarto plate. Although SSAB is a carbon-steel producer, it is also a frontrunner in developing fossil-free steel. Outokumpu focuses on stainless steel, with its Tornio plant employing around 3,000 persons and producing roughly 2 million tonnes of stainless steel per year. Outokumpu is the largest stainless-steel producer in Europe and the second largest in North America, and its production is strongly based on circularity, relying on recycled materials for about 95% of its inputs (Karvala, 2025).
According to Kaitila et al. (2025), import value in the iron and steel sector CBAM products stood at €6,070 million from January 2022 to September 2024, of which imports considered to be subjected to tariffs represent around 20%. Main non-EU exporters (according to 2021 data) were Russia (6.2%) and China (3%) (Kaitila et al., 2022). Overall, since 2021, there has been a decline in the imports of the iron and steel products to Finland.
Only a small share of the sector’s production is exported (Berg-Andersson et al., 2025). In January 2025, exports of metal products were significantly lower than expected, shrinking by one fifth compared to the previous year. However, exports are anticipated to return to slow growth in 2025. In 2024, the most important export country was Sweden, with a share of 20 percent, followed by the United States at just under 7 percent. Indonesia’s share was almost as large.
According to Kaitila et al. (2022) CBAM has substantial implications for the iron and steel industry, which is among Finland’s highest emitters. The modelling results indicate that the imports of iron and steel products could decrease by several dozens of percent, depending on the carbon pricing and the inclusion of indirect emissions. The reduction in imports would likely lead to an increase in domestic production of iron and steel products within the EU, including Finland. The modelling results show that the production of iron and steel products in Finland could increase significantly as domestic producers benefit from reduced competition from non-EU imports.
Iron and steel serve predominantly as intermediate goods within machine manufacturing industries. The production costs—and consequently, the output prices—of goods produced by the engineering sector are expected to increase somewhat more than in other sectors due to the CBAM, according to Kaitila et al. (2022). As a result, exports of machine manufacturing are projected to decline to a greater extent than those from other industries, although the differences are not substantial.
This phenomenon is particularly evident in the observed reduction in electronics industry exports. It should be noted that these export impacts do not incorporate the effects of phasing out free allocation; should the removal of free allocation be considered, exports from Finland to regions outside the EU would likely decrease more than the estimates presented here.
Sweden
Sweden has three ore-based steel plants and eleven steel plants using only scrap iron. In 2024, Sweden produced 4.0 million tonne pig iron (0.2 percent of global steel production), of which 2/3 came from iron ore and 1/3 from scrap. For comparison, the EU produced 126 tonnes of steel and the world 1.9 billion tonnes of steel in 2023. Sweden’s production focuses on high performing steel making it less sensitive to international competition than, for instance, construction steel. Most of the steel, 2.8 Mt, is exported. The value of the exported steel was in 2024 SEK 60.9 billion (EUR 5.5 billion), which accounts for 2.9 percent of Sweden’s total export value. Approximately 67% of exported steel goes to the EU and Great Britain. The largest countries outside EU and UK to which Sweden exports steel are USA and China.
The transformation of Sweden’s steel industry is currently in the emergence phase, where early technological breakthroughs, pilot projects, and experimentation are shaping a potential shift away from traditional coal-based production processes. While it is too early to assess the effectiveness of policy mixes, recent developments suggest that this transition has gained significant momentum. In 2016, SSAB—the largest Swedish steel producer—announced plans to replace coal with renewable hydrogen through the HYBRIT initiative, launched in collaboration with LKAB and Vattenfall. Since then, pilot-scale hydrogen-based direct reduction facilities have been developed and plans for full-scale production and hydrogen storage are progressing, with low-carbon steel deliveries targeted for 2026.
These efforts have spurred parallel initiatives from other steelmakers in Europe and new entrants like Stegra (formerly H2 Green Steel), which is investing directly in a full-scale greenfield plant using hydrogen-based steel production in Boden.
The EU ETS is the main policy instrument for transforming industry and with EU:s climate package Fit-for-55, the price of emissions allowances has risen to approximately 70 Euros per ton. With a price of 100 euros or more, low-carbon steel will be able to compete with traditional steel. Also critical for creating a favourable business case for low-carbon steel is that free allocation is phased out for traditional steel making (based on blast furnaces using coke and coal to reduce iron ore). This in turn depends on the phase in of CBAM. Without an effective CBAM in place there is a risk that European low-carbon steel production will not be able to compete with imported steel.
5.5.3 Aluminium
Aluminium plays a vital role in the production of solar- and wind energy, batteries, construction and transportation (Berg-Andersson et al., 2025). Demand for aluminium is projected to rise with almost 40% by 2030, partly driven by population growth and demand from the transportation, construction and energy sector (Aleksic & Vargas, 2023). Higher demand for aluminium in developing countries is also a contributing factor to the trend (Hasanbeigi & Springer, 2025)
Aluminium has a heavy impact on the climate, accounting for approximately 2% of total global carbon emissions (Hasanbeigi & Springer, 2025). Aluminium is produced from the raw material Bauxit, which is primarily mined in Australia, accounting for 30% of global production, and China accounting for 19% of global production (Farjana et al., 2019). Aluminium production can be categorized in two different production processes: The primary and the secondary production. Primary production includes refining and smelting of Bauxit ore to produce aluminium, whereas the secondary production includes the recycling of existing aluminium scrap. The primary aluminium production is highly energy intensive and 90–95% more emissions intense than the secondary production (Hasanbeigi & Springer, 2025). The smelting process, that includes alumina refinement and electrolysis, are the part of aluminium production that has the highest impact on the climate due to its high consumption of energy (Farjana et al., 2019). The smelting process accounts for almost 70% of the overall emissions generated in aluminium production (World Economic Forum et al., 2024). Although aluminium production is emissions intensive, the recycling of aluminium is very effective, and can be reused many times. According to Stena Recycling, 75% of all aluminium that has ever been produced, are still in use (Stena Recycling, n.da).
Denmark
Denmark has no primary production of aluminium, and imports all of its aluminium, with Norway, Sweden and Germany being the top exporters (Hasanbeigi & Springer, 2025). There is currently no official data on the Danish market share of aluminium, but the aluminium industry is a notable actor in the Danish industry. The Confederation of Danish Industries hosts “Aluminium Danmark” with more than 70 members from the Danish industry. The key player is the Norwegian company Hydro (with extrusion sites in Denmark). Hydro is the biggest aluminium producer in Norway and has two extrusion sites in Denmark, that makes aluminium profiles primarily for the Danish and German market (Hydro, 2025). They produce 25,000 tonnes of aluminium yearly and employ around 700 people in Denmark. The Danish aluminium industry is characterized by production of aluminium profiles and castings. As a significant portion of the Danish household electricity is covered by wind- and solar power, and as the Danish government are working towards 100% liability on green energy, the demand on aluminium in Denmark will likely rise with the demand of wind turbines and solar panels (European Commission. Joint Research Centre., 2020; Klima-, Energi- og Forsyningsministeriet, 2024a).
As Denmark does not produce primary aluminium domestically, Denmark will not experience CBAM-related competitiveness gains in upstream production. Instead, the effects of CBAM will primarily be felt in downstream manufacturing, where aluminium is processed into profiles and castings. Demand for aluminium is likely to increase significantly as Denmark expands renewable energy infrastructure, particularly wind turbines and solar panels. This could strengthen the role of the Danish aluminium sector in the green transition, but it may also amplify exposure to potential cost increases from CBAM-regulated imports. The industry may therefore require access to low-carbon aluminium supply chains or incentives for recycled aluminium to maintain competitiveness and support the deployment of climate technologies.
Finland
The projected growth in primary aluminium production in Finland is contingent upon the plans to establish a large-scale, low-carbon aluminium plant planned in Kokkola. Prior to the commencement of operations at this plant, Finland has not engaged in primary aluminium production; instead, the country has relied on imports of aluminium from abroad.
According to Kaitila et al. (2025), the aluminium sector’s import value in CBAM products stood at EUR 1,920 million from January 2022 to September 2024, of which imports considered to be subjected to tariffs represent around 11%. Previously, China and Russia have been the main non-EU importers (Kaitila et al., 2022). Since the war in Ukraine, imports from Russia and China have declined, in favour of EU sources.
Based on the previous impact assessment that used a general equilibrium modelling, the reduction in imports would likely lead to an increase in domestic production of aluminium products within the EU, including Finland. The modelling results suggest that the production of aluminium products in Finland could increase as domestic producers benefit from reduced competition from non-EU imports. A survey for Finnish firms suggests that the future expectations of increase in production in Finland are neutral (perhaps reflecting the current situation with few domestic production), while there is an expectation of decline in production outside the EU. (Kaitila et al., 2025)
Sweden
Sweden has one producer of primary aluminium – KUBAL in Sundsvall – where aluminium is produced from aluminium oxide through electrolysis. The production capacity totals 135,000 tonnes of aluminium annually, which is 2 percent of the global production. Kubal is owned by Rusal a Russian aluminium producer (Rusal, n.d.). All produced primary aluminium from Kubal is exported. There are two Swedish producers/exporters of aluminium profiles and one exporter of rolled aluminium. These producers only use imported primary aluminium for their needs, not aluminium from Kubal (Frisk, 2025). Sweden recycles approximately 60,000 tonnes (Sveriges geologiska undersökning, n.d). In addition, Stena recycling produces 70,000 tonnes of aluminium from scrap (Stena Recycling, n.db)
There is no Swedish official data on imports and exports of aluminium for Sweden, the reason being that there are only 4 producers of primary aluminium and aluminium products in Sweden. Statistics Sweden is not allowed to compile aggregated data from firms if this would risk revealing firm specific data. Statistics on aluminium, copper and nickel does exist in aggregated form, but this cannot be disaggregated into separate metals. According to United Nations COMTRADE data base, Sweden imports primary aluminium and aluminium products worth approximately EUR 2 billion. Main countries of origin are China EUR 32 million; Italy, EUR 17.6 million; EUR Poland 16.3 million; and Germany EUR 15.6 million.
5.5.4 Cement
Cement is used to produce concrete, which is a crucial material globally in construction and establishment and maintenance of infrastructure. Cement manufacturing is one of the most polluting industries globally, accounting for about 6% of global CO2 emissions (World Economic Forum et al., 2024). Cement is manufactured from raw materials, mainly limestone, that is transformed to clinker by a process that heats limestone to 1,450 degrees, making the process very energy intensive and releases carbon during the process, which accounts for 88% of the overall emissions related to the production of cement (World Economic Forum et al., 2024). Mitigating emissions in the production process is tricky and requires fundamental changes to the manufacturing process. However, several abatement technologies exist, such as Carbon, capture and geological storage (CCS), using hydrogen for heat, increasing biomass in the fuel mix and using non-fossil based supplementary cementitious materials (SCMs) (Cembureau, n.d; World Economic Forum et al., 2024). Cement is a dense and relatively cheap material, readily available worldwide. The cost of producing low-carbon cement is almost twice as high as producing traditional cement. However, the cost increase of, for instance, an apartment built with low-carbon cement is marginal – less than 0.5 percent (Rootzén and Johnsson). This is due to the fact that cement is a relatively cheap material that accounts for a minor part of the total cost of a building. As with low-carbon steel, a carbon price of 100 euros per tonne CO2 or more would be required for low-carbon cement to be able to compete with traditional cement. In addition, a phase out of free allocation in combination with a phase in of CBAM is needed to avoid carbon leakage and imports of cement produced in a traditional way.
Only five percent of the world’s cement production is traded on an international market. China accounts for 55 percent and India for 7 percent of the global cement production (Malaga, n.d). The low level of trade in cement is partly due to the non-viable trade-off between transportation costs and the unit value of good transported, unless it is bulk transported by ship (Cembureau, n.d).
In a proposal in favour of CBAM by The European Cement Association (CEMBUREAU, 2021), trade statistics of cement show a significant increase of imports from non-EU countries of 160% between 2016–2020. Cembureau note, that this probably is the product of a “New business model”, where clinker is produced outside of EU, and then imported to grinding installations placed at the border. According to 2023 data from Eurostat, main importers of cement and clinkers into EU is Turkey (35.8%), Algeria (19.2%) and Ukraine (12.6%) (Cembureau, 2024). The leakage risk here, is applied to Algeria and Ukraine. Taking Ukraine as the example, looking at trade data, the trade flow between 2017–2022 for exports of cement from Ukraine has increased significantly (Chatham House, n.d.-a). Imports from Ukraine to four of its neighbouring countries namely, Poland, Romania, Hungary and Moldova has increased by respectively 70%, 48%, 37% and 29% in the period, indicating either a steep increase in demand or leakage of production (Chatham House, n.d). The introduction of CBAM will possibly show a shift in these trade flows.
Denmark
Denmark has one producer of cement, namely Aalborg Portland, that produces 2,363,000 tonne cement per year and is the largest industrial emitter in Denmark (Aalborg Portland, n.d; Innovation Fund, 2025). Approximately 1 Mt is exported.
The Danish export market of cement is within Europe, and Aalborg Portland has silo facilities in Belgium, France, Iceland, Norway, Poland, the Netherlands and the United Kingdom (Aalborg Portland, 2024). According to the 2024 ESG report from Aalborg Portland, the company decreased their scope 1 emissions by more than 260,000 tonnes CO2 in 2024 compared to 2023. (Aalborg Portland, 2024). In 2024 they emitted approximately 1.4 Mt CO2, which is equivalent to 3.7% of the Danish GHG emissions (Aalborg Portland, 2024; Danmarks Statistik, n.d). In march 2025, the company announced the granting of EUR 220 million from the EU Innovation Fund into the project ACCSION, that aims to develop a production system that can produce CO2 neutral cement by 2030, projected to abate 113% emissions over its first 10 years (Aalborg Portland, 2025; Innovation Fund, 2025).
Denmark’s cement industry is highly concentrated, with Aalborg Portland as the sole producer and the country’s largest industrial emitter. Since CBAM targets emission-intensive imports, the direct effect on Danish cement production will be limited, as exports are mainly destined for European markets and therefore exempt from CBAM. Instead, the main impacts will concern competitiveness and investment incentives. In this context, CBAM may act less as a threat and more as a strategic catalyst: it protects Danish cement from competition with cheaper, high-emission imports while simultaneously increasing pressure to accelerate investments in carbon capture and other abatement technologies. If Aalborg Portland succeeds in reaching near-zero emissions by 2030, as planned, the company could position Denmark as a frontrunner in low-carbon cement and benefit from increased demand once CBAM fully takes effect.
Finland
Most of the cement products used in Finland are produced domestically from Finnish limestone. The sector has reduced emissions by improving the energy efficiency of the firing process, developing fine particle filtration systems, and utilizing recycled fuels.
Currently, the industry suffers from low demand due to weakness of the construction sector business environment. According, to Kaitilia et al. (2025), CBAM product imports in minerals were €830 million, while trade under CBAM from non-EU countries made up less than 1% of the total imported cement sector trade value in the period from late 2023 to mid-2024. In 2021, almost all of the non-EU imports came either from the UK or Turkey (Kaitila et al., 2022). Finland exports very few of these products.
Based on the general equilibrium modelling in Kaitila et al. (2022), the CBAM would significantly reduce the imports of cement from non-EU countries. The reduction is primarily due to the high carbon intensity of cement production, which makes it subject to higher carbon tariffs under the CBAM. The reduction in imports would likely lead to an increase in domestic production of cement within the EU, including Finland. The modelling results show that the production of cement in Finland could increase as domestic producers benefit from reduced competition from non-EU imports. However, for Finland these effects are likely very small.
A survey for Finnish firms suggests that the future expectations of increase in production in Finland are neutral, while there is an expectation of decline in production outside the EU. (Kaitilia et al., 2025)
Firms using cement products will face increased costs due to the tightening climate policy and CBAM tariffs, which will be passed on to the end-users. This may lead to higher prices for construction projects and infrastructure development, the size of the increase depending on the ability of the sector to adapt to the low-emission production.
Sweden
Sweden produces approximately 2.8 Mt of cement annually (0.05 percent of global production) in two factories, in Gotland and Skövde, both owned by Heidelberg Materials Cement. These facilities emit 1.9 Mt of CO2, which is approximately 4 percent of Sweden’s GHG emissions. Heidelberg cement has communicated plans to build the world’s first climate neutral cement facility by capturing and storing 1.8 Mt CO2 per (Svenskt Näringsliv, n.d). Sweden is almost self-sufficient on cement, with approximately 15 percent of Sweden’s need being imported.
According to Tillväxtanalys (2020), it would be very challenging for Sweden to import its total need for cement although it would be possible to import some from neighbouring countries around the Baltic Sea.
Since reliance on imports is relatively low, CBAM is unlikely to significantly alter Sweden’s cement trade patterns. Instead, the mechanism may primarily influence the sector by strengthening incentives to invest in low-carbon production methods. Ongoing initiatives focused on carbon capture and storage suggest that Swedish cement producers are already preparing for a tightening regulatory environment in the coming years.
5.5.5 Concluding remarks
Across all sectors, CBAM generates both cost pressures and strategic opportunities. The Nordic countries are comparatively well positioned in some CBAM-covered sectors due to lower average emission intensity, although this advantage varies by sector and is not driven by systematically cleaner import patterns. However, their structural disadvantages — including high wage, and high land prices — mean that CBAM alone will not ensure long-term competitiveness in the context of the green transition. To maintain their lead, Nordic producers could scale up low-carbon technologies, and building resilient value chains that reduce exposure to volatile imports. The Nordic experience may therefore serve as a test case for how climate policy can drive competitiveness in high-cost regions, provided that policy stability and targeted sectoral support are maintained over time.
5.6 Case studies or simulations estimating CBAMs influence on trade behaviour
To better understand how CBAM may affect trade, production and competitiveness, economic modelling exercises have been conducted at both EU and national levels. These include general equilibrium models, input–output analyses and sector-specific simulations. While the methods and assumptions differ, they collectively provide early insights into how CBAM may alter market flows. The following subsections summarise key findings from the literature, with a particular focus on the Nordic context and the implications for upstream and downstream industries.
5.6.1 Insights from Finnish general equilibrium modelling studies
Macroeconomic modelling offers detailed information on the impact of CBAM, namely on trade flows, output and welfare. Here we refer to recent GTAP modelling exercises (See, e.g. Kuusi et al., 2020; Kaitila et al., 2022). The GTAP model is static and describes only the long-run equilibrium allocative impacts of the CBAM. Short-term adjustment costs and transitional dynamics are not captured, and the technological long-term adjustments in the model are limited.
Imports from non-EU countries with high embedded carbon, such as those in heavy manufacturing, face the greatest decline. For Nordic countries like Finland, this means a shift in sourcing towards EU partners and an uptick in domestic substitution, especially in sectors covered by CBAM. Exports of CBAM-affected products to the EU rise, but exports to non-EU countries tend to fall due to both substitution and reduced demand.
The mechanism also reallocates production. Sectors covered by CBAM—iron and steel, non-metallic minerals, and others—see increased output as they gain competitiveness relative to imports. This effect is amplified in countries where these sectors are significant. Conversely, industries that rely heavily on imported inputs from non-EU countries or export a large share of their products outside the EU may see output decline, particularly if their products are subject to higher tariffs or if global demand softens.
CBAM influences welfare primarily through terms-of-trade effects. As export prices rise and import prices fall for the EU, welfare tends to increase for EU countries, including the Nordics. For non-EU countries subjected to CBAM, welfare declines as their export competitiveness erodes. The redistribution of resources across sectors may create efficiency losses, but these are often outweighed by the gains from improved terms of trade, especially under moderate CBAM implementation.
5.6.2 Key differences in different implementations
In a feasible scenario with current implementation, CBAM is narrowly applied to a select group of sectors and considers only a limited range of emissions. This leads to modest adjustments: the drop in non-EU imports is concentrated in a handful of carbon-intensive goods, and the production boost for protected industries is relatively contained. Welfare gains in the EU are positive but limited, and most non-EU countries experience minor welfare losses. The substitution between non-EU and EU/domestic sources is significant mainly in targeted sectors.
Across the EU, the shift from Scope 1 to Scope 3 intensifies the negative GDP impact (Kaitila et al., 2022). Especially when paired with higher carbon prices, all EU member states face GDP declines. The efficiency losses rise as CBAM broadens, even as welfare gains become more pronounced in low-carbon sectors.
Sectors within the EU and Nordics that produce CBAM-covered goods (such as steel and aluminium) tend to benefit most from CBAM, experiencing increased output and competitiveness as imports of more carbon-intensive products become relatively more expensive. In contrast, downstream sectors that are dependent on imported inputs or are strongly export-oriented (like electronics and machinery) are more adversely affected, echoing previously risks for companies heavily reliant on international supply chains.
A broader application of CBAM, including a wider coverage of emissions and product categories, can prompt substantial reductions in high-emission imports from countries such as China, India, and Russia. This delivers stronger environmental improvements but also triggers greater economic distortions in both EU and non-EU countries. The breadth of CBAM’s application is therefore decisive for both trade redirection and the environmental integrity of the mechanism.
Efficient scenario in Kuusi et al. (2020) encompasses a wide array of industries and takes into account all emissions associated with production. The resulting carbon tariffs are higher and more widespread, leading to deeper reductions in non-EU imports, especially from high-carbon regions such as Eastern Europe and China. Protected sectors—like iron and steel—see substantial output increases, while sectors reliant on exports outside the EU or imported inputs (e.g., electronics, machinery) may experience output declines.
Welfare gains in the EU are more pronounced, but so are efficiency losses from the greater resource reallocation. Non-EU countries, particularly those with high-carbon economies, face sharper declines in both welfare and production.
5.6.3 Trade patterns: primary products and secondary products
It’s useful to distinguish between the impacts of CBAM on EU primary products, such as steel, aluminium and cement, and secondary products, such as vehicles and buildings.
Primary products
According to Konjunkturinstitutet (Dahlqvist et al., 2025) a CBAM makes imported materials more costly resulting in a reduction of imported materials and increase in EU produced materials, thus improving the competitiveness of EU material producers. This will lead to increased emissions in the EU but could lead to reduced emissions globally if EU material producers have lower emissions per product. The impacts of CBAM on primary products is described graphically in the figure below.
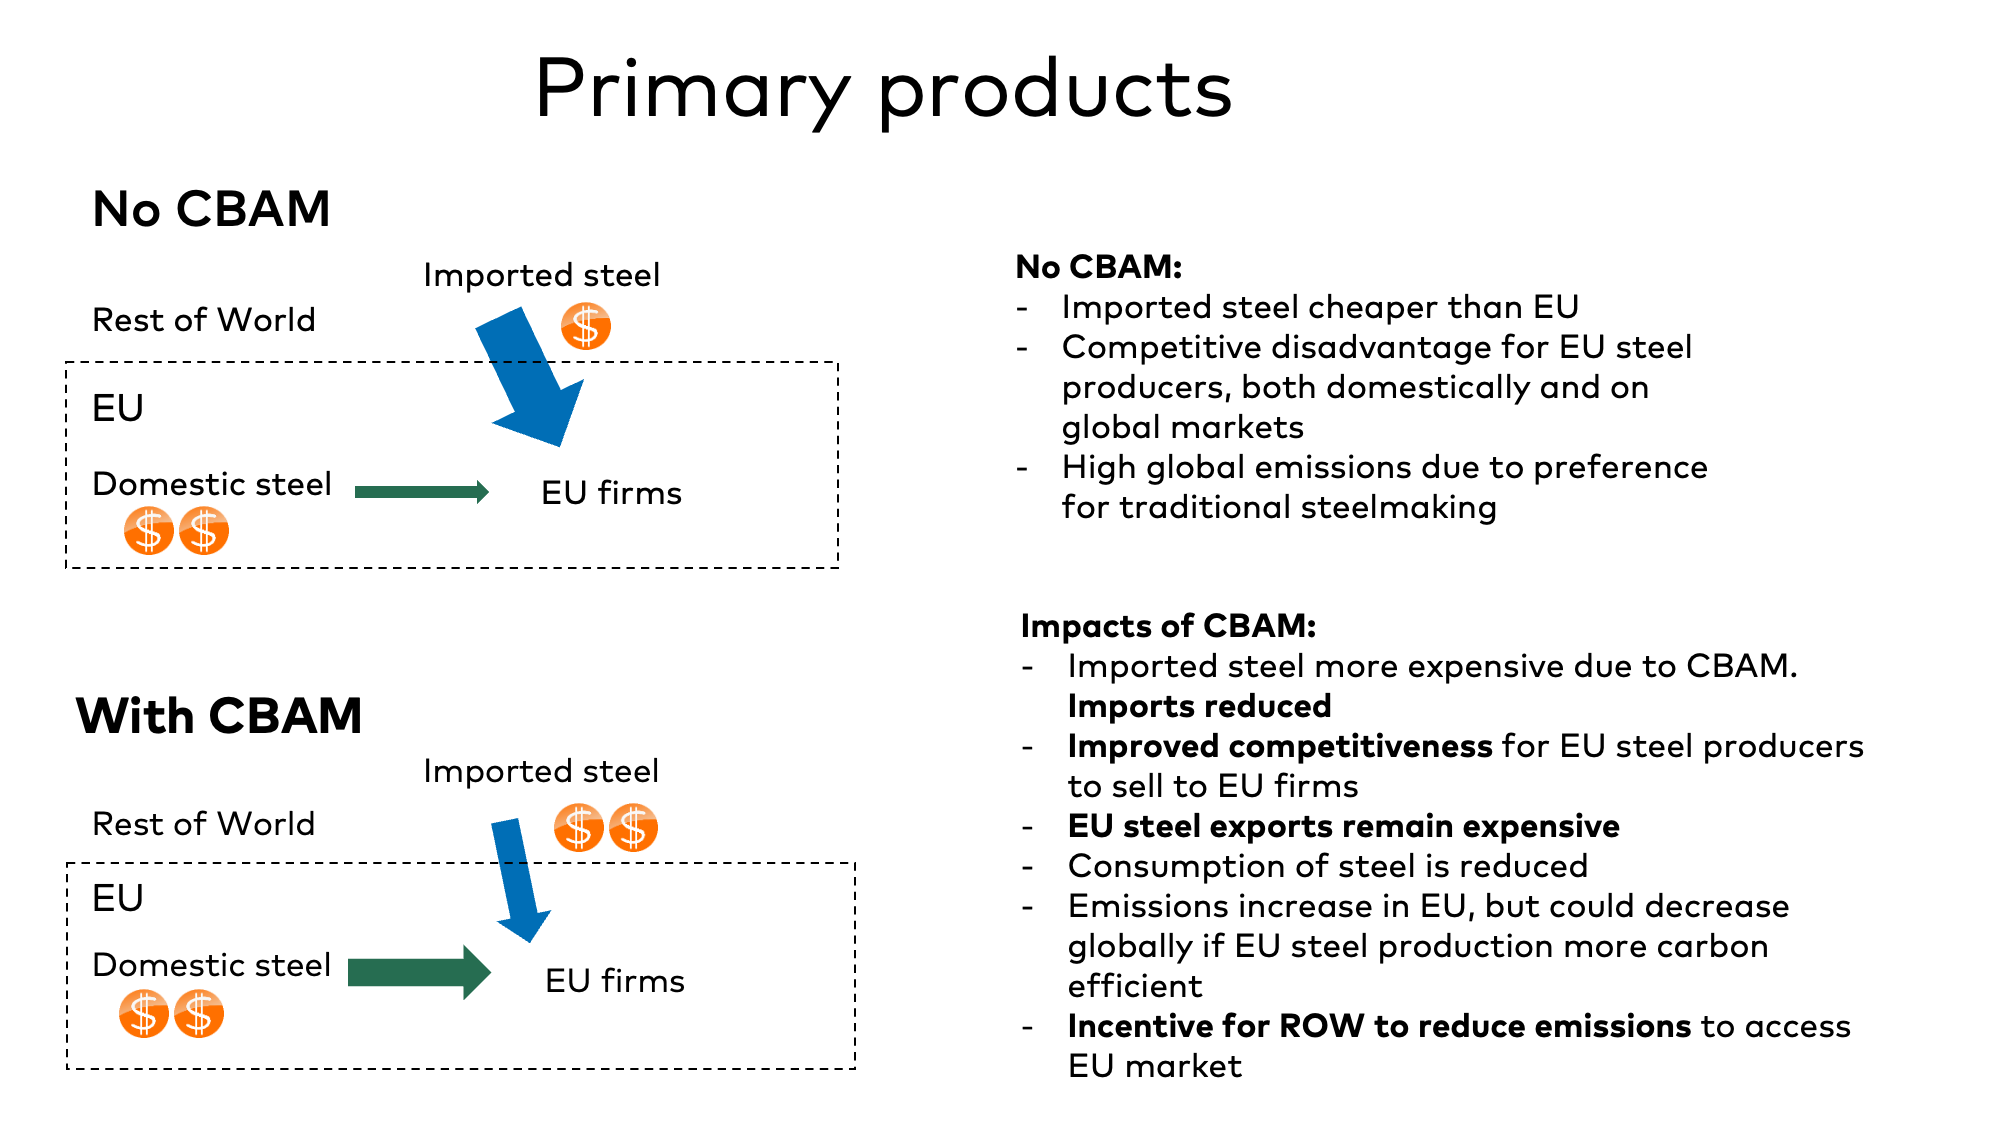
Figure 7. Illustration of the impacts of CBAM on primary products
Secondary products
Secondary products are products that use materials covered by CBAM and could for instance be vehicles and buildings. With a CBAM, imported materials become more expensive and this cost increase propagates downstream either reducing the profits of those using materials or making the end products (for instance vehicles) more expensive. Konjunkturinstitutet (2025) finds that when these costs are forwarded to firms, this can lead to reduced competitiveness both on the EU market and on export markets. According to a recently published OECD report (Dechezleprêtre et al. 2025), a CBAM would have an impact on exports from EU producers. The impact on secondary products is described graphically in the figure below.
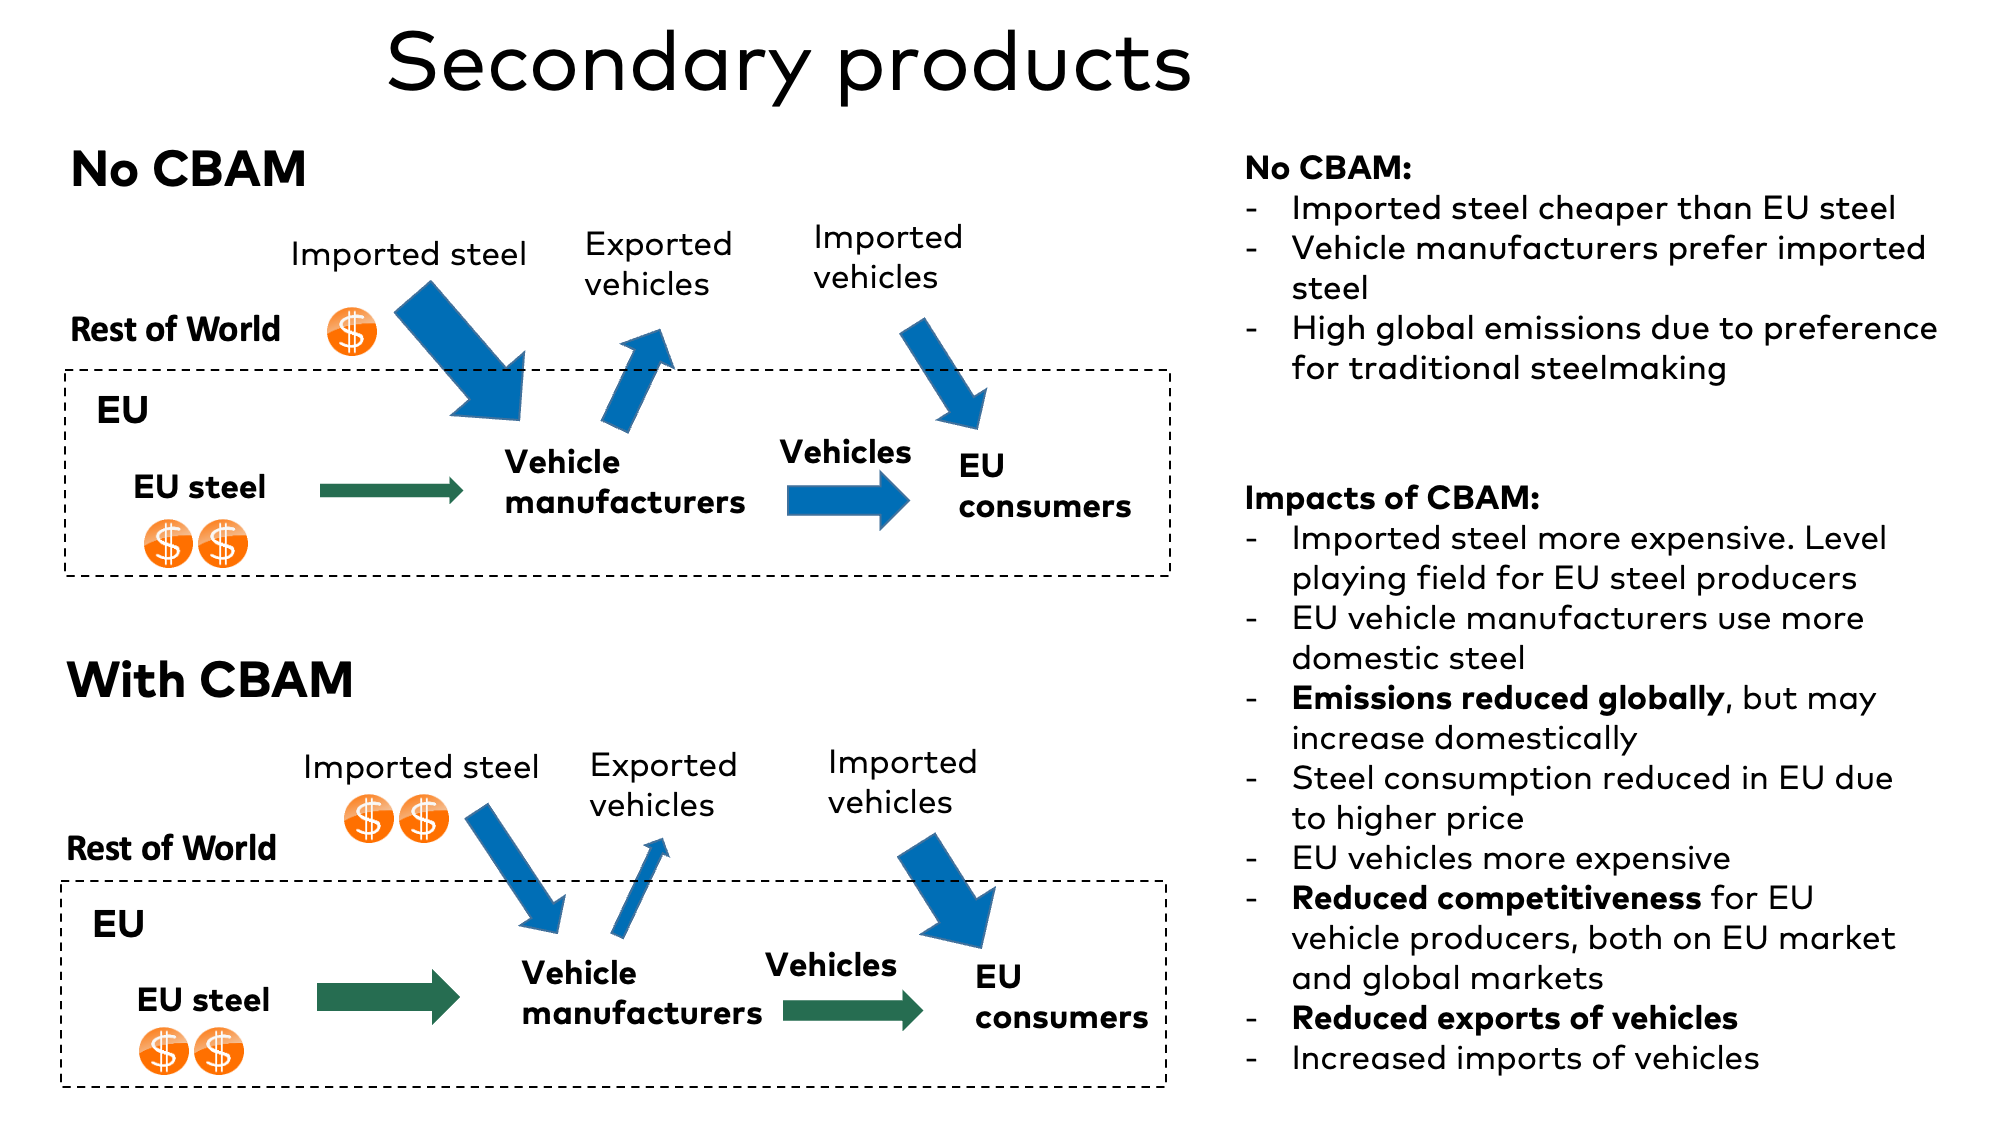
Figure 8. Illustration of the impacts of CBAM on secondary products.
Dechezleprêtre et al. (2025) also finds that a CBAM could lead to lower global emissions due to EU imports being redirected to countries with lower emissions. Böhringer et al (2016) find that EU carbon tariffs can provide incentives for countries to strengthen their climate policy to gain access to the EU market.
5.6.4 Internal production and competitiveness on the intra-EU market – findings from MRIO modelled scenarios (Amendola, 2025).
In a study analysis conducted by Amendola (2025), a MRIO based framework was developed to simulate estimations of new production levels in each country and covered industry, following the immediate effect on increased production costs following CBAM. The model is based on 163 industries and 49 regions, divided into non-adopting and adopting countries, where all EU member states are included, as well as Norway and Switzerland (considered as adopting countries of the CBAM due to the design of the policy) and 20 non-adopting countries.
Results suggest, that the CBAM has modest macroeconomic effect on inflationary impacts, such as increased production costs, in both adopting and non-adopting countries and that this effect can be mostly attributed to the elimination of free allowances rather than to the effect of the CBAM and are more pronounced within adopting countries within the EU. The result of the study shows a modest decrease in GDP in adopting countries (and a negligible effect on non-adopting countries), mostly due to the decrease of internal production and losses on export. However, the results show a degree of heterogeneity in terms of macroeconomic repercussions, showing that especially Eastern European countries are at higher risk of losing a share of GDP larger than the EU average loss from the implementation of the CBAM. On the contrary, the economies of Denmark and Finland are highlighted as countries showing no adverse effects to their inflationary pressures. For all the modelled scenarios, the scope countries show only minor differences in total-, internal- and foreign competitiveness, deeming it almost negligible. However, the results highlight intra-EU distributional issues of the policy.
On the contrary, on a sectoral scale, the results show that for adopting countries, almost all the affected downstream sectors experience a decline in production, and an increase in production prices, mostly significant for the cement industry with an increase of up to 14% (production prices of turning ash into clinker), suggesting much larger impacts on the sectoral level than on macroeconomic scale. Non-adopting countries is found to experience a gain in production in these downstream industries (most profoundly in the cement industry), indicating risks for carbon leakage to non-adopting countries. However, disaggregating these results again shows large intra-EU differences. Interestingly, the three scope countries all experience a gain in total competitiveness on a sectoral scale, with industry variations.
In an OECD report (Dechezleprêtre et al., 2025) estimating the potential effects of the CBAM across the value chain in both EU and Non-EU countries also utilizing input-output models in their study, similar results are evident showing the same trends as in Amendola (2025).However, this report states lower price changes across sectors estimating a range 0f 0–0.6%. The report points out, that even though there are sectoral differences, and some downstream sectors are in risk of carbon leakage, the overall contribution of the CBAM policy mitigates carbon leakage by -12.40% in all covered industries.