The role of cross-border mergers in a global economy
The chapter describes how market concentration has been rising and the implications for policy makers.
Why competition matters to the economy
Competition plays an essential role in maintaining a robust economy by motivating firms to achieve superior outcomes for customers, such as lower prices, improved product quality, and greater diversity of products.
The literature typically points out three primary microeconomic mechanisms:
Productive/X-efficiency incentivizes firms to minimize “within-firm” inefficienciesAllocative efficiency promotes the optimal allocation of resources between firmsDynamic efficiency encourages firms to engage in innovation (R&D).
Together, these mechanisms create a selection effect, shifting market share toward more productive firms and encouraging the exit of less efficient competitors, thereby raising overall economic efficiency. Extensive research demonstrates that strong competition enhances productivity, investment, innovation, and economic growth. Firm dynamics (the exit/entry of firms) accounts for a significant portion of aggregate productivity growth (Lear et al., 2024). Furthermore, it strengthens the export competitiveness of domestic enterprises. In contrast, diminished competition is associated with lower investment, declining productivity, increasing inequality and potentially decreased effectiveness of macroeconomic policies (IMF, 2021).
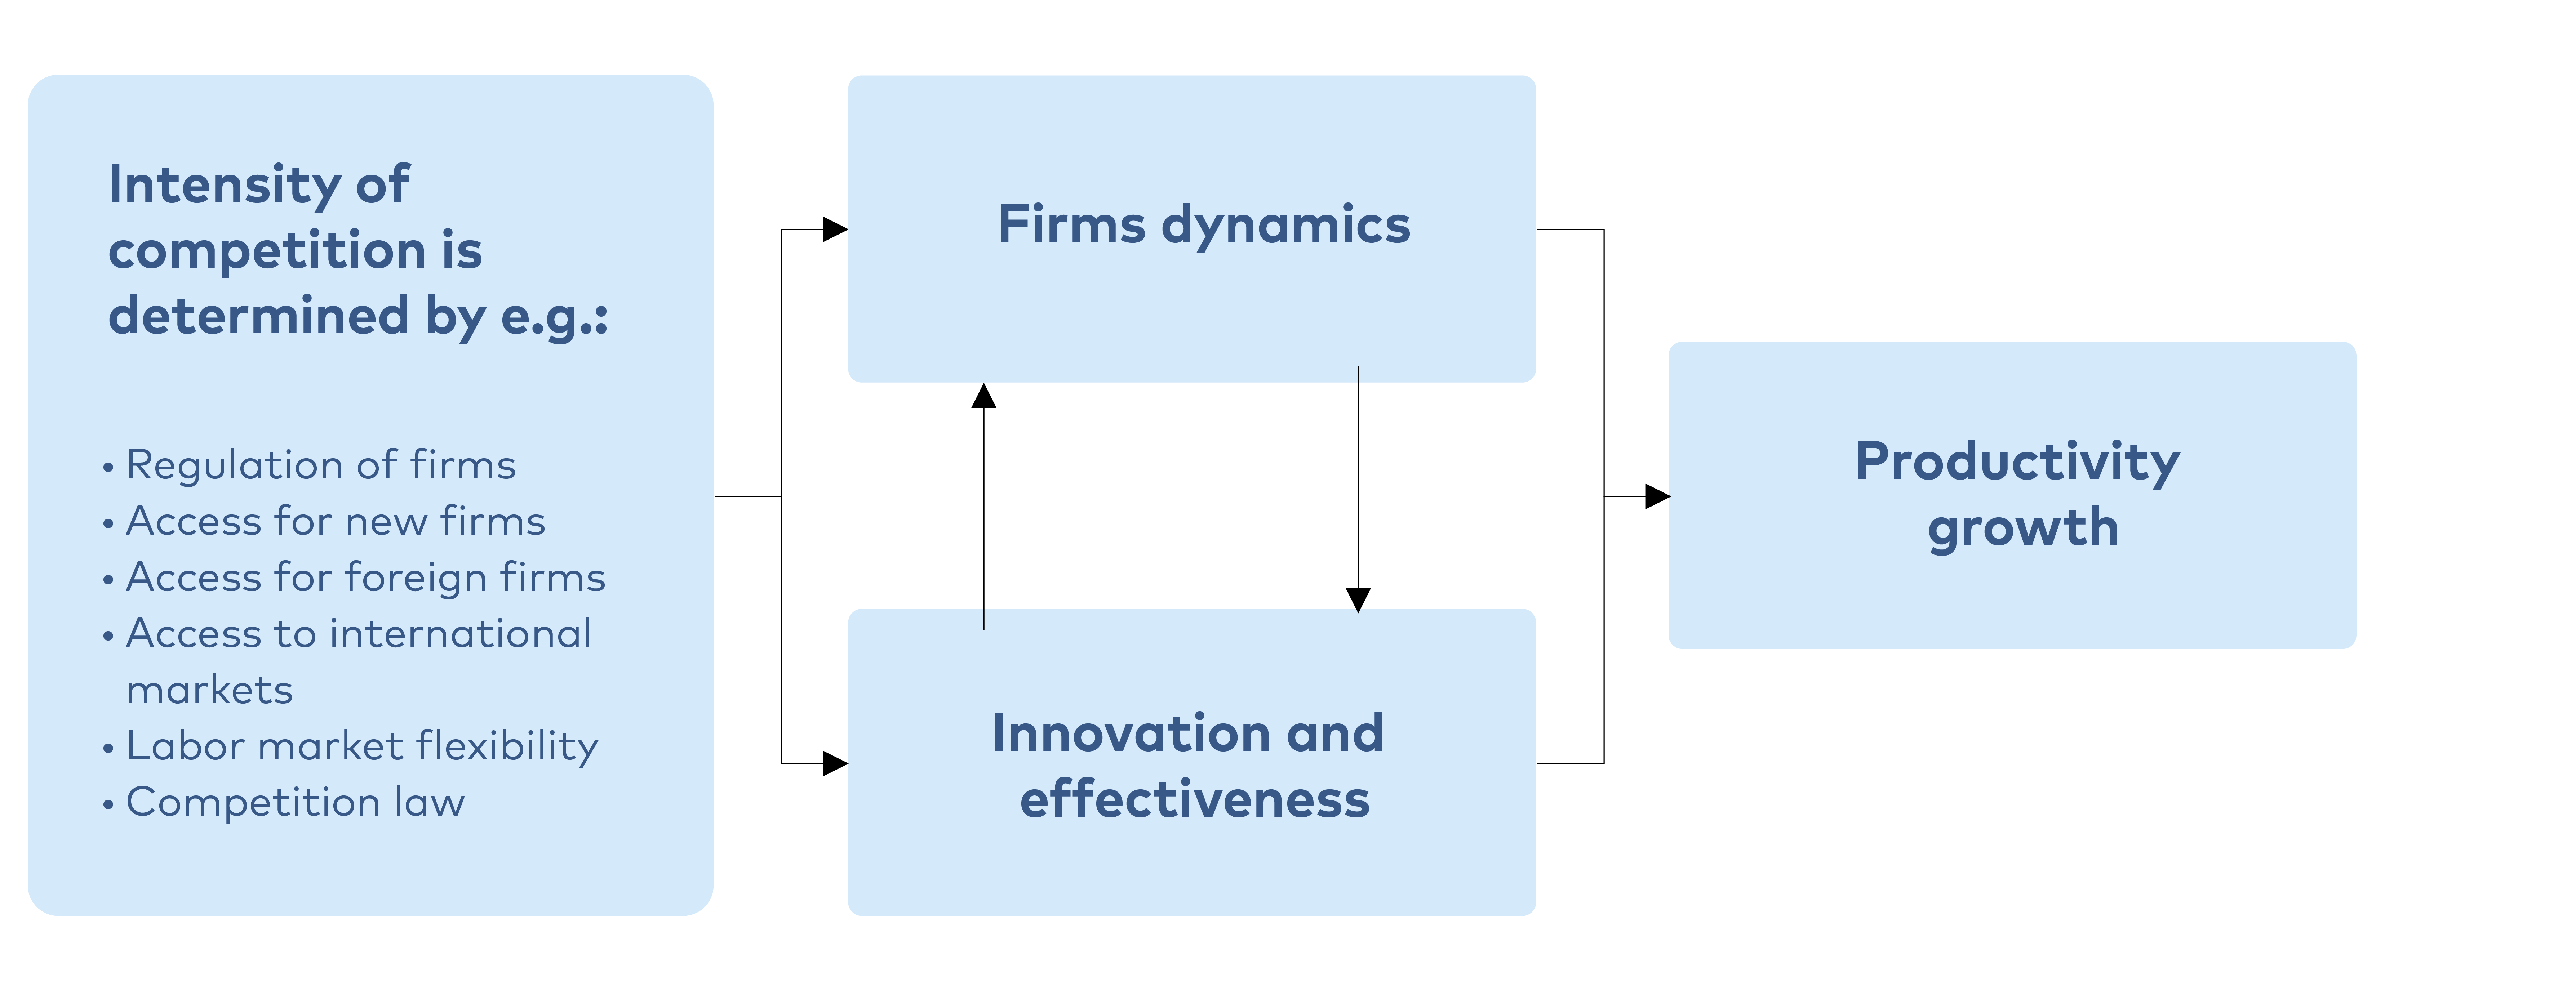
Exhibit 14 Competition is driving productivity growth
Illustration of firm dynamics (external) and internal effects on productivity
Illustration of firm dynamics (external) and internal effects on productivity
Source: HBS Economics.
In the context of mergers, this dynamic introduces a dual effect:
- Mergers reduce external competition, potentially weakening the selection process that reallocates resources to the most productive firms.
- Mergers can facilitate efficiency gains (e.g., capital reallocation, knowledge synergies, more effective production etc.) as stronger firms acquire weaker firms and optimize their resources.
As briefly outlined above there is a large body of evidence and consensus among economists implying that competition (for the whole of the economy) is highly beneficial. There are, however, exceptions both theoretical and empirical to this trend. While keeping in mind the overall conclusion here, these exceptions will be integral in this report and for understanding how (and in what markets) more can be done to enable productivity growth and investment by means of M&A in the EU and more specifically in the Nordics.
The tension between competition- and industrial policy aims
From a competition policy point of view there has been increasing worries about the risk of negative effects of mergers on innovation. Evidence shows that acquisitions made by tech firms have likely reduced innovation which implies that competition policy has been too lenient – as opposed to “too strict”.
On the other hand – from an industrial policy perspective, European politicians and the Draghi and Letta reports seems to point out that merger policy has been in some ways too strict (Stiebale, 2025).
Exhibit 15
Draghi report raises questions about EU competition policy
Draghi report raises questions about EU competition policy
Last year, Mario Draghi warned that the EU faces an "existential threat" if it fails to reverse economic stagnation. He identified factors hampering competitiveness, especially in how the EU supports technological innovation. In response, Ursula von der Leyen’s Commission has introduced initiatives to lower regulatory barriers and boost private investment, including reforms to EU merger guidelines (see below).
Reform to EU merger guidelines
The EU is actively reviewing its merger guidelines to ensure they align with today's shifting markets and business models. This comprehensive review takes into account major changes in geopolitics, international trade, and technology, seeking input from various stakeholders.
Key considerations include the role of scale for global competitiveness and the possible benefits of mergers for small and medium-sized enterprises (SMEs), such as greater access to capital and resources for innovation. However, the EU is also wary of increased market power stifling innovation and harming competition.
The review pays special attention to innovation, especially the risks of "killer acquisitions" and the loss of emerging competitors in sectors like pharmaceuticals and digital markets. Sustainability is another priority, with a focus on how mergers may support or hinder the EU’s climate goals.
Digitalisation introduces complex challenges, as traditional merger distinctions blur amid network effects and data-driven competition. The EU is also re-examining how to weigh efficiencies, both price and non-price, against potential harms.
Finally, the review explores broader societal impacts, such as defence, media plurality, and labour markets – acknowledging that mergers can affect more than just competition, but also public interest and democratic safeguards.
Exhibit 16
Geopolitical risk and digitalization has boosted industrial policy arguments
Geopolitical risk and digitalization has boosted industrial policy arguments
National security concerns
- Telecommunications: Nordic telecom mergers could boost 5G, reduce reliance on rivals, and secure digital sovereignty
- Cybersecurity: Consolidating cybersecurity could improve resilience to cyber threats and protect critical infrastructure
- Defence Tech: Mergers in AI-driven cybersecurity and defence tech could reduce EU reliance on non-European providers.
Supply chain sovereignty
- Cloud & IT Services: Nordic cloud mergers could reduce dependence on Microsoft and AWS, securing data sovereignty.
- Semiconductors & Manufacturing: European chip mergers could decrease reliance on Asian suppliers in digital industries.
Energy & green transition
- Renewables: Renewable energy mergers could accelerate the green shift, reducing Nordic reliance on Russian gas.
- EV & Battery Tech: Consolidation in battery and EV production could strengthen Europe’s clean energy innovation.
Consumer protection
- Fintech & Banking: Nordic fintech mergers could enhance fraud detection, consumer authentication etc.
- E-commerce & Payments: Mergers in digital payments could align protection but also risk lowering market transparency.
- Smart Devices & IoT: Consolidation in IoT security could improve consumer protection against hacking and data breaches.
From a public policy perspective, mergers must be evaluated in terms of their broader effects on economic welfare. At the core lies the Williamson trade-off, which highlights the tension between efficiency gains (e.g., lower costs, innovation) and market power (e.g., higher prices, reduced output).
The key question is whether mergers lead to overall welfare gains – total surplus – by passing efficiency benefits on to consumers, or whether they primarily raise firm profits at the expense of consumers and competitive pressure.
However, in today’s context of geopolitical risks, climate urgency, and digital transformation, traditional economic surplus measures are somewhat inadequate. We therefore introduce broader concepts that regulators may consider:
- Strategic surplus: when mergers enhance national or regional resilience and sovereignty (e.g., in telecom or clean tech).
- Transition surplus: when mergers accelerate green or digital transformation.
- Consumer protection surplus: when consolidation improves safety, trust, or cybersecurity, even if not directly lowering prices.
While these extended surplus notions do not override the need for efficiency, they may justify more flexible merger assessment thresholds in critical sectors. In sum, mergers should be judged not just on short-term consumer price effects but on their long-term contributions to societal objectives.
A notable distinction is that between tangible and intangible assets. Policymakers should be particularly attentive when mergers or acquisitions involve strategically important intangible assets, such as technology, patents, or specialized know-how, as control over these can affect long-term competitiveness and innovation. By contrast, the ownership of location-bound tangible assets, such as ports, factories, or other infrastructure, is generally less concerning from a competition or strategic perspective since the asset itself cannot be relocated and its economic impact is largely local. Recognizing this distinction allows for a more nuanced assessment of mergers in critical sectors, balancing efficiency considerations with broader societal objectives.
Exhibit 17
Tangible and intangible assets
Tangible and intangible assets
In the context of mergers and acquisitions, it is crucial to distinguish between mobile (intangible) assets and location-bound (tangible) assets.
- Intangible assets are mobile including technology, patents, managerial know-how, and brands. These can be transferred across borders and generate value when combined with new markets or complementary resources. Foreign ownership of such assets may raise concerns about knowledge transfer, competitiveness, or the relocation of key functions.
- Tangible assets are location-bound assets including infrastructure, land, natural resources, and facilities such as ports or utilities. These remain tied to their geographic location regardless of ownership. When foreign investors acquire such assets, the asset itself cannot be relocated, which often makes ownership less sensitive from a policy perspective.
This distinction is central in industrial organization and international business theory, as it shapes both the economic rationale for cross-border acquisitions and the policy considerations linked to foreign ownership.
Source: OLI/Dunning.
The following section highlights how competition has weakened for most advanced economies in past decades.
Increasing market concentration in the EU and US
In advanced economies, corporate market power – as measured by firms' price markups over marginal costs – has risen by nearly 8 pct. since 2000, accompanied by escalating profits and increased market concentration (IMF, 2019).
This surge has been most pronounced in the technology and pharmaceutical sectors, with markups exceeding threefold those found in industrials and consumer goods. Conversely, markups have remained relatively stable in emerging markets (IMF, 2021a).
Within the European Union, data indicates a weakening competitive landscape, highlighted by greater industry concentration, higher markups, widening disparities between market leaders and followers, and reduced business dynamism. Nonetheless, some evidence suggests that increases in concentration and markups have been less significant in the EU compared to the United States (Bajgar et al., 2019 & 2021).
From 2002 to 2017, industry concentration generally intensified across the United States, Japan, and eleven European nations, particularly in sectors such as Retail, ICT, Transportation and Storage and Manufacturing (IMF, 2021b).
The overall trend (exhibit 18 and 19) shows a rise in corporate market power in advanced economies, indicated by increased markups/profitability. While this rise is broad-based, it is concentrated among a small fraction of dynamic, more productive, and innovative firms.
In 2021 the IMF noted that the rise in M&As by dominant firms has contributed to increased market power and reduced business dynamism – its effect is described as "chilling, albeit moderate". Since then, further increases in market concentration have taken place: More recently, results on the concentration trends have been documented by Calligaris et al. (2025) showing large increases at the industry level in both EU and US in the post-pandemic era. Increased competition is associated with improved Total Factor Productivity (TFP), whereas heightened market power and markups align with TFP decreases (Lear 2024).
Exhibit 18 Evolution of global markups
Index 1980 = 1
Index 1980 = 1
Source: IMF (2021)
Exhibit 19 Markup increase by region
Aggregate percent change 1980–2016
Aggregate percent change 1980–2016
Source: IMF (2021)
Exhibit 20
The welfare cost of the secular decline in business dynamism is large
The welfare cost of the secular decline in business dynamism is large
Based on three scenarios Lear et al. (2024) estimate that the price increase that resulted from increasing market concentration in EU during the period between 2000 and 2020 (nearly 8 pct. increase in markups) had the following impact:
- GDP would have been 3.7 pct. higher in 2020
- Firm investments would have been 1.6 pct. higher in 2020
- Household consumption would have been 3.9 pct. higher in 2020
- Employment would have been 3.0 pct. higher in 2020.
Source: Lear et al. 2024 – Exploring the state of competition in the EU.
It is relevant to consider the extent to which M&A is a driver of increased markups. Recent evidence in a Nordic context indicates that only around 10 pct. of the increases in markups can be attributed to M&A (Danish Economic Council, 2025). This indicates that many other factors come into play, e.g., the rising concentration is for example also strongly associated with intensive investment in intangibles, especially innovative assets, software, and data. This relationship is magnified in more globalized and digital-intensive industries, as firms are better able to scale intangibles when they have access to larger foreign and digital markets (Bajgar, 2024).
Recent studies have identified the decline in competition, offering several possible explanations for this pattern. One commonly referenced hypothesis is the "superstar story" (Autor et al., 2020), which proposes that structural changes in the economy – including globalisation and the increasing role of intangible assets – have benefited large firms. According to this perspective, increased market concentration and markups may result from efficient firms gaining dominance (Shapiro and Yurukoglu, 2024). Several others contest this view.
Ranking analyses show that top firms increasingly “stay on top” implying lower business dynamism. Besides considering the potential harmful effects on innovation (e.g., in pharmaceuticals and big tech) competition authorities must consider the possibility that with increasing market concentration leading firms can reduce competitive pressure through M&As, particularly in digital-intensive industries, raising concerns about "killer acquisitions" where established firms buy startups with competitive potential (Stiebale, 2025).
The economics of superstars
So far, we have seen that 1) competition is highly beneficial and a driver of desirable economic outcomes like growth, investment, and innovation and 2) that competition (measured by the degree of market concentration) is in decline in most advanced economies. So why would we allow more mergers in this situation?
Besides increasing geopolitical tension digitalisation has altered competitive dynamics in the economy by generating new markets and changing existing ones. This development introduces various challenges for competition authorities and policymakers, who must manage uncertainty in rapidly shifting markets, identify new forms of potential misconduct – such as those associated with digital ecosystems or platforms’ data practices – and assess markets with unclear boundaries. Additionally, attention to conduct in digital markets and signs of increasing market concentration have prompted consideration of both new and existing competition policy measures.
Exhibit 21
Key considerations in the (digital) superstar economy
Key considerations in the (digital) superstar economy
Network externalities
When the value of a product or service increases as more people use it, early leaders can gain a self-reinforcing advantage. In digital markets, this often allows one or a few firms to dominate globally (e.g., social media platforms, payment systems). Network effects make it harder for new entrants to compete, reinforcing the market position of superstar firms. Over time, this can create “winner-takes-most” dynamics.
When the value of a product or service increases as more people use it, early leaders can gain a self-reinforcing advantage. In digital markets, this often allows one or a few firms to dominate globally (e.g., social media platforms, payment systems). Network effects make it harder for new entrants to compete, reinforcing the market position of superstar firms. Over time, this can create “winner-takes-most” dynamics.
Technological standard-setting
Superstars can influence or set industry standards (e.g., file formats, protocols), locking in users and partners to their ecosystems.
Superstars can influence or set industry standards (e.g., file formats, protocols), locking in users and partners to their ecosystems.
Winner-take-most dynamics
In markets with strong economies of scale, high fixed costs, and low marginal costs, firms that achieve an early lead can expand rapidly at lower average cost than their competitors. Combined with brand recognition and access to data, this often allows one or a few firms to capture the majority of the market. Such dynamics tend to concentrate market power among a few dominant players. Over time, this reinforces barriers to entry and creates “winner-takes-most” outcomes.
In markets with strong economies of scale, high fixed costs, and low marginal costs, firms that achieve an early lead can expand rapidly at lower average cost than their competitors. Combined with brand recognition and access to data, this often allows one or a few firms to capture the majority of the market. Such dynamics tend to concentrate market power among a few dominant players. Over time, this reinforces barriers to entry and creates “winner-takes-most” outcomes.
It is important to note that having fewer, larger firms is not inherently problematic (see exhibit 22). Contestability is a central concept in competition law, as it ensures that large companies can be challenged by new market entrants. The welfare risks does not necessarily arise from the presence of a few large companies, but rather when these companies cannot be challenged. If contestability is ensured, mergers of large companies will not pose a problem, as access for large international players to the EU market will ensure continued contestability. This is crucial to ensure that mergers do not hinder competition but instead promote a dynamic and open market structure.
Exhibit 22
Fewer firms do not have to imply lower competition
Fewer firms do not have to imply lower competition
The previously highlighted increase in market concentration is, to some extent, a natural outcome of an increasingly globalised economy. Measures of concentration are defined within a given industry and geographic area, focusing on the number and relative size of firms. This means that a rise in concentration – such as fewer, larger pharmaceutical companies operating in Sweden – does not necessarily indicate weaker competition.
If these firms compete with foreign suppliers and Swedish consumers can readily purchase pharmaceutical products from abroad, competition can remain strong despite higher domestic concentration. In such cases, consolidation may even result in lower consumer prices, improved efficiency, or enhanced innovation due to stronger competition in the broader international market.
The rise of superstar companies is driven by a combination of structural and technological factors. For instance, economies of scale typically allow large firms to operate efficiently across products and markets, while network externalities (in the case of tech) reinforce their dominance as the value of their services grows with the number of users. Global brand power and technological standard-setting can potentially lock in customers and partners.
Superstar firms illustrate the evolving trends and highlight new considerations for policymakers. While they are few, they are highly relevant to the discussion on market dynamics. Even outside of these exceptional cases, ordinary mergers should be assessed individually, with competition authorities carefully balancing potential efficiency gains against possible harm to competition and consumers.
How Nordic countries compare with the EU
Europe's competitiveness challenge has moved to the forefront of the policy agenda. As highlighted in the 2024 Draghi Report, the widening transatlantic gap in productivity, innovation, and investment underscores a structural divergence between the European and U.S. economies. This gap reflects deeper differences in market structure, capital allocation, and the capacity to translate technological progress into economic growth. The Nordic countries, while often outperforming other EU Member States on various economic and innovation indicators, are not immune to these trends.
While the United States has seen sustained and robust investment in productive assets, investment levels in the Nordic region have (with the exception of Sweden) not kept up with the US, see exhibit 23. The divergence signals underlying differences in the enabling environment for private and public investment, including regulatory frameworks, access to risk capital, and market incentives.
Exhibit 23 Private investments
Real gross capital formation, percentage of GDP
Real gross capital formation, percentage of GDP
Note: Private investments expressed in real terms excluding residential investment.
Source: OECD Gross fixed capital formation and chained GDP.
Source: OECD Gross fixed capital formation and chained GDP.
Exhibit 24 Investment in ICT
Gross capital formation, (2010 = 100)
Gross capital formation, (2010 = 100)
Note: Index, 2010 = 100. The graph of EU includes all member states except Cyprus, Malta, Bulgaria, Rumania, and Croatia.
Source: STAN OECD.
Source: STAN OECD.
An essential driver of future productivity growth is our digital capital. The Nordic region lags considerably behind the U.S. in investments in information and communication (ICT), see exhibit 24, reflecting weaker investment in digital infrastructure and technologies that are critical to the next phase of industrial transformation. This gap is further underscored by the findings that, between 2014 and 2019, European companies' revenues increased 40 pct. slower than their U.S. counterparts, with ICT and pharmaceuticals accounting for 80 pct. of the investment gap and 75 pct. of the R&D gap (McKinsey, 2022).
Nordic investment levels lag behind the US in digital technologieS AND ICT
While the Nordic countries often outperform other EU member states on various economic and innovation indicators, they still face a notable investment gap compared to the US. This shortfall hampers competitiveness and limits the emergence of new superstar firms in the region.
Innovation capacity plays a central role in shaping firms’ ability to attain and maintain global market positions. The distributions of the world’s largest pharmaceutical and technology companies by country reveals a clear asymmetry (exhibit 25 and 27) while the Nordic region plays a disproportionately strong role in the global pharmaceutical sector – home to several globally competitive firms – it is largely absent from the top tier of global ICT companies, with only a single Nordic firm (from Sweden) represented among the 100 largest. This reflects the region’s long-standing strength in life sciences but also points to a structural weakness in scaling digital enterprises and capturing value in technology-intensive sectors. In general, countries gain from specialization and thus Nordic countries should not aim to “lead” all sectors. However, with the recent focus on strategic autonomy countries may meaningfully choose to give up some specialization gains.
Exhibit 25 Nordics have a strong pharmaceutical sector
Number of Top 100 largest pharmaceutical companies in the world by country
Number of Top 100 largest pharmaceutical companies in the world by country
Size of the company is measured by its market cap as of August 2025.
Exhibit 26
Cross-border M&A in the Nordic Life Science sector (interview highlights)
Cross-border M&A in the Nordic Life Science sector (interview highlights)
M&A as a scaling tool: M&A is primarily viewed as a mechanism for scaling operations and gaining access to larger markets. In the Nordic context, national markets are relatively small and fragmented, which increases the importance of cross-border deals. Compared to the United States, where companies benefit from one integrated market, Nordic firms face more structural barriers.
Regulatory environment: The regulatory process for pharmaceuticals and medical devices in Europe is centralised to some extent (e.g., EU-level approvals), making it easier to access multiple markets simultaneously. However, local differences in pricing negotiations, language, and regulatory specifics still represent significant barriers. These factors can increase transaction complexity and reduce the attractiveness of cross-border consolidation within Europe compared to the United States.
Market structures and competition: The Nordic countries host both large multinational pharmaceutical companies and a wide range of smaller, specialised firms. This creates an ecosystem where cross-border M&A can be a pathway for smaller Nordic firms to access global markets, while larger players use acquisitions to strengthen their positions in specific areas. The strong presence of European competitors means Nordic firms often face competitive pressure both within the region and from U.S. firms.
Alternative growth models: While M&A plays a role, licensing agreements are highlighted as an even more established growth model in parts of the Nordic life science sector. This suggests that while cross-border M&A is important, it may be complemented – or in some cases substituted – by strategic partnerships and licensing, particularly for mid-sized Nordic firms.
Access to capital: Access to venture capital is more developed in the United States than in Europe. This structural difference may limit the ability of Nordic firms to expand organically or to pursue outbound M&A at the same scale as U.S. firms. Cross-border deals are therefore often driven by the need to attract capital and strategic partners beyond the region.
Global considerations: Regulatory regimes in other major markets (e.g., U.S., China, Brazil) also shape Nordic M&A strategy in life science. While EU and U.S. regulations are relatively harmonised, unique national rules in emerging markets can act as deal-breakers for truly global transactions. Nordic companies, therefore, often approach cross-border deals with a staged strategy: first Europe, then the U.S., and only later selected other markets.
The Nordics are not major players in global technology industries, as illustrated in exhibit 27. Here, the relative footprint is modest with just one firm among the top 100 largest global tech firms.
Exhibit 27 Nordic countries are not well represented in technology
Number of Top 100 largest tech companies in the world by country
Number of Top 100 largest tech companies in the world by country
Size is measured by the companies’ market cap as of August 2025.
Export dependence further characterizes the asymmetry between the transatlantic economic models. Exports as a share of GDP in the Nordic region remain substantially higher than in the U.S., see exhibit 28, where a large domestic market provides a buffer against external shocks. While openness has historically been a strength, it also increases exposure to global trade disruptions, geopolitical uncertainty, and rising protectionism. Excluding intra-EU trade, the EU trade-to-GDP-ratio is 51 pct. compared with 28 pct. in the US.
Exhibit 28 Exports
Goods and services, percent of GDP
Goods and services, percent of GDP
Source: World Bank Group & Eurostat. Note that exports/GDP-ratio is a biased openness-indicator. E.g., larger countries will have lower exports to GDP and Nordic countries exports reflects trade within the EU.
Exhibit 29 R&D investment
Pct. of GDP in EU, US, and Nordics
Pct. of GDP in EU, US, and Nordics
Note: The Nordics comprise in this graph of Norway, Sweden, Denmark, Iceland, and Finland. Source: World Bank.
A growing gap in research and development is also evident, see exhibit 29. Post 2015, U.S. R&D intensity surged, reaching nearly 3.5 pct. of GDP by 2020, whereas both the EU and the Nordic countries have maintained stable but modest R&D spending. This divergence reflects not only differences in public funding levels but also the strength of private-sector R&D ecosystems, access to venture capital, and regulatory agility. However, the Nordics perform well compared to other EU countries in several aspects highlighted below.
It is important to note that the economies of the Nordics are performing well compared to other European countries and to keep this in mind when considering the current challenges facing the EU. Table 1 demonstrates that arguments presented by Dragi e.g., about the GDP developments of the EU do not hold true for the Nordic countries for the most part.
Table 1 Nordic countries are outperforming EU in a number of ways
Assessment of statements in the Draghi report
Assessment of statements in the Draghi report
DRAGHI STATEMENTS: | TRUE FOR EU | TRUE FOR NORDICS? | ||||
DK | NO | FIN | SE | IS | ||
Gap to US GDP has doubled between 2000 and 2023 | ✓ | ✕ | ✕ | ✓ | ✕ | ✕ |
Few STEM graduates compared with US | ✓ | ✕ | ✓ | ✕ | ✓ | ✓ |
Source: HBS Economics based on GDP data (real growth 2004-2024 from Worldbank), STEM-graduates (Eurostat, educ_uoe_grad04).
In addition, the Nordics are performing better in a number of areas such as regulatory barriers to investments, market-entry, digitalisation, and the development of capital markets (see exhibit 30).
Exhibit 30
Facts: Nordic performance metrics that enable investment and growth
Facts: Nordic performance metrics that enable investment and growth
- According to the EIB investment Survey 2024 Nordic firms see regulatory barriers as smaller barrier for investment than their European counterparts (EIB, 2024).
- According to the Fraser Institute the Nordic countries are on par with the US in terms of clearing the way for new market entrants (Igan et al., 2024).
- Small and medium sized businesses in the Nordic countries are highly digitalized in comparison to other European countries (DESI, European Commission 2024).
- Based on data from New Financial the depth of the Nordic capital markets is shown to be somewhere in-between the US and EU27 average. Capital market depth measures the amount of capital market investments (pension savings etc.) and activity in financial markets (i.e., size of financial markets, stock market listings etc.)
- Based on OECD data on Entrepreneurship financing venture capital investment in the US is still far more impactful in the US compared to the Nordics and Europe (OECD EFD, 2024).
Why firms merge abroad (and how)
Ahern (2025) presents a structured decision-tree model that explains how firms approach international expansion. This model draws from both economic and financial theory and outlines three sequential decisions that guide the strategies of multinational enterprises (MNEs): whether to expand abroad, how to govern foreign operations, and what form of investment to pursue.
Domestic vs. international activity
The first decision is whether to remain domestic or enter foreign markets. Firms weigh trade-related costs – such as tariffs, transportation, and regulatory barriers – against potential scale economies and revenue growth through international market access.Contracting vs. integration
If a firm chooses to operate internationally, the next question is how to structure foreign operations: via arm’s length contracts (e.g., with suppliers or distributors) or through integration under common ownership (i.e., becoming an MNE through foreign direct investment). Empirical studies support that more productive firms with high knowledge capital tend to choose integration, while less productive firms opt for arm’s length relationships (Helpman et al., 2004; Ahern, 2025).Greenfield investment vs. cross-border M&A
Once firms decide to integrate, they choose between building new operations (greenfield FDI) and acquiring existing firms (cross-border M&A). In practice, M&As dominate: they account for 60–70 pct. of inward foreign direct investment flows in Europe and even more in the United States and Europe (UNCTAD, 2024; European Commission, 2023).- Cross-border M&As are often preferred when quick market access is needed, especially in competitive sectors where pricing power and market position are critical (Ahern, 2025).
- M&As can also create value by enabling knowledge transfers. Firms can combine their own intangible assets (e.g., technology, brands, or managerial practices) with the acquired firm's local market know-how (e.g., customer relationships, regulatory understanding). This is harder in greenfield investments.
Finally, the role of M&A is particularly pronounced in digitally intensive and global sectors, where intangible assets like software, data, or platforms can be scaled across multiple markets. In such industries, M&A becomes a key tool for firms aiming to expand internationally and consolidate their market position. The association between intangibles and increased concentration is strongest in these contexts (Ahern, 2025; Bajgar et al., 2019).
While regulatory considerations significantly influence M&A decisions, geographical, cultural, and distance-related factors are also critical determinants of M&A success. Proximity often reduces transaction costs by simplifying communication, coordination, and logistics, enabling more seamless integration between merging firms.
Significant geographical distance can introduce complexity. Differences in time zones, language barriers, and varying management practices can impede efficient communication and operational integration, potentially undermining merger outcomes. For example, companies operating across disparate time zones may struggle to coordinate activities efficiently, leading to increased operational friction and costs. Firms in geographically distant locations may face challenges aligning operations and effectively integrating supply chains, particularly when significant infrastructural differences or logistical hurdles exist.
Moreover, cultural compatibility is essential for smooth post-merger integration. Differences in corporate culture, leadership styles, and governance structures can complicate collaboration, hinder knowledge transfer, and negatively impact organizational performance if not proactively managed. Recognizing these challenges and opportunities, we outline key factors that determine M&A activity.
It is exactly in this domain of the traditional barriers to M&A that the Nordic countries may have an edge given the proximity of the region in terms of culture, language, and geography.
Trends In M&A Activity (Global and Nordic)
Cross-border M&A peaked around 2020/21, then declined due to the pandemic, geopolitical tensions, tariffs, and rising interest rates. However, current estimates for 2025 point in the direction of improvements.
Exhibit 31 M&A across EU, US, and the Nordics
Number of M&As through 2008–2024
Number of M&As through 2008–2024
Sources: Statista & IMAA.
For the first half of 2025 the most volume (value of M&A deals) was in the Healthcare, Transportation and Technology sectors. The graph shows deal volumes in all the Nordic countries combined.
Exhibit 32 Healthcare, transportation and Computer & Electronics are top 3 sectors (2025)
Volume of M&A deals during the first and second quarters of 2025.
Volume of M&A deals during the first and second quarters of 2025.
Source: Mergermarket.
Looking at the Nordics large deals have been made already in 2025. Even though fewer deals have been negotiated during the first half of 2025 the deals so far are large as can be seen below. Generally Swedish and Norwegian deals account for around two thirds of the volumes; however, the Danish deals also play significant role in 2025.
Exhibit 33 The deal volume in Nordic M&A is increasing in 2025 despite fewer deals
Deal volumes and total deal count in Nordic countries (first and second quarters each year).
Deal volumes and total deal count in Nordic countries (first and second quarters each year).
Source: Mergermarket.
Exhibit 34
Nordic M&A facts
Nordic M&A facts
- Macro drivers: High uncertainty and trade tensions, particularly from US tariffs, continue to influence Nordic M&A markets. Despite this, deal activity remained strong in H1 2025. Total deal value reached EUR 84.2bn across 1,858 transactions, nearly matching H1 2024 levels.
- Cross-border share: Cross-border and intra-Nordic deals increased significantly. In Q2 2025, there were 187 outbound deals, 134 inbound deals, and 593 intra-Nordic deals. Among the 20 largest deals, 11 involved foreign bidders (≈55% of deal value). Country-specific cross-border shares: Sweden 63%, Denmark 62%, Norway 51%, Finland 43%.
- Private equity (PE) involvement (midmarket): PE investors accounted for 33% of total midmarket deal value and 26% of total deal volume in H1 2025. Compared to H1 2024, PE deal volume fell by 29% while deal value increased by 6%, indicating continued demand for larger PE transactions. Country-level PE deal volume in Q2 2025: Sweden 17%, Denmark 39%, Finland 28%, Norway 24%.
- Deal distribution across the Nordics (Q1 2025): Total deal volume was 914 deals. Country breakdown (proportional from EY data to match KPMG total): Sweden: 370 deals, Norway: 222 deals, Denmark: 177 deals and Finland: 139 deals.
- Top 5 sectors (Q2 2025): Technology, Media & Telecommunications (158 deals), Construction & Real Estate (124 deals), Services (117 deals), Manufacturing & Industrials (98 deals), Consumer & Leisure (71 deals) → These five sectors accounted for over 75% of all deals.