2 Phase 1 – Prioritisation of plastic data in the Nordics
The first phase of the project focused on identifying and prioritising the most important plastic-related data across the Nordic countries. This enables targeted efforts in developing and harmonising Nordic plastic statistics.
The phase followed a structured three-step approach visualised in Figure 1:
- Data Prioritisation: A systematic mapping of plastic-related policies, legislation, strategies and targets was conducted at the global, EU and national levels. This resulted in the identification of data points, from which 37 were prioritised based on legal significance and Nordic relevance.
- Data Availability Mapping: For the prioritised data points, the availability, comparability, and gaps in existing data were assessed.
- Cost–Benefit Analysis: A targeted evaluation of the costs and expected benefits of closing identified data gaps was carried out, focusing on environmental impact, regulatory compliance and policy value.
Key insights from Phase 1
- Waste-related indicators stand out as shared priorities
Indicators such as collection, recycling are most established across countries and anchored in legal mandates. - Availability and comparability vary significantly
Several high-priority indicators suffer from fragmented reporting or unclear definitions, especially trade, Put On Market, and waste generation. - Few data points are both high-impact and low-cost
Few "quick wins" exist in terms of filling gaps in data. Nevertheless, potential for cost-effective efforts exist by aligning existing reporting formats and definitions between the Nordic countries. - Production and trade data offer high strategic value
These data are already collected through existing product classifications, enabling immediate use with less additional cost than new data collection initiatives. When plastic content can be reliably estimated, they serve as critical inputs for modelling material flows and informing strategic decisions.
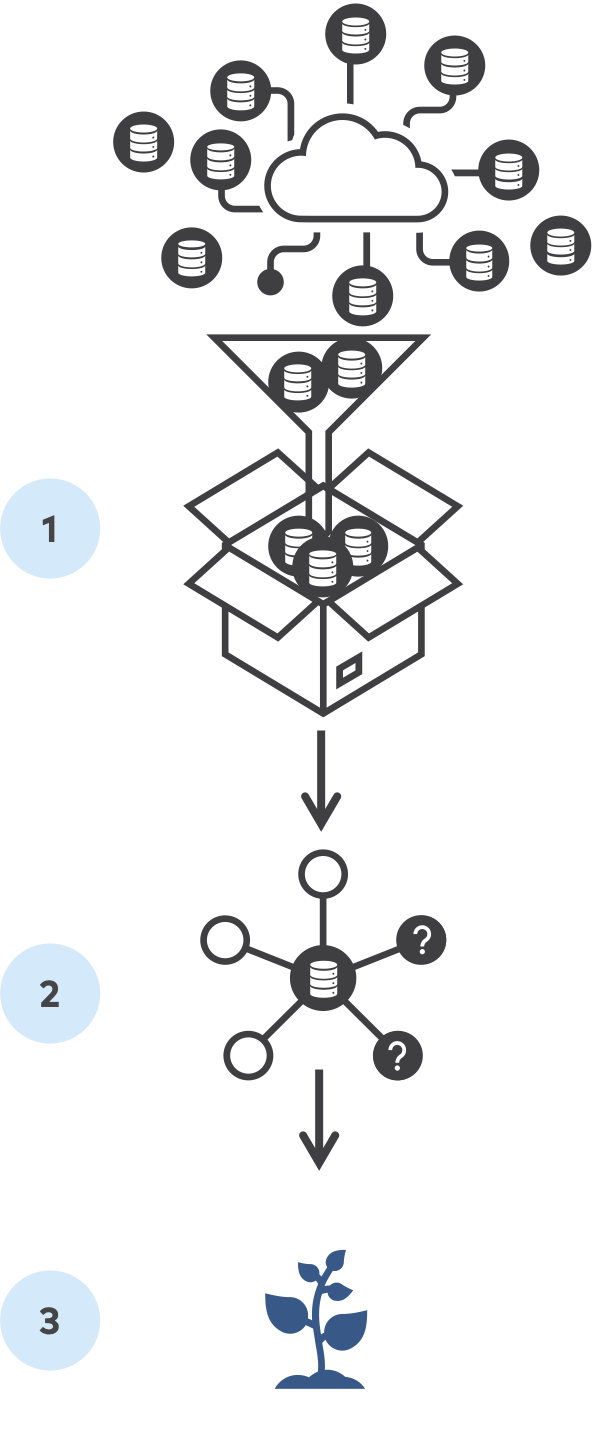
Figure 1 Phase 1 three step process visualisation.
2.1 Data Prioritisation
This first step aimed to systematically identify which plastic-related data are most relevant to harmonise across the Nordics, based on policy relevance.
Summary
A structured policy-to-data mapping process identified 37 high-priority plastic data points, selected based on their presence in global, EU and Nordic strategies and their link to measurable indicators.
- Waste treatment and packaging data were most anchored in legal mandates and widely referenced in both EU and national strategies.
- Trade, intermediate use and stock data showed lower and more fewer policy references.
- Sectoral analysis highlighted packaging as the most universally prioritised sector, followed by construction, textiles and transport.
This highlights the need for clearer definitions and shared methodologies to support future harmonisation and development efforts of plastic statistics.
The prioritisation followed a clear four-step process (Figure 2). First, relevant plastic policies and strategies were reviewed. Second, measurable indicators were identified and broken down into underlying statistical data points. Third, unique data points were filtered. Finally, these were linked to a prioritisation matrix based on relevance and policy demand.
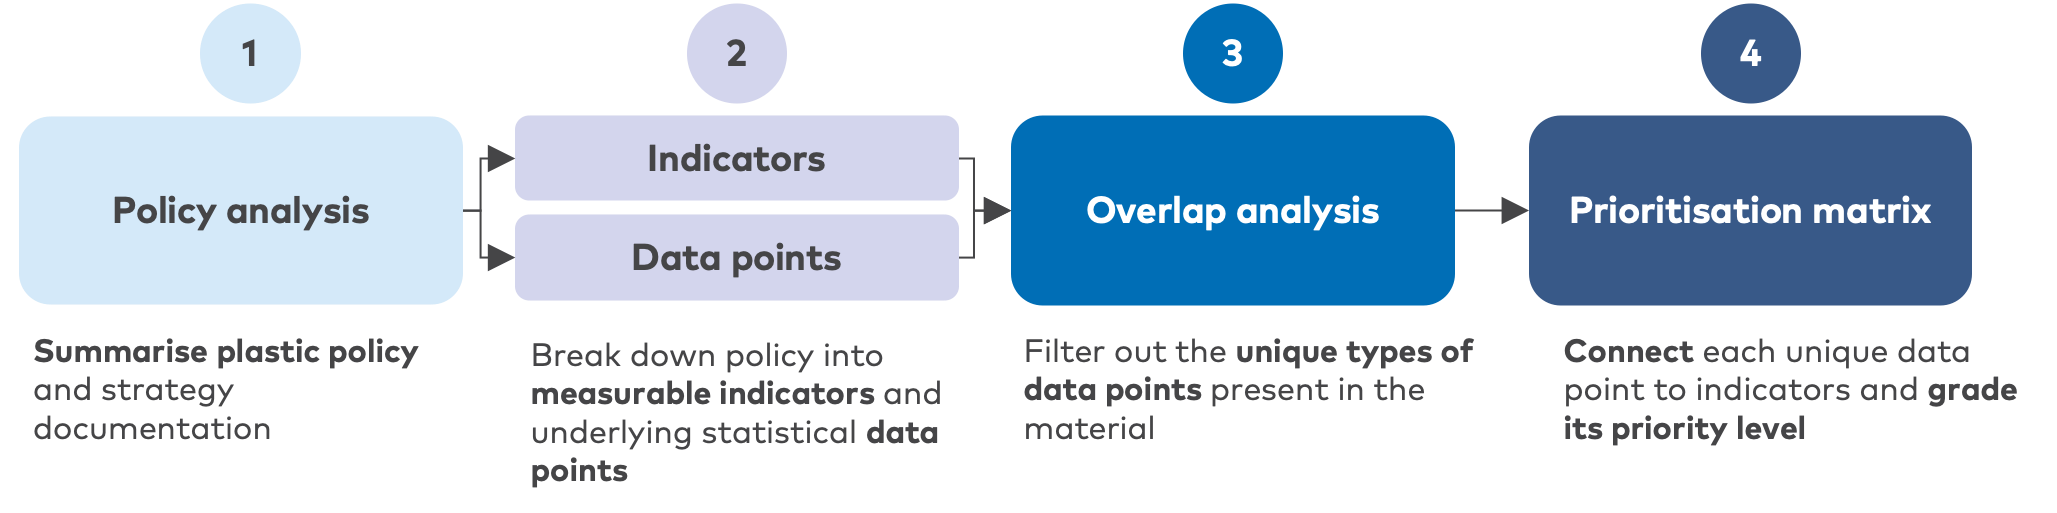
Figure 2 Overview of the prioritisation process for plastic-related data.
The full list of the reviewed policy and strategic documents can be found in Appendix A
This resulted in a shortlist of 37 priority data points for further analysis as shown in Table 3.
Key sectors
Table 2 summarises the sectors most frequently mentioned in major plastics-related frameworks, policies and strategies. The analysis confirms that the packaging sector stands out as the most universally referenced. This reflects the sector’s central role in plastic consumption, short product life cycles, and policy-driven targets.
Table 2 Industry overview
This is a summary of sources used to identify the industries that are the most relevant to plastic data:
- Top consuming sectors: Global Plastic Production by industry sector (Statista, 2017), Annual global plastic use (OECD (2022) – processed by Our World in Data)
EU Circular Economy Action Plan - UNITAR & UNEP (forthcoming 2025) Statistical Guideline for Measuring Flows of Plastic throughout the Life Cycle (draft, not yet public). Geneva: UNITAR.
- Sweco’s review, see chapter 2.1, Data Prioritisation
Industry | Top consuming sectors | EU CE action plan | UNITAR Plastic Keys | Policy review | Global Plastic Agreement |
Packaging | ✔ | ✔ | ✔ | ✔ | ✔ |
Construction | ✔ | ✔ | ✔ | ✔ | |
Transportation | ✔ | ✔ | ✔ | ||
Textile | ✔ | ✔ | ✔ | ✔ | ✔ |
Consumer & institutional | ✔ | ✔ | |||
Electrical & electronics | ✔ | ✔ | ✔ | ||
Fisheries & aquaculture | ✔ | ✔ | |||
Agriculture | ✔ | ✔ | |||
Industrial machinery | ✔ | ✔ |
Construction, transportation, and textiles also emerge as high-consuming sectors, cited in at least four of the five sources. These industries are significant plastic consumers and face increasing regulatory and sustainability scrutiny, particularly in relation to material efficiency and waste reduction.
Other sectors, such as consumer and institutional, fisheries and aquaculture, and agriculture, are referenced less consistently but still appear in multiple contexts. Their inclusion typically reflects environmental leakage concerns (e.g. fishing gear) or more targeted policy interests.
Industrial machinery and electrical & electronics are noted primarily in analytical frameworks like UNITAR or specific policy reviews, indicating a more specialised – but potentially underexplored – area for future data development.
By identifying the industrial sectors most frequently mentioned across frameworks, this overview supports the prioritisation of sector-specific data and helps align future statistical efforts with strategic policy needs.
The data prioritisation matrix form
The final prioritisation matrix evaluates data points based on their presence in policy documents, lifecycle relevance, and geographical demand. This ensures focus on the most policy-relevant and harmonisation-ready statistics.
Figure 3 Structure of the prioritisation matrix. The matrix links raw data points to policy-relevant indicators across different lifecycle stages. A scoring system ranks each data point based on mandate strength and regional demand.
MFA Category | Data point(s) | Indicator | Prioritisation | Geographical application |
We use the categorisation of how plastic materials move through different stages of a lifecycle connect the data to the plastic lifecycle | These are the raw figures or measurements collected by each country measured in units or by weight. | These are the metrics that are referred to in policy documents. These are sometimes equal to one data point but can also be a calculated result derived from multiple underlying data points. In the table relayed as a unique ID number. | A grading system to indicate the prioritisation of the data point according to a three-grade system:
| In this category we describe which Nordic countries (and/or EU) refer to the data points through the indicators mentioned in policy documents. |
Data Prioritisation – Results
The result from the first data prioritisation step was a data prioritisation matrix, following the structure shown in Figure 3, and a final list of 37 in-demand data points based on their use in indicators within the underlying policy documents as can be seen in the data prioritisation matrix in Table 3.
The prioritisation was based on the number of connected indicators in the data points, whether the data point is linked to an EU mandate or a national mandate in any Nordic country, and finally, its relevance to a high-level plastic economy MFA overview.
Table 3 Full data prioritisation table
MFA Category | Data point | Indicator(s) in policy documents | EU | NO | SE | FI | DK | IS | Global | MFA Relevant |
Production | Plastic packaging produced | 3 | • | • | • | |||||
Production | Production of primary plastic | 4 | • | • | • | |||||
Production | Production of primary bioplastic | 5 | • | • | • | • | • | |||
Production | Secondary plastic production (plastic raw material) | 10 | • | • | • | • | • | • | • | |
Put on market (POM) | Plastic packaging POM | 14 | • | • | • | • | • | • | • | |
Put on market (POM) | Plastic POM | 6 | • | • | • | • | • | • | • | |
Put on market (POM) | PCR content in plastic packaging POM | 1 | • | • | ||||||
Put on market (POM) | Plastic bags sold | 6 | • | • | • | • | • | |||
Put on market (POM) | Reusable plastic packaging POM | 3 | • | • | • | |||||
Put on market (POM) | Single-use PCR plastic bottles POM | 1 | • | |||||||
Put on market (POM) | Single-use plastic bottles (up to 3 litres) PET POM | 4 | • | • | • | |||||
Put on market (POM) | Single-use plastic bottles (up to 3 litres) POM | 10 | • | • | • | • | ||||
Put on market (POM) | Single-use plastic bottles (up to 3 litres) rPET POM | 4 | • | • | • | |||||
Stock | Plastic packaging reused | 1 | • | |||||||
Stock | Plastic packaging stored | 1 | • | |||||||
Trade | Plastic packaging waste exported | 1 | • | • | ||||||
Trade | Plastic packaging waste imported | 1 | • | • | ||||||
Trade | Primary plastic exported | 0 | • | • | ||||||
Trade | Primary plastic imported | 0 | • | • | ||||||
Trade | Secondary plastic imported | 0 | • | • | ||||||
Trade | Secondary plastic imported | 0 | • | • | ||||||
Trade | Plastic waste exported | 5 | • | • | • | • | • | • | ||
Trade | Plastic waste imported | 1 | • | • | • | |||||
Trade | Plastic packaging exported | 2 | • | |||||||
Trade | Plastic packaging imported | 2 | • | |||||||
Waste collection | Plastic packaging waste collected | 3 | • | • | • | • | ||||
Waste collection | Plastic waste collected | 5 | • | • | • | • | • | • | ||
Waste collection | Single-use plastic bottles (up to 3 litres) collected | 2 | • | |||||||
Waste collection | Single-use plastic bottles (up to 3 litres) PET collected | 2 | • | • | ||||||
Waste generated | Plastic waste generated | 1 | • | • | ||||||
Waste treatment | Plastic packaging recycled | 8 | • | • | • | • | • | • | ||
Waste treatment | Plastic waste recycled | 7 | • | • | • | • | • | • | ||
Waste treatment | Plastic waste to landfill | 2 | • | • | • | |||||
Waste treatment | Plastic waste to incineration | 3 | • | • | • | |||||
Waste treatment | Recycled plastic entering construction products | 1 | • | • | ||||||
Waste treatment | Plastic that meets recycling criteria | 7 | • | • | • | • | ||||
Waste treatment | Single-use plastic bottles (up to 3 litres) recycled | 4 | • | • | • | • |
The highest-priority data points are those required by EU law and reflected in multiple Nordic national strategies – e.g., plastic packaging produced, and plastic waste recycled. The highest demand overlaps occur in the waste treatment and packaging stages, suggesting alignment and potential for regional harmonisation. Several indicators appear only in one national policy, signalling areas of lower current alignment but potential long-term relevance.
Below follow some key insights from the policy review and prioritisation matrix:
- Few data points have universal policy referenceOnly a limited number of data points are referenced across global, EU, and national policy documents. These mainly concern plastic packaging (including bottles) and high-level statistics such as plastic waste generated, plastic waste recycled, and plastic placed on the market. These data points are in high demand but may also be among those for which data is, at least partially, already available.
- End-stage waste statistics, raw material production, and packaging data dominate policy attentionWaste treatment, plastic raw material production, and packaging account for the highest number of policy-linked data points. This reflects a clear regulatory focus on the beginning and end of the plastic lifecycle, while data is especially lacking for intermediary market aspects of non-packaging plastics.
- Trade-related data is inconsistently coveredTrade data points – such as primary plastic imported or secondary plastic exported – are referenced in few or no national strategies. This suggests a lack of coordinated policy demand in this area, potentially due to lower direct relevance for domestic plastic management. A similar, though less pronounced, pattern is observed for waste trade data.
- Put on Market (POM) data points are numerous but potentially fragmentedThere is a wide variety of Put On Market-related data points (e.g., plastic bags sold, reusable packaging, PET bottles), but their policy references vary significantly across countries. This fragmentation highlights the need for more consistent definitions, classifications, and data collection approaches to enable harmonisation.
The prioritisation matrix provides a robust foundation for identifying which plastic data points are most critical to harmonise. However, prioritisation alone is not enough and understanding the actual availability and comparability of these data points across Nordic countries is essential. Therefore, the next step assesses the current Nordic plastic data availability landscape to provide an overview of the current situation and identify where harmonisation can realistically begin.
2.2 Data Availability Mapping
The second step aimed to assess how accessible and comparable the prioritised plastic data are across the Nordic countries, in order to identify gaps, inconsistencies, and opportunities for harmonisation.
Summary
The data availability analysis highlights fragmented availability and suggests that plastic data availability in the Nordics tends to align with areas covered by EU and national legal mandates.
- Waste-related data are the most developed – 43% of waste indicators were reported as available, compared to only 17% for production and market data.
- Market, production and trade data are often missing or inconsistently reported.
- Comparability remains limited even where data exist, due to variations in definitions, scope and reporting methods.
These gaps highlight the need to align existing datasets and improve coverage in underdeveloped areas.
Clear gaps by country and data type
Through interviews and email correspondence with the Nordic countries Sweco assessed the data availability across the 37 prioritised data points across Sweden, Norway, Iceland, Denmark, and Finland.
The interview material was used to evaluate comparability—focusing on scope, definitions, and reporting structures—and the findings were summarised in a matrix that added an availability dimension for each data point to the existing matrix structure.
As shown in Figure 4, Sweden, Norway and Iceland accounted for all data points while for Denmark and Finland’s availability status is unconfirmed for most data points. Sweden reported 15 data points as available, 14 as partly available, and only 5 as not available. Norway and Iceland showed a similar distribution, though with a larger share of “partly available” data points.
Figure 4 Data Availability by country
In Denmark, 25 data points are marked as “unconfirmed” due to limited response; Statistics Denmark referred to CN nomenclature but did not confirm specific statistics. Finland had 30 unconfirmed data points; while unable to respond directly, Statistics Finland helped identify where relevant data might be located.
This divergence reflects different levels of coordination and institutional engagement with the mapping exercise.
As illustrated in Figure 5, data are more consistently available for waste-related data points – 43 percent of which were available – compared to only 17 percent availability for production and market-related data points. This reflects a systemic emphasis on end-of-life monitoring, which is more strongly regulated under EU waste legislation, and is therefore more developed than monitoring at earlier lifecycle stages.
Figure 5 Waste data is significantly more available than production data.
Key insights from comments and interview materialMargin text are paraphrased summaries of interviews with key informants from each respective country and are not direct quotations.
Margin text are paraphrased summaries of interviews with key informants from each respective country and are not direct quotations.
- Where data exist, comparability is not guaranteedNordic countries report plastics data under EU directives and EPR schemes, but national differences in methods, classifications and system boundaries mean that figures which appear complete on paper are not always comparable in practice.
- Data often exist but are unconfirmed due to decentralised ownership or unvalidated linksIn Denmark and Finland, many data points were marked “unconfirmed”. This highlights a difference in participation in this project, rather than complete absence of data. This underlines the importance of sustained commitment and capacity among key institutions – in particular national statistical and environmental agencies – to drive Nordic harmonisation of plastic statistics.
If the data are required by EU or national regulation, we know they exist and are audited
- “Partly available” often reflects fragmentation or lack of comparabilityThis category was commonly applied where:
- Definitions varied (e.g. composition categories differ across waste studies)
- Data were collected only through one-off research projects
- Data existed but lacked consistent reporting frequency or geographic coverage.
[Data] have been measured […], but only as part of short-term projects
- Waste management dominates available dataStatistical data are concentrated at the end-of-life stage of the plastic lifecycle. Quantitative information is particularly structured around waste treatment, collection, and recycling – especially for plastic packaging, where such data are tracked through established frameworks. In contrast, earlier stages such as market and production statistics remain less developed and lack equivalent structures. This reflects the EU’s historically waste-centric approach to reporting obligations.
Waste composition studies exist but vary in sampling protocol and scope
- In-use stock and reuse are the least developed areasData points on plastics in use, reuse models, and recyclability received the highest shares of “not available” and “unconfirmed” ratings. These metrics typically fall outside legal mandates and are not covered by existing statistical frameworks. Moreover, concepts like recyclability require common definitions, which further complicates measurement efforts.
Some academic models estimate in-use plastic stock, but there is no harmonised approach
While several high priority data points are already well established through EU directives and national strategies, the analysis highlights critical gaps in comparability, especially for high-level data points or data points outside formal mandates. This reveals not only where harmonisation efforts can begin, but also where targeted investments in data consistency and reporting frameworks are needed to build a functional and more harmonised Nordic plastics statistics system.
2.3 Cost-Benefit Analysis
Summary
The cost–benefit analysis revealed that few data gaps offer both high benefit and low implementation cost. Instead, the most promising candidates for early action are those focused on harmonising and developing methodologies for existing data.
- Harmonising definitions for already collected data on plastic waste recycling emerged as the most actionable priority – combining strong policy value with moderate implementation effort.
- Market, trade and production data offer long-term potential through existing sources (e.g. CN/PRODCOM codes) but require efforts to ensure accurate plastic-share estimates.
- Sector-specific waste flows are also high-value but require greater coordination and investment to close data gaps.
- Intermediate use, in-use stock, and recyclability scored low across both dimensions due to unclear definitions, more limited demand, and high methodological complexity.
The analysis suggests focusing early efforts on aligning existing waste data, while preparing scalable methods for more complex flows.
The cost–benefit analysis provides a structured foundation for prioritising the most promising data gaps for harmonisation. Data gaps vary widely in both cost and strategic value. Some offer high policy relevance and are relatively easy to address, while others require significant effort with limited payoff. To prioritise action, Sweco conducted a light cost–benefit analysis (CBA) of the prioritised plastic data points – comparing indicative implementation costs against their strategic policy value.
The goal was to support efficient resource allocation by identifying which data gaps are both high-value and realistically addressable. Each data point was evaluated along two dimensions:
- Cost of closing the data gap, including labour intensity, technical complexity, and data quality issues – graded on a five-point scale from readily available to requiring entirely new collection efforts with expert validation.
- Benefit of closing the data gap, calculated by combining multiple value aspects – environmental, analytical, policy, and harmonisation relevance – into a single weighted five-grade score.
The resulting cost-benefit matrix provides an overview of which data points offer the greatest cost-effectiveness for further development or harmonisation efforts. A detailed description of the cost-benefit methodology can be found in Appendix B.
Where to focus efforts – Results from the cost benefit analysis
Table 4 summarises seven insights from the cost–benefit analysis, grouped by their relative value and implementation effort. Each is explored in more detail on the following pages.
Table 4 Key insights on where to focus plastic data development efforts
 Strategic insight |
|
 High value, medium effort |
|
 High potential, higher effort |
|
 Limited value or feasibility |
|
Rather than identifying quick wins, the analysis points to the strategic value of harmonising existing data. Plastic waste, production, and trade emerge as priority areas—offering high value if classification, plastic-content assumptions, and reporting standards can be aligned through stronger coordination. These constraints shape both feasibility and the assumptions underlying the next section.
Realising these benefits will require direct collaboration between the responsible authorities in each country to establish common ground and shared direction.
2.4 Assumptions and limitations
This analysis aimed to provide a structured and methodologically grounded basis for identifying and prioritising key data development opportunities in the Nordics. However, several assumptions and limitations should be noted when interpreting the results.
Time constraints and scope
- The analysis was conducted within a clearly defined timeframe, using a consistent framework and methodology across countries. However, the availability of key informants proved to be a limiting factor in some cases – particularly in Denmark and Finland – where some stakeholders were unable to participate during the period when input was needed. This affected the level of detail achievable, especially in the data availability stage.
Limitations in data sources and stakeholder input
- The policy review was based on publicly available documents at the time of writing. While efforts were made to ensure completeness – including outreach to relevant Nordic stakeholders and UNITAR – some relevant policies, including newly adopted ones, may not have been captured.
- The data availability assessment relied on input from national stakeholders. As Denmark and Finland were unable to participate to the same extent as Sweden, Norway, and Iceland, the analysis for these countries is incomplete. In Denmark, Statistics Denmark referred to general CN nomenclature but did not confirm specific data points. In Finland, Statistics Finland could not respond directly but supported the process by indicating where data might be located. As a result, several indicators in these countries are marked as “unconfirmed”.
Assumptions underlying the cost-benefit analysis
- The cost-benefit analysis is not a full economic evaluation, but a structured expert assessment. It estimates relative effort and value rather than absolute costs or quantified benefits in monetary terms.
- Scoring of benefits (e.g. environmental, analytical) is inherently more subjective than cost estimation and reflect expert assessment rather than monetised impact.
- Assumptions about what drives cost and benefit – such as institutional complexity or analytical value – may differ across national contexts.
Other factors to consider
- Even when terminology is aligned, indicator definitions may vary in practice, affecting cross-country comparability.
- The findings reflect the current state and may need to be revisited as new data or policies emerge.
Despite these limitations, the framework provides a useful basis for strategic discussions and future investment planning, especially when updated iteratively as new information becomes available.