6. Comparative analysis of the Nordics and EU
6.1 Sustainable Development Index Comparison
All of the Nordic countries' global SDI ranking has declined since 2000. Sweden was the highest-ranking Nordic country in 2000 with a 51st place, followed by Norway on 97th place, Finland ranked 106th, Denmark 107th and Iceland on 130th place. Figure 34 below shows that throughout time all Nordic countries have converged towards each other. In 2022, all Nordic countries declined to rank 134 for Sweden, 136 for Denmark, 147 for Finland, 152 for Iceland and 155 for Norway, respectively.
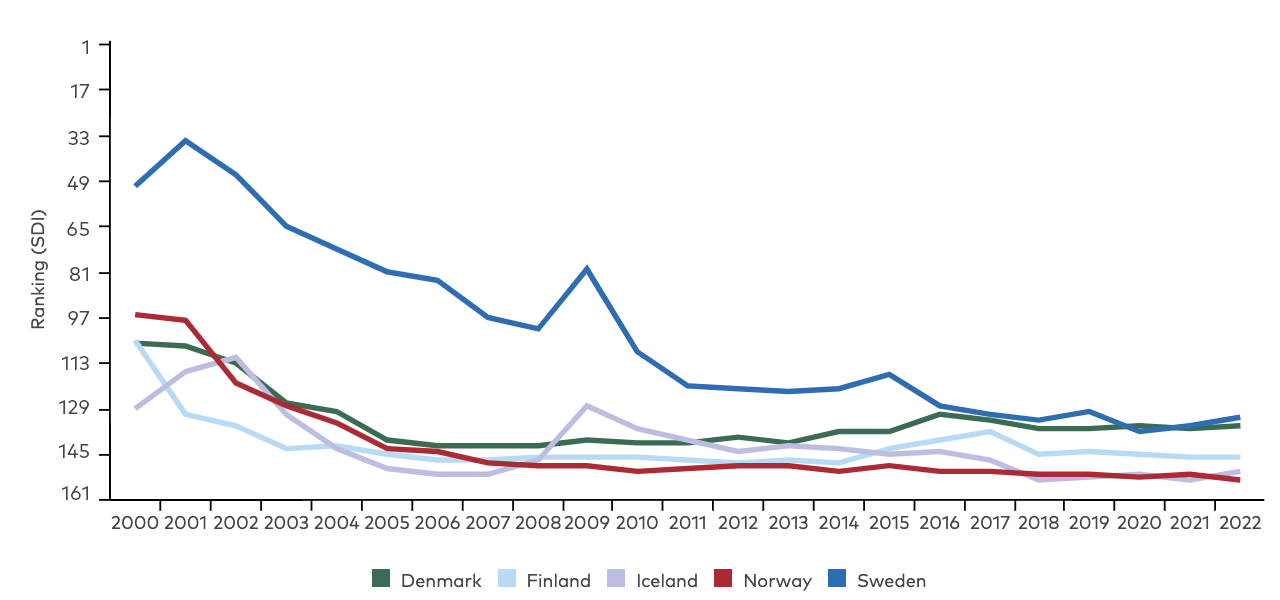
Figure 34: Nordic countries global SDI ranking development
In 2022, the Sustainable Development Index (SDI) for the EU-26 average is estimated to be 0,5. Upon analysing the data for all the Nordic countries, it becomes evident that each country in the Nordic region scores lower on the SDI than the EU-26 average. See figures 35 and 36 for details.
Among the Nordic countries, Sweden achieves the highest score with a total of 0,38. Denmark follows as the second-highest with a score of 0,36. Finland ranks in the middle of the Nordic countries, with a score of 0,25. Meanwhile, Norway ranks lowest among all the Nordic countries, with a score of 0,18, followed by Iceland with 0,19.
Globally, the top performers are Costa Rica, Uruguay and Sri Lanka, with scores 0,833, 0,832 and 0,832, respectively. The time series data reveals that all Nordic countries, except Denmark, have experienced a decline in their SDI between 2008 and 2022. The EU-26 average increased from 2008 to 2016, reaching an average score of 0,61. Since 2016, the EU-26 average has declined to 0,50 by 2022, returning to the same level as in 2008.
Figure 35: Nordic countries and EU-26 trends in Sustainable Development Index data.
*Note: Average for EU-26 has been calculated, as no data is available for Estonia
Source: Sustainable Development Index, 2024 and authors own calculations
2008 | 2011 | 2014 | 2016 | 2018 | 2019 | 2020 | 2022 | |
Denmark | 0,31 | 0,38 | 0,41 | 0,46 | 0,40 | 0,40 | 0,41 | 0,36 |
Iceland | 0,28 | 0,38 | 0,37 | 0,34 | 0,20 | 0,21 | 0,22 | 0,19 |
Norway | 0,26 | 0,25 | 0,24 | 0,25 | 0,22 | 0,21 | 0,22 | 0,18 |
Finland | 0,28 | 0,30 | 0,34 | 0,37 | 0,27 | 0,27 | 0,26 | 0,25 |
Sweden | 0,53 | 0,49 | 0,51 | 0,49 | 0,42 | 0,43 | 0,41 | 0,38 |
Average EU-26* | 0,50 | 0,55 | 0,59 | 0,61 | 0,54 | 0,54 | 0,54 | 0,50 |
Figure 36: Overview of Sustainable Development Index, Nordic countries and EU-26
*Note: Average for EU-26 has been calculated, as no data is available for Estonia
Source: Sustainable Development Index, 2024 and authors own calculations
By examining the underlying data and subcategories related to material footprint per capita in tonnes, a positive trend emerges for Denmark, Finland and Sweden. Between 2008 and 2022, their material footprint per capita decreased. The largest decrease can be seen for Finland, with a 57 percent decrease, followed by Denmark with 45 percent. As for Sweden, a smaller decrease of 1 percent can be seen in the same time period.
However, in Norway and Iceland, a negative trend is evident, as the material footprint per capita in tonnes increased during the same time period. In Norway, the increase is 38 percent and 7 percent for Iceland. Notably, the EU-26 average also decreased over this period with 30 percent. See figure 37 below. The Nordic countries are subjected to more resource intensive economies compared to EU-26 countries.
2008 | 2011 | 2014 | 2016 | 2018 | 2019 | 2020 | 2022 | |
Denmark | 32,59 | 27,64 | 25,33 | 25,05 | 25,93 | 25,64 | 24,31 | 25,8 |
Iceland | 29,44 | 22,41 | 22,26 | 25,59 | 33,14 | 29,56 | 26,77 | 30,5 |
Norway | 35,89 | 34,78 | 34,70 | 34,43 | 35,26 | 36,87 | 35,39 | 41,6 |
Finland | 38,69 | 34,08 | 31,53 | 31,08 | 32,52 | 30,04 | 30,88 | 30,1 |
Sweden | 24,33 | 24,65 | 23,95 | 23,62 | 24,20 | 23,56 | 24,26 | 24,1 |
Average EU-26* | 24,2 | 21,8 | 19,3 | 18,9 | 19,6 | 19,4 | 18,7 | 19,8 |
Figure 37: Overview of material footprint per capita, Nordic countries and EU-26
*Note: Average for EU-26 has been calculated, as no data is available for Estonia.
Source: Sustainable Development Index, 2024 and authors own calculations
Challenges in Comparing Material Resource Impacts Across Countries
While we acknowledge that the use and consumption of material resources and their environmental impacts are critical policy concerns for any country, regardless of their rankings on various welfare measures. Different materials such as metals, minerals, biomass etc. have vastly different environmental impacts, this makes it challenging to compare them solely by weight. The environmental impact of material consumption varies significantly across different countries. For example, the same quantity of biomass has different environmental footprints depending on whether it's used in a humid tropical region or a semi-arid one. Due to these variations, it is difficult to compare material consumption across countries or to establish standardised environmental targets. In summary, the SDI is subjected to some criticism as there are challenges in international comparability and environmental target setting (Lafortune, Sachs et. al, 2020).
Increased standard of living in all Nordic countries
From 2008 to 2022, the gross national income per capita in purchasing power parity (PPP) has risen in all the Nordic countries. Iceland experienced the largest increase of flow of goods and services, followed by Denmark. See figure 38 below for an overview of selected years. In terms of highest standard of living, Norway has kept its place as number one, throughout the period 2008 to 2022, followed by Denmark in second place.
2008 | 2013 | 2016 | 2018 | 2020 | 2022 | |
Denmark | 53 564 | 53 099 | 55 515 | 57 733 | 57 324 | 62 019 |
Iceland | 41 671 | 48 036 | 53 754 | 55 716 | 51 984 | 54 688 |
Norway | 63 719 | 63 024 | 66 257 | 67 394 | 66 258 | 69 190 |
Finland | 48 899 | 45 512 | 46 417 | 48 242 | 48 176 | 49 522 |
Sweden | 49 623 | 49 550 | 51 656 | 53 389 | 53 195 | 56 996 |
Figure 38: Overview of development of Gross national income (GNI) per capita, PPP (constant 2017 USD) in the Nordic countries.
Source: Sustainable Development Index, 2024
As previously discussed, the SDI incorporates different development trajectories. High-income countries, such as the Nordics with high ecological impact must reduce emissions, while middle- and lower-income countries should rather focus on social policy. The SDI provides a nuanced perspective on progress, while accommodating diverse national contexts, combined with emphasising both human development and ecological sustainability (Hickel 2020).
6.2 Transitions Performance Index Comparison
The average score within the EU is 69 compared to a global average of 52. In a Nordic context, all the countries score between the Good transition and Transition leader tier, with a Nordic average of 70 - slightly above EU average.
2011 | 2012 | 2013 | 2014 | 2015 | 2016 | 2017 | 2018 | 2019 | 2020 | |
Denmark | 74 | 75 | 75 | 76 | 77 | 77 | 77 | 77 | 78 | 78 |
Finland | 66 | 67 | 67 | 68 | 67 | 67 | 68 | 67 | 68 | 67 |
Iceland | 60 | 60 | 61 | 60 | 61 | 61 | 61 | 61 | 61 | 61 |
Norway | 68 | 69 | 68 | 69 | 69 | 69 | 69 | 70 | 71 | 71 |
Sweden | 71 | 71 | 71 | 71 | 71 | 71 | 72 | 72 | 72 | 72 |
EU 27 | 69 | 69 | 68 | 68 | 68 | 67 | 67 | 67 | 66 | 66 |
Figure 39: TPI Index Score 2011-2020 for Nordic Countries and EU 27 average. Source: TPI database
All Nordic countries score highest on the social and governance dimension, whereas the environmental dimension is the lowest and economic dimension the second lowest scoring. The score for the environmental dimension for all countries except Denmark, is much lower than the other three dimensions. This shows a clear strength in the Nordics on social welfare and governance. Whereas the high living standards in the Nordics, including e.g. consumption patterns such as material footprint, have a significant negative effect on the overall environmental scoring.
Sweden and Denmark are both in the highest scores, above EU27 average. Whereas Norway has had a slight increasing trend putting them above average from 2014 and beyond. Finland is overall close to the EU27 average with an inclining trend. Iceland is the country in the Nordics with the lowest average score ranging between 59-61 on average. Overall, all the countries have experienced an inclining trend from 2011-2020, with all the countries except Iceland scoring in the two highest tiers.
On the other hand, dividing the scores into each dimension respectively, shows the differences between the dimensions across the countries and how it has changed over the years. Below are four graphs showing the Nordic countries´ performance compared to EU27 average for each dimension over a ten-year period.
Figure 40: Each Nordic country´s ranking compared to EU27 average divided into each dimension from 2011–2020.
The 5 countries have commonalities in their internal rankings between the dimensions. All 5 countries have the highest scores on both social and governance transitions, whereas the lowest ranked dimension for all the countries is the environmental dimension, followed by the economic dimension. The environmental transition is the only dimension where the EU27 average is not the lowest score. Denmark is the only country that scores above the EU27 average and Iceland scores the lowest.
6.3 Doughnut Economy Indicators Comparison
Comparing the Nordics to the EU24 average
Data is missing for Cyprus, Luxembourg and Malta so this average is for the EU24. The UK is not included due to current lack of EU membership, even though it was a member of the EU during the period covered by the data.
Given the complexity of the doughnut indicators it is impossible to make longitudinal comparisons of countries on the same graph. Thus, alongside the country graphs offered in each Nordic country section this country displays a number of snapshot comparisons to directly compare the Nordic countries to the EU average at various points in time.
It is remarkable how poorly the Nordic countries perform relative to the EU24 average across biophysical indicators. Taking a snapshot via the 2015 data we can see that Denmark was the only country to perform better than the EU24 average across any of the biophysical indicators. And even in this case Denmark only shows superior performance to the EU across three indicators: land-system use, nitrogen and phosphorus. Denmark has also managed to remain fairly close to the sustainability boundary across two of these indicators: the phosphorus and land-system change. However, while its performance regarding phosphorus is improving over time, changes in land-systems are moving the country further from sustainable levels. Across all other indicators Denmark performs worse than the EU average, while every other country performs worse than the EU average across every indicator. Poor performance is relatively equally spread across the countries, with every country performing worst across at least one indicator. Notably Denmark, along with Norway, performs worst in two indicators. Every country except Denmark also ranks second from bottom in at least one indicator, although here Finland stands out by performing second-worst in three indicators.
Given the longstanding reputation of the Nordic countries as environmental leaders, this is a startling conclusion. The 2015 comparison across all indicators can be seen in the graph below:
Figure 41: comparing Nordic and EU24 ecological performance, 2015.
Source: adapted by authors from data in Fanning et al. 2022 and The Good Life Project.
Looking at a snapshot from the year 2000 we see this poor performance is nothing new, with the main notable changes being Denmark’s improving its performance in regarding phosphorus levels to go from exceeding the EU average in 2000 to falling below it by 2015. Notably Finland leapt from being the top performer in terms of carbon emissions in the year 2000 to falling behind Sweden by 2015.
Figure 42: comparing Nordic and EU24 ecological performance 2015.
Source: adapted by authors from data in Fanning et al. 2022 and The Good Life Project.
When we turn our attention to social indicators the data tracks the long-documented observation that the Nordic countries perform better than the average of their European peers. There is only one instance of a Nordic country performing worse than the EU average across any indicator in the most recent 2015 data, and this is Sweden’s performance regarding nutrition which lags significantly behind the rest of the region. This superior performance is also seen if one leaps back to the data from the year 2000, with the only further exceptions beyond Sweden’s persistent nutritional issues are Finland (1.38) joining Sweden (1.33) in dipping below the EU average (1.48) for nutrition and Finland’s employment score of 0.84 falling slightly below the EU average of 0.88.
For the EU24 income poverty, employment and life satisfaction are consistently below the social threshold over the time series. In the Nordic countries it is only employment that consistently dips below the threshold (aside from a low starting point for education in Sweden) and even here it is only Sweden and Finland who remain consistently below the threshold, with Norway remaining above it for the entire period and Denmark only suffering two fairly limited stretches below it. Notably in 2015 Finland remained the worst performer in the Nordics with respect to employment outcomes; whereas the other Nordic countries obtained 2015 scores almost as high as (in the case of Norway) or higher than (in the case of Sweden and Denmark) their 2010 levels, Finland was still at a score of 0.89 in 2015, still higher than but close to the EU average of 0.85 and indicating the hardest hit from the 2009 financial crisis.
There is a high level of convergence across the Nordic countries, as seen in 2015 data, where for 7 of the 11 indicators (Life Satisfaction, Life Expectancy, Income Poverty. Access to Energy, Social Support, Democratic Quality, Equality) the difference between the largest and smallest values within the Nordic countries is as small or smaller as the difference between the EU average and the next closest Nordic country; this supports the impression of the Nordics as their own unique pocket of the European community. Another notable observation is the dramatic dip and then spike seen in educational outcomes across Sweden and Finland. From the year 2000 to 2010 both countries saw a dramatic decrease in educational performance, with Finland falling far closer to the EU average than many of its peers with a normalised score of 1.14 (vs an EU average of 1.11) and Sweden actually dipping significantly below it with a score of 1.03. However, in a sign of a concerted policy response to this dip both Finland and Sweden then leapt above their peers across the Nordics and EU at large to become the top and second top educational performers, with respective scores of 1.61 for Finland and 1.51 for Sweden compared with an EU average of 1.21.
Figure 43: Comparing Nordic and EU24 Performance Across Social Indicators, 2015.
Source: adapted by authors from data in Fanning et al. 2022 and The Good Life Project.
Figure 44: Comparing Nordic and EU24 Performance Across Social Indicators, 2000
Overall, these findings track other observations in the literature, such as the suggestion by Helliwell et al., (2020) that the most important reasons for the happiness of the Nordic countries are high levels of income, extensive social benefits, low corruption, well-functioning state institutions, as well as a clear sense of autonomy, freedom, and social trust among citizens.
6.3a Comparative analysis from the alternative study
As noted in the country analyses for Denmark, Sweden, and Finland an alternative study using the doughnut economy framework has been conducted for EU countries, using a different methodology and a different set of social and ecological indicators (Gómez-Alvarez Díaz et al. 2024). While the data used spans a number of years, it is generally slightly more recent than the 2015 data used in the other paper (see section 4.2c). Thus, while this study cannot be taken as a direct extension of the findings from the older data, it provides a useful point of comparison. The graphs below plot the comparative performance of Denmark, Finland and Finland and the EU26 average across ecological and social indicators, as well as integrative measures of an overall social baseline and ecological ceiling. The % values in each case indicate how far the country is either falling short of a social indicator or transgressing an ecological one. Thus, higher values indicate worse performances in both cases
Figure 45: Overshoot distance of ecological dimensions (%)
Figure 46: Undershoot of social dimensions (%)
What is interesting to note here is that, overall the three European Nordic countries appear to perform better ecologically under the 2015 data but worse socially; there are fewer, smaller instances of ecological boundary transgression and the Nordics are far closer–and in Sweden’s case significantly below–to the EU average here. Meanwhile there are far more instances of social shortfall than in the other data, and many cases where the Nordics perform comparably poorly or worse than their EU peers. What is going on here? Two points are worth observing:
First, the different choice of indicators and underlying data sources is likely significantly responsible for these results. With respect to ecological boundaries, for example, neither material or ecological footprint feature as they do in the earlier dataset and these are indicators where the Nordic countries have performed notoriously badly. Similarly, not only does the social floor comprise different categories, encompassing areas such as internet and transport connectivity which do not feature in the prior data, but the underlying data for these indicators is also unusual in places. For example, the surprisingly poor performance in the social equality indicator is explained by the fact that the underlying data are survey results for the proportion of the population who believe that income equalities are not currently too high–an entirely subjective measure–rather than the more standard measures such as the Gini coefficient.
Second, with respect to performance relative to the EU it is interesting to observe that the small countries of Cyprus, Malta and Luxembourg, for whom there was no data in the alternative dataset, perform disproportionately badly according to this data. This can be seen in fig. 47 below. Given the EU26 average is an average of relative boundary transgressions, that is to say the size of each country will not determine the size of its contribution to the average, this poor performance likely drags the EU average down considerably. Combined with the exclusion of on-EU member Norway, a particularly poor ecological performer according to the other data, this goes a significant way to explaining the closing of the gap between the EU and the rest of the Nordic countries seen in the prior analysis.
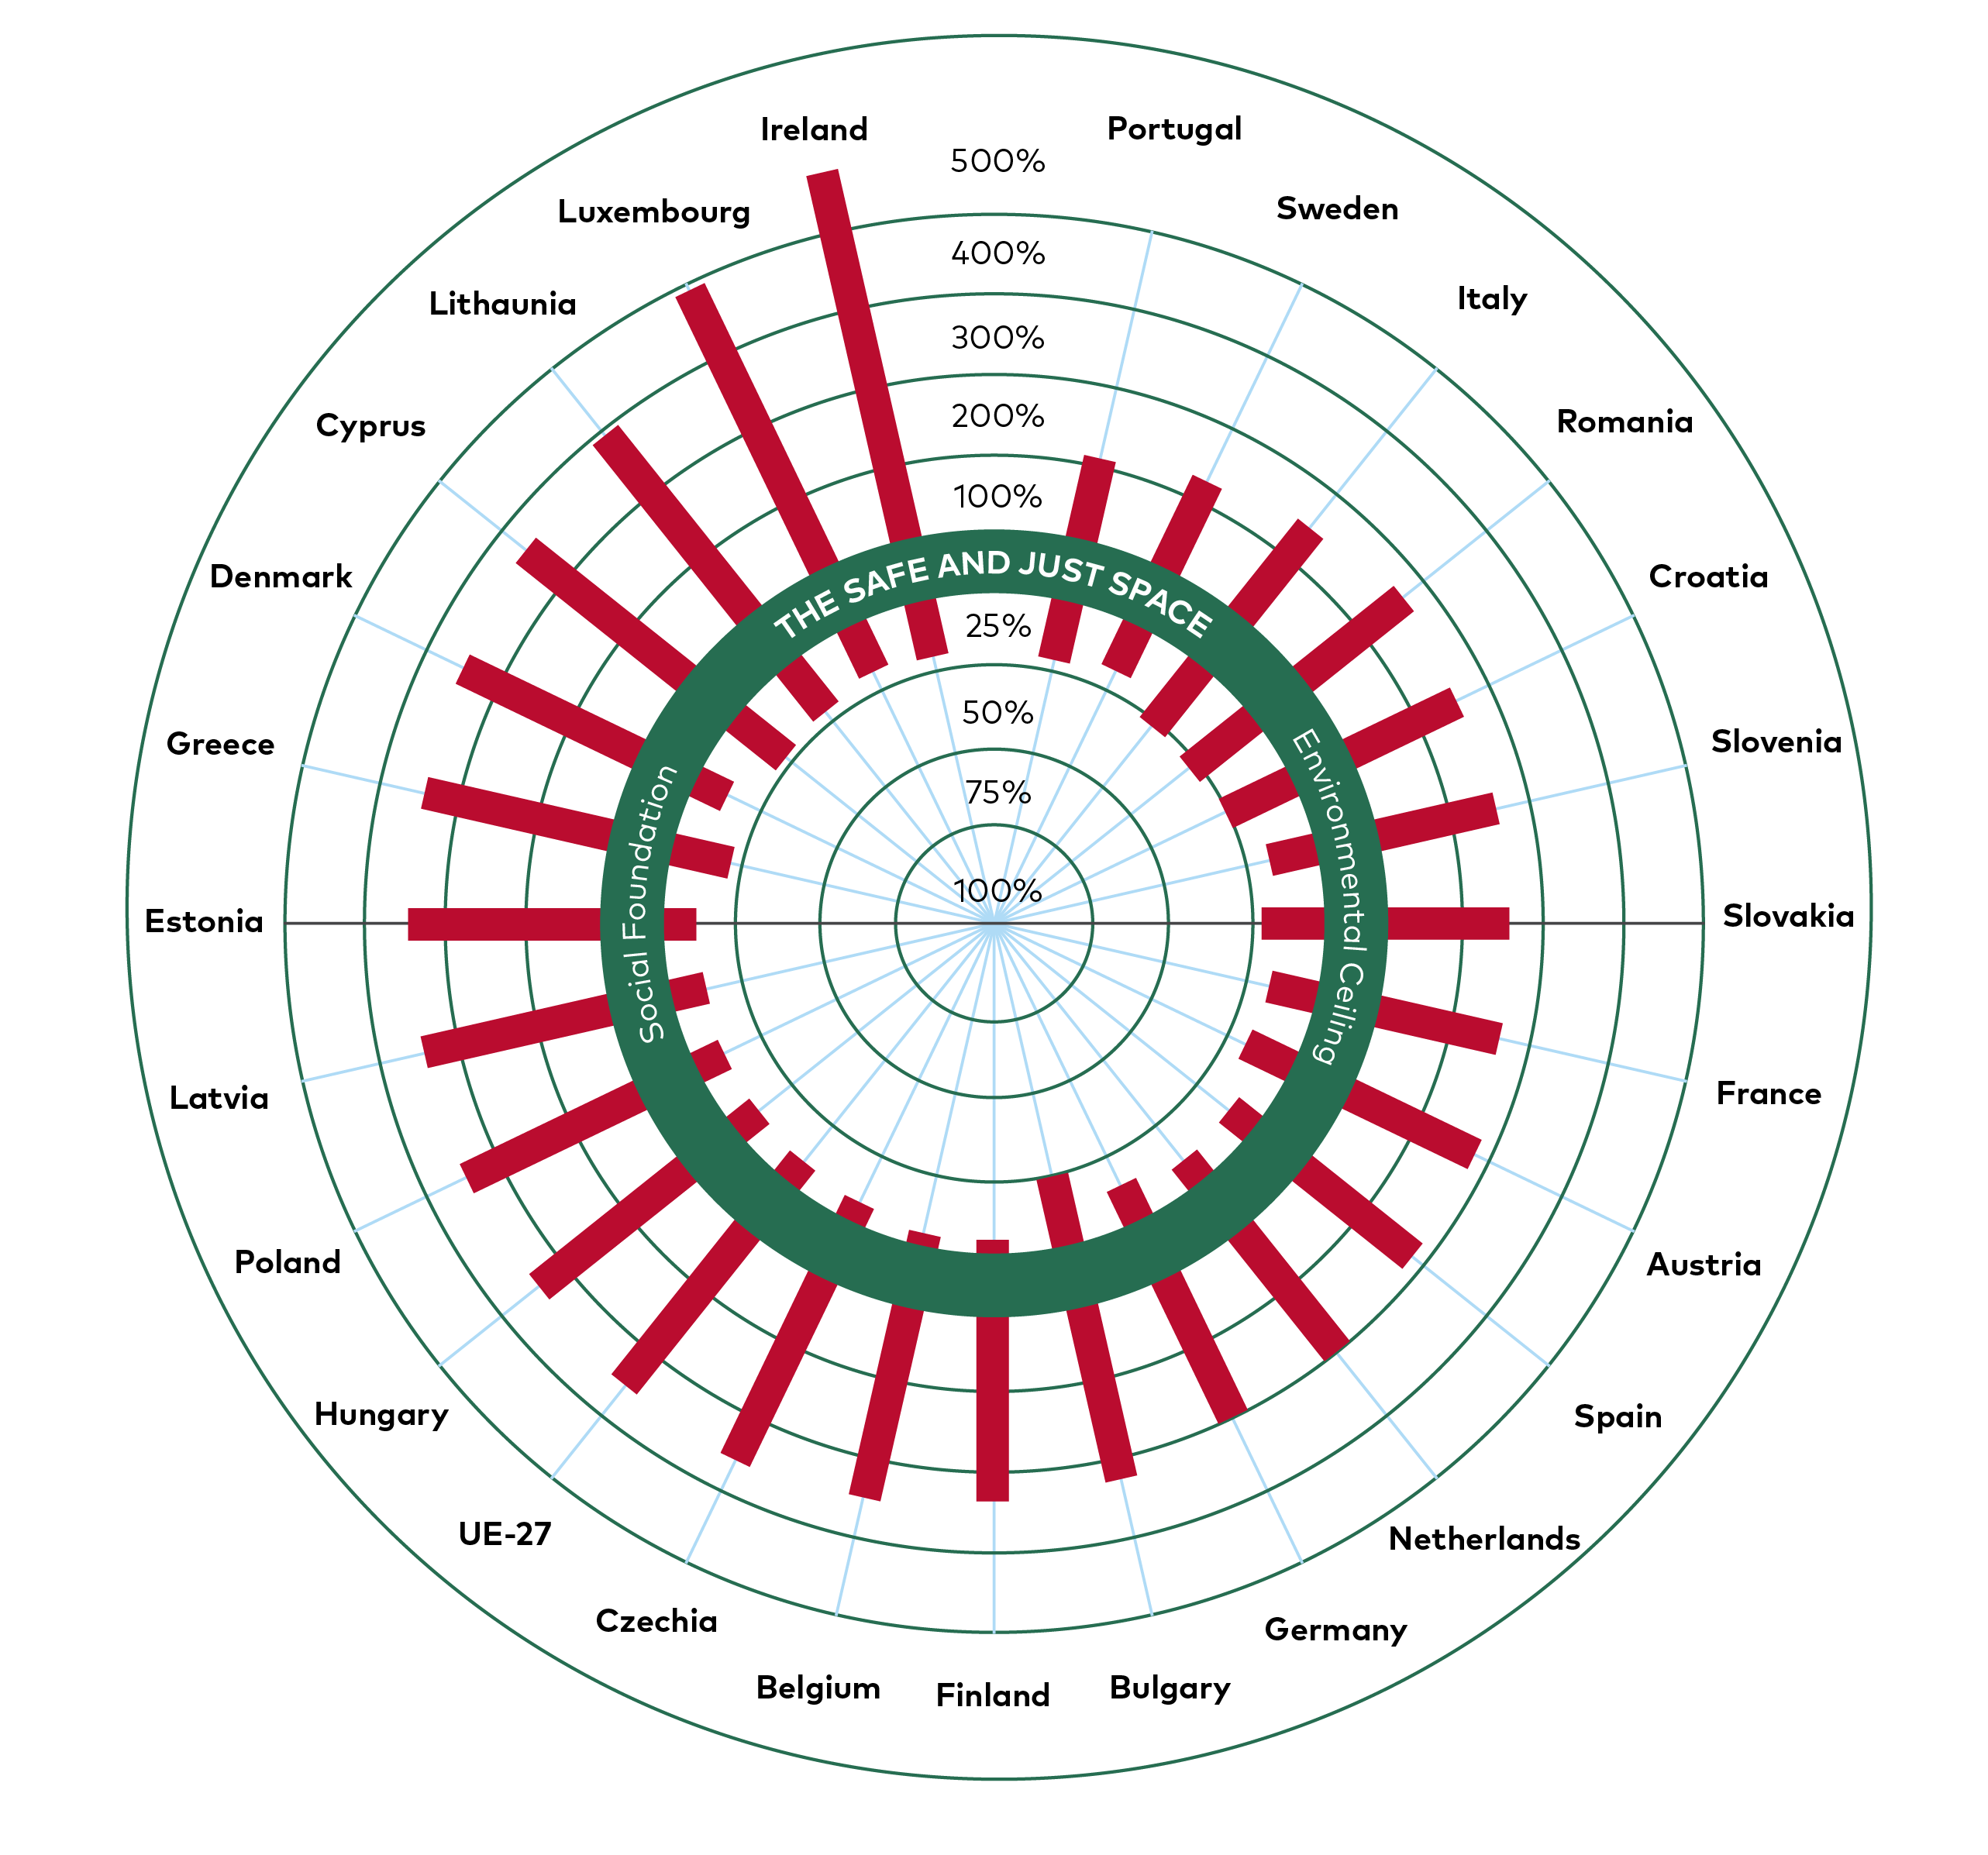
Figure 47: Comparison of EU26 performance keeping within the SJS boundary
Source: Gómez-Alvarez Díaz et al. (2024)
Overall, the more recent –while still at the time of writing quite out of date, given the global shocks of 2020 onwards-data contained in this second paper, should not be interpreted as telling a vastly different story to the primary data used in our analysis. Different measures, methods and underlying data sources drive many of the most notable deviations and the key finding remains the same: the Nordic countries perform relatively well in terms of social provision, but at an entirely unsustainable level of ecological impact.