5. Country analyses
5.1 Denmark
5.1a Alternative metric landscape in Denmark
Denmark has a few on-going initiatives towards Beyond GDP. All initiatives have been established within the last five years, indicating that the on-going initiatives are still only in an investigating and implementing stage. According to the report “Towards a Wellbeing Economy” (Birkjær, Gamerdinger, & El-Abd, 2021) from 2022 by the Nordic Council of Ministers and the Danish “The Happiness Research Institute”, Denmark is the only country in the Nordics that does not qualify as a wellbeing economy, as they are not progressing their work with wellbeing measures further from the monitoring stage to policymaking and prioritisation. This is further supported by a report published by the Danish National Audit from 2020 (Folketinget, Rigsrevisionen, 2020), that concludes that the Danish ministries´ work with the SDGs in the period 2015-2020 were not developed into further policymaking with the argument that the general practice in the ministries already follows the general policy of the SDGs. However, a lot has happened in the Danish political arena since then.
In 2020 the Danish government passed the Danish Climate law (Lov om Klima [Klimaloven], 2020) with the aim to mitigate 70% of the Danish GHG emission levels by 2030, relative to 1990. It is stated in §7 of the Climate law, that the Danish government is obliged to describe the status of the national work in pursuing international multilateral climate goals. The nature of the climate law is heavily based on monitoring and technological development, as it requires the government to keep status on yearly climate projections and scientific progress. The climate law has been critiqued in the way it upholds the status-quo and favours industries and not the civil society, by not catalysing rapid action (Veng, Papazu, & Ejsing, 2023). Although the law was historical in Danish climate politics, it is unsure whether its juridical design is leading to action efficient enough to live up to its ambitions.
As of June 2024, the Danish government released a new “green agreement” (Økonomiministeriet, 2024) between the government and different stakeholders in nature protection and agriculture, with the aim to reach the Danish 2030-climate goals. The agreement is based on a strategy to change the aerial distribution of land use, enhance biodiversity and clean drinking water.
Furthermore, during the spring of 2024, a Danish hub for the Wellbeing Economy Alliance (WEALL) was launched, in the form of the think-tank tWellbeing Economy Lab (WELA). WEALL DK is part of the international Wellbeing Economy Alliance and an independent think tank that works to promote a welfare economy. The Danish network is self-organised and is therefore not part of the Wellbeing Economy Governments (WEALL DK, 2024).
2030-panel and Sustainable Development Goals
In 2017, the Danish government established the “2030-panel” (2030-panelet, n.d.) consisting of 21 experts in different sectors, with the purpose of supporting the political development in Denmark striving to reach the 2030 goals, set by the European Commission (European Commission, Directorate-General for Communication, n.d.). In 2020, the report Make Global Goals our Goals was published, developed by scientists from Danish universities and Statistics Denmark (2030-Panelet & Statistics Denmark, 2020). The aim of the report was to define sustainability indicators in a Danish context, derived from the UN Sustainable Development Goals (SDG). The Danish sustainability indicators consist of 197 Danish specific sustainability goals, split into three subgroups: Our Life, Our Planet and Our Society (Statistics Denmark, 2024). In 2021, the Danish government initiated a need for risk-assessment of all new legal bills in relation to the sustainability goals, to ensure policy making aligns with Our Goals (Finansministeriet, 2021). It has however shown difficulty to use in practice as well as procedural challenges and lack of administrative framework for the risk-assessment. The governmental monitoring of the SDGs through risk-assessment, is thus in a developing stage towards a more streamlined administrative framework across ministries.
In 2023 the Danish government presented an action plan called the 2030-plan that aims to increase Danish welfare by further investments in sectors such as health, education, security and technology to support the green transition strategy (Finansministeriet, 2023). More than 50 billion Danish kroner has been allocated to a Green fund to among other things develop Nature-national parks, windmill parks and investments in new technologies such as Carbon Capture and Storage (CCS) (Energistyrelsen, n.d.). However, the potential as well as risks of using this technology remain unclear. Critical voices of CCS argue that the technique will prolong the use of fossil fuels rather than phasing them out and the scientific viability, especially related to hazardous risks and their potential for impact at scale, is still uncertain.
Green National Accounts:
In 2023, a working group consisting of scientists from Danish universities, the DREAM group (Danish Research Institute for Economic Modelling) and Statistics Denmark published a new methodology to calculate the Danish Green National Accounts (GNA) (Kragesteen, H. & Lauritzen, D., 2023). The GNA is heavily based on the GDP approach but aims to contribute to a broader perspective of the relationship between nature and the economy, by taking the loss of natural depletion and the changing environmental landscape into account (Sørensen, 2021). Originally the framework is inspired by the UN framework System of Environmental Economic Accounting Central Framework (SEEA-CF). The GNA is based on statistical data that describes stocks and flows of natural resources, as well as outputs of environmental goods and services. The GNA consists of five different domains with multiple underlying environmental areas, Energy and air emissions, Material flow and waste, Water and wastewater, Green economy, Natural resources. Details about all the variables can be contained in the statistics bank handled by Statistics Denmark (n.d.-b). However, the potential future use of the GNA as a framework in Danish policy making is uncertain. There is a lack of suitable data and raised criticism of whether these types of natural resource evaluations should be used in such a context, because it could be subject to multiple possible errors and uncertainties.
The methodology used for GNA is on the other hand used as the basis for another model called GreenREFORM, which is a projection model to be used as a tool in policymaking. The aim is to be able to project the most cost-effective solutions from a socio-economic perspective, when developing new policies in the sphere of the green transition (Danish Research Institute for Economic Analysis and Modelling, n.d.). The model will be used to specifically assess the market effects from policies on emissions, such as a CO2e-fee on Danish agriculture. The model has been used in the green tax reform and is planned to be used as a tool in the Ministry of Finance for policy analysis in terms of economic efficiency in taxation and regulation of emission intensive industries.
Doughnut Economics
The municipality of Copenhagen initiated the use of Doughnut Economics in 2020, as a political management tool (Københavns Kommune, 2021). Since then, yearly reports cover the sustainable development in Copenhagen by using the Doughnut Economics framework. The municipality of Copenhagen uses the framework as a tool to determine development and where there is a need for policy action. The report from 2024 states that the framework is used to clarify what areas the municipality needs to focus on in case of specific challenges (Københavns Kommune, 2024). Both in 2023 and 2024, the focus areas were related to climate- and ecosystems, mental health, equality, employment, housing and the city’s infrastructure (Københavns Kommune 2023;2024). The project is still in its pilot stage, which runs from 2023-2025. In this stage, the municipality needs to decide the trajectory of the project and how it needs to be developed to be useful on a local scale.
5.1b SDI performance and explanation
Denmark's global SDI ranking has declined from 107th in 2000 to 136th in 2022, as shown in Figure 10 below. However, a closer look at the SDI sub-indicators reveals that life expectancy in Denmark has increased from 78.7 years in 2008 to 81.9 years in 2022. This growth surpasses the EU-26 average, where life expectancy was 80.1 years in 2022. Notably, Denmark did not experience the sharp decline in life expectancy during the COVID-19 pandemic that was observed across the EU-26, as depicted in Figure 11.
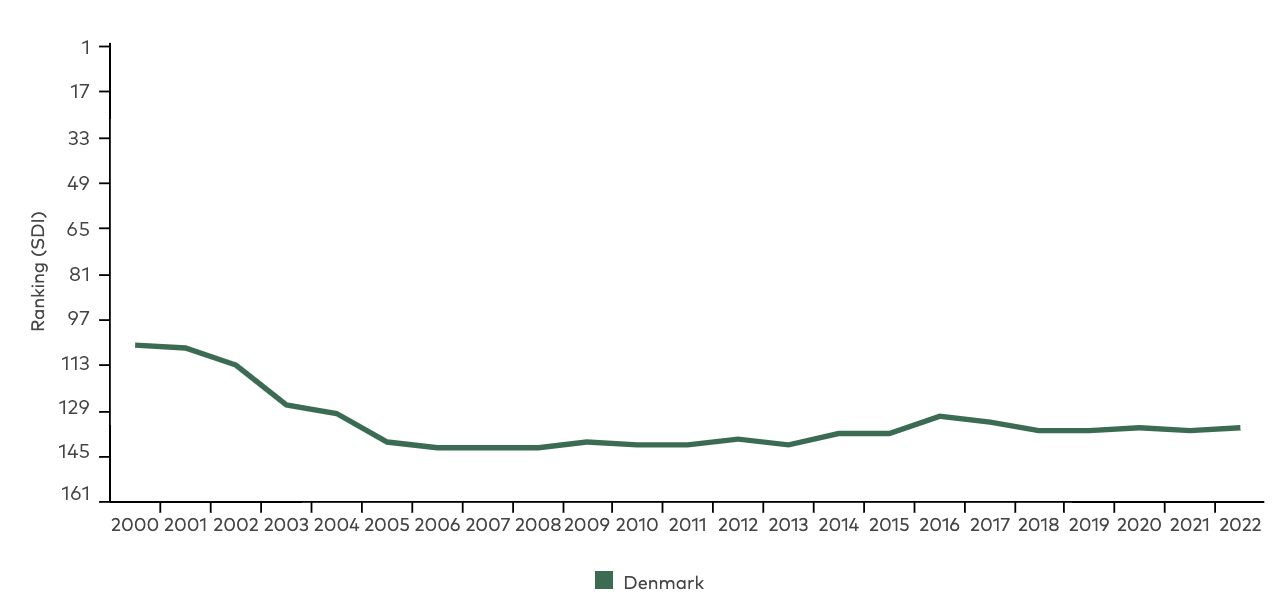
Figure 10: Denmark’s SDI ranking development (2000–2022)
Figure 11: Life expectancy in years in Denmark and EU-26 average (2008–2022)
Denmark has also seen an improvement in expected years of schooling, rising from 16.7 years in 2008 to 18.8 years in 2022, a trend consistent with neighbouring countries such as Norway, Finland, and Sweden. Additionally, the mean years of schooling have increased slightly from 12.9 to 13.0 years over the same period.
Denmark’s material footprint per capita (measured in tonnes) has decreased in the period 2008 to 2022 with 45 percent. See figure 12 below. The decrease is larger than the EU-26 average that is estimated to -30 percent in the same time period. In 2022, the Danish material footprint per capita is estimated to be 25,8 tonnes. While the EU-26 average is estimated to be 19,8 tonnes.
Denmark’s gross national income (GNI) per capita, measured in constant 2017 USD PPP, has grown by 16% from 2008 to 2022. In 2008, Denmark's GNI per capita was estimated at $53,564, increasing to $62,019 by 2022. This is mainly due to growing investments from abroad (Statistics Denmark, 2024).
Figure 12: Denmark’s material footprint per capita (tonnes) and EU-26 average (2008–2022)
The data shows that CO2 emissions per capita (measured in tonnes) have decreased in Denmark with 32 percent from a level of 13,2 in 2008 to 8,5 in 2022. This is close to the EU-26 average level of 7,8 in 2022, which shows a decreasing trend over time.
5.1c TPI performance and explanation
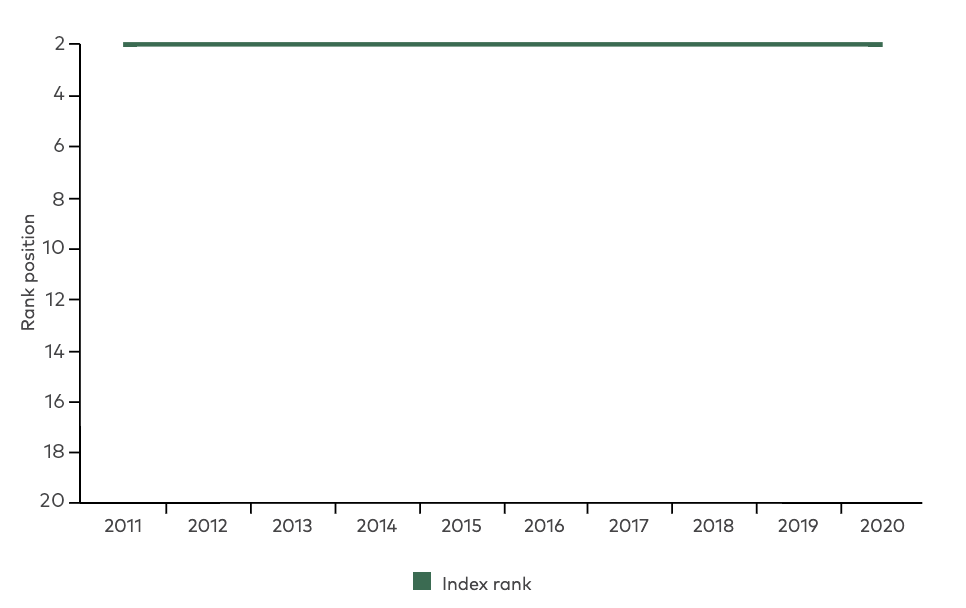
Figure 13: Index score in all four dimensions and index Rank for Denmark in the years 2011–2020.
Source: TPI Database.
2011 | 2012 | 2013 | 2014 | 2015 | 2016 | 2017 | 2018 | 2019 | 2020 | |
Index ranking | 2 | 2 | 2 | 2 | 2 | 2 | 2 | 2 | 2 | 2 |
Denmark has had a steady position as number 2 on the global ranking out of 72 countries, in all years between 2011–2020. In 2020, they scored 78 out of 100. Denmark has increased performance in the Economic and Environmental transition, whilst remaining ranking number 2, indicating that other countries are progressing as well. From 2014 Denmark is ranked in the Transition leader tier, making Denmark the top scoring country on the TPI list in the Nordics. The high average for Denmark may be attributed to the rapid increase in the Economic transition dimension between 2011-2020 as well as the high index scores in the Environmental transition dimension compared to the 4 other countries.
However, Denmark does not score in the Transition leading tier in all dimensions of the index. In the dimension of Social transition, Denmark scores lowest together with Finland. However, all Nordic countries score well above average, classifying in the Transition leader tier. Iceland scores the highest, hence, the social scoring is not affecting the total average considerably for Denmark. The significant score for the Environmental dimension for Denmark compared to the other Nordic countries is especially attributed to the indicators of biodiversity and energy productivity, where Denmark scores 94 and 93 respectively and rank 4 in both. That is significantly higher than the other four countries that lie between rank 14–67 and rank 21–72. The high performance in energy productivity is attributed to the fact that Denmark has a high economic output in relation to the energy input available on the market.
5.1d Doughnut economy performance and explanation
Figure 14 shows that between 1992–2015, Denmark has overshot the biophysical boundary on each indicator, whilst performing above the social floor across all indicators except employment.
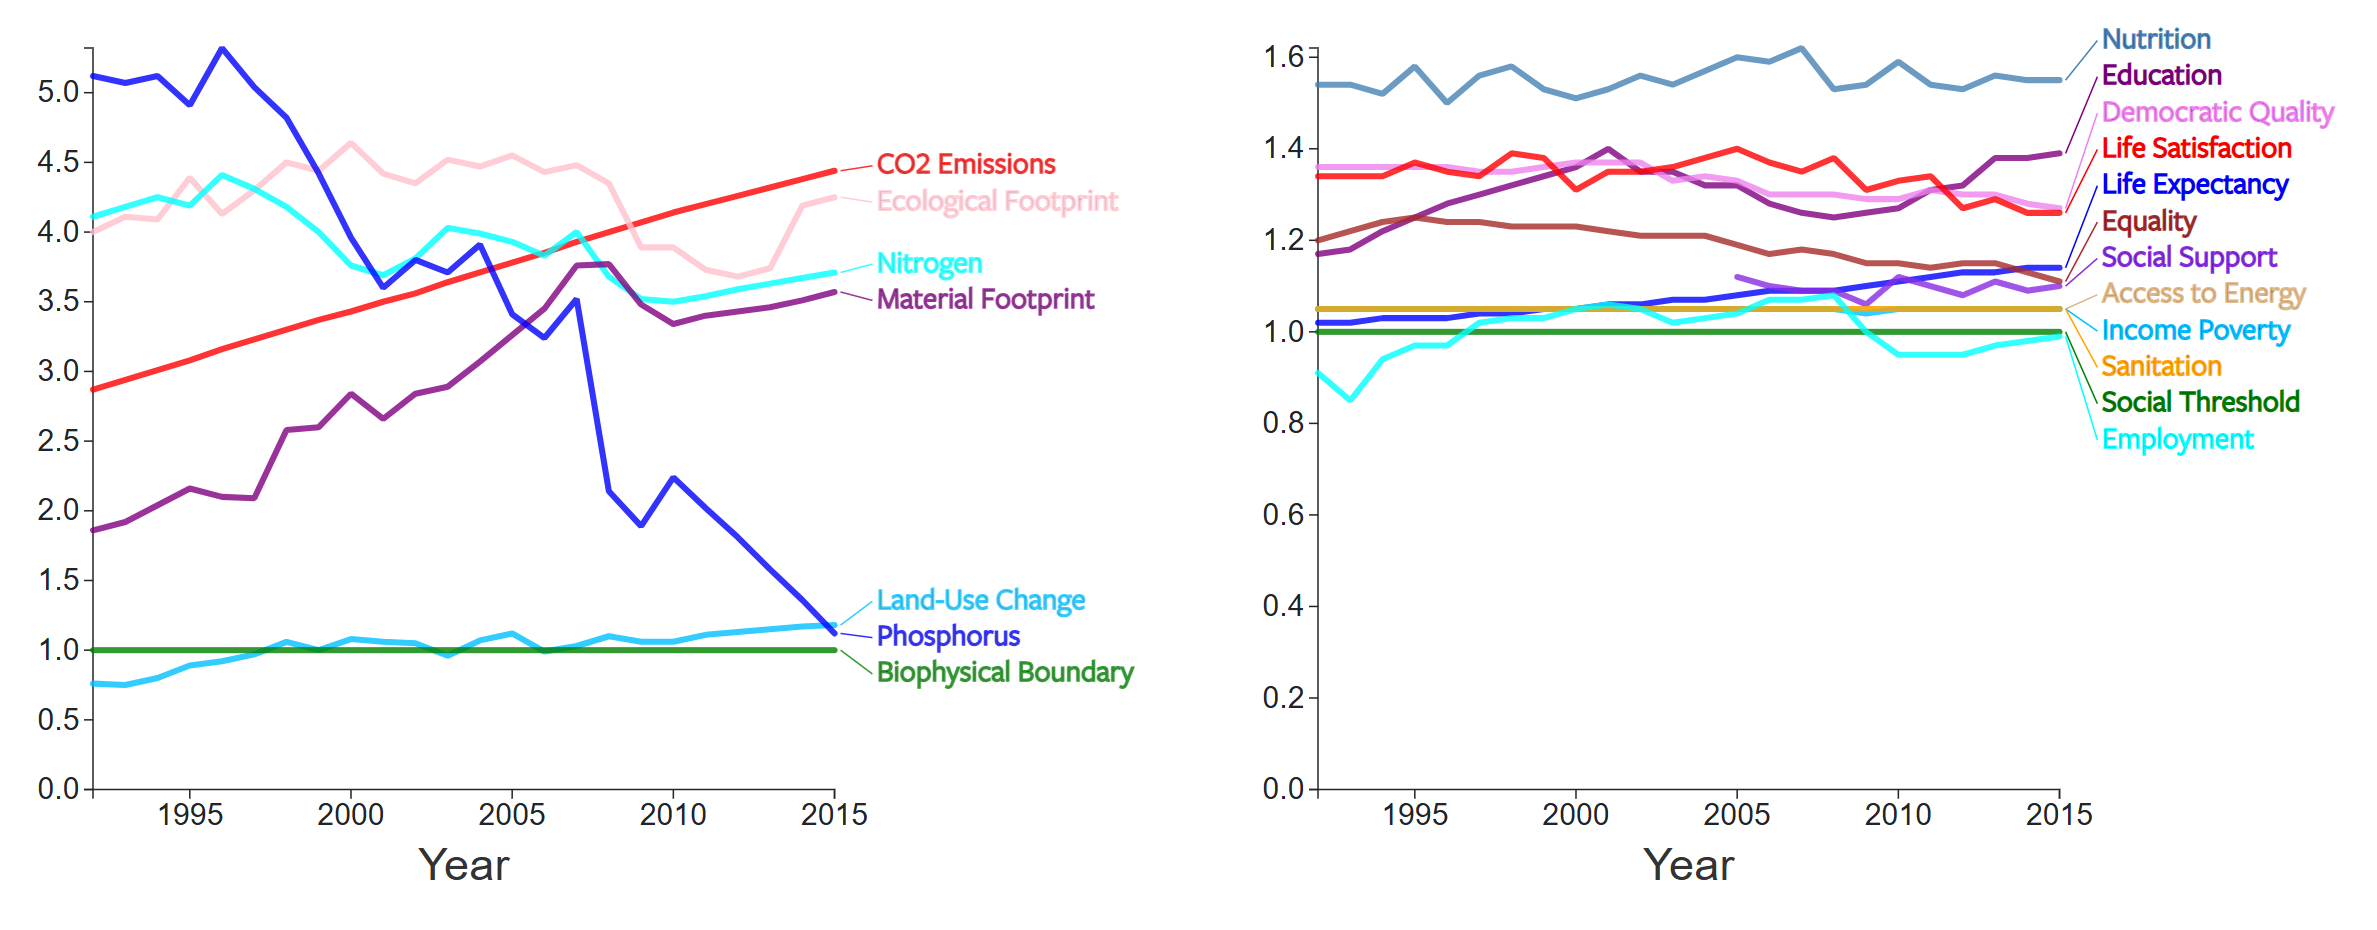
Figure 14: Denmark’s performance from 1992–2015 sourced from Good Life Project and premised on data used in Fanning et al. 2022.
Source: goodlife.leeds.ac.uk
Other data from the Good Life project shows that Denmark’s average overshoot beyond the ecological ceiling has, in years leading up to 2015, decreased.
Denmark has been considered within the top three happiest countries in the world for a number of years (Helliwell et al. 2024). Its performance across social indicators both reflects this, as well as some of the deeper ambiguities of this position. As the above figure 14 shows, between 1992–2015, Denmark sustained relatively consistent levels of performance above the social floor for 11/12 of DE’s social indicators. Performances related to unemployment fell below the social minimum standards for living the good life after 2007, though by 2015 they rested only minimally below the social floor. Income poverty, access to energy and sanitation have all remained at consistent levels through 1992–2015. Like much of the world, and in a trend also seen in Finland and Sweden, Denmark has also seen a fall in democratic quality since 1992, with a palpable decrease occurring in 2012. At the same time levels of equality have also seen a slow and steady decline from 78 in 1995 to 73.6 in 2015, whilst social support has remained at relatively stable levels since 2005. Life expectancy has increased in this time to 80.7 years. And whilst international studies declare Denmark as consistently highly ranked on the happiness indexes, life satisfaction has fallen steadily since 2005. This remains on roughly the same level as other countries within the Nordics.
An alternative EU focused study takes a snapshot of Denmark using 2019 data, using a different set of indicators for the ecological ceiling and social floor (Gómez-Alvarez Díaz et al. 2024). This data is thus not entirely comparable with the above analysis, but can nonetheless provide an interesting insight into slightly more recent performance through a similar lens. This more recent data suggests that Denmark has the largest combined ecological overshoot out of the Nordic countries – and indeed one of the largest in Europe (Ibid, 8). Denmark was found to have overshot a normalised, combined threshold for the ecological ceiling integrating all planetary boundaries by 247.7%. However, it also shows Denmark to be the closest of any EU country to operating in the socially just space, falling short of a normalised combined baseline for the social floor by only 9.1%. A full graphical performance breakdown according to this alternative study is presented in the EU comparison outlined in section 6.3a.
5.2 Finland
5.2a Alternative metric landscape in Finland
Finland has become an internationally leading actor and champion for wellbeing economies. This status has its origins in the development of wellbeing metrics in Finland that coincided with consequential changes to its welfare model. After the financial crisis of 2008, drastic austerity measures were demanded across the public sector in order to, it was argued, correct economic deficits. As a result, existing levels of welfare provision were lowered using the justification of economic recovery and long-term economic growth. This structural shift in Finland’s welfare model coincided with the emergence of Findicator in 2009. Discontinued in 2022, this service was run by Statistics Finland and provided around 100 indicators measuring Finland’s development on issues ranging from the economy, health, the labour market, environmental performance and education. This indicator introduced wellbeing into Finnish decision-making and governance circles and was used by the Finnish Federation for Social Affairs and Health (SOSTE) to highlight a need for more comprehensive social and healthcare policies. All at a time when Finland’s welfare model, and these specific policy spheres, were undergoing strong cost-cutting measures. Research shows that despite this, Finland’s welfare model remains critical to citizen wellbeing and the nation’s life satisfaction (Martela et al. 2020).
The ensuing one and half decades has seen the broad and complex concept of an “Economy of Wellbeing” become a key reference point for Finnish policy initiatives, domestically and internationally. Some of the main policy developments till 2021 have been reviewed in the Nordic Council of Ministers report ‘Towards a Nordic Wellbeing Economy’ (Birkjaer et al. 2021). It highlights the moment when wellbeing metrics became an active policy initiative of the Finnish government. In response to civil society pressure, the Finnish Presidency of the European Council led the government to advocate, in October 2019, for the use of wellbeing metrics in policy design and evaluation (European Council 2019). This intervention benefited from a commissioned background analysis by the OECD (Nozal et al. 2019). The 2021 NCM report also highlights three Finnish initiatives aimed at advancing a wellbeing economy and beyond GDP considerations in Finland: the Economy of Wellbeing Steering Group and Wellbeing Committee; the start of and initial ideas for Finland’s 2023 National Action Plan; and Finland’s membership of the WEGo alliance.
The current report will update information on these initiatives, identify new initiatives and refrain from repeating the coverage in the 2021 report. It is useful to first situate new Finnish initiatives amidst three significant changes to the country’s policy and governance landscape.
The first is a structural and substantial change to Finland’s governance structures. A result of legislation finally passed in June 2021, 21 Wellbeing service counties came into legal operation on 1 January 2023. These entirely new regional public authorities are distinct from both central government and municipalities, with distinct competencies and responsibilities. They now bear responsibility for the supervision and provision of social welfare, healthcare and emergency services. It was intended that central government thinking on the Economy of Wellbeing would nurture the potential of these new governance entities – ones aimed at more equal and adequate welfare, as well as better standards of healthcare services for the population (Birkjaer et al. 2021, 31). However, in September 2024, the Orpo government proposed a further tightening of the budget for 2025 and onwards. It is proposed that the growth of expenditures by the wellbeing services counties be halted whilst there being an initial increasing central government funding. It is also proposed that their functions and obligations be curtailed. The budgetary changes are aimed at changing service provision through extending waiting times, reducing the minimum level of staffing for certain services, while attempting to increase the income of wellbeing service counties from increasing client fees for healthcare services. It is also proposed that discretionary funds given by the Ministry of Social Affairs and Health to associations and foundations that promote health and wellbeing be reduced by EUR 80 million (Government of Finland, 2024). Whilst the Ministry of Social Affairs and Health remains in control of coordinating Finland’s policy initiatives on the wellbeing economy, the Ministry will likely receive in the region of EUR 1.2 billion less in 2025 than the EUR 16.3 billion it received in 2024 (Ministry of Social Affairs and Health, 2024). Beyond budgetary austerity and the lowered threshold of wellbeing service provision, the wellbeing service counties also offer a governance coordination challenge: how can the Finnish central government grapple with advancing a wellbeing economy agenda across multiple and novel levels of governance?
Second, the Marin government introduced a Government Sustainability Roadmap in 2021, updated in 2022, to address the interconnections between social, economic, and environmental sustainability. It highlighted challenges such as rising social inequality, high resource consumption, and environmental sustainability gaps. The Roadmap aimed to integrate sustainability across government and initiated a pilot for policy coherence monitoring (State Council 2022). This has since evolved into Finland’s Sustainable Growth Agenda, part of its Recovery and Resilience Plan (Finnish Government 2021), which focuses on reducing greenhouse gas emissions, improving competitiveness, RDI and employment, and promoting regional, social, and gender equality. The Finnish Institute for Health and Welfare is expected to develop a wellbeing economy monitoring mechanism as part of this agenda (Ministry of Social Affairs and Health 2023).
The new Climate Act, effective from 1 July 2022 (Climate Act 423/2022), sets national targets, including achieving carbon neutrality by 2035 and carbon negativity soon after, and strengthening carbon sinks. These targets exceed the 2015 Paris Agreement's commitments. The Act requires a long-term climate plan by 2025 and ensures justice in sustainable development through the Finnish Climate Change Panel and the Sámi Climate Council. Building on this, the Ministry of Finance launched the Net-Zero Government Initiative to explore the systems-level changes needed for a just green transition, including policies on properties, procurement, energy efficiency, and business environments (Ministry of Finance 2024).
These three broad shifts in Finland’s policy and governance atmosphere over the last two years condition the country’s emerging initiatives relating to wellbeing economies and alternative metrics. This brief explores three of these. The first is the results and construction of the Finnish National Action Plan for an Economy of Wellbeing. The second is a proposal advanced by SOSTE for putting wellbeing economy at the heart of government. And the third is the implementation of the Doughnut Economics model by the region of Pirkanmaa and its use in the City of Tampere.
The Finnish Action Plan for an Economy of Wellbeing 2023–2025
In February 2023, the Finnish government published its National Action Plan, led by the Ministry of Social Affairs and Health through a participatory process and international cooperation (Ministry of Social Affairs and Health 2023). The Ministry’s Multisectoral Steering Group on the Economy of Wellbeing, comprising ministries, local governments, social partners, and the private sector, helped develop the plan. Additional contributions came from the Advisory Board for Public Health, which includes representatives from administrative branches, Regional State Administrative Agencies, cities, civil society, and research organisations. The International High-Level Group for the Economy of Wellbeing, with participants from the European Commission, WHO, World Bank, OECD, and Finnish ministries, also played a key role. Finland’s Action Plan continues its long-standing collaboration with international organisations and leadership in the wellbeing economy, which includes joining the Wellbeing Economy Governments (WEGo) in 2020 and promoting wellbeing metrics on various international platforms.
The Action Plan made five recommendations for promoting a wellbeing economy from 2023–2025: (1) developing a national steering model for the economy of wellbeing; (2) integrating wellbeing monitoring into state, wellbeing services counties, and municipalities; (3) enhancing institutional capacities and impact assessments; (4) influencing EU policy initiatives, including through the European Semester; and (5) strengthening civil society participation.
It was clear that more research is needed to understand the drivers of wellbeing within planetary boundaries, a conclusion supported by the International High-Level Group. The Finnish Institute for Health and Welfare's research project, concluding in December 2024, will use both objective and subjective indicators in five case studies to identify policy interventions with wide-scale wellbeing effects (Finnish Institute for Health and Welfare 2024). This research will also inform the proposal of a wellbeing indicators dashboard to create a monitoring framework for Finland, ensuring the inclusion of indicators related to planetary boundaries.
The Action Plan emphasises the need for policy alignment and cross-sector coordination to integrate wellbeing approaches across government. Finland aims for a whole-of-government approach, ensuring wellbeing metrics are used in resource steering and national budgeting, potentially influencing political debates and fiscal strategy.
Proposal by the Finnish Federation for Social Affairs and Health (SOSTE)
Subsequent to the publication of the National Action Plan, in March 2023, SOSTE identified further actions that might contribute to building a wellbeing economy (Marttinen and Turtinen 2023). SOSTE is a Finnish Umbrella organisation of 200 social affairs and health NGO members and partner members.
The conclusions of this report can be distilled as follows:
- Governance is crucial for implementing wellbeing economies: Individual policies or strategies alone are insufficient to achieve a wellbeing economy without integrating these goals into broader governance frameworks.
- Participation, evidence, and iterative measurement are key governance principles: For a wellbeing economy to succeed, it requires cross-sector participation with civil society to determine the objectives of a wellbeing economy and the use of up-to-date and comprehensive wellbeing data.
- Long-term investments and embedding over short-term gains: Governments must prioritise long-term investments in wellbeing, which often extend beyond budget cycles and require future-oriented thinking. Short-term economic pressures should not overshadow the long-term benefits of a wellbeing economy.
- Wellbeing must permeate all sectors: Wellbeing should be a core objective across all areas of government rather than a separate policy. This requires breaking down silos, fostering collaboration, and embedding wellbeing in budgeting and legislative processes both prior and after for evaluative purposes.
The purpose of this intervention was to help steer the policy implementation of the Finnish National Action Plan. It remains to see how successful this has been.
Doughnut Economics in Pirkanmaa and Tampere City Region
In 2020 and 2021, the Pirkanmaa region and the Tampere city region began using DE (Pirkanmaa Region 2021). A City Portrait revealed Pirkanmaa faces both social and ecological challenges within the Safe and Just Space (SJS). Social policies focus on health, employment, and well-being but overlook homelessness, food assistance, elderly care, and ageing population issues. Ecologically, Pirkanmaa struggles with high material consumption, greenhouse gas emissions, and inadequate ecological goals in municipal strategies (Pokkinen 2021). The City Portrait emphasised the need for a holistic approach that integrates social and ecological issues, encourages sectoral collaboration, and better tracks environmental impacts like waste and consumption data.
DE was not just a diagnostic tool but also influenced policy shifts and the slow development of a regional plan (Pirkanmaa Region 2021, 4–6), although documentation on ongoing DE applications remains limited.
This work with DE has had downstream effects. Tampere adopted a circular economy plan focusing on construction, though legislative changes may be required to clarify waste reuse policies. The city has implemented circular solutions in construction through material reuse, reducing CO2 emissions in the ECO3 Industrial Circular Economy Area, which promotes resource sharing among 40 organisations. The SÄILÖ Project has also facilitated the reuse of materials from demolished buildings, such as bricks, for new projects, helping cities like Orivesi and Nokia build sustainably with significant CO2 savings (European Commission 2024).
5.2b SDI performance and explanation
Finland's global SDI ranking has declined from 106th in 2000 to 147th in 2022, as shown in Figure 15 below. Finland’s life expectancy has increased from 79,7 to 82,4 years in the period 2008 to 2022. The country has not experienced any decline during the global COVID pandemic, as the EU-26 average has. See figure 16.
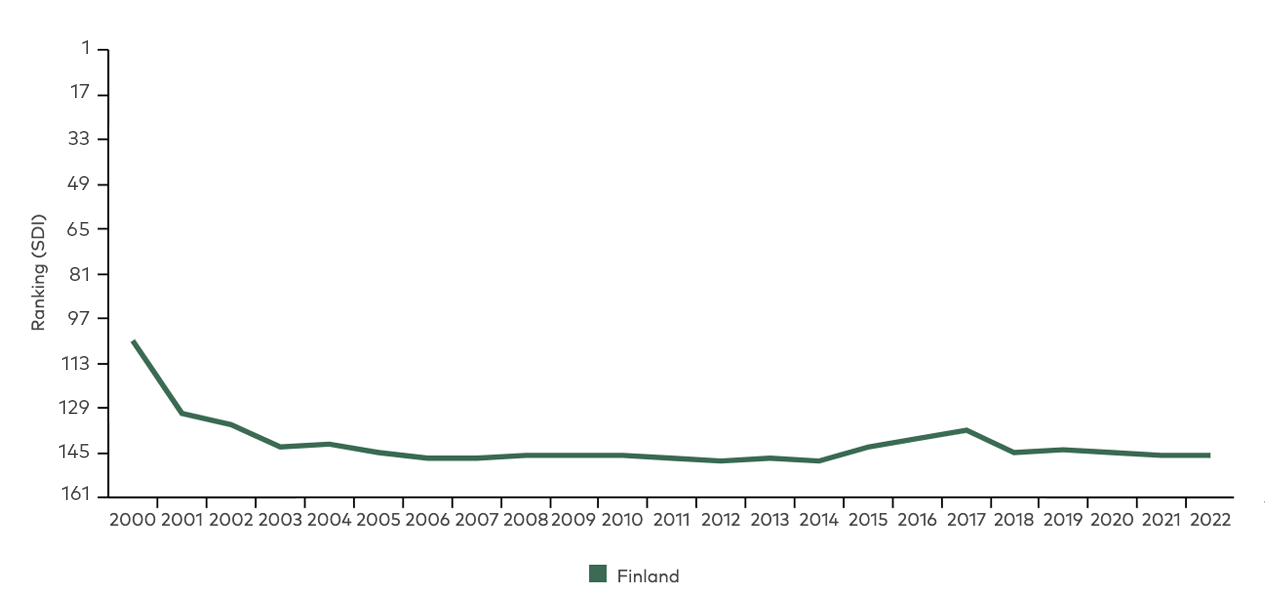
Figure 15: Finland’s SDI ranking development (2000–2022)
Figure 16: Life expectancy in years in Finland and EU-26 average (2008–2022)
Expected years of schooling have also increased in Finland from 17,1 years in 2008 to 19,2 years in 2022. This is a similar trend as in Sweden and Denmark. Mean years of schooling have increased from 12,3 to 12,9 years in the same period.
The gross national income per capita (measured in constant 2017 USD PPP) in Finland shows a stagnating trend between 2008 and 2022. In 2008, the GNI was estimated to 48, 899 USD, while in 2022 it is estimated to 49, 522 USD.
Finland's material footprint per capita (measured in tonnes) has decreased in the period 2008 to 2022 with 57 percent. See figure 17 below. This is the largest decrease among the Nordic countries. In 2022, the level is estimated to be 30,1 tonnes per capita. This level ranks Finland as the third highest material footprint per capita among the Nordic countries. Compared with the EU-27 countries, Finland ranks as the fourth highest material footprint per capita, with Luxembourg at the top.
Figure 17: Material footprint per capita (tonnes) in Finland and EU-26 average (2008–2022).
Source: Sustainable Development Index, 2024 and authors own calculations.
The data shows that CO2 emissions per capita decreased in Finland in the period 2008 to 2017. Reaching a level of 8,3 in 2017. Since then, the CO2 emissions per capita has increased to 11,5 in 2022. This level is higher than the EU-26 average of 7,8 in 2022.
5.2c TPI performance and explanation
Finland ranks 18 on the 2020 global rank, with a score of 67.4. Finland has been decreasing in the rankings from 12 in 2011 to 18 in 2020, and positions as the second lowest performance score in the Nordics.
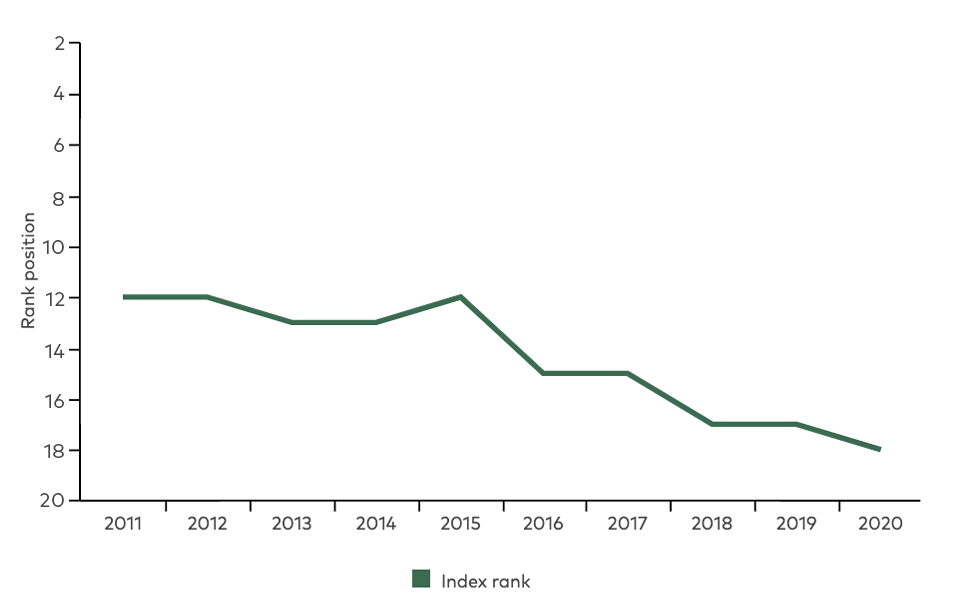
Figure 18: Index score in all four dimensions and index Rank for Finland in the years 2011–2020.
Source: TPI Database.
2011 | 2012 | 2013 | 2014 | 2015 | 2016 | 2017 | 2018 | 2019 | 2020 | |
Index ranking | 12 | 12 | 13 | 13 | 12 | 15 | 15 | 17 | 17 | 18 |
Of the four dimensions Finland shows the best performance on social transition with a global ranking of 7 and the worst performance on environmental transition with a global ranking of 55.
Finland scores 47.9 in the environmental transition, positioning them in the low end of the moderate tier and below the European average of 65. Of all the four dimensions, the environmental transition is the only dimension where Finland scores below the European average as well as the world average score. The environmental transition is based on the European Green Deal objectives of emissions reduction, biodiversity, material use and energy productivity. Finland ranks 71 on material use, placing them at the bottom of the ranking. According to the European Environmental Agency (European Environmental Agency, 2024), Finland has decreased their CO2e emissions per capita between 2011-2020 with approximately 13% but has since then increased the emission levels per capita to exceed 2011 levels. Their baseline levels in 2011 were in line with the EU-average, and the low score on the environmental levels might be reflecting this trend.
As for the other Nordic countries, material use is a critical factor where the Nordics perform particularly badly. According to a report by WWF from 2024, Finland's environmental footprint is assessed, where material footprint is one of the sub-categories. According to the report, Finland's material footprint is seven times higher than the global average and more than three times higher than the EU average. It is mainly the footprint from construction and infrastructure which constitute by far the biggest share. The report concludes that material circularity can be a significant contributor to improve the large footprint (WWF, 2024).
5.2d Doughnut economy performance and explanation
Figure 19 shows that Finland has considerably overshot planetary biophysical boundaries across all indicators, while also meeting the social minimum for 11/12 social indicators. The rate of employment is the only social indicator which remains below the social floor and, in contrast to Finland’s Nordic neighbours, has remained so for the entirety of 1992–2015.
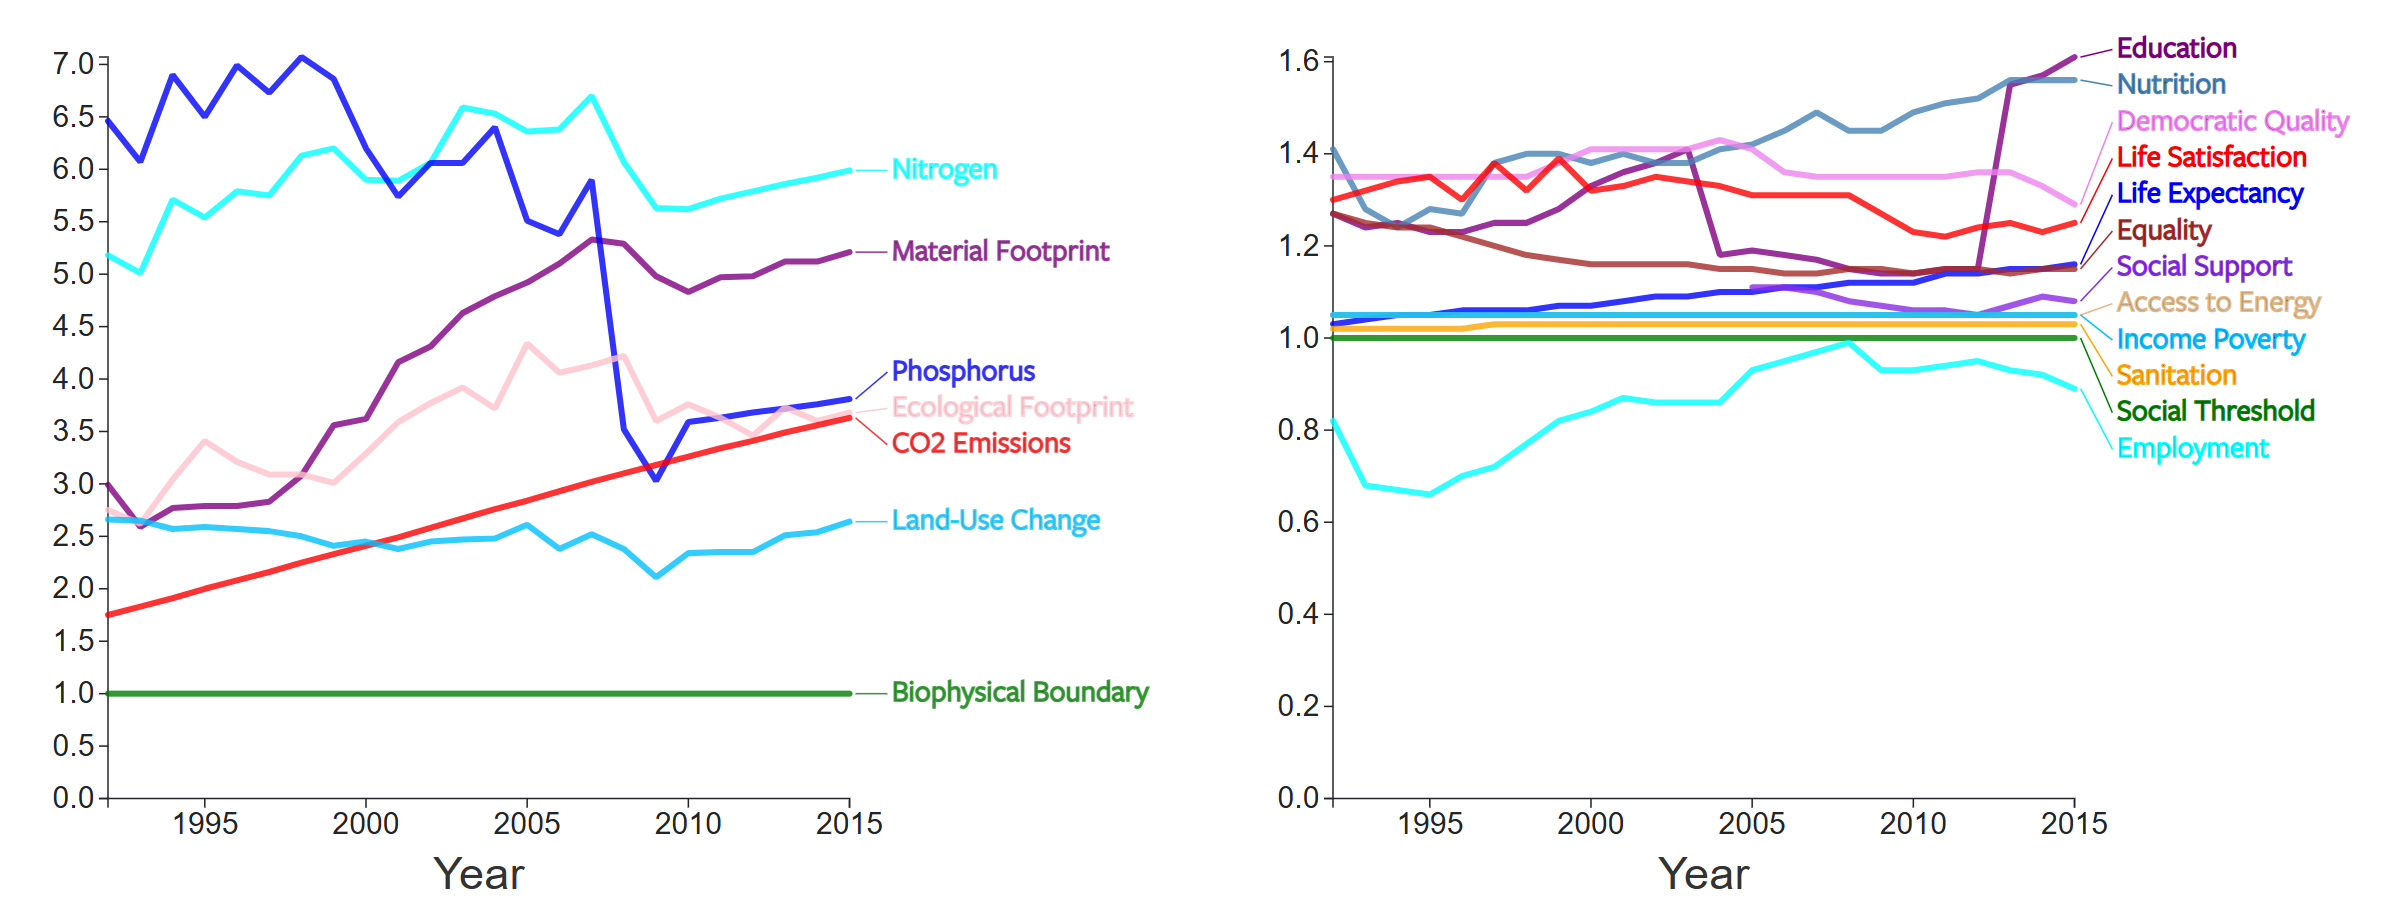
Figure 19: Finland’s performance from 1992–2015 sourced from Good Life Project and premised on data used in Fanning et al. 2022.
Source: goodlife.leeds.ac.uk
Pathway data from the Good Life project shows that the extent of Finland’s average overshoot beyond the ecological ceiling lessened after 2005.
Diving into Finland’s performance on social indicators, the most prominent observation is that in 2015 only 90.6% of the population were employed – significantly below the social floor. This performance can partly be explained by the fact that economic growth was the slowest in Finland after the financial crash, that the lowest amount of part-time work amongst the Nordics exists in Finland and that much of it is performed unwillingly and that it has comparatively little employment protection legislation (Alatalo et al. 2019). The consumption of calories per capita per day has steadily risen since 1994 to be on par with both Denmark and Norway. Figure 19 also shows that there has been a fall in equality during this period. This alongside little change in social support since 2007, though an uptick is observable in 2013. Much like its Nordic and European contemporaries, Finland has seen a decrease in democratic quality since 2013, falling to 9.1 and levels prior to 1992. As in the other Nordic countries, life expectancy has increased steadily since 1992, to the age of 81.5 in 2015, whilst maintaining a high level of life satisfaction. The latter has fallen to below 1992 levels of satisfaction after peaks in 1997 and 1999. Finally, much like Sweden, Finland showed a dramatic rise in gross enrolment for secondary education in 2013 to numbers that are now the highest in the Nordics.
Reiterating the different indicators, methods and data sources mean these findings are not directly comparable with those above, the alternative EU snapshot drawing on 2019 data shows Finland as the middling performer of the three EU Nordic countries in terms of ecological overshoot, overshooting a normalised measure of the combined planetary boundaries by 213.8% (Gómez-Alvarez Díaz et al. 2024). Finland was the bottom performer–albeit being only .2% below Sweden–with respect to meeting the social foundation, falling short of a normalised combined social baseline by 11.4% (Ibid.). A full graphical performance breakdown according to this alternative study is presented in the EU comparison outlined in section 6.3a.
5.3 Iceland
5.3a Alternative metric landscape in Iceland
Compared to the other Nordic nations, Iceland was hit much harder by the financial crisis in 2008, when Iceland’s banking sector, accounting for 96 percent of GDP, collapsed. As part of the response to the crisis, the Icelandic Welfare Watch was established in early 2009. This later inspired the Nordic Welfare Watch, a research programme financed by the Nordic Council of Ministers in 2014–2017. A focus on monitoring the wellbeing of the population has been an explicit focus of the Icelandic government ever since.
According to Birkjær et al. (2021), Iceland is the only Nordic country that is engaged in all three levels of wellbeing, i.e., to passively monitor the reality of people’s wellbeing, to actively inform governments’ wellbeing priorities, and to actively guide policymaking towards most wellbeing impact. In Iceland the government has proposed several initiatives aimed at accommodating wellbeing priorities.
Since 2018, Iceland has been one of the world’s six wellbeing governments. The Icelandic focus on the Wellbeing Economy is based on a government agreement between the Progressive Party, the Independence Party, and the Left Green Movement in 2017. In 2019, the Prime Minister of Iceland, introduced a framework involving 39 proposed national indicators to measure the prosperity and quality of life of the citizens of Iceland. GDP is thus one of 39 indicators to monitor prosperity and quality of life in Iceland, considered equally important as other indicators including health, education, employment, air quality and climate.
The 39 indicators were established by a policy group made up of experts and members of parliament. The monitoring framework enjoys widespread political support from both the coalition and opposition parties in Iceland. A platform called Sustainable Iceland has been established as part of the government‘s focus on sustainable development, wellbeing and just transition. The Sustainability Council is comprised of the Prime Minister, who is the chair, other ministers in the government, and representatives from the business sector, trade unions, local authorities, the Icelandic parliament, civil society and NGOs.
During 2021–2025 the Fiscal Strategy wellbeing priorities are the following six: mental health, secure housing, better work-life balance, zero carbon emissions, innovation growth, and better communication with the public. 30 out of 35 governmental policy areas are steered by these priorities and have shifted national money allocation towards the achievement of these goals. Several initiatives have been launched by the Icelandic government to accommodate the wellbeing priorities. However, promising this may be, according to Birkjær et al. (2021) there are concerns that allocated amounts of money for wellbeing objectives in relation to other budget domains such as healthcare and education may limit the actual effect on wellbeing policies.
The country has also made exceptions in the aviation sector to maintain competitiveness, despite having indicators to measure the impact of this sector, which according to Kormann da Silva et al. (2023) highlights the inherent weakness of relying solely on indicators without a comprehensive framework. According to Hayden and Dasilva (2022), political statements in Iceland about the desirability of an economy that is not centred on growth and consumption contrasts with the government’s efforts to accelerate economic growth to address financial concerns.
Iceland is also seeking to spread sustainable wellbeing internationally, regularly organizing the Wellbeing Economy Forum aiming to be a platform for dialogue, interdisciplinary collaboration and change among politicians, policymakers, business leaders, academics and practitioners worldwide. It was held in 2023 and 2024 and will be held in May 2025 hosted by the Prime Minister of Iceland and the Minister of Health.
Iceland is committed to implementing Agenda 2030 and the Sustainable Development Goals both nationally and internationally. A working group has mapped the nation’s position for all 169 targets and specified 65 priority targets that will guide the authorities in implementing the goals, which has also been integrated into the Government's five-year Fiscal Strategy.
5.3b SDI performance and explanation
Iceland’s global SDI ranking has fluctuated between 112th and 150th since 2000, reaching 150th in 2022. Life expectancy in Iceland has risen from 79.8 years in 2008 to 82.7 years in 2022, outpacing the EU-26 average, which is estimated to 80.1 years in 2022. As shown in Figure 21, Iceland experienced a decline in life expectancy during the global COVID-19 pandemic, mirroring the trend seen across the EU-26.
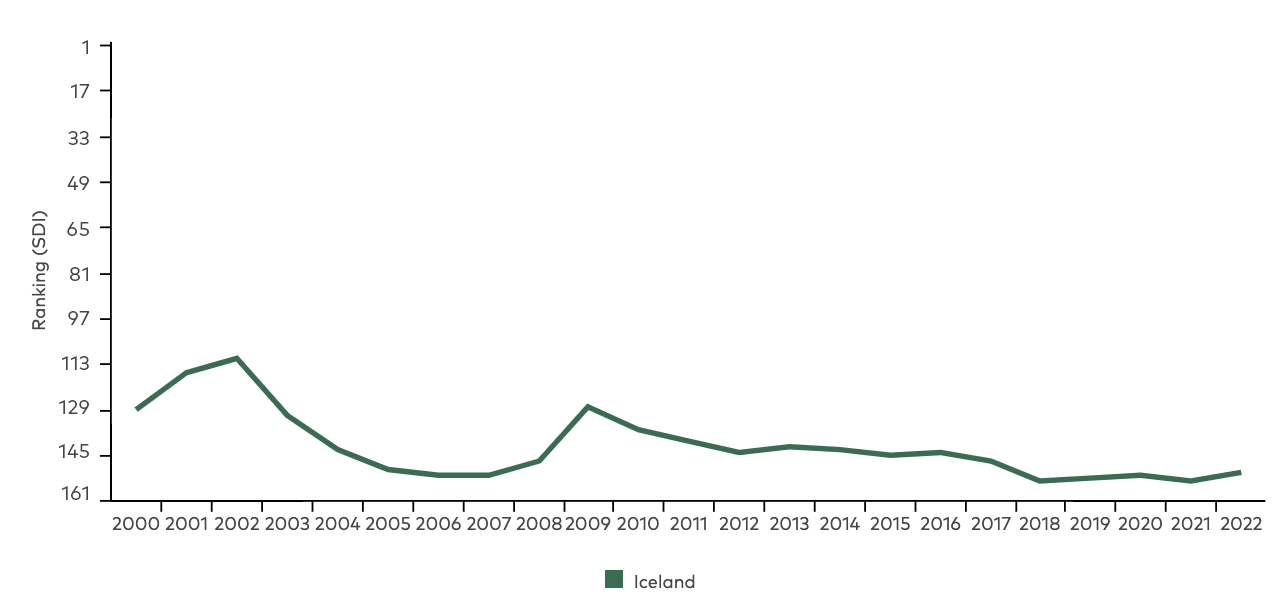
Figure 20: Iceland’s SDI ranking development (2000–2022)
Figure 21: Life expectancy in years in Iceland and EU-26 average (2008–2022).
Expected years of schooling in Iceland increased steadily until 2013, peaking at 19.8 years. However, it then declined, reaching 18.2 years in 2020. Since then, the trend has reversed, with expected years of schooling rising to 19.1 years in 2022. The average number of years of schooling has also grown, increasing from 12.7 years in 2008 to 13.8 years in 2022.
Iceland’s gross national income (GNI) per capita, measured in constant 2017 USD PPP, has grown by 31% between 2008 and 2022. In 2008, GNI per capita was estimated at $41,671, rising to $54,688 in 2022, driven primarily by a boom in foreign tourism and increased business investments (OECD, 2023b).
Iceland's material footprint per capita (measured in tonnes) has increased in the period 2008 to 2022 with 7 percent. In 2018, the level peaked at 33,1 tonnes, and experienced a decrease during the global COVID pandemic and is estimated to be 30,5 tonnes in 2022. This is a higher level than the EU-26 average, which is estimated to be 19,8 tonnes in 2022. See figure 22.
Figure 22: Iceland’s material footprint per capita (tonnes) and EU-26 average (2008–2022).
Source: Sustainable Development Index, 2024 and authors own calculations.
The data shows that CO2 emissions per capita (measured in tonnes) have decreased in Iceland in the period 2008 to 2016. Reach a level of 11,7 in 2016. Since then, the CO2 emissions per capita has increased to 17,0 in 2022. Iceland has the highest CO2 emissions per capita out of all of the European countries. The majority of emissions from the economy of Iceland come from air transportation and production of basic materials (Statistics Iceland, 2018). This is more than double the EU-26 average level of 7,8 in 2022.
5.3c TPI performance and explanation
Iceland ranks 31 on the 2020 global rank, and scores 61.2 positioning in the ‘Good Transition’ tier, as the only country in the Nordics (beneath ‘Strong Transition’ and ‘Transition leader’). Iceland has ranked between 28-33 on the global tier in the years 2011-2020 with a declining trend, but increased in 2019 for the first time. Iceland has the lowest performance score in the Nordics.
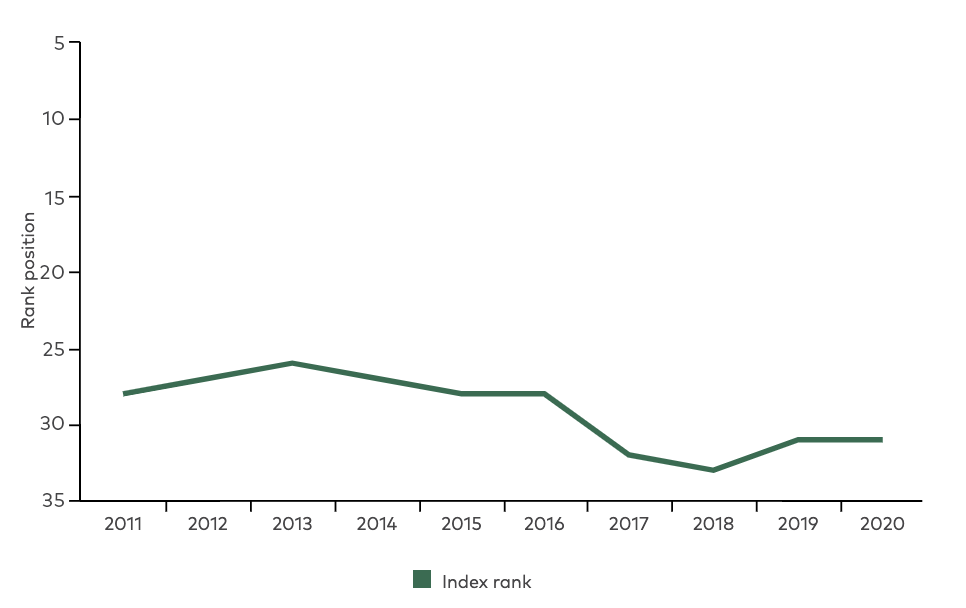
Figure 23: Index score in all four dimensions and index Rank for Iceland in the years 2011–2020.
Source: TPI Database.
2011 | 2012 | 2013 | 2014 | 2015 | 2016 | 2017 | 2018 | 2019 | 2020 | |
Index ranking | 28 | 27 | 26 | 27 | 28 | 28 | 32 | 33 | 31 | 31 |
Looking at figure 23 Iceland scores especially low on the environmental transition with an overall ranking of 70 in the dimension, with a score of 29 out of 100, positioning them in the weak transition tier. All 4 dimensions have a stagnating trend, not showing significant progress in scoring. For the time period, Iceland shows a declining trend in Index rankings, indicating that Iceland lacks behind in progression of the transitions. Except for the Resource productivity/material use sub-indicator, Iceland has the lowest ranking in all sub-indicators within the environmental transition among the Nordics, being the main driver for the overall low ranking for Iceland.
Within the sub-indicator Energy productivity, Iceland has the lowest position of all 72 countries within the environmental transition. Iceland has ranked at position 72 throughout all years between 2011-2020. Energy productivity as a statistical indicator within the EU is defined as PPS (purchasing power standard) per koe (kilo oil equivalent). PPS allows comparing member states in a given year. It measures the amount of economic output produced per unit of gross available energy.
Eurostat(n.d). Energy productivity. Available at: https://ec.europa.eu/eurostat/cache/metadata/en/sdg_07_30_esmsip2.htm [Accessed 21st august 2024]
According to the Icelandic government, 85% of the Icelandic energy supply is provided by domestically produced renewable energy sources, primarily from geothermal energy and hydropower.
Government of Iceland (n.d.). Energy. Available at: https://www.government.is/topics/business-and-industry/energy/ [Accessed 21st August 2024]
Danish Energy Agency (2023). Data, tables, statistics and maps - Energy in Denmark 2021. Available at: https://ens.dk/sites/ens.dk/files/Statistik/energy_in_denmark_2021.pdf [Accessed 21st August 2024]
Iceland scores the highest in Social Transition within the Nordics with a score of 90 and globally ranking number 1. This is well above the EU-average score of 69. The high performance within the social dimension is mainly due to the significant scores within free or non-remunerated time, work & inclusion and equality scoring 94, 86, and 89 respectively out of 100.
5.3d Doughnut economy performance and explanation
No Icelandic data exists for any iteration of the doughnut economy indicators. The research team endeavoured to find alternative data sources which would enable a comparable indicator to be constructed for Iceland, however there was not adequate data available for this to be feasible. Iceland must therefore be omitted from the analysis in terms of doughnut economy indicators.
5.4 Norway
5.4a Alternative metric landscape in Norway
The primary measure of welfare in Norway is based on the Sustainable Development Goals (SDG). However, in recent years Norway has initiated new initiatives with regards to implementing both objective and subjective measures of quality of life into the welfare policy landscape.
Norway is actively involved in the development of SEEA CF for use in EU member states. They are part of the Eurostat task force group on SEEA EA and are also part of the project Mapping and Assessment of Integrated Ecosystem Accounting (MAIA) aiming to launch a tool for gathering the required statistics for ecosystem accounting (Mattson et al, 2022). Norway has already started to integrate natural accounting data into their national statistics institution, which lays a good foundational base to effectively implement a framework like SEEA.
Another growing initiative is the network called “Smultringøkonomi”, which uses the doughnut economy model as the foundation to promote life quality for all. The network promotes an economy within planetary boundaries with the aim that the model will be used as a measurement tool in Norwegian policy development in the future. The network is part of the international Doughnut Economy network, called the Doughnut Economics Action Lab (Nettverket Smultringøkonomi i Norge, n.d).
Goals with meaning and the Sustainable Development Goals:
The main measure of welfare and sustainable development in Norway is the SDGs. In 2023 Norway was ranked 7th in the Sustainable Development Report (Sachs, Lafortune, & Fuller, 2024). The Norwegian government has implemented the goals in their national action plan “Mål med mening” (“Goals with meaning”) (Det Kongelige Kommunal- og Moderniseringsdepartementet, 2021) that aims to describe key development goals in a Norwegian context. The political priorities set out in the action plan is based on the 2030-agenda and was first integrated into Norwegian policies in 2017 with the report Common Responsibility for Common Future (Utenriksdepartementet, 2017) with the plan of a political trajectory following the SDGs towards 2030.
In extension to this, the Goals with meaning plan is a further development of the national action plan of improving on the SDGs. Much like the Danish “Our goals” initiative, the Goals with meaning is based on localised subgoals derived from the SDGs, that fits into a Norwegian context. The report is meant as a guidance tool for the civil society as well as national authorities in working towards the national goals. In the report Goals with meaning, all 17 SDGs and their subgoals are assessed and changed into Norwegian context. Within each goal there are specific measures in which Norway will contribute towards sustainable development both on a global and on a national scale. On both scales, there are detailed strategies for how the government is planning to work on improving the work on the different subgoals.
Norway has 82 national environmental indicators as stated by the Norwegian Environmental Directorate, divided into five categories: Nature diversity, Cultural monuments & Cultural environment, Recreational use of nature and Pollution.
Quality of life survey:
In 2020 the Norwegian statistical centre, Statistics Norway (Statistisk sentralbyrå (SSB)), published the first report of the national Quality of life survey in Norway (Pettersen, & Støren, 2020)., and has since been published every year, with the latest report being published in 2023 (Grimstad & Støren, 2023). The aim of the report was to provide more specific data on well-being among the Norwegian population that included measures beyond economic indicators, where the development of a broad aspect of quality of life can be monitored between different societal groups. The report measures both objective and subjective well-being based on a national survey. Objective well-being measures are based on health, economy, physical safety, social community, work and education, whereas subjective well-being measures how happy an individual is with their life situation by asking how they evaluate their current life situation. The subjectiveness of wellbeing is a complex measurement, as it deals with non-static measures of life satisfaction where context can be very specific for each individual (Kahneman & Krueger, 2006). The overall average score for the Norwegian population is 7 out of 10. The Quality of Life survey serves as a policy tool for the government, as it has already laid the basis for an upcoming political strategy in Norway, that aims to increase the national wellbeing.
Strategy for national wellbeing:
In July 2021, the Norwegian government released a statement that they are planning to develop a national wellbeing strategy to be published in 2024 (Helse- og omsorgsdepartementet, Barne- og familiedepartementet, 2021). The strategy is a reaction to the Quality of Life survey in 2020, as it showed that almost the same amount of people were happy and unhappy with their life situation in Norway. In the statement the government argues that GDP is not sufficient to determine the wellbeing of a population, and that this strategy aims to increase the knowledge of the development of national wellbeing and work towards improving the quality of life. Especially, there is an emphasis on decreasing the gap of life quality between social groups.
The Norwegian government argues that an increase in national wellbeing will not only bring the value of improved quality of life itself but will increase the robustness of the nation in times of crisis. This is based on experience from the COVID-19 pandemic where national surveys showed an increase in loneliness, worsened life quality and mental health issues. In the public health report of 2022-2023 (Helse- og omsorgsdepartementet, 2023). The mapping of mental health issues in Norway shows a trend of increasing issues with mental health problems, especially in the younger population. As a part of mitigating this trend, the strategy for national wellbeing is anchored in the public health report as a policy tool, as this is described as the main policy focus in public health in Norway. According to the report, the government will develop a system of a regular monitoring process of quality of life, both on a national and regional scales, as well as develop a specific set of indicators for quality of life, which will form the basis for future policymaking (Helse- og omsorgsdepartementet, 2023).
The indicators will be both subjective and objective and linked to the SDGs. In the vision for the national well-being strategy, emphasis is laid on the importance of utilising the quality-of-life data in policymaking regarding local and regional policies and budgeting, as well as increasing the Nordic common work to harmonise the work of national well-being economies with a common Nordic model.
The status of the publication of the national wellbeing strategy is in its late developing stage. A draft has been published in March 2024 prior to a public hearing for input (Helse- og omsorgsdepartementet, 2024). The strategy will weigh the improvement of the following four factors in working towards increased national wellbeing:
- Systems of measurement and monitoring of quality of life in Norway
- Knowledge in causes of- and the rising inequality of quality of life
- Coordination and cooperation in the field
- Policymaking based on measures of quality of life as well as research, law making, socio-economic evaluations and reports to the Norwegian Storting.
The report also stresses that negative expectations about the future are an important factor in the well-being of present and future generations and that mitigation of climate change and the promotion of the SDGs thus is an important part of the forthcoming strategy. However, this commitment to climate mitigation remains in tension with the equally strong commitment to continuing fossil fuel extraction elsewhere in government. Although Norway claims to partly be a well-being economy already, they recognise that quality of life indicators can forge a better management model and complement the existing economic structure. It is not an actual plan to establish a well-being economy in Norway in the context of this strategy, but with reference to the report of wellbeing economy in the Nordics by the Nordic council of ministers (Birkjær, Gamerdinger & El-Abd, 2021)., the Norwegian government acknowledge the great potential of applying the principles of a wellbeing economy into the socio-economic models and aim to explore the future possibilities for this.
5.4b SDI performance and explanation
Norway’s SDI global ranking has declined since 2008, from place 97 to 155 in 2022. See figure 24. Norway’s life expectancy has increased from 80,7 to 83,7 years in the period 2008 to 2022. The country has not experienced any decline during the global COVID pandemic, as the EU-26 have. See figure 25.
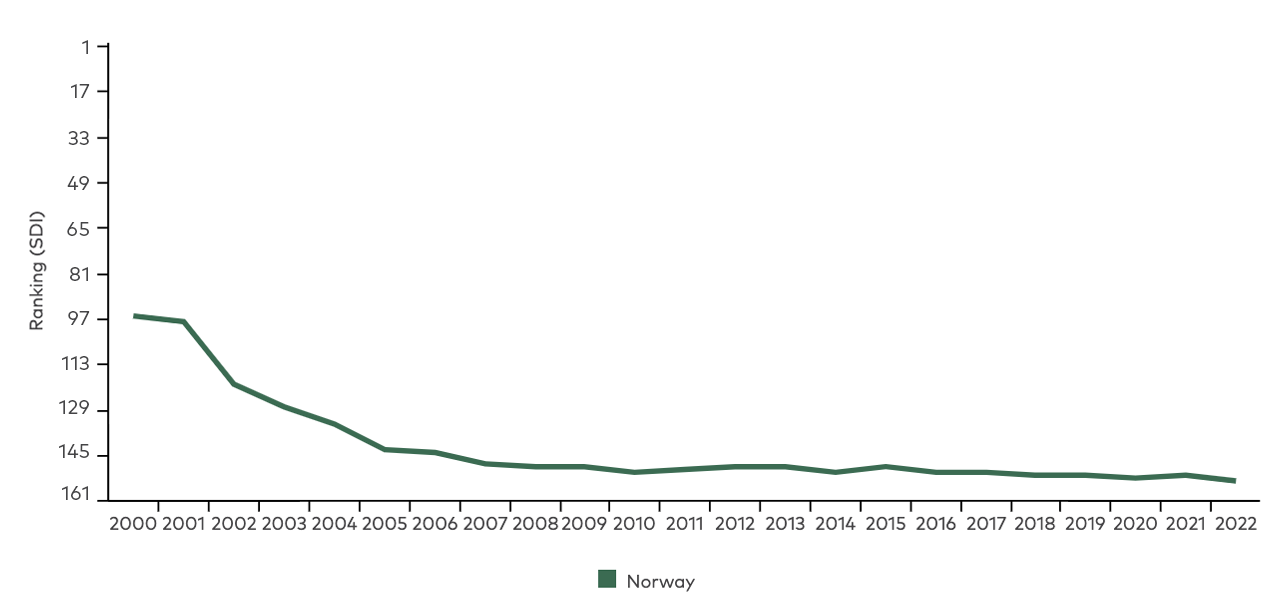
Figure 24: Norway’s SDI ranking development (2000–2022)
Figure 25: Life expectancy in years in Norway and EU-26 average (2008–2022)
Expected years of schooling have also increased in Norway from 17,4 years in 2008 to 18,6 years in 2022. This is a similar trend as in Sweden, Denmark and Finland. Mean years of schooling have increased from 12,5 to 13,1 years in the same period.
Norway’s gross national income per capita (measured in constant 2017 USD PPP) has increased with 9 percent in the period 2008 to 2022. In 2008, the GNI was estimated to 63, 719 USD, while in 2022 it is estimated to 69, 190 USD.
Norway's material footprint per capita (measured in tonnes) has increased in the period 2008 to 2022 with 38 percent. See figure 26. This is the largest increase in the Nordic countries. In 2022, it is estimated to be 41,6 tonnes per capita. Norway follows an opposite trend compared to the EU-26 average, which has decreased its level with - 30 percent in the same period. In 2022, the EU-26 average is estimated to be 19,8 tonnes per capita. This large increase of extraction of raw materials for consumption needs indicates that a very small share of products is recycled back into the economy.
Figure 26: Norway’s material footprint per capita (tonnes) and EU-26 average (2008–2022).
Source: Sustainable Development Index, 2024 and authors own calculations.
The level of CO2 emissions per capita (measured in tonnes) have decreased in Norway from 15,2 in 2008 to 13,0 in 2022.
5.4c TPI performance and explanation
Norway ranks 8 on the global score for 2020, with a score of 71, showing a trend of decreasing performance since 2011, that increases from 2018 though, showing an inclining trend in rank position.
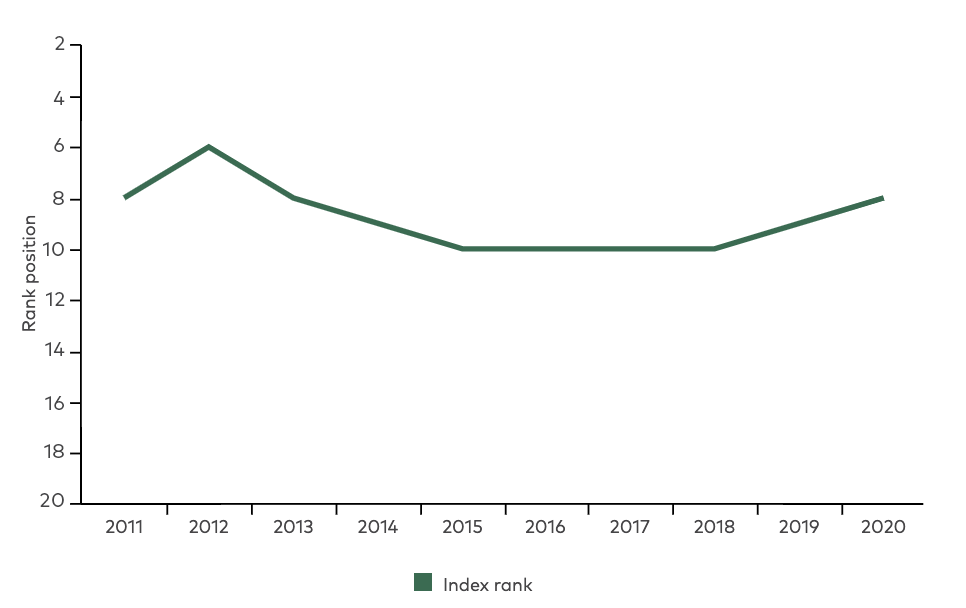
Figure 27: Index score in all four dimensions and index Rank for Norway in the years 2011-2020.
Source: TPI Database.
2011 | 2012 | 2013 | 2014 | 2015 | 2016 | 2017 | 2018 | 2019 | 2020 | |
Index ranking | 8 | 6 | 8 | 9 | 10 | 10 | 10 | 10 | 9 | 8 |
Looking at the graphs, the Environmental transition dimension has had an increasing trend since 2013, moving from rank 52 in 2011 to rank 44 in 2020. For the 3 other dimensions, the stagnating trends reflect the relatively flat movement of ranking positions of the Index rank.
Diving further into the dimensions, Norway ranks number 1 globally in Governance transition scoring 87 out of 100. The sub-indicator, Fundamental rights, has a high score of 97, being the main driver for the high performance of the Governance dimension in Norway. In an OECD report from 2022 (OECD, 2022) Norway's strong collaboration, active public participation in decision-making, and robust advisory groups are highlighted, as an indicator of sound and fair governance.
Regarding the environmental dimension, Norway performs below EU average, scoring 52 which puts the country in the moderate tier. It is especially the indicator Material Use which includes both resource productivity and material footprint, which is very low, where Norway ranks number 70. Hence there is a wide span from ranking number one on governance transition and number 70 on environmental transition. According to an Environmental Performance Review conducted by OECD in 2022 (OECD, 2022), Norway invests a lot in technology and innovation for green transition and to reach the 2030 climate goals. However, the material footprint remains very high and only 2% of all resources are recycled back into the economy. A report by WWF in 2022 (WWF, 2022) presents numbers on Norway´s material footprint in 2022 and what is needed to reduce the footprint to lower the pressure on planetary boundaries. Data from Statistics Norway show that the material footprint is increasing, even though a reduction of 76% of the material footprint is needed for the country to operate within planetary boundaries. It is foremost the consumption of fossil fuels that constitute the biggest share of the material footprint.
5.4d Doughnut economy performance and explanation
Figure 28 shows that between 1992–2015 Norway overshot planetary biophysical boundaries on all biophysical indicators while consistently meeting minimum social needs across all 12 social indicators. The latter is unique in performance within the Nordics.

Figure 28: Norway’s performance from 1992-2015 sourced from Good Life Project and premised on data used in Fanning et al. 2022.
Source: goodlife.leeds.ac.uk
Pathway data from the Good Life project shows that Norway’s average overshoot beyond the ecological ceiling is the highest amongst the Nordic countries, followed by Finland. Whereas Sweden and Denmark were able to lessen or reign in the extent of their ecological overshoot, Norway significantly increased the extent of its overshoot between 1992–2015.
Norway is the only Nordic country that performed above the social floor across all 12 social indicators between 1992–2015. Where other Nordic countries fall below the social floor for employment, Norway did not and had 95.7% of the population employed in 2015. Taking a deeper dive into Norway’s social indicators, the consumption of calories per capita per day has remained the highest of the Nordic countries between 2005–2015. Figure 28 also shows that there has been a marginal fall in equality during this period, while its rate is significantly slower than in Denmark. This alongside little change in social support since 2007. In contrast with its Nordic contemporaries, Norway has not seen a significant decrease in democratic quality, holding largely stable around high levels found in 2003. As in the other Nordic countries, life expectancy has increased steadily since 1992, to the age of 82.3 in 2015, whilst maintaining a high level of life satisfaction. The latter has risen ever so slowly since the mid-1990s in contrast to both Sweden and Finland which both saw slow declines during this period. In contrast to the rapid increases in gross enrolment for secondary education between 2013–2015 in both Finland and Sweden, Norway shows relative stability in enrolment for its education indicator.
5.5 Sweden
5.5a Alternative metric landscape in Sweden
In 1999 the Swedish parliament launched 16 environmental quality objectives which together with the generation goal functions as the basis for the national environmental politics. These objectives were developed as an answer to the UN´s environmental meeting in Rio 1992 and the Agenda 21 work and attempts to address all important aspects of environmental quality. There is probably no comparable system of environmental objectives in any country other than Sweden. Annual evaluations of the objectives are carried out and reported back to the government. The objectives form the overarching framework of Swedish environmental policy, but the goals are political and non-binding in nature. Achieving the environmental objectives are explicitly considered to also achieve the environmental dimension of Agenda 2030 in Sweden.
The SDG’s are used by many organisations to report (and improve) their sustainability impacts. It is also the priority of the Swedish government to implement the Agenda 2030 and in June 2020, the government submitted a bill to the parliament on how Sweden should work with the implementation, both nationally and within the EU and internationally. In 2022 the government submitted the first letter about the agenda to the parliament to implement.
In 2017, Sweden adopted a climate policy framework. The framework consists of a climate act, climate targets and a climate policy council. The long-term goal means that Sweden shall have no net emissions of greenhouse gases into the atmosphere by 2045 at the latest, in order to achieve negative emissions thereafter. The climate policy framework is a key component in Sweden's efforts to live up to the Paris Agreement and was adopted with a broad majority in the parliament and is designed in a way that can withstand political changes. Every year, the Swedish government is required to submit a climate report as part of the annual budget bill.
In an effort to broaden the scope of welfare beyond financial aspects, in 2017 the Swedish government introduced its ‘New Measures of Wellbeing’ framework to monitor trends in people’s quality of life and the long-term sustainability of the economy by focusing on wellbeing. The 16 indicators are either social or environmental indicators supplementing the pre-existing economic indicators already established and used. Social indicators include low economic standards, household cash margin, self-perceived public health, level of education, interpersonal trust, and subjective happiness with life. Environmental indicators include quality of air and water, chemical load, emissions of greenhouse gases, and the Rödlisteindex, which serves to assess Swedish nature and the status of the threat of extinction to species. The pre-existing economic indicators include progress on GDP, rates of employment and unemployment, household indebtedness and consolidated general government gross debt.
The presentation of measures of wellbeing are included in the annual budget which means that other departments, offices, and civil servants of Sweden have access to the findings and can use them in policymaking. Theoretically this is in line with ‘monitoring’ and ‘prioritising’ as distinct levels of operating a wellbeing economy (see section 3.2b). There is no stated goal that the indicators should influence politics or the activities of government agencies (Jansson, 2022). According to some commentators the initiative has waned from the agenda and may currently not be actively influencing Swedish policymaking to any great extent (Birkjær et al., 2021). However, the indicators still appear in the annual economic spring proposition from the government, in 2024 reporting improvements in air quality, greenhouse gas emissions and level of education, deteriorations in unemployment and GDP per capita, and no change in interpersonal trust, and subjective happiness with life.
Birkjær et al. (2021) also notes that in Sweden individual agendas addressing, e.g., gender equality, race discrimination, migrants, and refugees are often set without any explicit reference to an overarching agenda for wellbeing, in contrast to Finland and Iceland which have often communicated their wellbeing strategies, breaking the silos between various departments and initiatives.
Another initiative from The Swedish Agency for Economic and Regional Growth and the regional forum Reglab is the development of BRP+ (translates into Gross Regional Product +), a broadened measure of sustainable development and quality of life in Swedish regions. BRP+ has borrowed its conceptual framework from the OECD's Better Life Initiative. Better Life, like BRP+, consists of two parts. A part that shows the outcome for quality of life here and now based on a number of theme areas. Another part shows the prerequisites for a sustainable quality of life based on the three dimensions of sustainability. A report was published in 2024 with the aim of inspiring analysts and decision makers at both regional and municipal level to use BRP+ as an analytical tool (Möller et al., 2024).
At the local level the small town of Tomelilla in southern Sweden uses Doughnut Economics in their policy work in different ways. According to the DEAL website the town based their Sustainability Report 2022 on the Doughnut, and is planning the development of a new school based on the principles of Doughnut Economics, developing a Data Portrait, and exploring the development of an impact assessment and evaluation tool.
Since 2023 The Wellbeing Economy Alliance (WEAll) has had an established presence in Sweden.
5.5b SDI performance and explanation
Sweden’s global SDI ranking has fallen the most out of all Nordic countries in the period 2000 – 2022. In 2000, Sweden’s rank was 51st whilst in 2022, the rank was 134. See figure 29. Sweden’s life expectancy has increased from 81,1 to 83,5 years in the period 2008 to 2022. Sweden experienced a small decrease in life expectancy during the global COVID pandemic, but not as sharp a decrease as the EU-26 did. See figure 30.
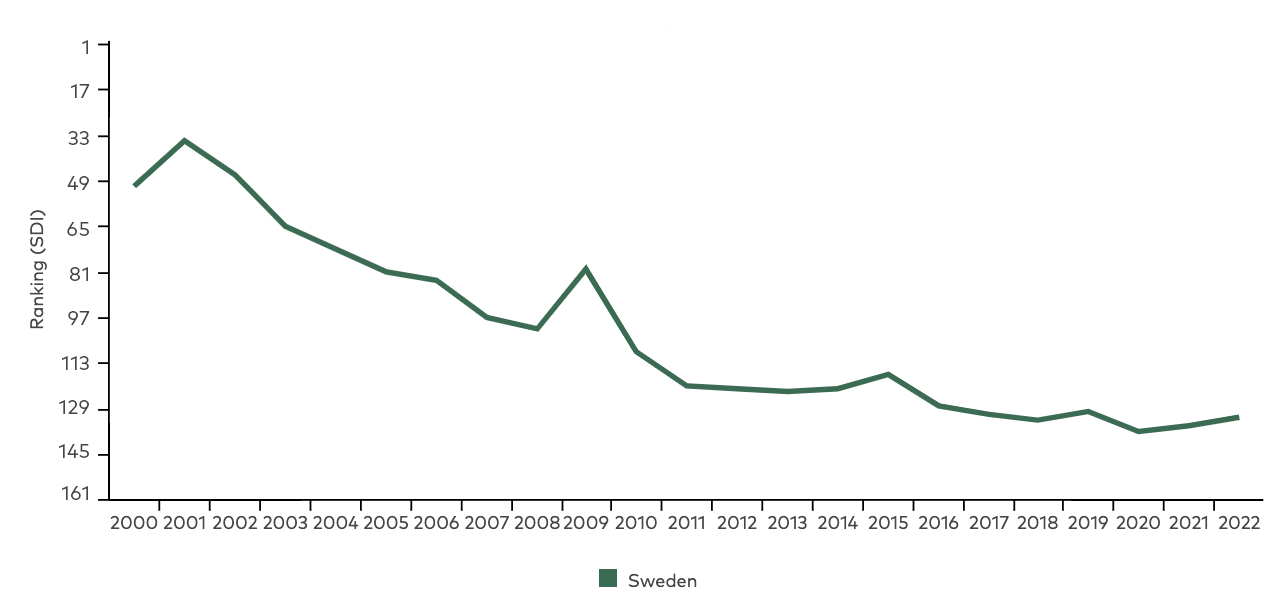
Figure 29: Sweden’s SDI ranking development (2000–2022)
Figure 30: Life expectancy in years in Sweden and EU-26 average (2008–2022)
Expected years of schooling have also increased in Sweden from 15,8 years in 2008 to 19,0 years in 2022. This is a similar trend as in Denmark and Finland. Mean years of schooling have increased from 12,1 to 12,7 years in the same period.
Sweden’s gross national income per capita (measured in constant 2017 USD PPP) has increased 15 percent in the period 2008 to 2022. In 2008, the GNI was estimated to 49, 623 USD, while in 2022 it is estimated to 56, 996 USD. This increased standard of living is the third highest rise among the Nordic countries in the period 2008–2022.
Sweden’s per capita material footprint (measured in tonnes) remained stable from 2008 to 2022, showing only a slight decrease of 1%. In contrast, the EU-26 average decreased by approximately 30% over the same period. See figure 31 below.
Figure 31: Sweden’s material footprint per capita (tonnes) and EU-26 average (2008–2022)
5.5c TPI performance and explanation
As can be seen in figure 32 below Sweden has dropped in the ranking over the years, going from being number 3 between the years 2011–2014, dropping to number 7 since 2017. In 2020 the overall score was 72 out of 100. Comparing the two graphs below, shows that Sweden has scored somewhat lower on social and governance over the last years, but on the other hand improved the scoring slightly for the environmental and economic dimensions.
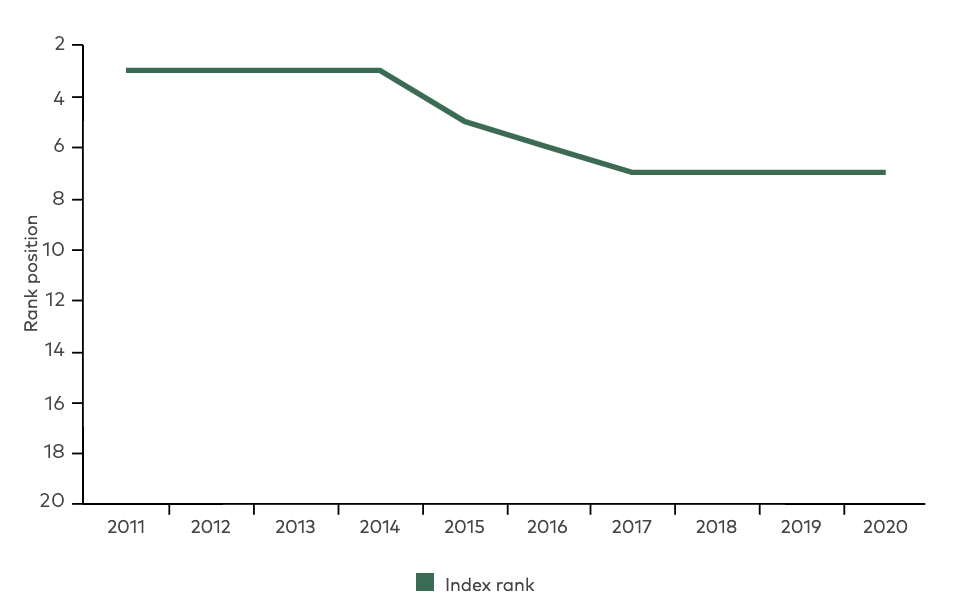
Figure 32: Sweden´s score divided in all four dimensions as well as the overall ranking between 2011–2020.
2011 | 2012 | 2013 | 2014 | 2015 | 2016 | 2017 | 2018 | 2019 | 2020 | |
Index ranking | 3 | 3 | 3 | 3 | 5 | 6 | 7 | 7 | 7 | 7 |
Compared to the other Nordic countries, Sweden ranks number five on economic (strong transition tier) and governance (transition leader tier), number six on social (transition leader tier) and number 39 on environmental (moderate transition tier). Sweden ranks above the EU average on all dimensions except for environmental. Under the environmental dimension there are four different indicators, where it is primarily the indicator Material Use where Sweden scores very low. However, both Energy Productivity and Biodiversity also stand out from the rest of the indicators in terms of low performance. According to data from the European Environmental Agency, Sweden had the fourth largest material footprint per capita in the EU in 2022, and it has only increased during the last decade (European Environmental Agency, 2023). Hence, a big contributor to why the environmental dimension scores the lowest of all four dimensions.
Furthermore, the economic dimension scores relatively low compared to social and governance. The main reason is the low scoring for the sub-indicator called Gross Value Added of Manufacturing (% of GDP). This can partly be explained by the high dependency Sweden has had on heavy industry manufacturing for a long time, which is changing rapidly with technological innovation, specialisation and economies of scale, where the market to a larger extent is characterised by knowledge-intensive industries (Nordea, 2016). On the other hand, Sweden scores as Transition leader in all sub-indicators except one for the social dimension and all sub-indicators except two for the governance dimension. Hence, both dimensions are big contributors to the overall high ranking among countries included in the TPI. Compared to the other Nordic countries, Sweden is ranked the second best, only Denmark having a higher total ranking as number two among all countries included in TPI.
5.5d Doughnut economy performance and explanation
Figure 33 shows that Sweden has maintained a relatively healthy and steady performance across social indicators, all above the social floor bar employment, between 1992–2015, while its performance on biophysical indicators shows a slow and steady increase above biophysical boundaries since 2009.
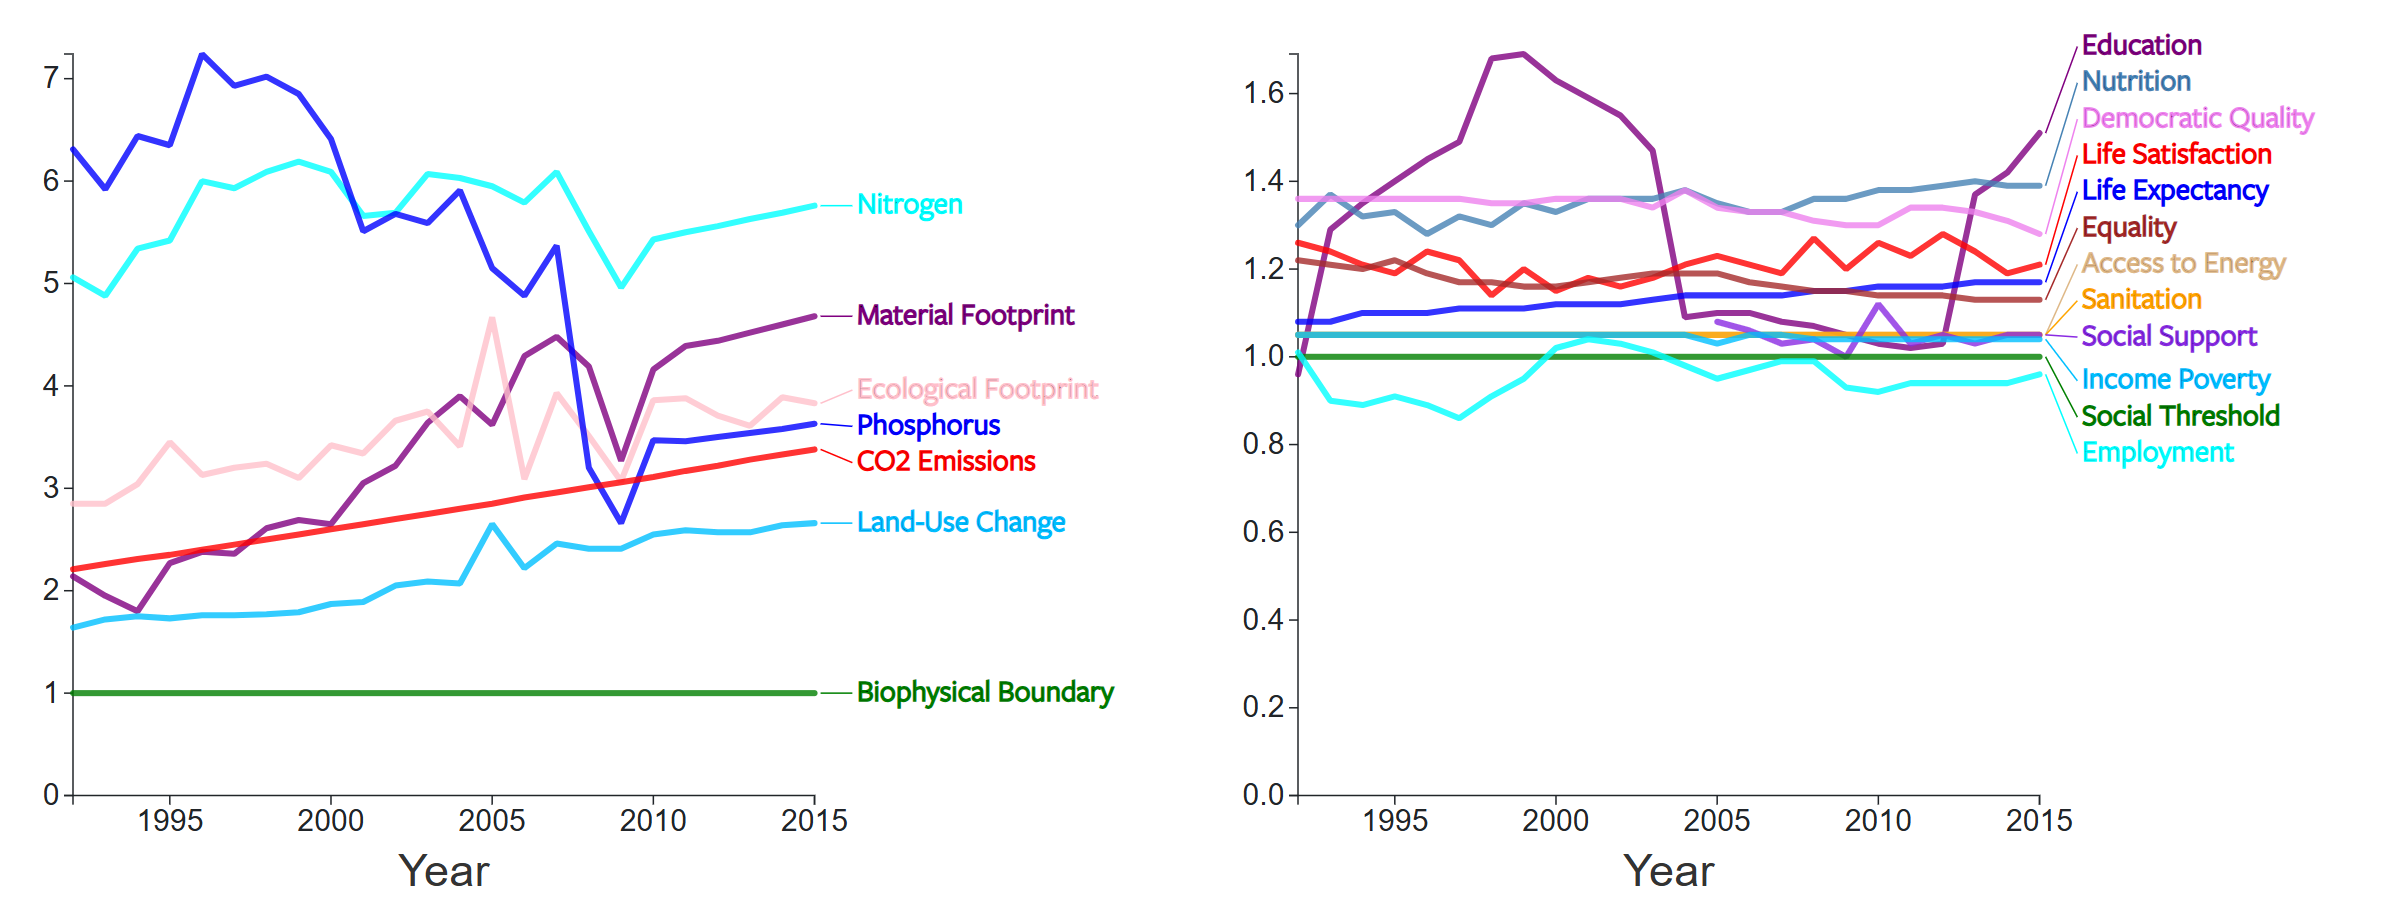
Figure 33: Sweden’s performance from 1992–2015.
Sourced from Good Life Project and premised on data used in Fanning et al. 2022.
Sweden’s performance across all 7 biophysical indicators were above acceptable thresholds. The period of 2007–2009 saw dramatic drops in nitrogen, material and ecological footprints and phosphorus. Though all, barring the production of phosphorus, have since rebounded to levels equal to or above those in 2007. Out of the Nordic countries, Sweden has the slowest rate of steady increase of CO2 above biophysical boundaries, as well as the lowest level of overshoot. In respect of land-use changes, material and ecological footprints, as well nitrogen, its performance is comparable to each of the other Nordic countries.
Sweden’s performance across social indicators has remained relatively steady between 1992–2015. During this period, levels of employment are, like Finland, consistently below the social floor, though there in contrast to the latter, there has been an uptick in performance in 2014–2015. The provision of education, and the % of children attending secondary school, is by far the most erratic performance across the Nordics, with dramatic improvement arriving in both Finland and Sweden in 2012. Unsurprisingly, there has also been a steady increase in healthy life expectancy to 82.2 years. This accords with the highlighting of happiness, meaningfulness, equality and freedom for action as core elements of an increasing quality of life in Sweden and the Nordics more generally. Yet, nutrition performances remain the lowest in the Nordics. Much like Finland, there has also been a slow decline in democratic quality since 2011. This reflects larger trends across Europe. This can be attributed to the beginning of the rise of populism and the slow increase in societal polarisation.
The alternative 2019 EU snapshot–using different data sources indicators and methods–identified Sweden as the overall top performer in the Nordic countries (Gómez-Alvarez Díaz et al. 2024). While it is the middle performer in social shortfall, falling 11.2% below a combined measure of the social floor it performs significantly better than Denmark and Finland in terms of ecological overshoot, overshooting a combined measure of the ecological ceiling by 136.3%. It should be noted however that even this outstanding performance is still far from the sustainable threshold, which would be indicated by an overshoot of 0%.