2. Methods
The Site – Storfjärden Fish Farm
In modern times, traditional capture fisheries have dominated the production of blue food and emptied stocks of fish in the oceans globally. However, aquaculture production is becoming an increasingly important and potentially more sustainable source of blue food. In the year 2000, aquaculture amounted to ca 25% of total fish production. Today, that number is ca 50% of the annual total production of 180 million tonnes fish (FAO. 2022).
Åland aquaculture represents an important part of the export economy of the islands. The contribution to the total nutrient load from the fish farms into the Baltic Sea is small, but local eutrophication effects are seen, and expansion of the aquaculture is thereby limited (Wennström et al. 2011). Hence, there are strong incentives for the producers to reduce their nutrient output and environmental impact. A recent field study performed on 28 Åland fish farms showed that 15 of them had local negative effects that manifested as oxygen deficient and sulfidic sediments. Three fish farms had very poor oxygen conditions at the time of sampling (Naturvatten i Roslagen AB 2023). It is likely that seasonal variations cause more sites to experience hypoxia, meaning that the waters have insufficient oxygen for most animals to survive (defined as < 2 mg/L dissolved O2). The sediments were also high in organic matter and constitute local hot spots of nutrient pollution.
Sampling of Sediment Cores
The sampling was done in Storfjärden bay in Eckerö municipality, Åland (WGS 84: N 60.252896 E 19.492400, Figure 1). The locale was chosen after reviewing data collected by the Åland fish farmers organization as part of the recipient control program (Naturvatten i Roslagen AB 2023). According to the monitoring data, the bottoms at the site are rich in organic matter originating from the fish farm, which has resulted in patches of hypoxic and sulfide rich sediments.
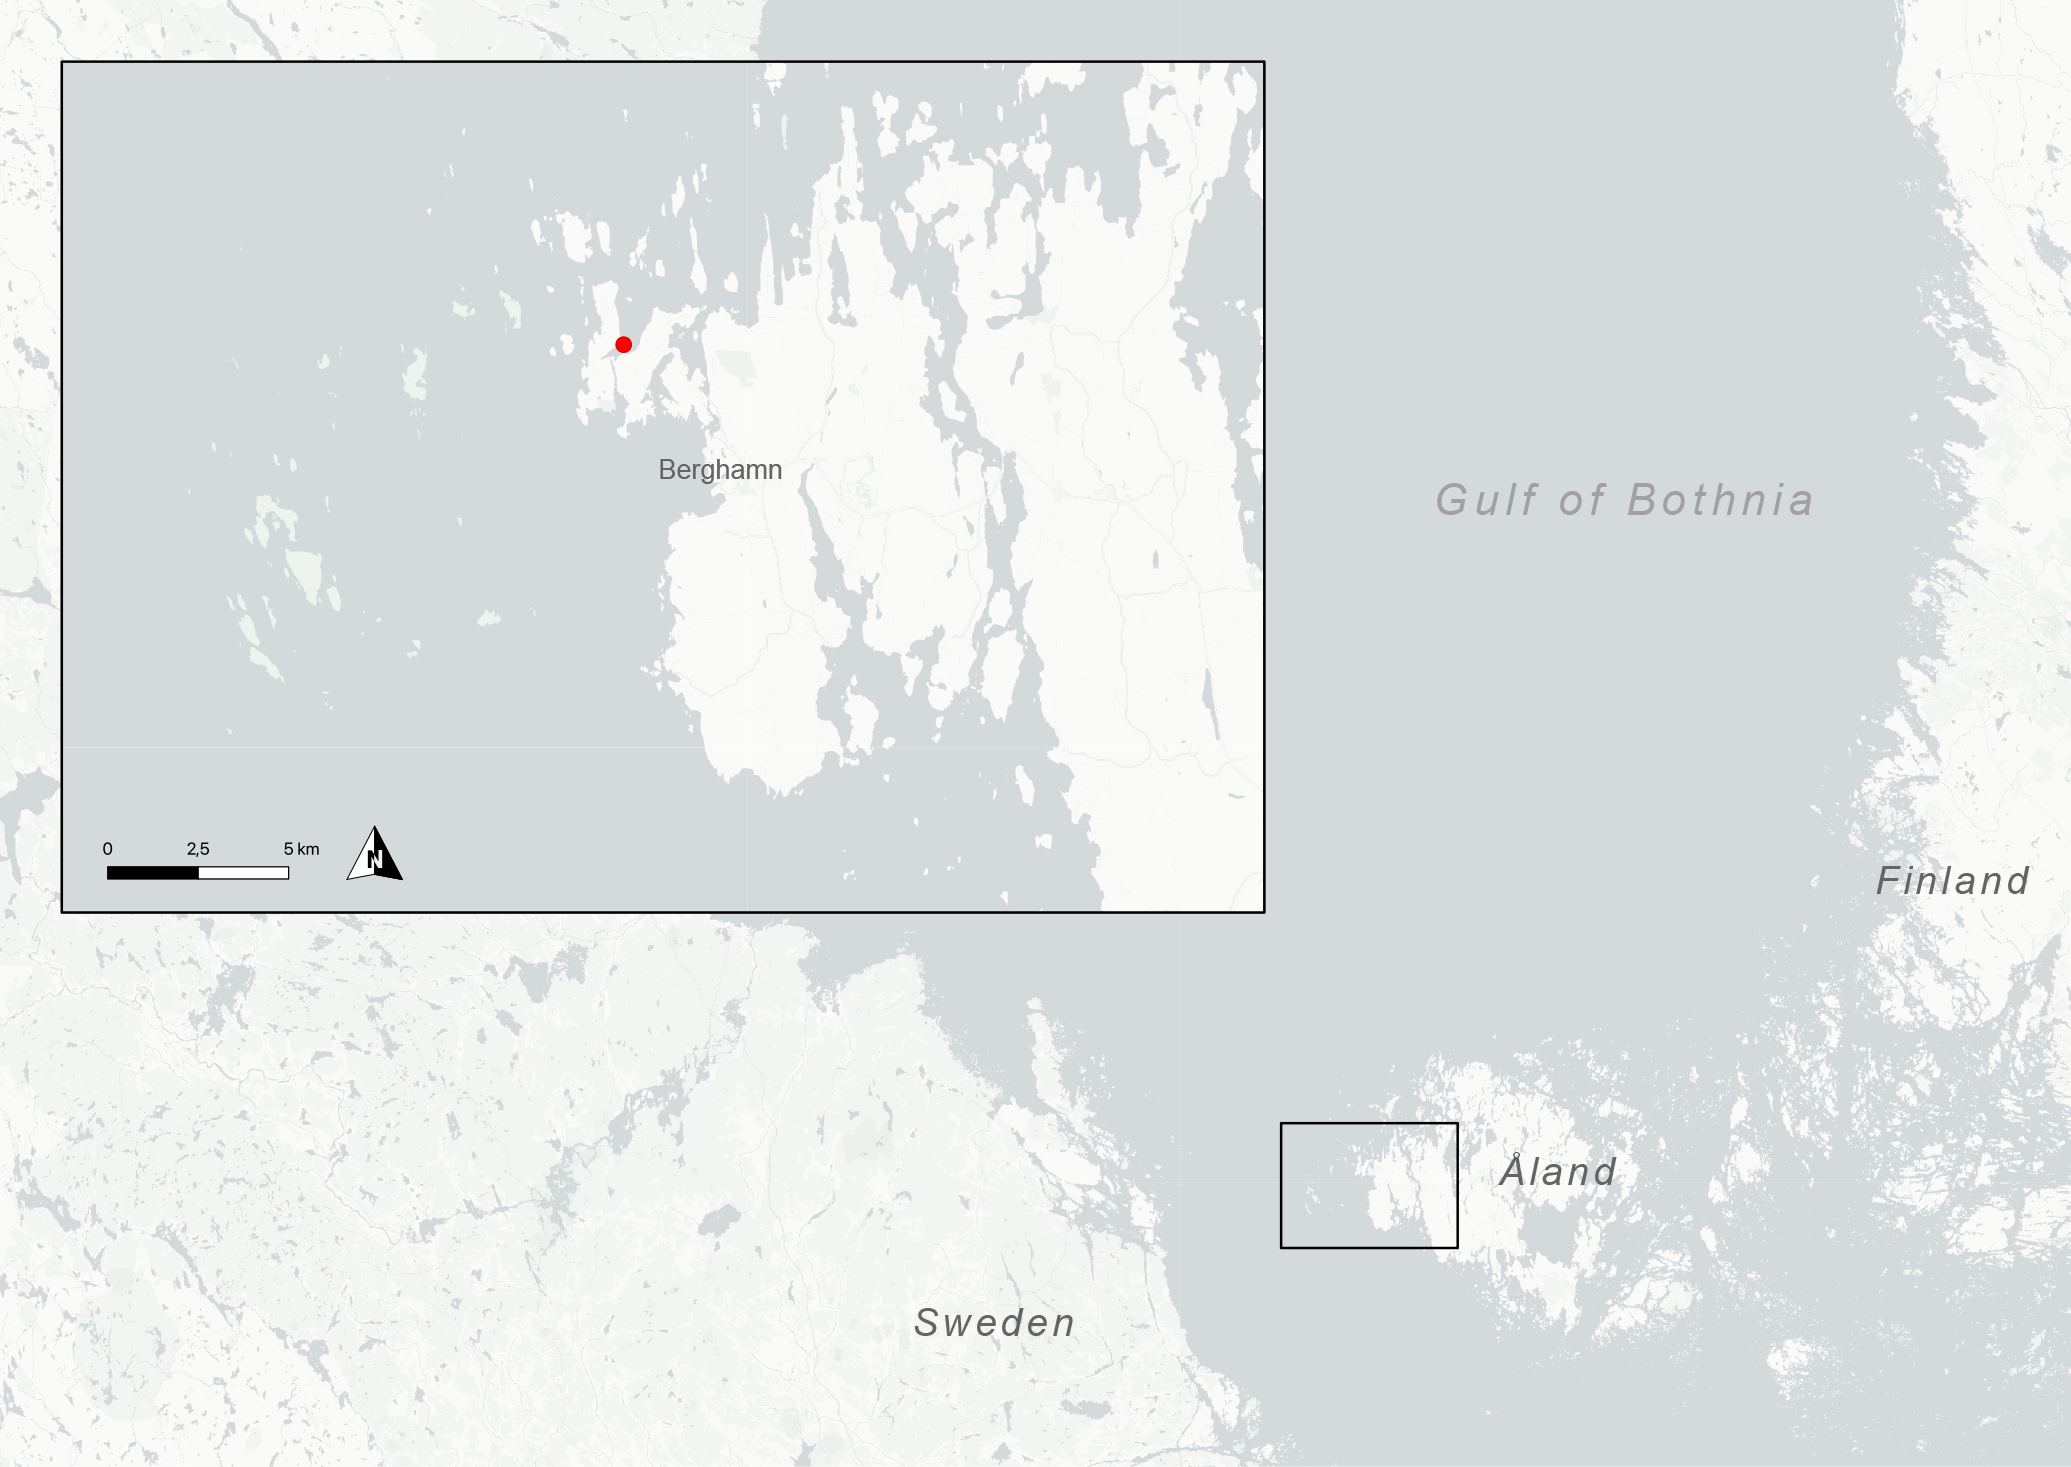
Figure 1. Map showing the sampling location (red dot) in the Storfjärden bay, Åland, and its location in the Baltic Sea.
A total of 17 sediment cores were collected using a kajak tube corer that was manually lowered to 10 m depth from a boat (Figure 2) 100 m from the fish farm. The fish-farmers kindly escorted us to the site on their working boat and helped retrieving the cores. Water parameters were measured with a multimeter (HACH Hq40d). The salinity was 6, the temperature was 9°C, pH was 7.8, and the bottom water was well oxygenated (8 mg/L O2) at the time of sampling. The concentration of phosphate (PO43-) and ammonium (NH4+) in the bottom water was 3.9 ± 0.03 and 2.0 ± 0.3 µmol/L, respectively. The retrieved sediments had a strong smell of sulfide and were partly black – indicators of so called euxinic conditions (which means that the sediment is hypoxic and sulfidic). Two cores were sampled for water chemistry, using the methods described below.
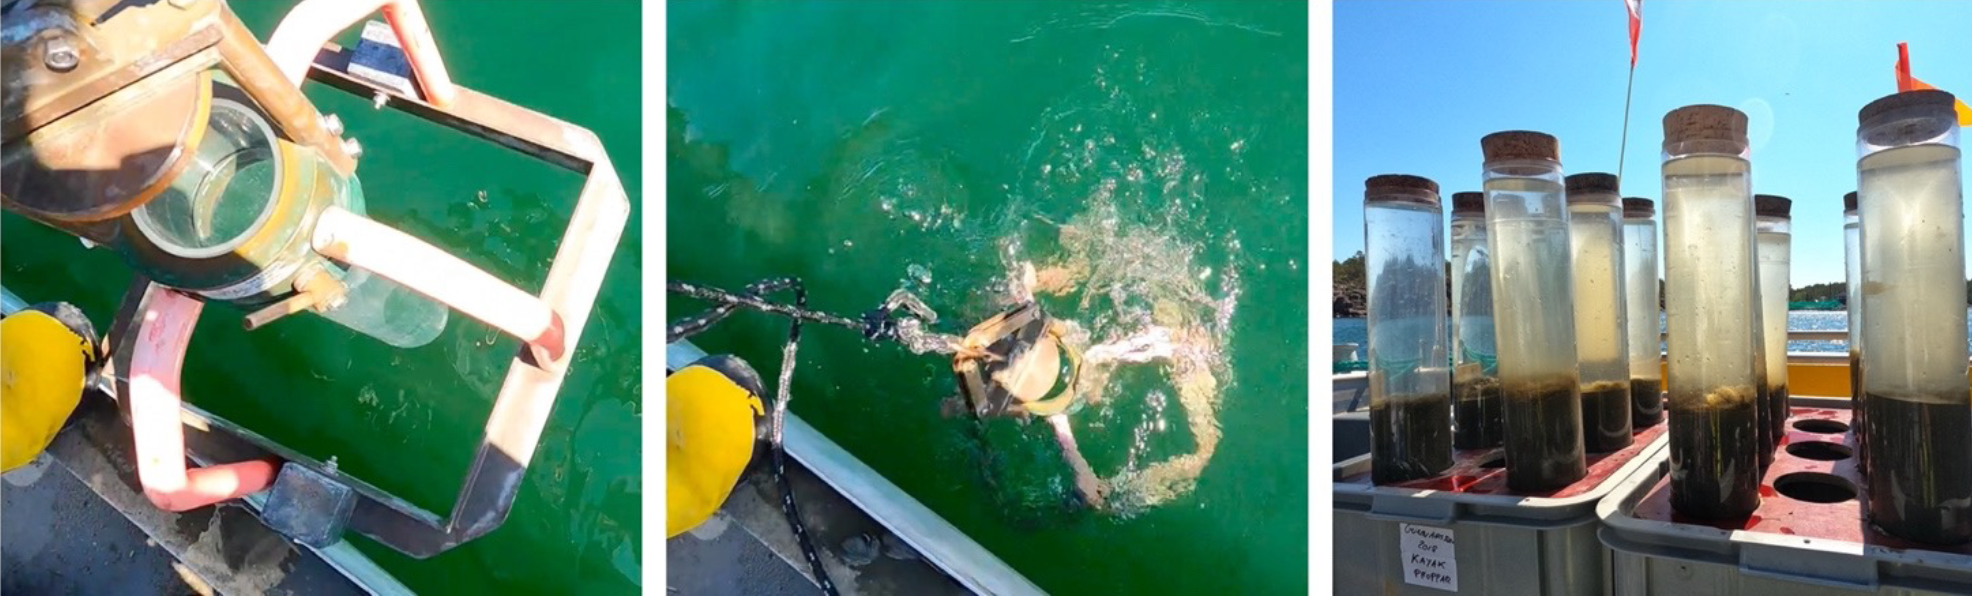
Figure 2. Photos of the sampling with the kajak tube corer from the boat in Storfjärden, and collected sediment cores with intact bottom water overlying the sediment surface.
The sediment cores were transported to Stockholm University where they were put in three separate 100 L incubator buckets in a climate chamber at 9°C temperature which was the temperature measured in the water during field sampling. The buckets contained Baltic Sea surface water collected from Lilla Värtan in Stockholm (N 59.372848 E 18.068803). The bucket water was filtered through a 40 µm mesh and treated with addition of artificial seawater to increase the salinity from 2 to 6 before the cores were placed in the incubators. The concentration of PO43- and NH4+ in the ambient water was 3.3 and 0.5 µmol/L, respectively. Each core was fitted with a magnetic stirrer externally driven by a motor in the middle of each incubator. The magnetic stirrer ensured a gentle turbulence in the water column, and the formation of a diffusive boundary layer (DBL) at the sediment-water interface (SWI), to mimic natural conditions (Broström and Nilsson 1999). The water volume in the core was 1.3 ± 0.05 L.
Out of the 17 cores, a majority hosted visible macrofauna (animals > 1 mm body size) such as sediment dwelling worms (mostly Nereis diversicolor), small clams (Macoma batlhica and Mya arenaria) and a few small amphipods. Two cores were excluded from further experimentation since they contained large individuals of the isopod Saduria entomon and the worm Nereis diversicolor, which resuspended and circulated the sediment and porewater, certainly confounding solute fluxes. The rest of the cores (n=15) were randomly allocated to three treatments (n=5), i.e., one treatment per incubator, according to Table 1. The activated limestone was added to the cores by spreading the material evenly at the water surface after which it settled on the sediment surface immediately. The material had a particle size of 3-6 mm. The cores were left with tops open below the water level of the incubator buckets to allow for water exchange and buffering of pH for three days. The cores were then completely shut with rubber stoppers to stop oxygen from entering the systems, thereby inducing anoxia (0 mg/L O2). Then, release of PO43- from the sediment to the water can be detected. In this manner, the effect of the AK on PO43- release was investigated.
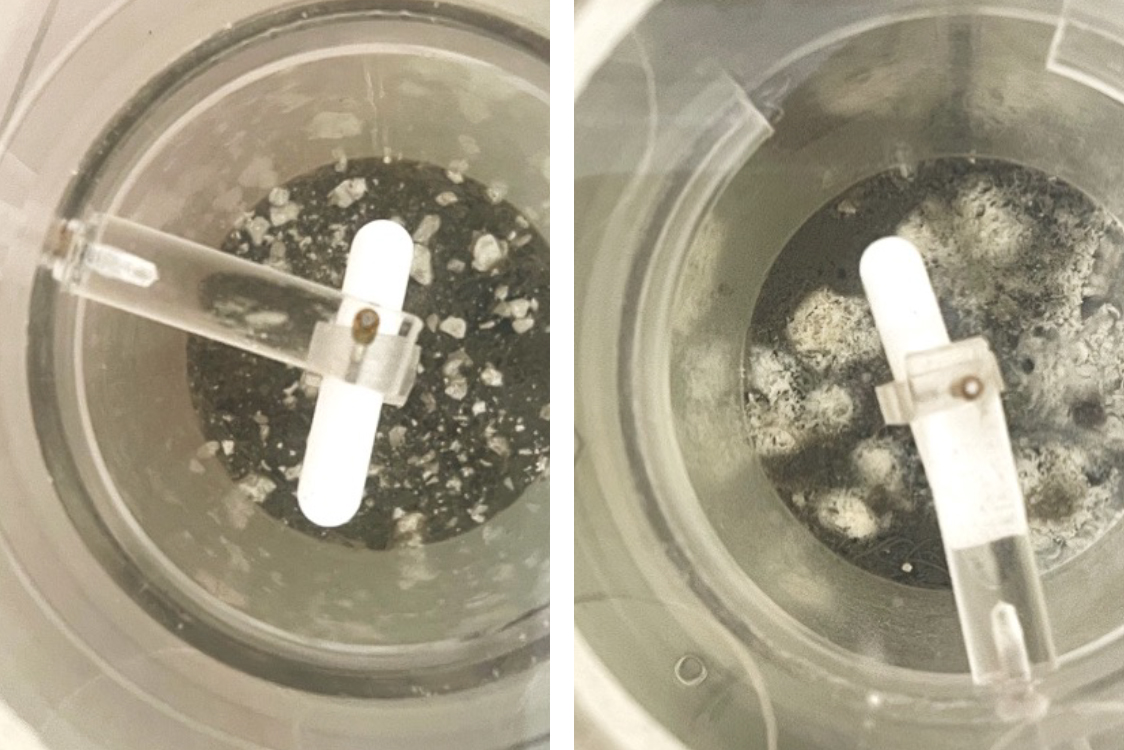
Figure 3. Top-view from the opening of the sediment cores showing the activated limestone (600 g/m2 dose) just after addition (left) and one day after addition when it had dissolved and created white fields on the sediment surface (right).
Table 1.
Treatment | Abbreviation | Activated limestone addition (g/core) | Activated limestone dose (g/m2) |
Untreated control | CTRL | - | - |
Activated limestone, low dose | AK300 | 1.51 | 300 |
Activated limestone, high dose | AK600 | 3.02 | 600 |
Sediment Core Incubations
When the O2 concentrations in all sediment cores had decreased below 0.2 mg/L, ca two weeks after closing them, several incubations of the sediment cores were done over the course of 8 weeks to determine fluxes of PO43-, NH4+, O2, CH4 (methane), and H2S (hydrogen sulfide). The method is based on differences in solute concentrations at the start and end of the incubation. The flux Jx (mmol m-2 d-1) equals (CE - CS) ⋅ h / t, where CE and CS are end and start concentration in μmol/L, h is the core water column height in m, and t is incubation time in days.
Sampling of solutes in the core water was done from the middle of the column using a syringe with a silicone tubing. Samples for PO43- and NH4+ were filtered through a 0.45 µm polyethersulfone (PES) syringe filter into heat-treated (water filled at 60°C for 24 h) PP-tubes, and analyzed using method 2 mentioned in the section Chemical Analyses below. All water samples were stored at 4 °C before analysis. Water for CH4 analysis was transferred without filtering to 12 mL exetainer vials and any biological activity was stopped with addition of 100 µL 7M zinc chloride, to prevent microbial methane production or oxidation while awaiting analysis. Details on all chemical analyses are provided in a separate paragraph, below.
Termination
The experiment was terminated 8 weeks after closing the cores. Water was collected for nutrient analysis, as described above, and for H2S by siphoning and overflowing core water into winkler flasks that were then fixated with 4 mL zinc acetate. The samples were stored at 4 °C until analysis. A counting of benthic fauna, especially large worms, could not be performed due to the decay of the animals.
The top 2 cm of the sediment surface was sliced. A portion of the wet slice was weighed and dried to establish water content and organic matter content using mass loss on ignition (LOI) at 520 °C for 6 h. The remaining wet slice was transferred to 50 mL PP-tubes and carefully bubbled with nitrogen via 0.40 mm syringe needles to purge oxygen and preserve anoxic conditions. pH was measured, and aliquots were centrifuged at 4000 rpm for 5 minutes before supernatant porewater was analyzed for dissolved PO43- using method 1 mentioned in the section Chemical Analyses below.
Chemical Analyses
Watercolumn pH, oxygen, and salinity were measured with a multimeter (HACH Hq40d). To determine CH4 concentration in incubation samples, headspace-gas chromatography was done, following the method by Sithersingh and Snow (2012). A headspace was created in the Exetainer vial containing the samples by replacing 2 mL of sample with nitrogen gas using Ø 0.4 mm needles pushed through the septum of the lid. After 24 h equilibration at room temperature, 1 mL headspace gas was injected into a Shimadzu 8A gas chromatograph (GC) equipped with a flame ionization detector (FID). We made repeated injections of 1 mL standard gas containing 50 ppm methane (Air Liquide, France), to calibrate the instrument. Additionally, a solubility coefficient for methane in water with salinity of 6 was used to calculate the concentration of CH4 in the water.
Analysis of dissolved PO43- was done on filtered water samples (0.45 µm PES) by two methods. The first method (method 1) was used to monitor phosphate concentrations in the core water during the experiment, and to analyze dissolved phosphate in the sediment porewater after termination. This method used a mobile spectrophotometer (Spectroquant® Move 100, Merck), according to method DIN EN ISO 6878, and had a measuring range of 0.01 – 5.00 mg PO43-/L. Method 2 was performed at the SWEDAC accredited Marine Ecological Lab at the Department of Ecology, Environment, and Plant Sciences Stockholm University, by colorimetric analysis on a segmented flow nutrient analyzer system (OI Analytical, Flow Solution IV, Xylem Inc., USA) using the manufacturers method #319528 for PO43-. Analysis of dissolved NH4+ used the same colorimetric analysis with method #319526. Method 2 had a lower measuring range of 0.5 – 500 µg PO43-/L. The range for NH4+ was 0.5-2500 µg/L. Dissolved hydrogen sulfide was measured by the Marine Ecological Lab using spectrophotometry according to Grasshoff, Ehrhardt, and Kremling (1983) at a range of 0.1 – 2.2 mg/L .
Statistics
Analysis of variance (ANOVA) and Tukey’s post-hoc test were used to establish whether there were significant differences between the treatments. The Tukey test is robust against varying sample sizes that sometimes occurred as a result of sample loss. In case of non-normality, a non-parametric Kruskal-Wallis rank sum test followed by a pairwise Wilcoxon test was done. All statistical analyses were performed in R version 4.2.2 using the package ExpDes.