4 Environmental taxes to reduce environmental impacts
An environmental tax per unit of primary raw materials will increase the costs of using primary raw materials relative to the use of recycled raw materials. According to economic theory, this economic incentive will contribute to boost a shift of demand from primary raw materials to re-used virgin materials. This will in turn reduce the extraction of primary raw materials, thus reducing the negative environmental impact. As described in section 1.2, environmental taxes are classified into four categories, energy, transport, pollution, and resource taxes.
This chapter presents the results of the in-dept impact assessment for two case studies within the textile and construction sector, chosen to illustrate the impacts of a natural resource tax. The two cases are textile goods made of polyester and construction goods of cement. Moreover, the chapter also briefly discusses price elasticities and its differences between retail and e-commerce. Also, the environmental impact of women’s apparel is presented and discussed for a variety of clothing. Initially, the chapter highlights the environmental and social costs of textile production and consumption. Furthermore, the chapter discusses how circular economy models can be used in combination with life cycle analysis, to design effective environmental policies. Lastly, limitations and disclaimers of the chosen methods, the available price elasticities as well as quantities are also highlighted within this chapter.
4.1 Scope and data collection – The textile sector
The case of polyester was chosen as an example of a broadly used, but environmentally rather unsustainable material. Polyester is a synthetic fibre derived from oil, and therefore non-biodegradable. It is internationally recognised to have a large environmental impact as the fibre is made through a chemical reaction which involves coal, petroleum, air, and water (Commonobjective, 2021). Since 2008, the proportion of polyester has increased from 31 to 58 percent in 2021 out of all fibres produced globally (Finnish Textile Fashion Association, 2021). The share of recycled polyester has increased from 8 to15 percent during the same period (Finnish Textile Fashion Association, 2022). The process of producing polyester requires 125 MJ of energy, per kilogram produced fabric (Commonobjective, 2021). Thus, with the increased global demand for polyester the environmental burden is evident, and the need to apply circular economy strategies to promote sustainability is urgent.
4.1.1 The environmental and social costs of textile production and consumption
Significant negative environmental damages and climate impact within the textile sector occurs across the value-chain of all stages of the product- and material design, as well as during the use phase of a textile product. The textile and fashion industry are a resource intensive and polluting industry, as its production requires a large amount of raw materials, energy, water and chemicals. Inputs that cause air-, water- and soil emissions. The amount of water used depends on the type of fibre and its production method. However, it is of great concern that large parts of the product- and material design of textile products occur in developing countries, where there are already water shortages. Environmental damages on biodiversity losses occurring due to farming, and land use, and pressures from industries, is also an important aspect to consider. Furthermore, social issues, such as labour rights and gender equality are also significantly impacted by the textile value chain (Swedish Environmental Protection Agency, 2023; European Parliament, 2020 and 2019; United Nations Environment Programme, 2023).
Recently, a shift has started towards investing in circular business models with focus on circular textile designs within Europe, including the Nordic countries. These behavioural changes create opportunities for the Nordic countries to influence policies at EU level to include economic instruments in the design phase of a textile product. By imposing a natural resource tax, governments can steer production away from resources that are scarce or have a high negative environmental impact. As discussed in chapter 1.1, a natural resource tax could, e.g., be a raw material tax or an import tax.
A majority of the clothes and textiles that are sold in the Nordic countries are produced outside of the region and in many instances outside of the EU. It is therefore more reasonable to examine the implementation of a natural resource tax that is charged as an import tax within the textile sector. Thus, that a tax is applied for each gram of a certain material that is imported.
Production often takes place in low-wage countries, where environmental legislation is inadequate. Processing and garment production phases requires large amount of water and use of chemicals. Significant amounts of energy are further used for sewing, gluing, welding, and seam taping equipment. The energy used in the production process often originates from fossil energy sources such as coal. Moreover, chemicals are used at all stages of the textile production process (Swedish Environmental Protection Agency, 2023; European Parliament, 2020 and 2019). According to estimates, producing 1 kg of textiles requires 0.58 kg of harmful chemicals (United Nations Environment Programme, 2023). Furthermore, pesticides are used to grow raw materials such as cotton. As previously highlighted in chapter 2.2, only 2–3 percent of so-called fibre to fibre recycles occur on a global scale.
Figure 13 shows the carbon, water and waste footprint of clothing consumed in the EU during 2015. In terms of per tonne of sold clothing, it accounted to carbon emissions of 30 tonne CO2 equivalents, 7 220 m3 of water use and 1.7 tonnes of waste.
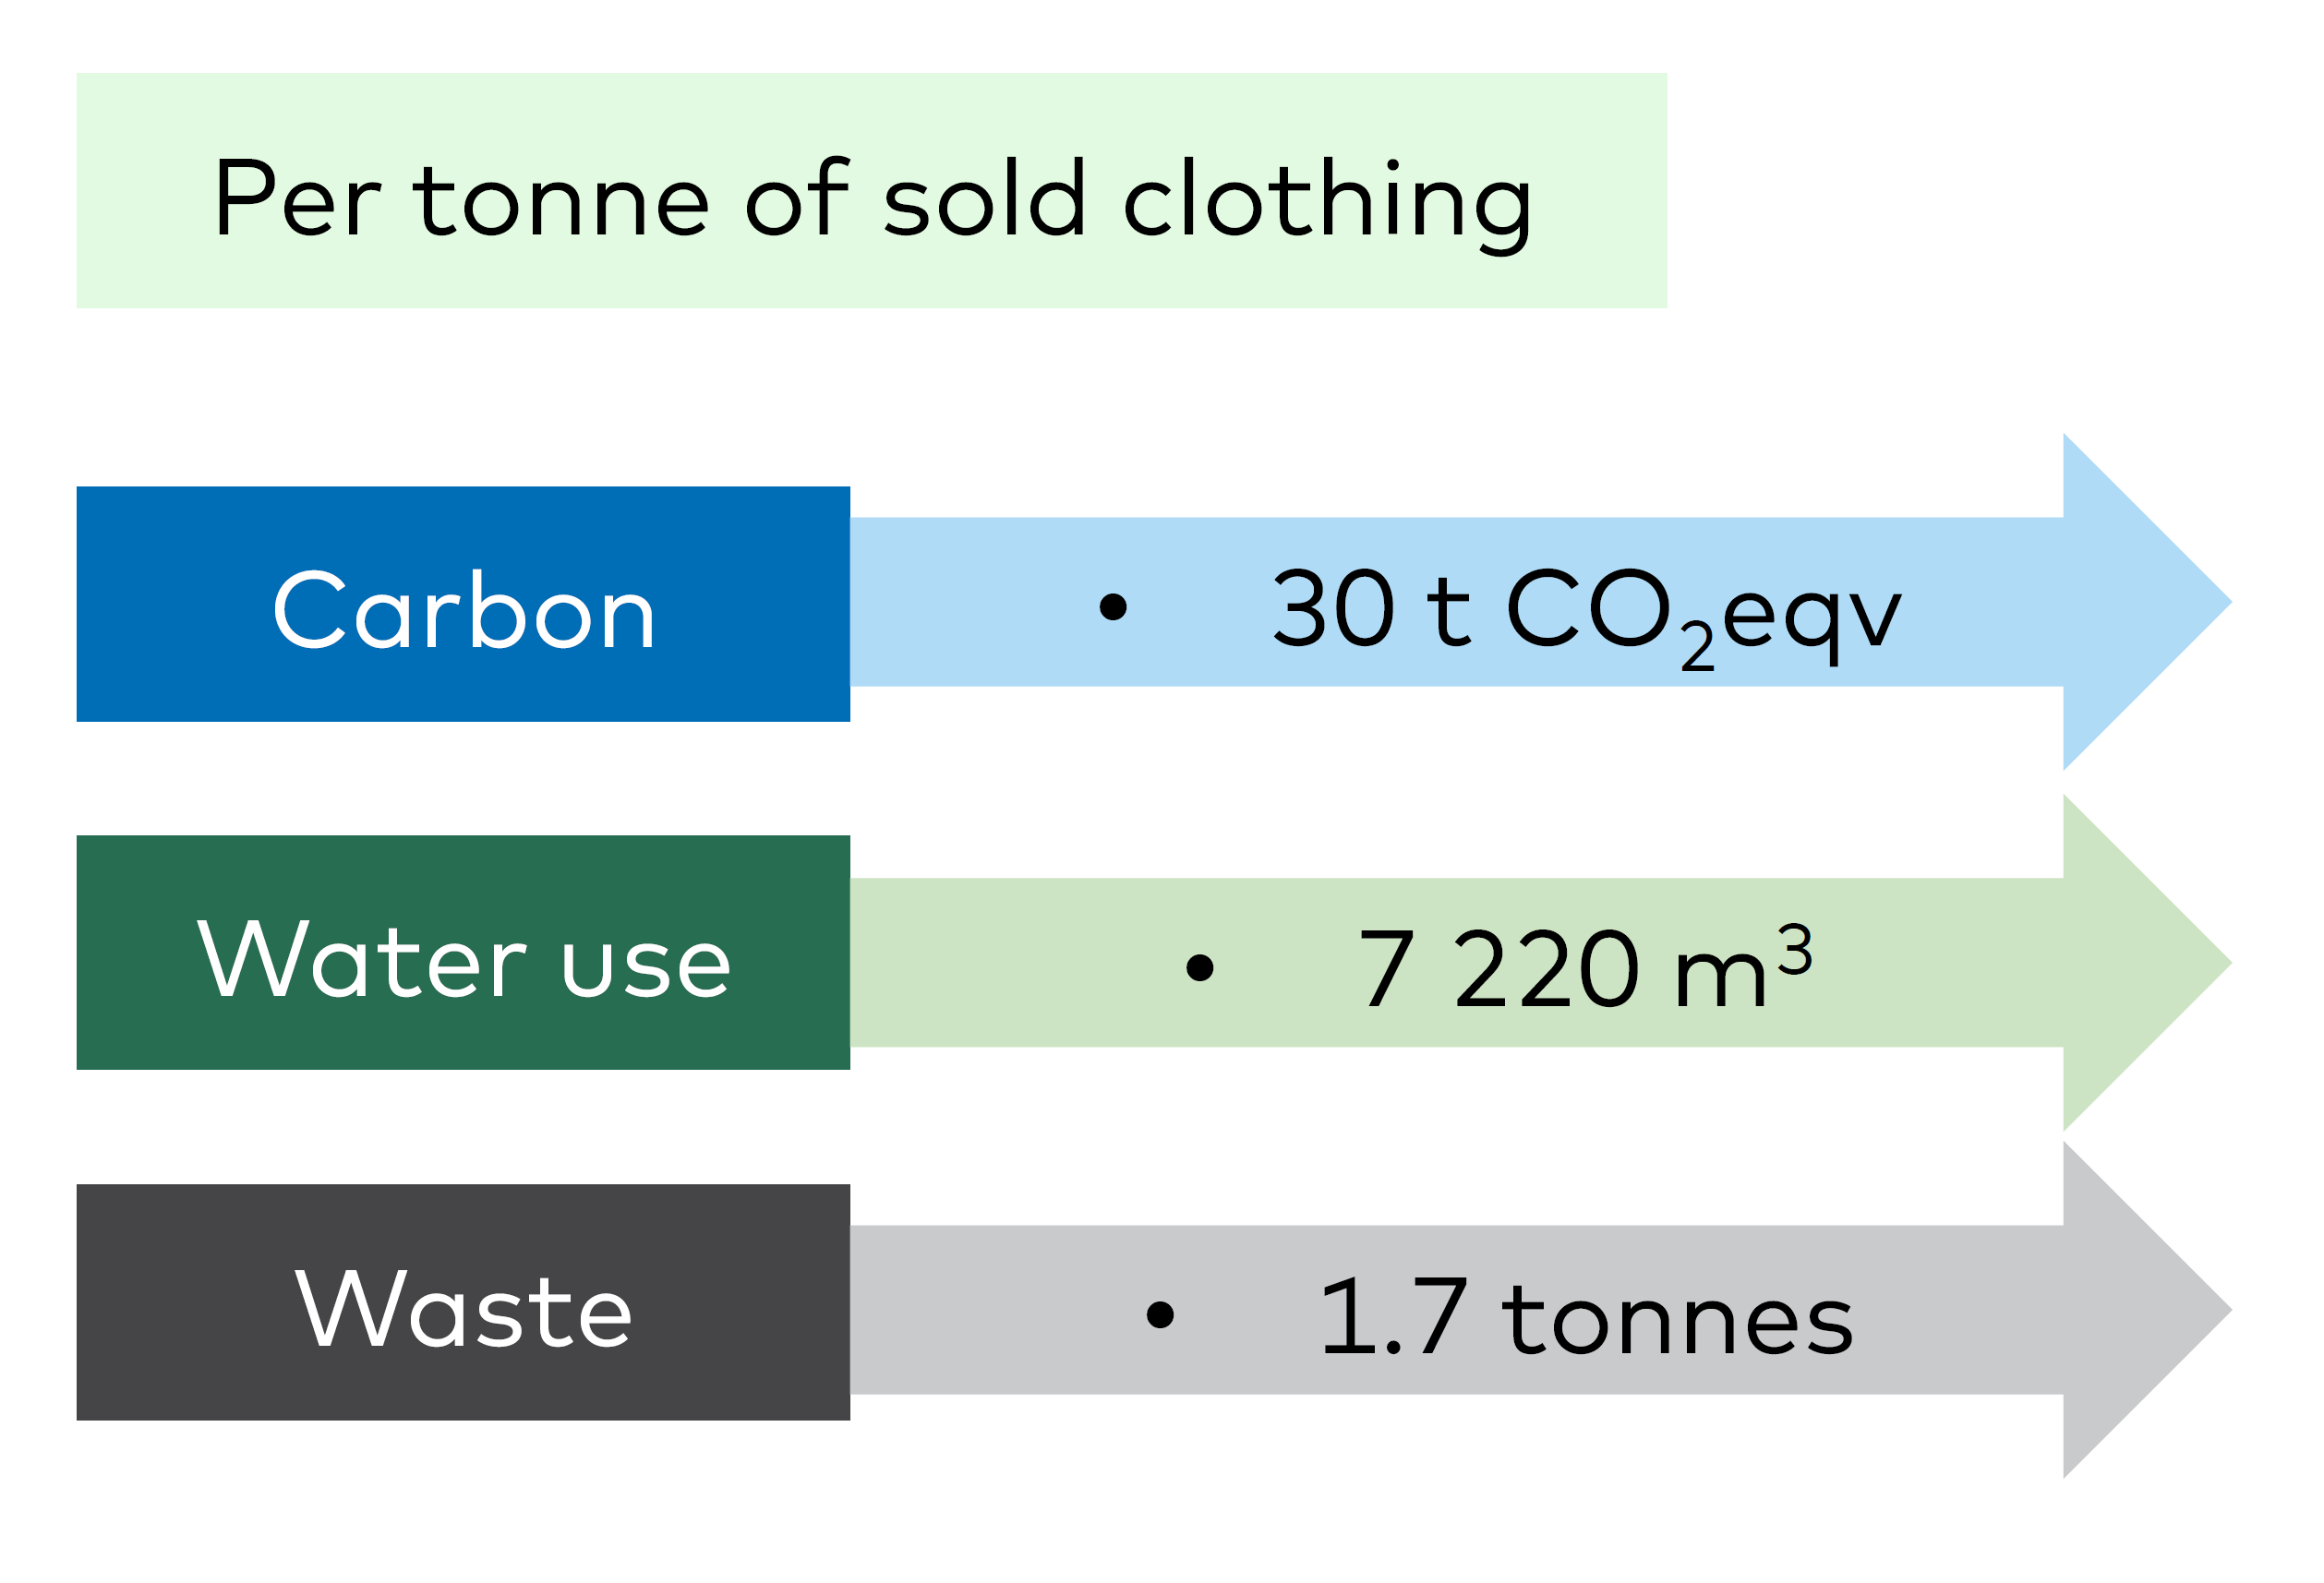
Figure 13: Carbon, water and waste footprint of clothing consumed in the EU (2015)
Source: Based on European Parliament, 2019
The textile production stages involve several actors. The largest negative external environmental effects can be seen among the fibre producers, textile manufactures, garment manufactures, as well as during the consumption use phase. During the agricultural production phase of textile fibres, large quantities of water is used. Combined with a global water scarcity it contributes negatively to earth’s natural resources. When fibre and garment production occur, large quantities of fibre are lost due to the shredding of natural fibres. Additionally, large quantities of fabric waste are being produced throughout the garment processes. Large negative environmental effects can also be seen across the consumption use phase. Mainly because large amounts of electricity are being used to wash and dry garment. Another aspect to consider in this stage is the electricity mix
Energy consumed across various fuels to produce electricity.
The textile sector includes several complex drivers and feedback loops, which includes many actors and various behaviors. By identifying the most effective solutions along the value chain, it may be possible to increase the circular economy in the sector, thus creating a systemic change.
Level of detail in the data
A data search was conducted for Finland, Sweden, and Norway in terms of finding data related to textile fibres, textile yarn and clothes made of polyester. This proved difficult, which is why the working group decided to make use of the Standard International Trade Classification (SITC) system, an international recognised classification of goods and services covering imports and exports (United Nations Statistics Division, 2006). The SITC classification provides data on general goods such as textile fibres, textile yarn, clothes, and shoes. However, it was not possible to find specific data on polyester. As the Nordic countries have limited national production of clothes and textiles (Naturvårdsverket, 2023a), it was decided that it is not relevant to include production data in this study. Instead, it was decided to focus the study on import data on volumes of textile fibres, textile yarn, clothing and footwear were collected for all three Nordic countries in this study.
For Norway, SITC data were collected from Statistics Norway into level 2. For Sweden, SITC data were collected from Statistics Sweden into level 2. For Finland SITC data were collected from the Finnish customs, into level 3. The closest relationship between clothes made from polyester and the import data found, is therefore data related to Finland and the sub-category of women’s apparel.
4.2 Scope and data collection – The construction sector
The case of the effect of a tax on products made of cement within the construction sector was chosen as an example of a largely used material in a growth sector that faces increasing pressure to find less polluting and more sustainable alternatives.
To produce concrete, binders such as cement are needed to be used as glue, in combination with water, sand and gravel. Commonly, cement is used as a binder in concrete. However, when producing cement clinkers, there are also alternative binders such as clay, limestone, and volcanic ashes. Cement clinkers accounts for about 90 percent of concrete’s total climate impact, why, using less clinker materials in concrete or replacing it with alternative, more sustainable materials, are two options to decrease the CO2 intensity of cement production (Svensk betong, 2021).
The built environment is expected to grow due to urbanisation of several countries when new homes, schools, hospitals, and infrastructure is needed. Hence, cement is a key input to concrete, cement production follows a similar trend.
4.2.1 Cement production and carbon dioxide emissions
Reaching the overall goals of the EU Green Deal, to become the world’s first climate-neutral continent by 2050, will require decarbonising the production of basic materials such as cement. The largest emissions trading system in the world, EU ETS, is a cornerstone of the EU policy to combat climate change. The EU’s Carbon Boarder Adjustment Mechanism (CBAM) regulation will enter into force as of October 2023. It will include carbon dioxide emissions (CO2) from intensive production of goods such as cement, iron, steel, aluminum, fertilizers, electricity, and hydrogen (EU Commission, 2023a).
In 2021, the annual carbon dioxide emissions from cement accounted to 1051 million tonnes (Friedlingstein, P et al, 2022). This corresponds to the global cement production that accounts for approximately 8 percent of all global CO2 emissions. On a global scale, it is the third largest industrial energy consumer. The global cement production accounted for 4270 Mt in 2021, where China is the largest consumer and producer, followed by India and the European Union (IEA, 2022a).
The annual carbon dioxide emissions from cement related to the years 2014, 2018 and 2021 in the Nordic countries in this study are shown in figure 14. The annual emissions peaked during 2018 across all three countries but have declined since the end of 2018.
As figure 14 shows, production of cement generates considerable emissions of carbon dioxide. Also, domestic cement production releases stored carbon dioxide from the limestone that is used as its raw material.
Figure 14: Annual carbon dioxide emissions from cement in Finland, Norway and Sweden (tonnes)
Source: Friedlingstein, P et al, 2022
A research study by Rootzén et al (2016) examined how the price increase in the cement industry affects prices throughout the cement supply chain. The results show that the expected price for emissions allowances for the cement industry under the EU ETS in the period until 2030 will not be enough to drive the required infrastructure and needed technological developments. According to the analysis the cost increases at multiple stages of the supply chain of cement. The result from this study indicates that complementary policy options are needed to influence the negative environmental impacts of cement.
Level of detail in the data
A data search was conducted for Finland, Sweden, and Norway in terms of finding data related to cement. It was decided to make use of the international classification of commodity codes (CN) of level 4, 6 and 8.
Production, import and export data on volumes of cement and cement clinkers were collected for all three Nordic countries included in the in-depth study.
4.3 Price elasticities of demand: Assessing the impact of a natural resource tax in the textile and construction sector
To be able to study the sensitivity or effect of a natural resource tax it is common to make use of the concept of price elasticities. According to economic theory, a negative elasticity of demand illustrates the Law of Demand, i.e. consumers tend to demand less quantity as the price increases of a specific good (Perloff, 2018). Price sensitivity of a certain good to which extent the consumer purchasing behaviour changes, is a complex area. It is determined by several factors such as the price of substitutes and complements, i.e., goods that can serve the same purpose or goods that add value when consumed together, the consumers income and future price expectations (Dwivedi, D N., 2016).
Price elasticity of demand measures how a change in the price of a good affects the quantity demanded of the good, meaning that a price elasticity gives the percentage change in quantity when the price is increased by one percent, holding everything else constant. Demand for a good is inelastic when the elasticity is less than one in absolute value, i.e. changes in price have a relatively small effect on quantity. The opposite applies when the elasticity is greater than one and the demand for a good is said to be elastic (Browning, Edgar K., 1992).
This analysis uses price elasticities to study how a natural resource tax in the textile- and construction sector would affect the demand, e.g. how a tax on imported polyester would change the demanded quantity of goods made of polyester.
The elasticity of demand varies along the demand curve. In this analysis, a general linear demand curve has been assumed, thus the higher the price, the more elastic the demand curve (larger negative number).
Price elasticity of demand can be written as:
Where \varepsilon is the price elasticity of demand, ΔQ equals the change in the demanded quantity Q and \frac{\Delta Q}{Q} is the percentage change in the quantity demanded. Δp is the change in price and \frac{\Delta p}{p} is the percentage change in price.
4.3.1 Calculating a natural resource tax
By using price elasticity of demand, it is possible to study how the quantity demanded, changes in response to a change in a natural resource tax. The tax is calculated using the following equation:
4.3.2 Price elasticities in the textile sector
To obtain price elasticities for the textile sector, a systematic literature review
The review included open access articles through google scholar as well as articles available through Science Direct covering price elasticities in the textile and construction sector, as well as specific price elasticities for different resources, materials and countries or regions.
Cross-price elasticities measure the effect of changes in the price of one good on the quantity demanded of another good.
The best option for the scope of this study was price elasticities for e-commerce specifically women’s cardigans and men’s footwear, as well as a price elasticity for clothes in e-commerce. The potential differences between price elasticities in physical stores and e-commerce are discussed in section 4.3.2.1. To closer capture the price elasticity of different types of materials a price elasticity for textile fibres is also included. The values and their corresponding standard errors used are presented in table 3. The elasticities in table 3 imply that a 1 percent price change decreases the demanded quantity by 1.5, 1.7, 1.62 or 1.27 percent, depending on which of the elasticities that is being interpreted.
Type of elasticity | Value | Standard error | Source |
Own-price, cardigans women e-commerce, mean effect | -1.5 | N/A | Heuer, Brettel and Kemper (2015) |
Own-price, sneakers men e-commerce, mean effect | -1.7 | N/A | Heuer, Brettel and Kemper (2015) |
Own-price e-commerce, mean | -1.62 | 0.02 | Heuer, Brettel and Kemper (2015) |
Price elasticity, textile fibres | -1.27 | 0.11 | Schier, Morland, Dieter and Weier (2021) |
Table 3: Elasticities used in the calculation of a tax, textile sector
Note: N/A is an acronym for not available
To get robust results, 95-percent confidence intervals are presented in Appendix A for those cases where standard errors were available. This means that there is 95 percent certainty that the tax level needed is included in these intervals. For the elasticity values which do not have standard errors available, a confidence interval of +/- 30 percent is calculated. These estimates exhibit more uncertainty than those with 95-percent confidence intervals.
4.3.2.1 Differences between price elasticities and its implication
Three out of the four elasticities included are calculated using e-commerce. Previous studies indicate that when applying absolute values, price elasticities are higher within retails in physical stores compared to e-commerce (Zhang & Demirkan 2021; Chu, Chintagunta & Cebollada, 2008). Zhang and Demirkan (2021) estimated that price elasticities for packaged goods, e.g., toothbrushes, differ between –1.74 on average in physical stores and –0.87 on average in e-commerce.
The data in this study includes e-commerce as well as physical stores, indicating that it is probable that the price elasticities used, are lower than the true price elasticity. This implies that the results are overvalued, i.e., the tax level needed to decrease the demanded quantity, is lower than the results indicate.
4.3.3 Price elasticities in the construction sector
Just as for the textile sector, a systematic literature review was conducted to obtain price elasticities for the construction sector. Finding country-specific elasticities for Finland, Norway and Sweden proved difficult. This study uses elasticities calculated using the Norwegian cement industry (Röller and Steen, 2005). It is plausible to assume that the three Nordic countries have relatively similar purchasing power and income structures. Thus, two price elasticities are included. One which account for short-run dynamics and one accounting for long run. The first considers that one or more factors of production is fixed in the short run, whereas the second one considers no factor of production is fixed in the long run. The elasticities are -0.46 and -1.47 respectively. This implies that a 1 percent change in the price of cement decreases the demanded quantity by 0.46 percent in the short run and 1.47 percent in the long run. A confidence interval of +/- 30 percent is presented in Appendix B.
Type of elasticity | Value | Standard error | Source |
Own-price elasticity in the short run, cement | -0.46 | N/A | Röller and Steen (2005) |
Own-price elasticity in the long run, cement | -1.47 | N/A | Röller and Steen (2005) |
Table 4: Elasticities used in the calculation of a tax, construction sector
Note: N/A is an acronym for not available
Stede et al. (2021) examined carbon leakage risks and incentives across the product value chain by conducting input-output modelling and analysis on carbon pricing of basic materials, including cement. The study assumed a demand elasticity of -0.5, which is close to the short run elasticity presented in Table 4.
4.3.4 Limitations and disclaimers
There are limitations to the chosen method and the available price elasticities and quantities. This report examines the potential impact of a natural resource tax on imported polyester but when calculating for the textile sector, both elasticities and quantities applies to final products, i.e., clothes or textile fibres. In this context, textile fibres have the closest relation to the raw material used but includes more than polyester.
The results for the construction sector are closer since price elasticities and quantities for cement is used. Due to confidentiality the total quantity of demanded cement in Norway does not include production of all types of cement, e.g., the production of Portland cement is excluded in the Norwegian case study.
Applying a 95-percentage confidence interval in those instances where standard errors are available indicates uncertainties in the calculated tax levels. See appendix A and B for results including a 95-percentage confidence interval. It is important to note that although a natural resource tax leads to a decrease in quantity demanded of the taxed material, it is uncertain if the demanded quantity is shifted towards other materials, which may or may not be more environmentally sustainable.
4.4 Impacts of an import tax in the textile sector
With an overall purpose to tax the use of natural resources, this sub-chapter examines the impact of a natural resource tax that is charged at the border as an import tax. The study is making use of SITC 2 level data related to import of textile fibres and articles of apparel and clothing accessories, as well as footwear (Finnish Customs Agency, 2022a; Statistics Sweden, 2022a; Statistics Norway, 2022b). All data is related to 2022.
For Finland, it was possible to collect data at the SITC 3 level within the textile sector. Considering that one of the chosen price elasticities applies to women’s cardigans in e-commerce data for women’s or girl’s clothes were therefore collected. This includes coats, capes, jackets, suits, trousers, shorts, shirts, dresses and skirts, underwear, nightwear, and similar articles of textile fabrics, not knitted or crocheted (Finnish Customs Agency, 2022a).
In the next sections, the results for Finland, Sweden and Norway are presented.
4.4.1 Finland
Table 5 presents the needed tax level to decrease quantity demanded by 500, 1 000 or 2 000 tonnes. In Finland, this corresponds to between 2 and 6 percent of all imported textile fibres. As for articles of apparel and footwear, it corresponds to a total quantity between 1 and 3 percent, and 4 and 14 percent respectively. For the item women’s or girl’s clothes not knitted, it corresponds to between 7 and 29 percent of the total quantity.
The results vary depending on which elasticity is used but are more dependent on the total quantity of the material, or item examined. For textile fibres, a tax of 1, 3 and 5 percent would decrease quantity demanded by 500, 1 000 and 2 000 tonnes respectively. For articles of apparel and clothing accessories the needed tax level is lower, approximately 1 to 2 percent. The needed tax level to decrease the quantity demanded of footwear is higher, 2 to 9 percent depending on which elasticity is used, and the desired decrease in quantity. These results highlight the difficulty in predicting the needed tax level to decrease quantities of textiles made of polyester, as the state of play involves behaviour changes of fibre producers, consumers, importers, and many other actors along the complex value-chain in the textile sector, as previously discussed in sub-chapter 4.1.1.
Table 5 also illustrates that a relatively high tax is needed to lower the demanded quantity of women’s or girl’s clothes. A 5, 10 or 19 percent tax is needed to decrease quantity demanded by 500, 1 000 or 2 000 tonnes. Table A4 in Appendix A illustrates the more extreme case of a decrease in the demanded quantity by 5 000 tonnes.
Table 5: Change in quantity demanded by 500, 1 000 and 2 000 tonnes, Finland
The table shows the tax level needed to decrease quantity demanded. Confidence-intervals is presented in Table A1-A3 in Appendix A.
Type of material or item | Decreased quantity | Used elasticity | |||
Cardigans women e-commerce | Sneakers men e-commerce | E-commerce | Textile fibres | ||
Textile fibres (other than combed wool) and their wastes | 500 tonnes | 1% | |||
1 000 tonnes | 3% | ||||
2 000 tonnes | 5% | ||||
Articles of apparel & clothing accessories | 500 tonnes | 1% | <1% | ||
1 000 tonnes | 1% | 1% | |||
2 000 tonnes | 2% | 2% | |||
Footwear | 500 tonnes | 2% | 2% | ||
1 000 tonnes | 4% | 4% | |||
2 000 tonnes | 8% | 9% | |||
Women’s or girl’s clothes, not knitted* | 500 tonnes | 5% | 4% | ||
1 000 tonnes | 10% | 9% | |||
2 000 tonnes | 19% | 18% | |||
* Includes coats, capes, jackets, suits, trousers, shorts, shirts, dresses and skirts, underwear, nightwear and similar articles of textile fabrics, not knitted or crocheted.
4.4.2 Sweden
Table 6 presents the tax level needed to decrease quantity demanded by 500, 1 000 or 2 000 tonnes in Sweden. This corresponds to 1, 2 and 4 percent of all imported textile fibres. Around 1 percent of articles of clothes and 1, 3, and 5 percent of footwear.
The needed tax levels are lower than those of Finland. Less than 1 percent, 1 or 3 percent to decrease quantity demanded by 500, 1 000 and 2 000 tonnes for textile fibres. Sweden has a relatively high total quantity of articles of apparel and clothing accessories, which means that a relatively low tax, approximately 1 percent, decreases quantity demanded.
Table A8 in appendix A shows, that to decrease quantity demanded by 5 000 tonnes, a tax of 2 percent is needed. As for footwear, a tax of between 1 and 3 percent decreases quantity demanded by 500, 1 000 and 2 000 tonnes. Table A8 in Appendix A also presents a decrease in the demanded quantity by 5 000 tonnes for each of the materials or items in Table 6.
Table 6: Change in quantity demanded by 500, 1 000 and 2 000 tonnes, Sweden
The table shows the tax level needed to decrease quantity demanded. Confidence-intervals is presented in Table A5-A7 in Appendix A.
Type of material or item | Decreased quantity | Used elasticity | |||
Cardigans women e-commerce | Sneakers men e-commerce | E-commerce | Textile fibres | ||
Textile fibres (other than combed wool) and their wastes | 500 tonnes | <1% | |||
1 000 tonnes | 1% | ||||
2 000 tonnes | 3% | ||||
Articles of apparel & clothing accessories | 500 tonnes | <1% | <1% | ||
1 000 tonnes | <1% | <1% | |||
2 000 tonnes | <1% | <1% | |||
Footwear | 500 tonnes | <1% | <1% | ||
1 000 tonnes | 2% | 2% | |||
2 000 tonnes | 3% | 3% | |||
4.4.3 Norway
Table 7 presents the tax level needed to decrease quantity demanded by 500, 1 000 or 2 000 tonnes. In Norway, this corresponds to 7, 14 or 27 percent of all imported textile fibres. As for articles of clothes, it corresponds to approximately 1 to 3 percent, and for footwear 3, 5 and 10 percent, respectively.
The needed tax level to decrease quantity demanded by 500, 1 000 and 2 000 tonnes for textile fibres is 5, 11 and 21 percent. As for articles of apparel and clothing accessories the needed tax level is between 0 and 2 percent, and for footwear 2, 3 and 6 percent.
Table 7: Change in quantity demanded by 500, 1 000 and 2 000 tonnes, Norway
The table shows the tax level needed to decrease quantity demanded. Confidence-intervals is presented in Table A9-A11 in Appendix A.
Type of material or item | Decreased quantity | Used elasticity | |||
Cardigans women e-commerce | Sneakers men e-commerce | E-commerce | Textile fibres | ||
Textile fibres (other than combed wool) and their wastes | 500 tonnes | 5% | |||
1 000 tonnes | 11% | ||||
2 000 tonnes | 21% | ||||
Articles of apparel & clothing accessories | 500 tonnes | <1% | <1% | ||
1 000 tonnes | <1% | <1% | |||
2 000 tonnes | 2% | 2% | |||
Footwear | 500 tonnes | 2% | 2% | ||
1 000 tonnes | 3% | 3% | |||
2 000 tonnes | 6% | 6% | |||
4.4.4 Change in quantity demanded by 10 percent
Table 8 presents the tax level needed to decrease quantity demanded by 10 percent. For Finland, this corresponds to approximately 3 100 tonnes of textile fibres, 6 400 tonnes of articles of apparel and 1 400 tonnes of footwear. For Sweden, it corresponds to approximately 5 600 tonnes of textile fibres, 19 000 tonnes of articles of apparel and 4 000 tonnes of footwear, and for Norway 700, 7 500 and 2 000 respectively.
The tax level needed to decrease the quantity in each country by 10 percent, is 8 percent for textile fibres. For articles of apparel the tax level is 6 to 7 percent, and for footwear 6 percent.
Table 8: Change in quantity demanded by 10 percent
The table shows the tax level needed to decrease quantity demanded by 10 percent. Confidence-intervals is presented in Table A13 in Appendix A.
Type of material or item | Used elasticity | |||
Cardigans women e-commerce | Sneakers men e-commerce | E-commerce | Textile fibres | |
Textile fibres (other than combed wool) and their wastes | 8% | |||
Articles of apparel & clothing accessories | 7% | 6% | ||
Footwear | 6% | 6% | ||
4.4.5 Environmental impact of polyester in women’s clothes
As previously discussed in sub-section 4.1.1, the textile and fashion industry’s impact on the earth’s resources is extensive and occurs throughout a long and complex supply chain. To illustrate this on an overall level, and to show how a tax on polyester might affect carbon dioxide emissions in the textile sector, the environmental impact of polyester in a variety of women’s clothes is presented in Table 9. The purpose of this section is to provide an insight to the amount of carbon equivalents, as well as the complexity of the textile sector. This is a simplified analysis, which only takes certain textiles into consideration based on fibre type. Obviously other types of fibre than polyester such as cotton, silk or wool also has related carbon emissions, but they are left out of the scope in this study.
The estimates are based on a Mistra Future Fashion report where Sandin et al. (2019) use life cycle assessment (LCA) and a Swedish case study to evaluate the environmental impact of different garments. They conclude that a dress weighing 478 grams, made of 100 percent polyester has an environmental impact of approximately 14.5 kilograms CO2 equivalents in the production of the dress
Includes the different steps needed when producing the dress as well as transports in production.
Based on this, the environmental impact of a variety of women’s apparel is presented in Table 9. A pair of women’s pants weighing 298 grams and containing 83 percent polyester has an impact of approximately 7.5 kg CO2 equivalents. A summer dress weighing 176 grams and consisting of 100 percent polyester has an impact of approximately 5.3 CO2 equivalents. The smallest impact (excluding those items which did not contain polyester) is found from the garment containing the lowest amount of polyester. A cardigan weighing 231 grams and containing 23 percent polyester, which has an impact of 1.6 kg CO2 equivalents.
In conclusion, clothes containing high amounts of polyester have a relatively high impact. This result indicates that imposing a natural resource tax on textile goods that are imported and made from polyester, can in theory have a positive impact on the circular transition.
Type of women’s apparel | Weight (in gram) These weights (in gram) are assumptions made for the various types of women’s apparel. | Amount of polyester (%) The amount of polyester in each type of apparel is made of assumptions, and obviously does not represent all. | Impact of polyester, kg CO2 equivalents |
Jeans | 320 | 32% | 3.1 |
Blouse | 124 | 100% | 3.8 |
Dress, summer | 176 | 100% | 5.3 |
Cardigan, summer | 231 | 23% | 1.6 |
Cardigan, winter | 293 | 0% | 0 |
Skirt, summer | 136 | 0% | 0 |
Blazer | 446 | 25% | 3.4 |
Shirt | 212 | 0% | 0 |
Trousers | 298 | 83% | 7.5 |
Camisole | 96 | 100% | 2.9 |
Table 9: The environmental impact of polyester in women’s clothes
Note: This table presents the environmental impact of polyester in a variety of women’s clothes. The impact from other materials in clothes are excluded.
4.4.6 The benefits of integrating circular economy models and life cycle analysis for policy analysis
Policy analysis based upon life-cycle perspective and general equilibrium, are not widely addressed in research literature to date. A research study by Hennlock et al. (2021) developed an integrated circular economy model with life cycle analysis (LCA). The aim of the research was to identify and analyse if policy combinations related to set goals, or socially efficient solutions that involve a transition from linear to circular flows, could efficiently be used to boost the transition to a circular economy. As the market for a specific product is interconnected via flows of materials, production, energy, waste treatment and consumption, a policy instrument targeting a specific actor is likely to affect behaviours of other actors along the value chain. Also, external effects come into play. All these effects can be both positive and negative.
LCA models compile the environmental impacts of a specific product and are supported by data from a larger number of actors on these markets, along the value chain. The LCA models also contain an assessment of a product’s energy- and resource allocation and its related climate emissions.
The study by Hennlock et al. (2021) found that an interdisciplinary strategy that combines a circular economy model with LCA, could efficiently be used to identify the environmental impact, that each actor causes along the value chain. The authors suggests that in order to achieve a reduced environmental impact and close the loop, it is necessary to use a combinations of policy instruments which in turn requires to have knowledge of:
- What type of environmental impact category you want to reduce
- Identify the actors in the value chain that contributes the most to this impact
- Identify which of the flows within these life-cycle phases that produces this impact
- Identify how these flows are affected by policy instruments
Obviously, the Nordic countries cannot influence the production processes in other countries, in terms of imposing economic instruments for example in the textile sector in other countries. Even though the Nordic countries cannot influence the outcome of implementing taxes and/or subsides at the raw material stage in specific countries, it is possible to advance policy instruments further along the value-chain, by moving from the material processing and sorting stage, towards production and textile imports.
The research results by Hennlock et al. (2021) show that it is possible for the Nordic countries to let the textile importer of a specific good bear the environmental charges, fees or taxes corresponding to the external effects caused by the design and production. As well as levy a consumption tax, that corresponds to the external effects caused by consumption. These economic variables often refer as differentiated upstream taxes on foreign production.
A consumption tax on textile products can be levied by the importer when the consumer buys the goods, if it is incorporated with the good, thus they are not already levied from other taxes on e.g. electricity consumption for washing clothes. Additionally, a subsidy for reuse or recycling is needed when the textile product is returned by the consumer. This can be paid with a fee that is charged by the textile importer at the time of the purchase, i.e., via a deposit system.
By measuring the external effects from these actors, this recommended combination of economic instruments may provide full internalization
Internationalization means taking the negative external effects into account, such as environmental degradation. Include external costs of environmental pollution in the total cost of the product.
4.5 Impacts of a natural resource tax in the construction sector
With an overall aim to reduce national consumption of cement, this study examines the effect of imposing a natural resource tax in the construction sector. For this purpose, production, import and export data related to concrete and cement, including clinkers, at level CN4, CN6 and CN8 within the construction sector were collected for all three countries (Finnish Customs Agency, 2022b; Statistics Finland, 2023b; Statistics Sweden, 2023c; Statistics Sweden, 2023d; Statistics Norway, 2023b; Statistics Norway, 2023c). However, as mentioned in section 4.4.3 price elasticities could only be found for cement. Therefore, the raw material tax in this section is focused on cement. More specifically products included in the CN4 level code for cement including cement clinkers, whether or not coloured was included in the analysis. This also includes e.g. Portland cement. All data is related to year 2021. As for Norway, some production data are excluded from the total quantity due to confidentiality.
In the next sections, the results for Finland, Sweden and Norway are presented.
4.5.1 Finland
Table 10 shows the needed tax level to decrease quantity demanded of cement by 50 000 or 100 000 tonnes in both the short- and long run. This corresponds to approximately 2 and 4 percent of total quantity.
To decrease quantity demanded by 50 000 tonnes in the long run an approximately 1 percent tax is needed. To instead decrease quantity by 100 000 tonnes a 3 percent tax is needed. In the short run a higher tax is needed. A 5 percent tax decreases quantity demanded with 50 000 tonnes in the short run, whereas a decrease of 100 000 tonnes requires a 9 percent tax.
In Table B3 and B4 in Appendix B, the tax levels needed to decrease quantity demanded by 200 000 tonnes and 500 000 tonnes are also presented.
Table 10: Change in quantity demanded by 50 000 and 100 000 tonnes, Finland
The table shows the tax level needed to decrease quantity demanded. Confidence-intervals of +/- 30 percent is presented in Table B1-B2 in Appendix B.
Type of material or item | Decreased quantity | Used elasticity | |
Own-price elasticity cement, short run | Own-price elasticity cement, long run | ||
Cement, including cement clinkers, whether or not coloured | 50 000 tonnes | 5% | 1% |
100 000 tonnes | 9% | 3% | |
4.5.2 Sweden
Table 11 shows the needed tax level to decrease quantity demanded of cement by 50 000 or 100 000 tonnes, which corresponds to approximately 1.5 and 3 percent of demanded quantity in Sweden. In the short run, a tax level of 3 or 7 percent would decrease quantity demanded by 50 000 and 100 000 tonnes respectively. In the long run, a lower tax level is needed, 1 to 2 percent.
Table B7 and B8 in Appendix B presents the tax levels needed to decrease quantity demanded by 200 000 tonnes and 500 000 tonnes.
Table 11: Change in quantity demanded by 50 000 and 100 000 tonnes, Sweden
The table shows the tax level needed to decrease quantity demanded. Confidence-intervals of +/- 30 percent is presented in Table B5-B6 in Appendix B.
Type of material or item | Decreased quantity | Used elasticity | |
Own-price elasticity cement, short run | Own-price elasticity cement, long run | ||
Cement, including cement clinkers, whether or not coloured | 50 000 tonnes | 3% | 1% |
100 000 tonnes | 7% | 2% | |
4.5.3 Norway
Table 12 shows the needed tax level to decrease quantity demanded of cement by 50 000 or 100 000 tonnes, which corresponds to approximately 4 and 8 percent of demanded quantity in Norway. In the short run, a tax level of 8 and 17 percent would decrease quantity by 50 000 and 100 000 tonnes. In the long run, a lower tax level is needed, 3 and 5 percent.
Table B11 in Appendix B presents the tax levels needed to decrease quantity demanded by 200 000 tonnes.
Table 12: Change in quantity demanded by 50 000 and 100 000 tonnes, Norway
The table shows the tax level needed to decrease quantity demanded. Confidence-intervals of +/- 30 percent is presented in Table B9-B10 in Appendix B.
Type of material or item | Decreased quantity | Used elasticity | |
Own-price elasticity cement, short run | Own-price elasticity cement, long run | ||
Cement, including cement clinkers, whether or not coloured *Some production data is excluded from the total quantity due to confidentiality, e.g., Portland cement. | 50 000 tonnes | 8% | 3% |
100 000 tonnes | 17% | 5% | |
4.5.4 Change in quantity demanded by 10 percent
Table 13 presents the tax level needed to decrease the demanded quantity of cement by 10 percent. For Finland, this corresponds to approximately 243 00 tonnes, for Sweden 325 000 tonnes and for Norway 131 000 tonnes.
To decrease the demanded quantity in the short run, a tax level of 22 percent is needed. A lower tax level, 7 percent, is needed in order to decrease demand in the long run.
Table 13: Change in quantity demanded by 10 percent
The table shows the tax level needed to decrease quantity demanded by 10 percent. Confidence-intervals of +/- 30 percent is presented in Table B12 in Appendix B.
Type of material or item | Used elasticity | |
Own-price elasticity cement, short run | Own-price elasticity cement, long run | |
Cement, including cement clinkers, whether or not coloured | 22% | 7% |
4.6 Key findings
As for the textile sector the results indicate that, although there are cases where a relatively low tax would decrease the demanded quantity, the decrease would be percentage-wise small compared to the total quantity. Instead, a rather high import tax is needed to achieve any substantial decrease in the quantity of textiles made of polyester. Combined with the fact that a systemic transformation is needed across several actors, along a complex value-chain this makes a hard case to crack. In a perfect world implementing an import tax on textile products made of polyester could decrease the quantity demanded of textile fibres. by 2 000 tonnes. In Finland a tax level of 5 percent is needed. For Sweden, the results for the same item indicate a tax level of 3 percent, and for Norway, the needed tax level is 21 percent.
The results from the construction sector, in terms of measuring the effect of implementing a natural resource tax on cement, show that to decrease the quantity demanded by 100 000 tonnes in the short run, a tax level of 9 percent is needed in Finland. In Sweden a tax level of 7 percent is needed, and in Norway, it is 17 percent. In the long run, all countries’ results indicate lower tax levels. In conclusion, to decrease quantity demanded of cement in the short run, a relatively high natural resource tax is needed, and in the longer run a lower tax level is needed.
Even though the results reveal that a raw material tax leads to a decrease in the quantity of used virgin raw material, it is not certain that it will create a shift towards more sustainable substitutes. Likewise, the study of the effects of imposing a tax on one material might have complex effects that are not foreseen by the calculations.
Studying the price sensitivity of a certain good and its anticipated effects on consumer behaviour is a complex area, as it is determined by numerous circumstances such as reference price, ease of comparison and price unfairness. The textile related data in this study include both physical stores and e-commerce, which most likely sheds light to the fact that the price elasticities used, are lower than the true price elasticity. This implies that the tax level needed to decrease demand quantities are lower than the presented results indicate. Presently, there is much ongoing research, but more research is needed in terms of Nordic price elasticities across different parts of the value-chains across the textile- and construction sectors.
This analysis shows that there are no simple solutions when creating incentives for circularity in complex and global value chains. Previous studies on the subject of economic instruments in a circular economy and value-chains (see e.g., Hennlock et al. 2021), indicate that a combination of policy instruments is needed to achieve behavioural change. The intricacy of the textile sector suggests that a combination of economic instruments along the value chain are needed for transforming the entire textile sector to a circular economy.
Similarly, the value chain in the construction sector involves many actors with different roles, such as investors, clients, consultants, and sub-contractors. Incentivising a behavioural change across all these actors by introducing a natural resource tax on certain construction materials and promoting sustainable sourcing practices, is complex.
To conclude, finding an effective combination of economic and other policy instruments is key, when the public sector aspires to incentivise the markets for sustainable textiles and sustainable construction materials. Previous studies on the subject of transforming the supply chain for the construction sector towards sustainability such as Sepponen et al. (2022), Karlsson et al. (2020) and Rootzén et al. (2016) indicate that a variety of policies and strategies are needed to transform the sector. The outcome of this study points to the same direction.