4. Results from chemical analysis of PACs in scrubber water
4.1 PACs detected in the scrubber water
Scrubber water was collected by crew members aboard two vessels equipped with open-loop scrubber systems (denoted vessel 1 and vessel 2). The water samples were collected at a location on the ship where the chemical composition was identical to that of the scrubber water discharged into the sea. Great care was taken to avoid any loss of compounds prior to the analysis. The samples were collected in acetone-washed glass containers to avoid adsorption of hydrophobic compounds to the container walls. The containers were sealed and kept dark and cool to avoid any photooxidation or evaporation of compounds.
The scrubber water samples were subsequently filtrated to separate particles from the water. The PACs from the water were extracted with pentane overnight through liquid-liquid extraction and the PACs from the particles on the filters were extracted with dichloromethane through pressurised liquid extraction on an ASE200 system. The extracts were analysed with gas chromatography – mass spectrometry (GC-MS) for quantification of selected parent and alkylated PACs, and with GC×GC-MS before and after derivatisation for a more extensive non-targeted screening of PACs and quantification of some of these PACs. The non-targeted screening is an explorative analysis with the aim to identify which compounds are in the sample. However, as the samples contain thousands of compounds, the compounds with the highest concentration are usually selected for identification. Therefore, not all compounds present in the sample are identified. In addition, a search for suspected compounds can be made to verify if they are present or not. For this type of analysis, only few standards are run for potential quantification of selected compounds. It is, therefore, not all detected compounds that can be quantified as the standards for these were not included in the analysis. Derivatization, in the context of GC, is the conversion of an analyte to a different form prior to analysis, typically to improve the volatility, stability, chromatographic properties, and separation of more polar compounds (Lin et al. 2008). Using derivatisation therefore improves the sensitivity and lowers the detection limit of polar compounds in GC. Here, silylation derivatization is used with the intention to derivatize and characterise polar hydroxy and carboxylic acids within the samples, e.g., naphthol and naphthoic acid.
PACs detected and quantified in the analysis of the scrubber water collected in the present study were, parent and alkylated PAHs (Table 1 and 2, Fig. 4), an S-heterocyclic PAC (dibenzothiophene), alkylated S-heterocyclic PACs (alkylated forms of dibenzothiophene and benzothiophene), parent and alkylated N-heterocyclic PACs (carbazole and alkylated carbazoles), and two O-heterocyclic PACs (dibenzofuran and 2-methyldibenzofuran) (Table 3, Fig. 4 and 5A). A summary of the total concentration of each of these groups is presented in Table 4.
In addition, the following oxy-PAHs were detected: 9,10-anthracenedione (synonym: anthraquinone), naphthaldehyde (synonyms; 1-formylnaphthalene; 1-naphthalene carboxaldehyde), phenalene-1-one (synonyms: phenalenone, 1H-benzonaphthene-1-one), 9-hydroxyfluorene (synonym: fluorenol), and naphthol (synonyms: naphthalen-1-ol, hydroxynaphthalene) (Fig. 6). Anthraquinone was, however, only included in the analysis of the scrubber water from vessel 2.
Data on parent PAHs in the scrubber water from the present study, along with data from the literature compiled within the EU project EMERGE (Ytreberg et al. 2022b), are presented in Table 1. The parent PAHs quantified in the scrubber water from the present study included the 16 US EPA PAHs plus perylene and benzo[e]pyrene. Compiled data for scrubber waters in Ytreberg et al. (2022b) did not include alkylated PAHs.
In the scrubber water analysed in the present study, the total concentration of parent PAHs was 68.1 µg/L for vessel 1 and 18.0 µg/L for vessel 2. Naphthalene was the dominating congener, accounting for 40 – 45% of the concentration. The second highest concentration was found for phenanthrene (31 – 36%) followed by fluorene (7 – 11%) (Table 1). The total concentration of the 16 US EPA PAHs in scrubber water based on literature data from 49 – 64 ships was considerably lower than what was detected in the present study, namely 2.97± 0.06 µg/L (Ytreberg et al. 2022b). Still, the relative distribution of the three most abundant PAHs was the same with the highest concentration detected for naphthalene (45%), followed by phenanthrene (24%) and fluorene (8%).
The total concentration of alkylated PAHs amounted to 770 µg/L in scrubber water from vessel 1, and to 73 µg/L in water from vessel 2. Alkylated PAHs quantified in the present study included C1-C4 naphthalenes, C1-C3 fluorenes, C1-C4 phenanthrenes/anthracenes, C1-C2 fluoranthenes/pyrenes, and C1-C3 chrysenes (Table 2). The relative concentrations of alkylated PAHs were similar to that of the parent compounds, with C1-C4 naphthalenes amounting to 39 – 69% of the total concentration of alkylated PAHs, followed by C1-C4 phenanthrenes/anthracenes (16 – 35%), and C1-C3 fluorenes (11 – 13%). The alkylated PAHs made up in total 80 – 92% of the parent + alkylated PAHs (Table 4). Similar ratios, 74 – 85%, were found in another study of scrubber water from three vessels (Du et al. 2022).
Three homologue series of heterocyclic PACs were detected in the scrubber water, parent and alkylated forms of the S-heterocyclic dibenzothiophene, alkylated benzothiophene (no parent benzothiophene was detected), and parent and alkylated forms of N-heterocyclic carbazole (Table 3). For dibenzothiophene the alkylated analogues made up almost 90% of the sum of parent and alkylated analogues, 1.57 µg/L, and 13.14 µg/L, respectively. For the parent and alkylated carbazoles, concentrations of all alkylated groups were higher than that of the parent compound (Fig. 5).
The sum of all parent and alkylated PACs that were quantified are summarised in Table 4.
As mentioned above, five oxy-PAHs were detected by the non-target screening (Fig. 6). Of these, only naphthaldehyde was quantified reaching a concentration of 47.4 µg/L and 10.7 µg/L for vessel 1 and vessel 2, respectively.
Oxy- and nitro-PAHs are formed during combustion and several of them occur in higher concentrations than unsubstituted PAHs in the combustion gases (Zhao et al. 2020). The non-target screening of the scrubber water did not reveal any nitro-PAHs. The reason for this is not clear, but it has been shown that the scrubber is not efficient in capturing particles in the size category PM2.5 (Yang et al. 2021), and it is possible that the nitro-PAHs, since they are mainly formed during combustion, bind hard to particles that are emitted to air.
Scrubber water literature data X ± 95% CI (µg/L; n= no of samples) | Scrubber water, vessel 1, present study (µg/L; n=1) | Scrubber water, vessel 2, present study (µg/L; n=1) | |
Naphthalene | 2.76 ± 0.75 (n=55) | 27.3 | 8.03 |
Acenaphthylene | 0.13 ± 0.07 (n=63) | 0.96 | 0.50 |
Acenaphthene | 0.19 ± 0.07 (n=63) | 2.72 | 0.35 |
Fluorene | 0.46 ± 0.10 (n=63) | 7.51 | 1.27 |
Phenanthrene | 1.51 ± 0.30 (n=64) | 24.7 | 5.53 |
Anthracene | 0.08 ± 0.05 (n=63) | 0.62 | ND |
Fluoranthene | 0.16 ± 0.05 (n=63) | 0.61 | 0.24 |
Pyrene | 0.32 ± 0.12 (n=63) | 1.73 | 0.94 |
Benzo[a]anthracene | 0.13 ± 0.06 (n=64) | 0.29 | 0.10 |
Chrysene | 0.19 ± 0.07 (n=63) | 1.01 | 0.63 |
Benzo[b]fluoranthene | 0.04 ± 0.02 (n=63) | 0.13 | 0.05 |
Benzo[k]fluoranthene | 0.01 ± 0.01 (n=49) | 0.03 | ND |
Benzo[a]pyrene | 0.05 ± 0.02 (n=64) | 0.08 | 0.02 |
Dibenzo[a,h]pyrene | 0.03 ± 0.02 (n=63) | 0.02 | ND |
Benzo[g,h,i]perylene | 0.02 ± 0.01 (n=63) | 0.11 | 0.15 |
Indeno [1,2,3-c,d]pyrene | 0.07 ± 0.06 (n=63) | 0.01 | ND |
Benzo[e]pyrene | Not analysed | 0.19 | 0.16 |
Perylene | Not analysed | 0.06 | 0.03 |
SUM PAH | 2.97± 0.79 (n=35)* | 68.1 | 18.0 |
* only 16 US EPA PAHs
Table 1 Unsubstituted PAHs in scrubber water from open-loop scrubber systems. Data derive from Ytreberg et al. (2022b), and from scrubber water from two separate vessels analysed within the current project. Concentrations are presented as µg/L. ND= Not detected.
Scrubber water, vessel 1 (µg/L) | Scrubber water, vessel 2 (µg/L) | |
Naphthalene | 27.3 | 8.03 |
C1-naphthalenes | 160 | 11.0 |
C2-naphthalenes | 154 | 8.96 |
C3-naphthalenes | 121 | 5.22 |
C4-naphthalenes | 99.0 | 3.58 |
Sum alkylated naphthalenes | 534 | 28.8 |
Fluorene | 7.51 | 1.27 |
C1-fluorenes | 24.4 | 2.32 |
C2-fluorenes | 38.3 | 2.98 |
C3-fluorenes | 34.1 | 2.65 |
Sum alkylated fluorenes | 96.8 | 7.95 |
Phenanthrene + anthracene | 25.3 | 5.53* |
C1-phenanthrenes/anthracenes | 50.4 | 7.93 |
C2-phenanthrenes/anthracenes | 46.4 | 8.19 |
C3-phenanthrenes/anthracenes | 20.5 | 6.98 |
C4-phenanthrenes/anthracenes | 5.20 | 2.63 |
Sum alkylated phenanthrenes/anthracenes | 122 | 25.7 |
Fluoranthene + pyrene | 2.33 | 1.18 |
C1-fluoranthenes/pyrenes | 4.21 | 2.77 |
C2-fluoranthenes/pyrenes | 4.06 | 4.13 |
Sum alkylated fluoranthenes/pyrenes | 8.23 | 6.90 |
Chrysene | 1.01 | 0.63 |
C1-chrysenes | 2.78 | 1.47 |
C2-chrysenes | 4.08 | 1.54 |
C3-chrysenes | 1.89 | 0.71 |
Sum alkylated chrysenes | 8.75 | 3.72 |
SUM ALKYLATED PAH | 770 | 73.1 |
* anthracene below the detection limit for vessel 2
Table 2 Alkylated PAHs in scrubber water from open-loop scrubber systems. The analyses were carried out on water from two separate vessels within the current project.
Scrubber water, Vessel 1 (µg/L) | Scrubber water, Vessel 2 (µg/L) | |
Dibenzothiophene | 2.58 | 1.57 |
C1-dibenzothiophenes | 6.25 | 2.89 |
C2-dibenzothiophenes | 9.54 | 4.30 |
C3-dibenzothiophenes | 11.0 | 5.95 |
Sum alkylated dibenzothiophenes | 26.8 | 13.1 |
C1-benzothiophenes | 2.39 | 2.44 |
C2-benzothiophenes | 2.48 | 2.28 |
C3-benzothiophenes | 10.6 | 1.34 |
C4-benzothiophenes | 6.93 | 0.54 |
Sum alkylated benzothiophenes | 22.4 | 6.61 |
Carbazole | 0.12 | 0.10 |
C1-carbazoles | 2.89 | 2.34 |
C2-carbarzoles | 1.01 | 0.76 |
C3-carbazoles | 0.56 | 0.40 |
C4-carbazoles | 0.40 | 0.35 |
Sum alkylated carbazoles | 4.98 | 3.85 |
Dibenzofuran | 13.7 | 6.83 |
2-methyldibenzofuran | 9.04 | 2.88 |
Table 3 Sulphur and nitrogen heterocyclic PACs and their alkylated homologues in scrubber water from two separate vessels with open-loop scrubber systems. The analyses were carried out withing the current project.
Scrubber water, vessel 1 (µg/L) | Scrubber water, vessel 2 (µg/L) | |
∑Unsubstituted PAH | 68.1 | 18.0 |
∑Alkylated PAHs | 770 | 73.1 |
∑Unsubstituted + alkylated PAH | 838 | 91.1 |
∑Unsubstituted S-heterocyclic PAC | 2.58 | 1.57 |
∑Alkylated S-heterocyclic PAC | 49.1 | 19.7 |
∑Unsubstituted + alkylated S-heterocyclic PAC | 51.7 | 21.3 |
∑Unsubstituted N-heterocyclic PAC | 0.12 | 0.10 |
∑Alkylated N-heterocyclic PAC | 4.98 | 3.85 |
∑Unsubstituted + alkylated N-heterocyclic PAC | 5.10 | 3.95 |
∑Unsubstituted O-heterocyclic PAC | 13.7 | 6.83 |
∑Alkylated O-heterocyclic PAC | 9.04 | 2.88 |
∑Unsubstituted + alkylated O-heterocyclic PAC | 22.7 | 9.71 |
Table 4 Sum all PACs and alkylated PACs in scrubber water from two separate vessels with open-loop scrubber systems. The analyses were carried out within the current project (presented for individual congeners in Tables 1 – 3).
4.2 PAC fingerprint
The relative concentrations of individual PAC compounds, the PAC “fingerprint”, differ depending on whether the origin is petrogenic (oil, coal) or pyrogenic (combustion). These differences may be used in environmental forensics to identify sources of contamination (Yunker et al. 2002, Stout et al. 2015). Despite the fact that the scrubber water has been used to wash the gases of combusted HFO (pyrogenic origin), there are several characteristics in the PAC fingerprint more resembling a petrogenic than a pyrogenic profile. This might be caused by an incomplete combustion of the HFO and/or the presence of oil from other oil sources, e.g., lubrication oil, in the scrubber water (Teuchies et al. 2020).
Petrogenic PACs have been formed over geological times at relatively low temperatures whereas pyrogenic PACs derive from the incomplete combustion of organic matter at high temperatures for short periods of time. Two characteristics often used to separate petrogenic from pyrogenic PAC mixtures are i) the relative distribution between parent PACs and their alkylated forms, and ii) the relation between low molecular and high molecular PACs. In petrogenic mixtures, the relative concentrations of parent and alkylated forms of a PAC form a bell-shape with concentrations of PAHs with one and two carbon atoms in alkylated groups (C1 and C2-PACs), and sometimes also C3-PACs, being higher than concentrations of the unsubstituted parent PAH (Fig. 3) (Yunker et al. 2002, Stout et al. 2015). In mixtures of pyrogenic PACs, the high combustion temperatures have eliminated alkyl side chains so that there is a dominance of unsubstituted PACs (Fig.3).
PACs and alkylated PACs in scrubber water have the characteristics of petrogenic mixtures forming bell-shaped concentration patterns, with higher concentrations of alkylated than of parent compounds and have a predominance of low molecular weight PAHs (Figures 4A1, 4A2, and 4B; Table 1). Figure 4C shows the concentration of PAHs and alkylated PAHs in the HFO used by the vessel 1 and when comparing that to the pattern in scrubber water (Fig.4A and B) similarities can be observed. Concentrations of all C1 and C2-alkylated groups of compounds present in both scrubber water and HFO being higher than concentrations of the parent compounds. An indication of combustion is seen in the relative high concentration of acenaphthylene which is not commonly found in fuel (van Gelderen et al. 2021)
In scrubber water, parent and alkylated compounds of the S-heterocyclic PAC dibenzothiophene, the N-heterocyclic PAC carbazole, and the O-heterocyclic PAC dibenzofuran were detected at concentrations slightly lower but still at the same level as concentrations of phenanthrene, a PAC of similar molecular size (Tables 2 and 3). In addition, alkylated forms of the S-heterocyclic PAC benzothiophene were also detected at similar concentrations.
A summary of the composition of PACs typical for petrogenic and pyrogenic sources is presented in Table 5.
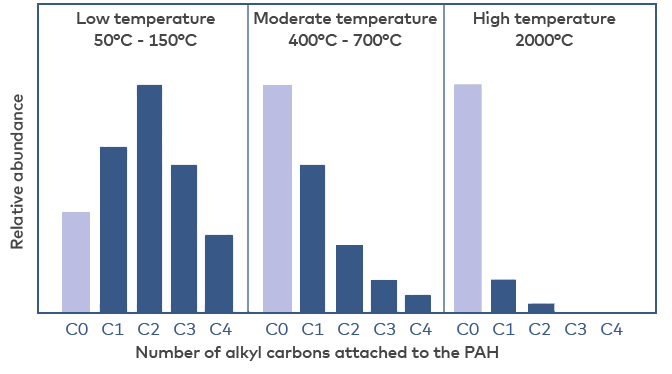
Figure 3 Schematic illustration of the relative abundance of alkyl carbons attached to PAHs formed at different temperatures. At low temperatures (petrogenic sources) the distribution is bell-shaped with a maximum concentration for C2 compounds. At moderate and high temperatures (pyrogenic sources), the highest concentration is found for the unsubstituted parent PAH. The figure is redrawn from Stout et al. 2015.
Petrogenic sources (e.g., non-combusted heavy fuel oil) | Pyrogenic sources (e.g., combusted heavy fuel oil) |
|
|
Table 5 Characteristics of PAC composition in a petrogenic versus a pyrogenic source (Kang et al. 2016, Zhao et al. 2020).
Figure 4 Concentrations of unsubstituted PAHs and dibenzothiophene, and their alkylated forms in scrubber water from two vessels with open-loop systems and in fuel oil. A1. Scrubber water 1 (from vessel 1); A2. Zoom of scrubber water 1; B. Scrubber water 2 (from vessel 2); C. HFO fuel used in vessel 2 at the time of the collection of the scrubber water. PAC concentrations in scrubber water are expressed as µg/L and concentrations in bunker oil as mg/L. Note the difference in scale of the y-axis.
Figure 5 Scrubber water concentration of the S-heterocyclic PACs benzothiophene (only alkylated compounds), and parent and alkylated dibenzothiophene, parent and alkylated congeners of the N-heterocyclic PAC carbazole, and the O-heterocyclic compounds dibenzofuran and 2-methyldibenzofuran. Note that the dibenzothiophenes are also included in Fig. 4. Data derive from analysis of two separate vessels (vessel 1 and vessel 2)
Figure 6 Compounds detected in scrubber water from the two vessels by non-target screening by GC×GC with derivatisation. Note that anthraquinone was detected but is not included in the figure as this was only analysed for vessel 2 without derivatisation.