2. The current situation in the Nordics
The EU Waste Framework Directive
European Commission. Waste Framework Directive web page. Available: https://environment.ec.europa.eu/topics/waste-and-recycling/waste-framework-directive_en
Generally, the Nordic countries follow the EU legislation and targets on CDW treatment, even though Norway and Iceland are not member countries of the European union. The countries therefore should follow the goal defined in the Waste Framework Directive of having 70 % of CDW recycled/material recovered by 2020. The degree of preparation for reuse, recovery or recycling of non-hazardous construction and demolition waste has in previous studies varied, and according to this study was approximately only 43 % for Sweden, 44 % for Norway and 55 % for Finland, which is far from the recycling and recovery targets defined in the waste directive. Iceland reports 82 % recovery rate, most of which is backfilled mixed mineral waste, and Denmark results show a material recovery rate of 92 %. The statistics are gathered from national open-source statistics and include some level of uncertainty.
In this study, the current situation in the Nordic countries was analysed further, beginning with an overview of the national laws and regulations in relation to treatment of CDW and how the amounts of treated CDW and the waste streams look like in each country. Secondly, the study covered the general treatment process for CDW in the Nordic countries, as well as included an overview and analysis of the CDW materials that are currently difficult to reuse, recycle or recover today.
2.1 Overview on waste legislation and CDW waste streams in the Nordics
As stated above, the Nordic countries follow EU legislation and targets on CDW treatment, although Norway and Iceland are not member countries of the European union. The countries follow the waste hierarchy defined in the Waste Framework Directive (2008/98/EC) by the European Union where it is stated that waste prevention should be the priority, preparation for reuse should be the second priority, recycling the third, other recovery the fourth, and the last step should be disposal. The waste hierarchy defined in the EU WFD is visualised in Figure 2.
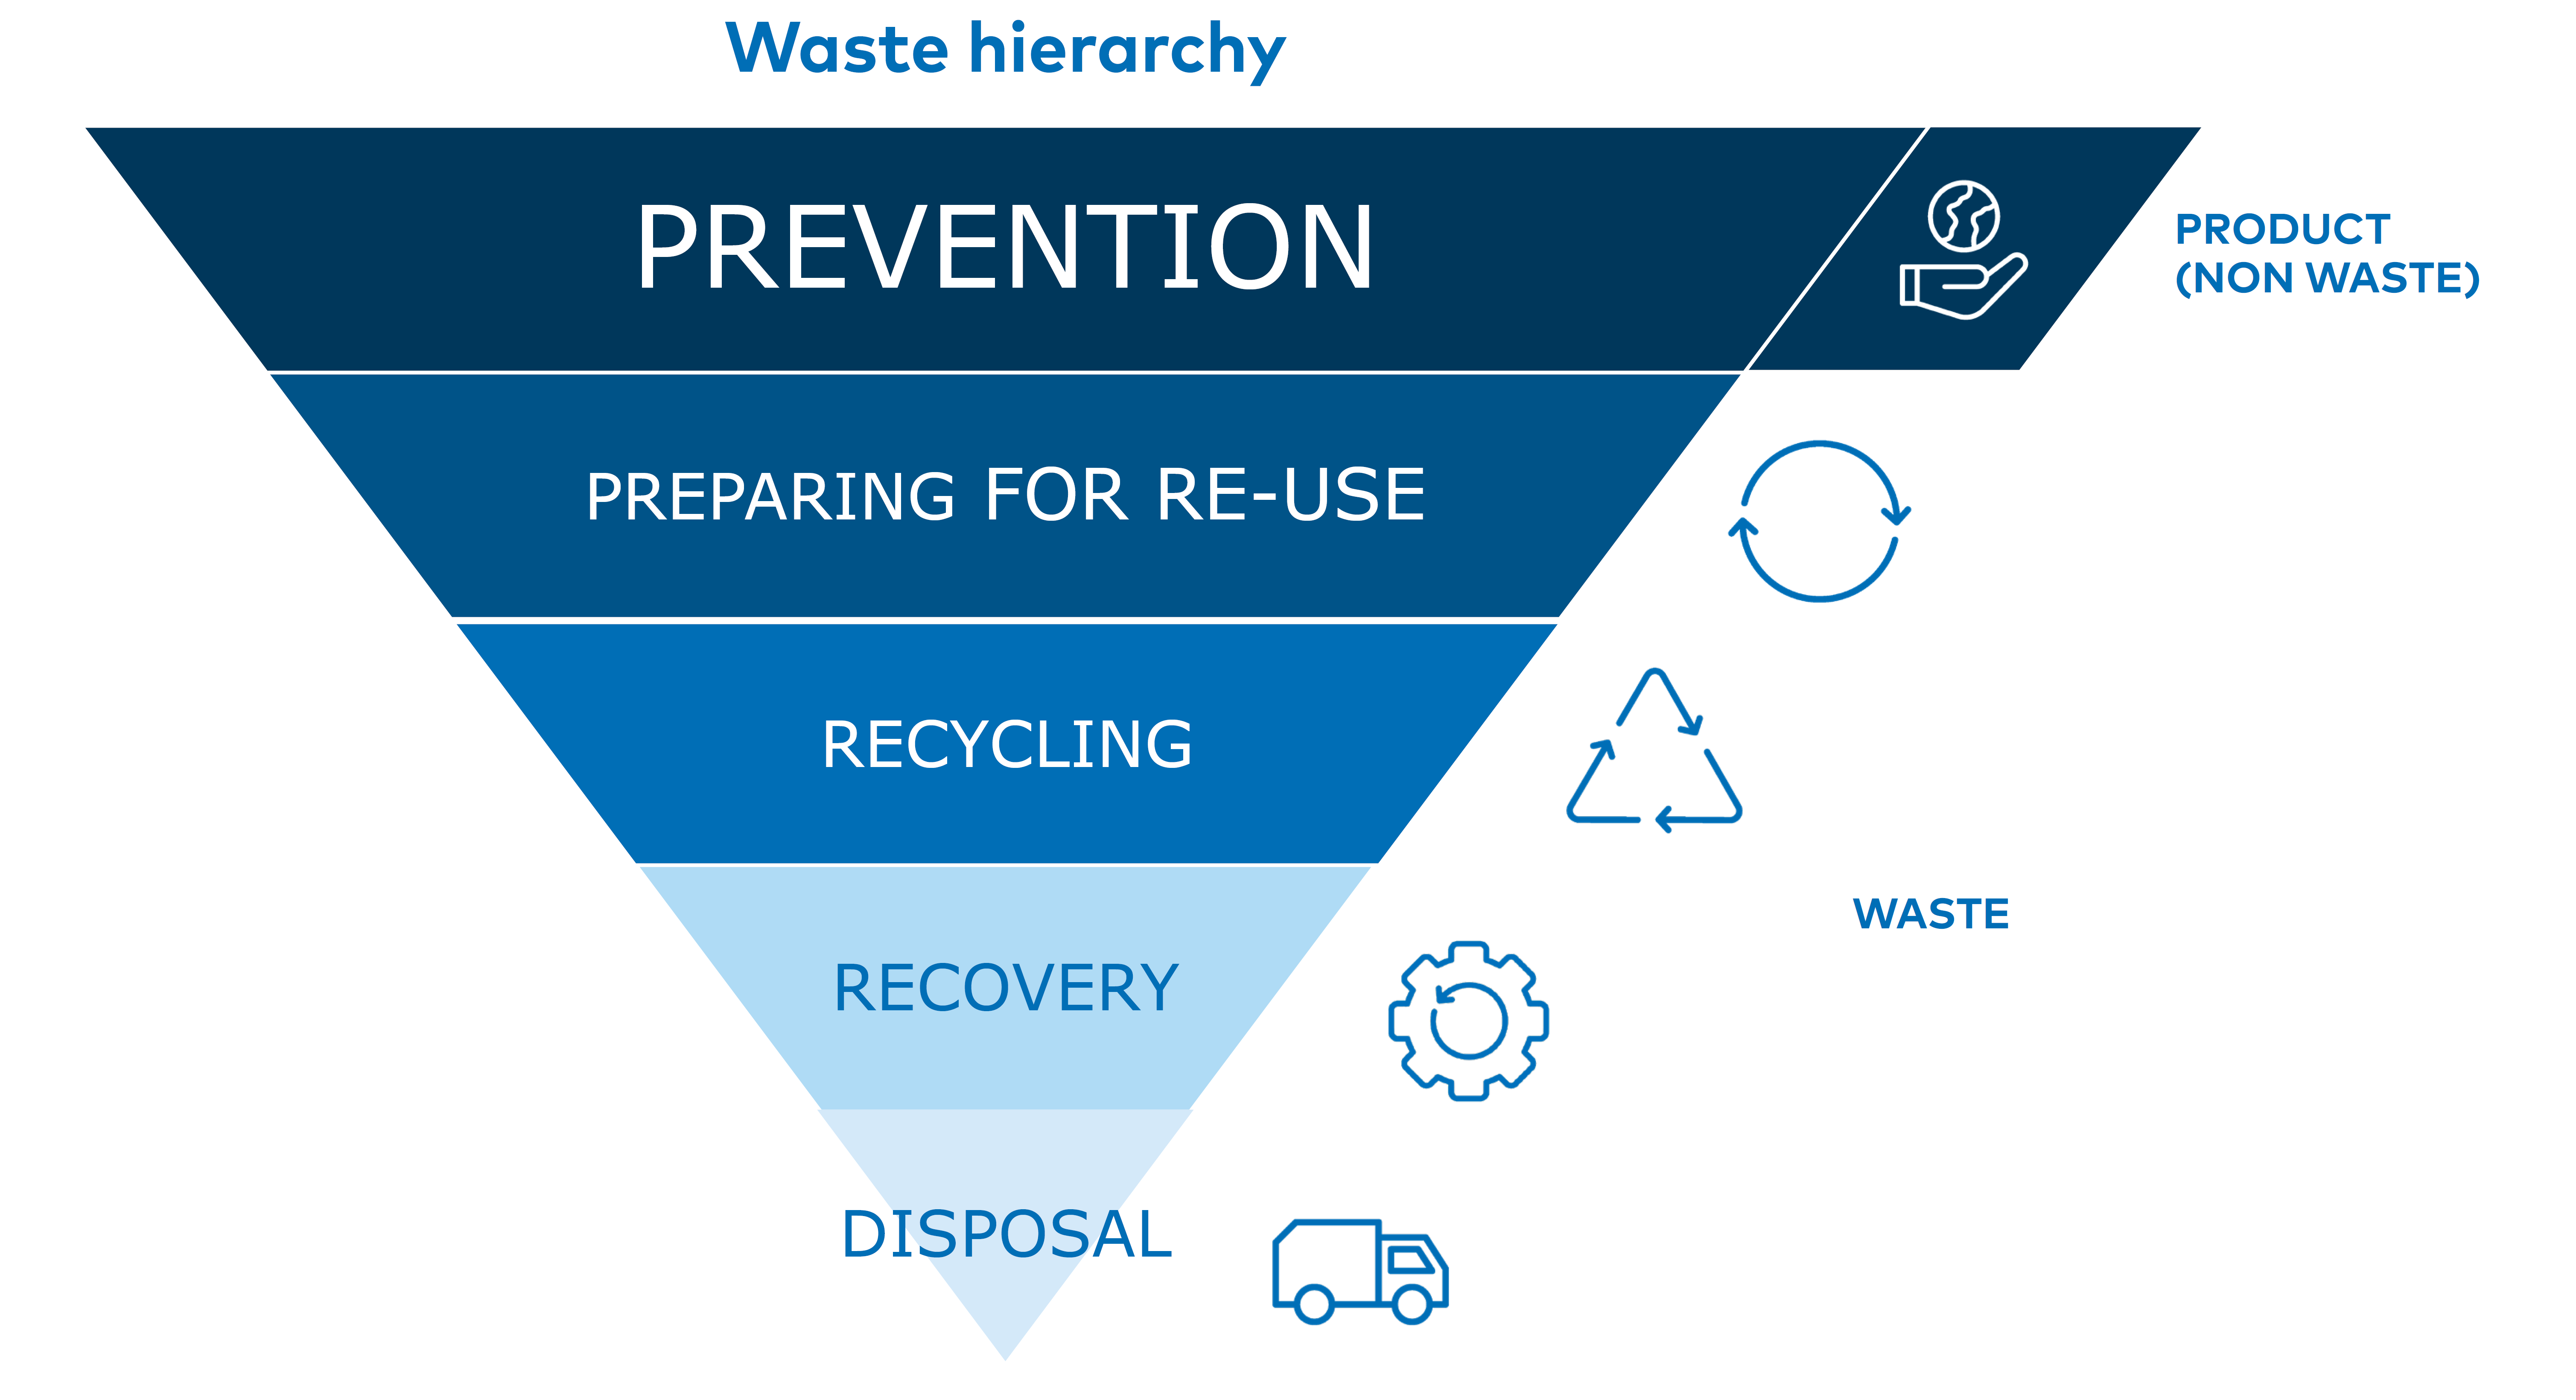
Figure 2: The Waste Hierarchy as described in the EU Waste Framework directive.
European Commission. Waste Framework Directive web page. Available: https://environment.ec.europa.eu/topics/waste-and-recycling/waste-framework-directive_en
EU legislations and targets act as a basis on how waste should be handled in the respective countries. Additional to the EU WFD, there are several EU directives and regulations that aim to drive the developments of the Circular Economy in the EU. The EU Green deal
European Commissions. The European Green Deal web page. Available: https://commission.europa.eu/strategy-and-policy/priorities-2019-2024/european-green-deal_en
European Commission. Circular Economy Action Plan web page. Available: https://environment.ec.europa.eu/strategy/circular-economy-action-plan_en
In addition of following those legislations, there are certain country-specific specialties applied in the national legislation concerning CDW with some countries having more extensive and detailed legislation than what the EU regulations entails. Figure 3 shows a comparison on how the legislative framework in the Nordic countries details the minimum sorting requirements of CDW. The comparison reveals that Denmark, Finland, and the Åland Islands have the most detailed sorting requirements for CDW as stipulated in their respective national waste frameworks, while legislation in the other countries only provides a more generalized level of specification. However, the waste legislation is accompanied by guidelines and building codes and other legislation and e.g., EPR schemes, and as a result, it does not describe all the fractions sorted in the countries. Therefore, the comparison below does not determine the actual differences in what is sorted and what is not. The requirements listed in the legislation is not necessary reflected in sorting routines on- or off-site, nor in waste data reporting on a national level.
Table 2: A comparison between the countries on legislative framework surrounding minimum sorting of CDW mentioned in the waste law. There are some differences in what fractions are required to sort out (e.g., asphalt, roofing felt), as well as differences in where the requirements are written. Many EPR schemes or sector guidelines require sorting, even if not mentioned in the waste legislation, and thus not included here.
Denmark | Greenland | The Faroe Islands | Finland and Åland | Iceland | Norway** | Sweden | |
WASTE FRACTION | |||||||
Wood* | x | x | x | x | |||
Treated (e.g., oil, paint) wood and untreated wood | x | ||||||
Mineral (concrete, bricks, tiles, ceramics and stones)* | x | x | x | x | x | ||
Concrete | x | x | |||||
Bricks | x | ||||||
Asphalt | x | x | |||||
Surplus soil and aggregates | x | x | x | ||||
Mineral wool insulation | x | x | |||||
Mixed mineral fraction (content may vary between countries) | x | ||||||
Metals* | x | x | x | x | x | x | |
Glass* | x | x | x | x | x | ||
Plastic* | x | x | x | x | |||
PVC | x | x | |||||
Gypsum/plaster* | x | x | x | x | |||
Hazardous waste* | x | x | x | x | x | x | |
Other separately collected waste fractions | |||||||
Bitumen (roofing felt) | x | ||||||
Paper and cardboard*** | x | x | |||||
Thermal windows*** | x | ||||||
Electronic waste*** | x |
*Separate collection is obligated in EU waste directive amendment (EU) 2018/851
**Legislation in Norway demands minimum 70 w% sorting of all CDW, the fractions (other than hazardous waste and concrete and bricks from demolition) are not mentioned in the legislation. The other fractions (metals, glass, wood, plastic and plaster) are mentioned in guidelines to the legislation.
***May be included in EPR schemes, and therefore not necessary listed separately in the waste legislation under CDW requirements
In Table 3 and Table 4, data for treated CDW per capita are showcased. Table 3 shows the amounts of treated CDW per capita according to each of the Nordic countries. The data is shown according to the main CDW categories, and the amounts are reported in kg waste per capita. This was done to put the amounts of treated CDW into context as the size of the countries differs, and therefore different volumes of CDW are treated in each of the countries. When looking at the table, Denmark reports significantly more volumes of treated CDW when compared to the other countries, especially the countries that have similar numbers of inhabitants. This can be due to several reasons, for example the detail of the data and reporting, and the other cultural differences, such as traditional building methods and materials and the norms in the industry. Short distances also can lead to that more material is transported as waste instead of e.g., direct backfilling or recycling of mineral materials on-site. Also, the statistics can vary a lot from year to year.
Better statistics that measure all the waste, will lead to higher number of kg waste per capita, whereas in some regions, e.g., in Iceland, the statistics are not as detailed as the other countries which might be the cause for lower amounts reported in the statistics. Difference in statistics among countries could also stem from variations in how the source data is generated, for instance, waste companies categorizing waste fractions differently in the respective regions. Differences in building stock can also explain the numbers for Denmark, where houses are largely made of bricks instead of wood, that weigh less than bricks. Also, the amount of asphalt waste reflected in the CDW statistics could explain the differences, since asphalt do not necessary get reported as CDW waste if recycled internally by the infrastructure company.
Table 3: The amounts of treated CDW total and per capita in 2020 according to the Nordic countries. The data is showed in 1000 t and in kg treated waste/capita.
Denmark Data on the amounts of CDW was received from The Danish Environmental Protection Agency, Miljøstyrelsen, for the year 2020. See section 2.1.1 for more information on the data source. | Greenland Data on the amounts of CDW was received from Sermersooq Municipality, Sermersooq Affaldscenter, Drift og miljø, for the year 2020. Other municipalities and waste facilities in Greenland did not respond to request for information or did not have knowledge on waste volumes. | Faroe Island Data on the amounts of CDW was received from the Faroese intermunicipal waste and recycling company, IRF, for the year 2020 and does not include data for Torshavn. The waste company in Torshavn did not respond to request for information for this study. | Finland Data on the amounts of CDW was mainly gathered from Statistics Finland, Tilastokeskus, and was complimented with additional data sources. See section 2.1.4 for more information on the additional data sources. | Åland Islands Data on the amounts of CDW was gathered from Statistics and Research Åland, ÅSUB, for the year 2020. See section 2.1.5 for more information on the data source. | Iceland Data on the amounts of CDW was received from The Icelandic Environment Agency, Umhverfisstofnun, for the year 2020. | Norway Data on the amounts of CDW was gathered from Statistics Norway, Statistisk sentralbyrå, for the year 2020. See section 2.1.7 for more information on the data source. | Sweden Data on the amounts of CDW was received from The Swedish Environmental Research Institute, IVL, for the year 2020. | |
CDW total (1000t) | 4600 | 4 | 0,5 | 1900 | 5 | 62 | 2100 | 4000 |
Population (2020) | 5.831.000 | 56.367 | 52.415 | 5.530.000 | 30.129 | 366.463 | 5.379.000 | 10.350.000 |
CDW Category | Data in kg waste per capita | |||||||
Wood | 26 | 18 | 8 | 49 | 8 | 26 | 50 | 90 |
Minerals | 533 | 17 | 2 | 230 | 140 | 74 | 235 | 280 |
Metals | 78 | 28 | 1 | 39 | 14 | N/A | 22 | 13 |
Glass | 5 | 6 | N/A | 10 | 0 | N/A | 2 | 1 |
Plastic | 1 | N/A | N/A | N/A | 0 | N/A | 2 | 0 |
Plaster | 14 | 8 | N/A | 14 | N/A | N/A | 15 | 9 |
Other CDW | 136 | N/A | N/A | 5 | - | 69 | 72 | - |
Total | 793 | 77 | 11 | 348 | 163 | 168 | 397 | 393 |
Table 4 shows the End-of-life treatment of the CDW per capita according to each of the Nordic countries along with the recycling and recovery rate. Again, the data is shown in kg waste per capita. The data shows that Denmark has the highest recycling and recovery rate of 92 %, while Sweden reports the lowest rate of 43 %. The data for Greenland and Faroe Islands is not considered to give the correct indication on the treatment of CDW due to the lack of publicly available data.
Table 4: The End-of-life treatment of the CDW in the Nordic countries according and the recycling & recovery rate. The amounts for the EOL-treatments are showcased in kg treated waste per capita.
Data in kg waste per capita | Denmark | Greenland | Faroe Island | Finland | Åland | Iceland | Norway | Sweden |
Recycling & Material recovery | 683 | 28 | 1 | 188 | 154 | 147 | 174 | 168 |
Energy recovery | 22 | 9 | 2 | 105 | 24 | 1 | 98 | 125 |
Disposal | 35 | 40 | 8 | 51 | 10 | 20 | 100 | 35 |
Other/unspecified | - | - | - | - | - | - | 25 | 61 |
Recycling & recovery rate (%) | 92% | 36% | 12% | 55% | 82% | 87% | 44% | 43% |
2.1.1 Denmark
The Danish legislation on management of CDW is based on the EU Waste Framework Directive and is embodied in several laws and decrees. Overall, the EU (European Union) waste hierarchy applies, which states that prevention must be preferred before material recycling, material recycling before incineration and incineration before landfilling.
The rules on the management of CDW in Denmark are put forth by the Ministry of Climate, Energy and Utilities and the Danish Environmental Protection Agency and can be found in the following laws and decrees: Environmental Protection Act; Miljøbeskyttelsesloven
Miljøbeskyttelsesloven. LBK nr 1218 af 25/11/2019. Available: https://www.retsinformation.dk/eli/lta/2019/1218
Affaldsbekendtgørelsen. BEK nr. 2512 af 10/12/2021. Available: https://www.retsinformation.dk/eli/lta/2021/2512
Affaldsaktørbekendtgørelsen. BEK nr 2097 af 14/12/2020. Available: https://www.retsinformation.dk/eli/lta/2020/2097
Deponeringsbekendtgørelsen. BEK nr 719 af 24/06/2011. Available: https://www.retsinformation.dk/eli/lta/2011/719
In accordance with the Statuary Order on Waste, Affaldsbekendtgørelsen (2021:2512), CDW must be sorted out at the place where it is generated in at least the following waste type categories:
- Hazardous Waste
- PCB-containing waste
- Thermal windows
- Natural stone
- Unglazed tile
- Concrete
- Mixtures of natural stone, unglazed bricks, and concrete
- Iron and Metal
- Plaster
- Stone wool (insulation)
- Soil
- Asphalt
- Mixtures of concrete and asphalt
In accordance with other sections of the Statuary Order on Waste, Affaldsbekendtgørelsen (2021:2512), waste producers are obligated to ensure that the following types of waste that are suitable for material recovery is prepared for re-use, recycled or used for other final material recovery:
- Glass
- Metal
- Plastic
- Paper
- Cardboard
- Food
- Garden/green
- Wood
- Textiles
- Food- and drink cartoons
- Reusable hazardous waste, like batteries and electronics
- Reusable PVC
Furthermore, the Statuary Order on Waste (2021;2512) contains the rules screening and mapping buildings and constructions for hazardous substances, rules for waste notification and rules for classification of waste.
The laws and decrees on the management on CDW are more extensive and stricter than the EU regulations state, which can be seen in the statuary order of waste (2021;2512) requiring sorting of CDW into more fractions than listed in the WFD.
Figure 4 shows the waste streams for the CDW treated in Denmark for the year 2020 where the CDW streams are visualised in a Sankey-diagram. The data reporting for treatment of CDW in Denmark is done at a detailed level and the data is publicly available. Denmark reports on several waste categories, as well as having information on sub-categories. The data also covers the treatment method of each of the waste material.
The diagram below shows that mineral waste accounts for the largest amounts of the total treated CDW. Furthermore, the majority of the CDW is recovered and goes into backfilling operations. The second largest treatment method for the CDW is recycling, but the type of recycling largely is unspecified. Only a small fraction is sent to energy recovery and landfill.
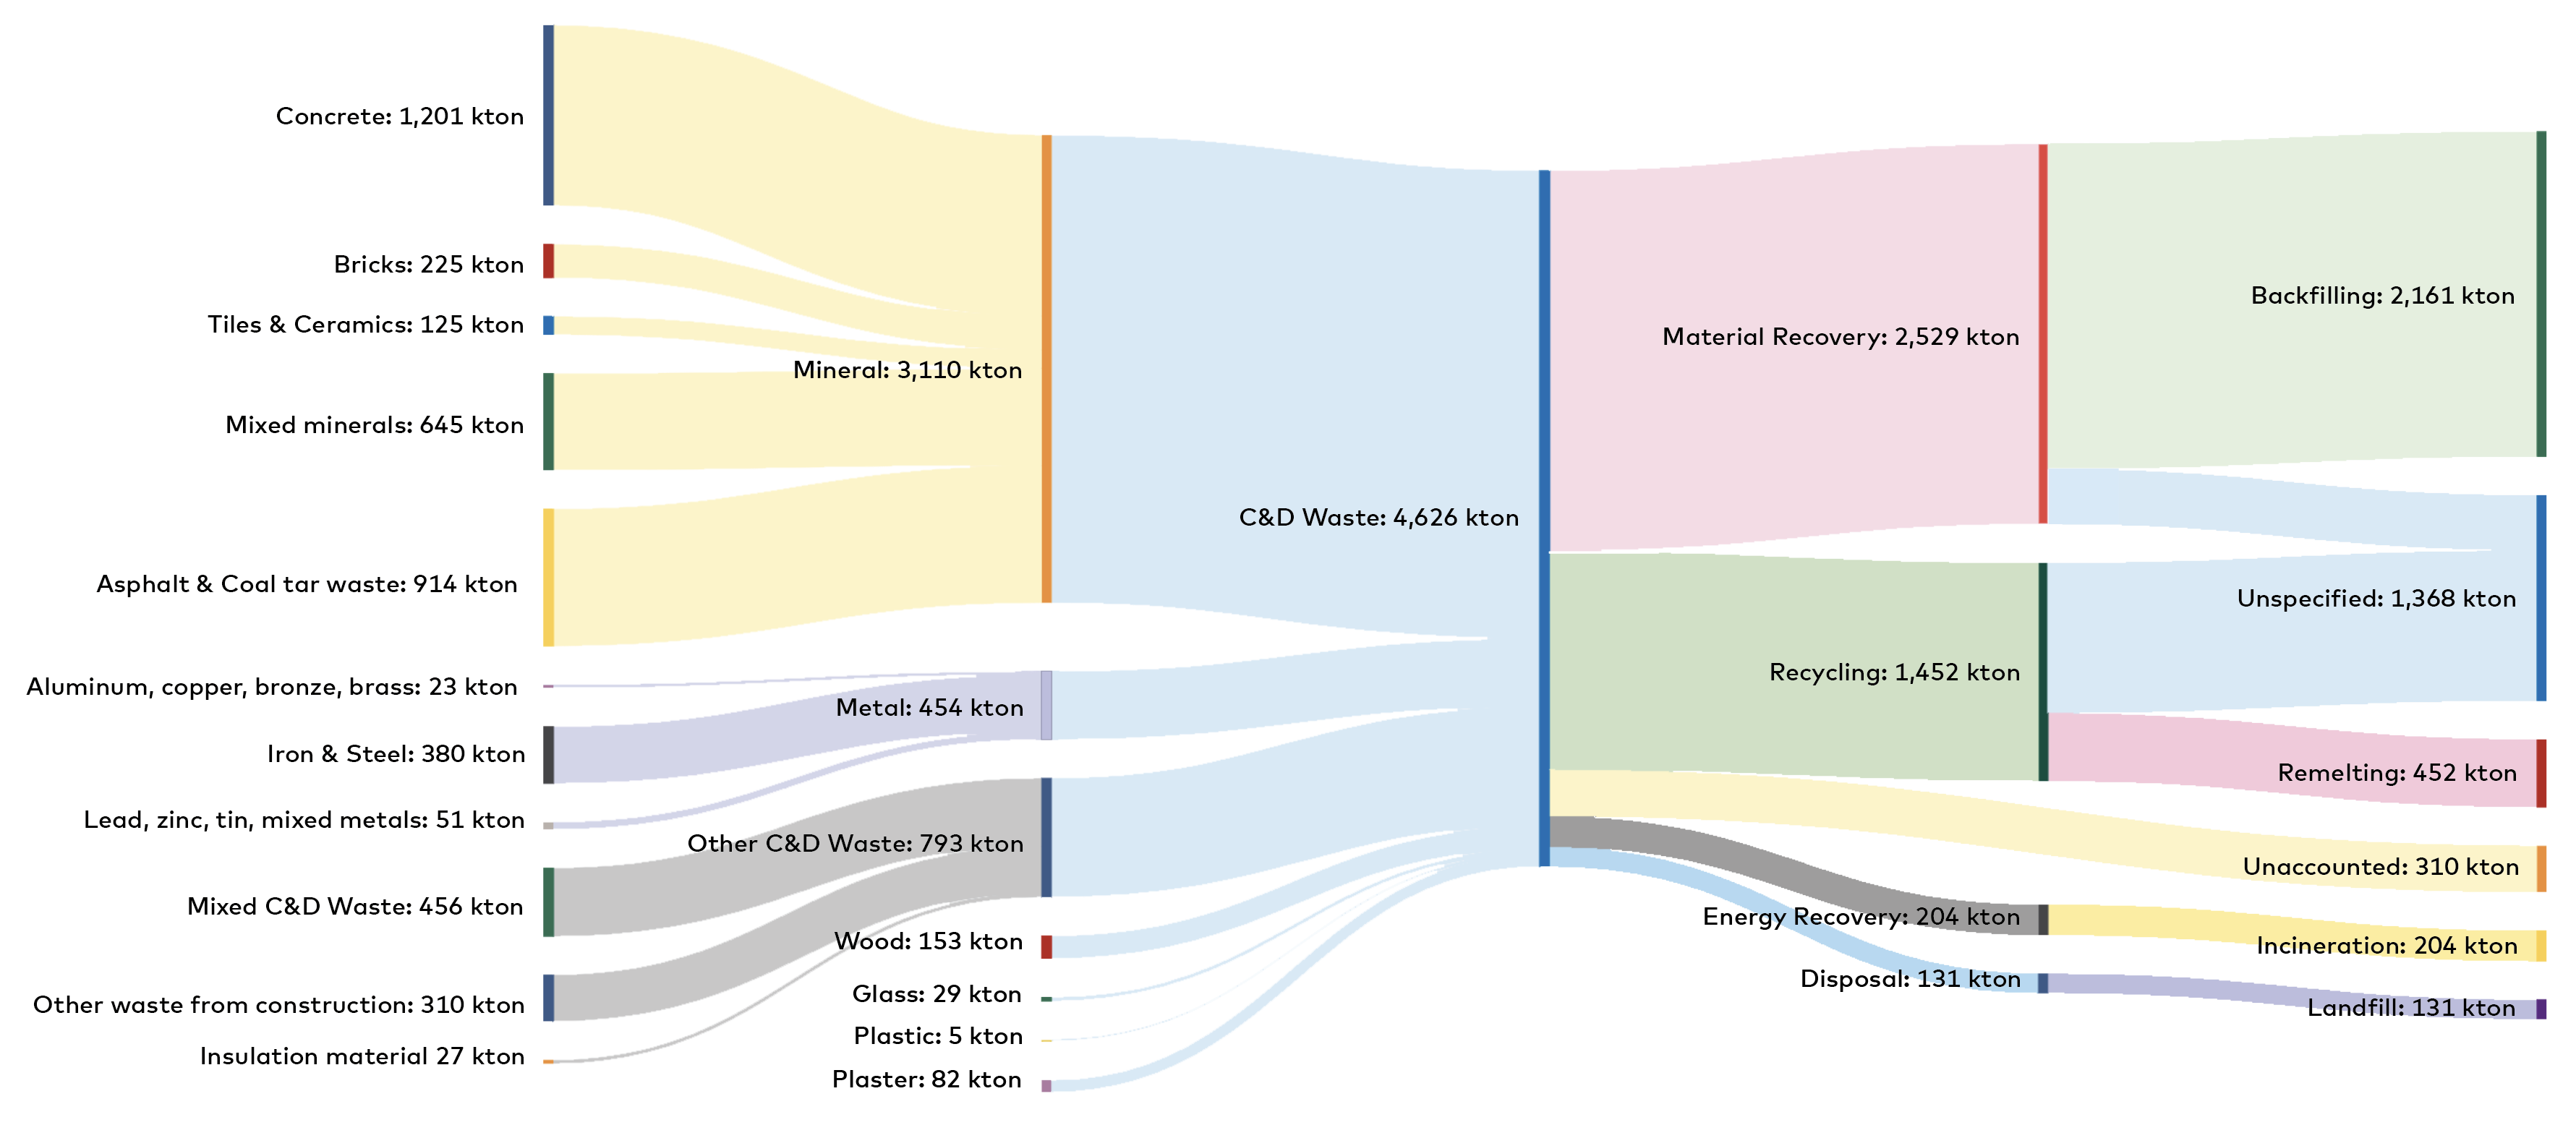
Figure 4: The material flows for CDW in Denmark for the year 2020. Data on the amounts of CDW was gathered from The Danish Environmental Protection Agency, Miljøstyrelsen, for the year 2020
Affaldsstatistik 2020, Miljøstyrelsen. Available: https://mst.dk/publikationer/2022/december/affaldsstatistik-2020
2.1.2 Greenland
The Greenlandic legislation on management of construction and demolition waste is based on an environmental protection law
Inatsisartutlov nr. 9 af 22. november 2011 om beskyttelse af miljøet. Available: https://www.fao.org/faolex/results/details/en/c/LEX-FAOC108561/
Selvstyrets bekendtgørelse nr. 3 af 7. januari 2021 om affald. Available: https://nalunaarutit.gl/Groenlandsk-lovgivning/2021/bkg-03-2021?sc_lang=da
Waste that is generated in connection with new construction, renovation and demolition must be reported to the local authorities (municipality) when the amount of construction waste exceeds 50 m3 per week. In addition, notification must be made when the total amount of waste exceeds 100 m3 for the entire construction period for the individual project, regardless of the weekly production of waste (according to waste regulations in the municipalities of Sermersooq
Affaldsregulativ 2021. For affaldsproducenter i Kommunequarfik Sermersooq. Available: https://sermersooq.gl/da/regulativer-lovgivning-og-pligter/
Regulativ for affald fra erhverv Kommune Kujalleq 2022.
Regulativ for affald fra erhverv Avannaata Kommunia 2019.
Waste that is handed over to the municipality's waste reception facilities must, as a minimum, be sorted into the following waste fractions:
- Landfill waste (asbestos, soft PVC, insulation, bricks, glazed bricks)
- Tires without rims
- Glass and bottles
- Iron and metal
- Soil
- Environmentally hazardous waste
- Waste suitable for combustion
Figure 5 shows the material flows for the CDW treated in Greenland in the year 2020. The data have been visualised in a Sankey-diagram. It is important to note that there was limited availability of data, and therefore the diagram may not give the complete picture of the total amounts of treated CDW in Greenland. The data is more aggregated and do not specify detailed information on e.g., different mineral fractions.
The diagram below shows that the largest fraction of the CDW is disposed of in landfills, while the second largest fraction goes to recycling. Furthermore, the largest waste fractions are metals and wood.
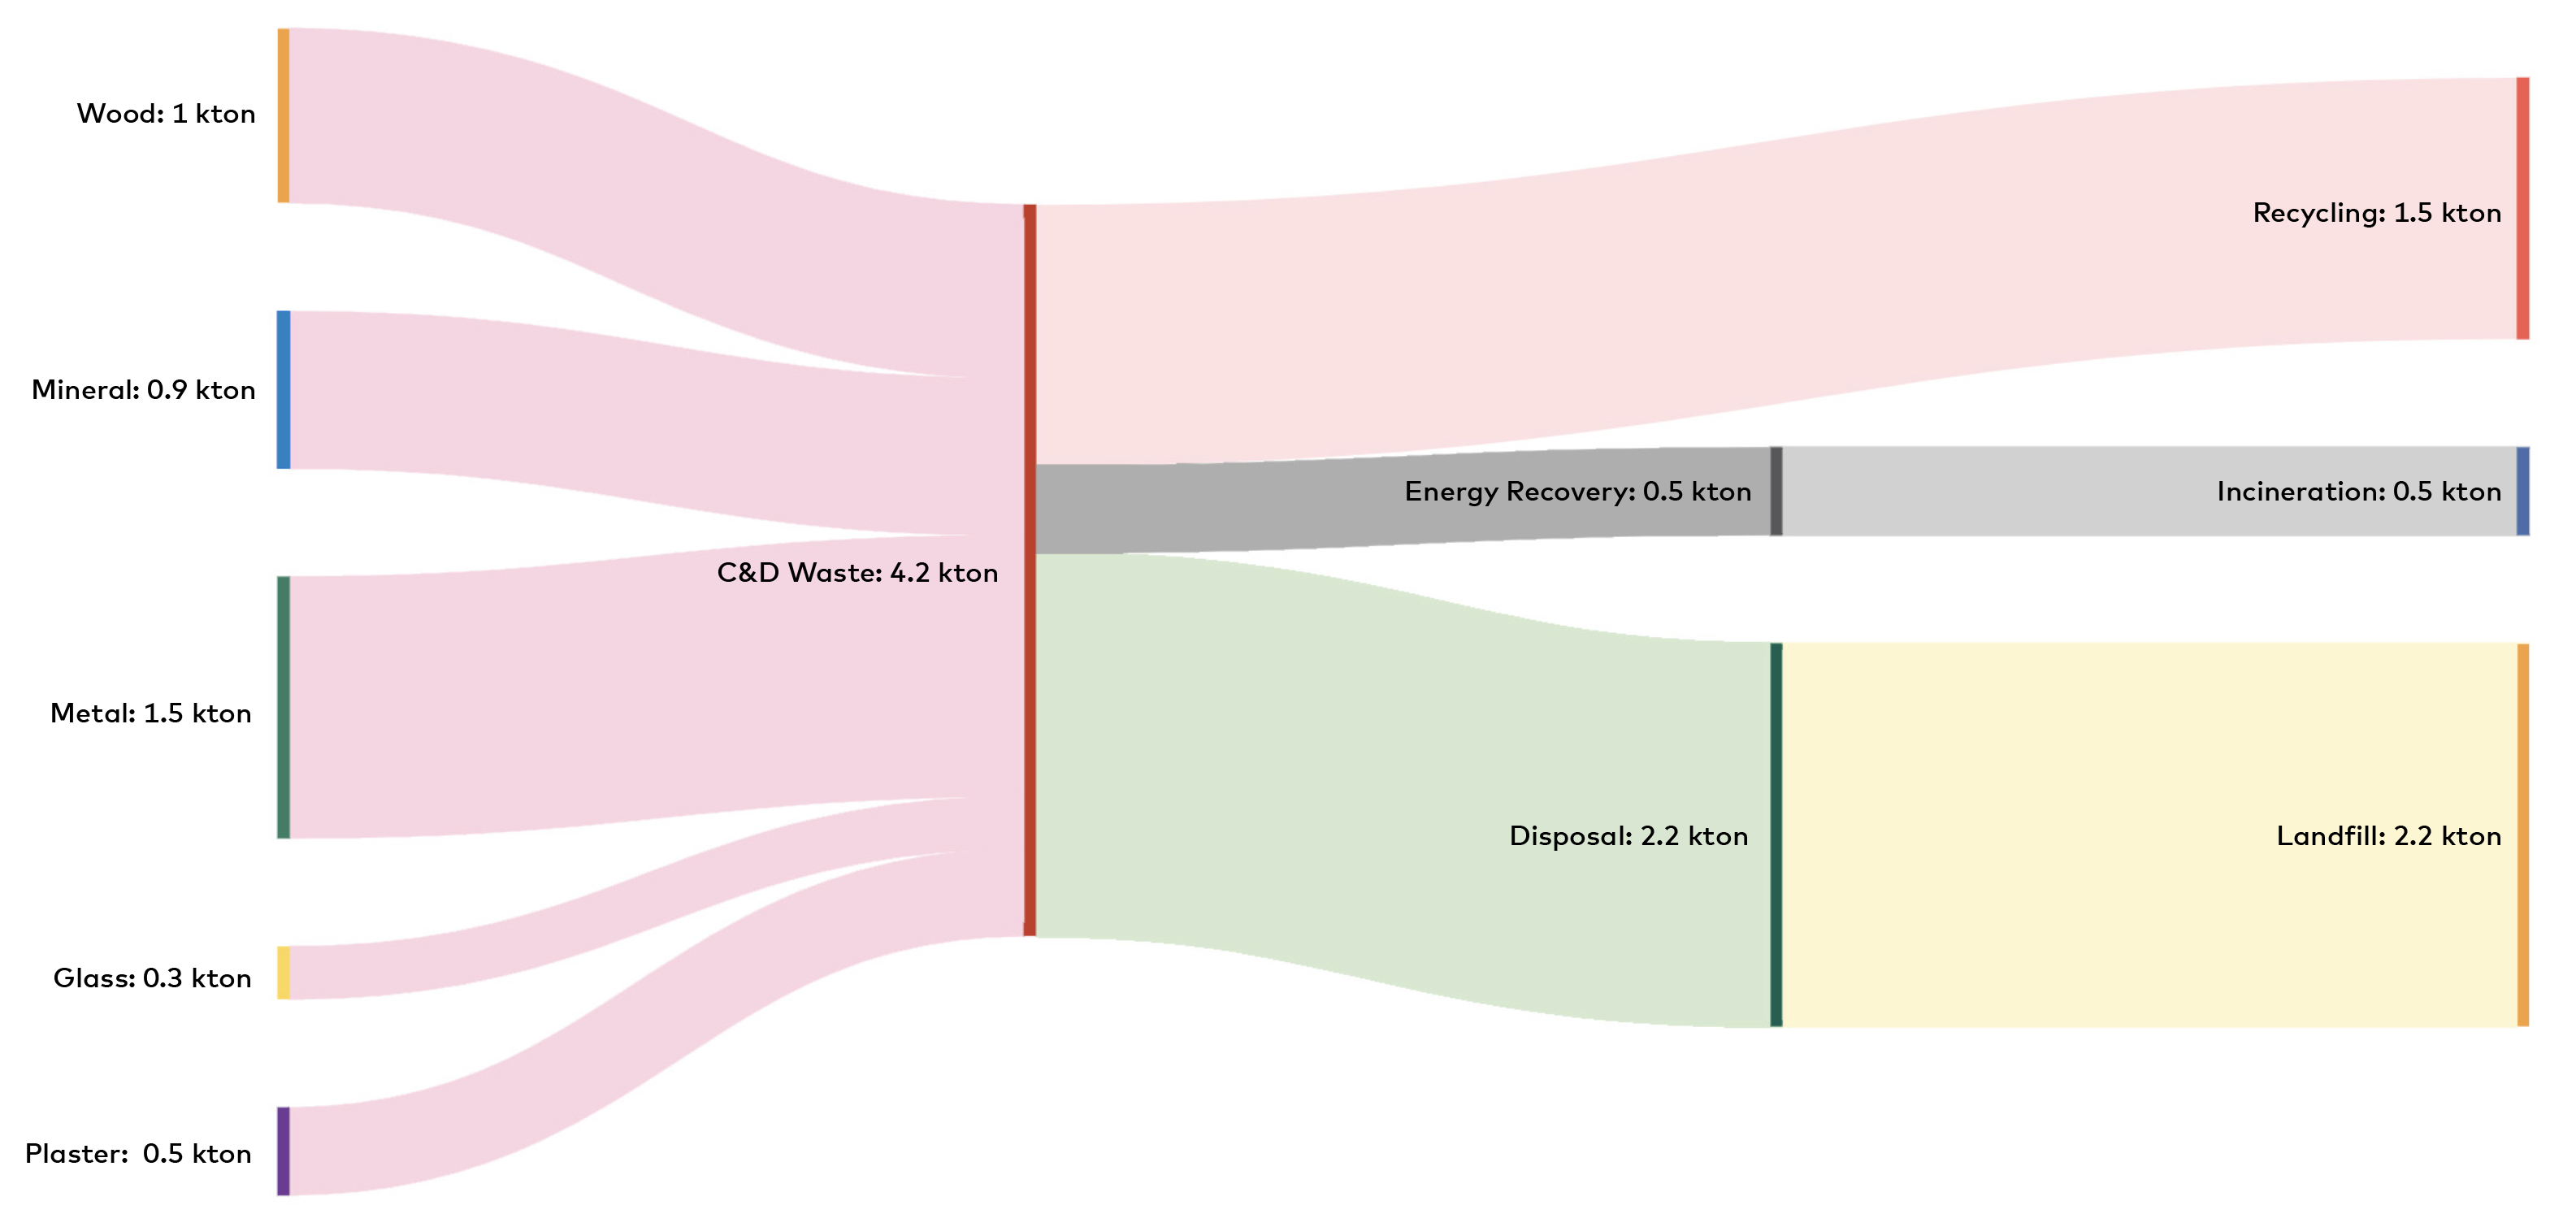
Figure 5: Material flows for CDW in Greenland for the year 2020. Data on the amounts of CDW was received from Sermersooq Municipality, Sermersooq Affaldscenter, Drift og miljø, for the year 2020. Other municipalities and waste facilities in Greenland did not respond to request for information or did not have knowledge on waste volumes.
2.1.3 Faroe Islands
Faroe Islands are an autonomous part of the Danish Kingdom with its own legislature on construction, waste handling and environmental issues, as well as on other issues.
The legislation on management of waste is based on an environmental protection law, by which prevention must be preferred before material recycling, reuse and material recycling before incineration and incineration before landfilling. At this point, Faroe Islands have no special legislation on CDW handling. The current Faroese government has initiated a process towards a new regulation and national plan for waste handling. The intention is to tighten the control with hazardous substances in construction materials and to increase the sorting and quality of the construction waste
Personal communication Rúna Hjelm, Umhvørvisstovan, The Environment Agency of Faroe Islands. 2023.
Figure 6 shows the material flows for the CDW treated in the Faroe Islands in the year 2020 and data have been visualised in a Sankey-diagram. It is important to note that there was limited availability of data, and therefore the diagram does not give the correct picture of the treated CDW in the Faroe Islands.
The only reported waste categories were for wood, minerals and metals, hazardous waste and soil, and plaster is included in the numbers for minerals. The diagram shows that the largest CDW fraction reported goes to incineration, and another fraction goes to landfills. A very small fraction goes to recycling.
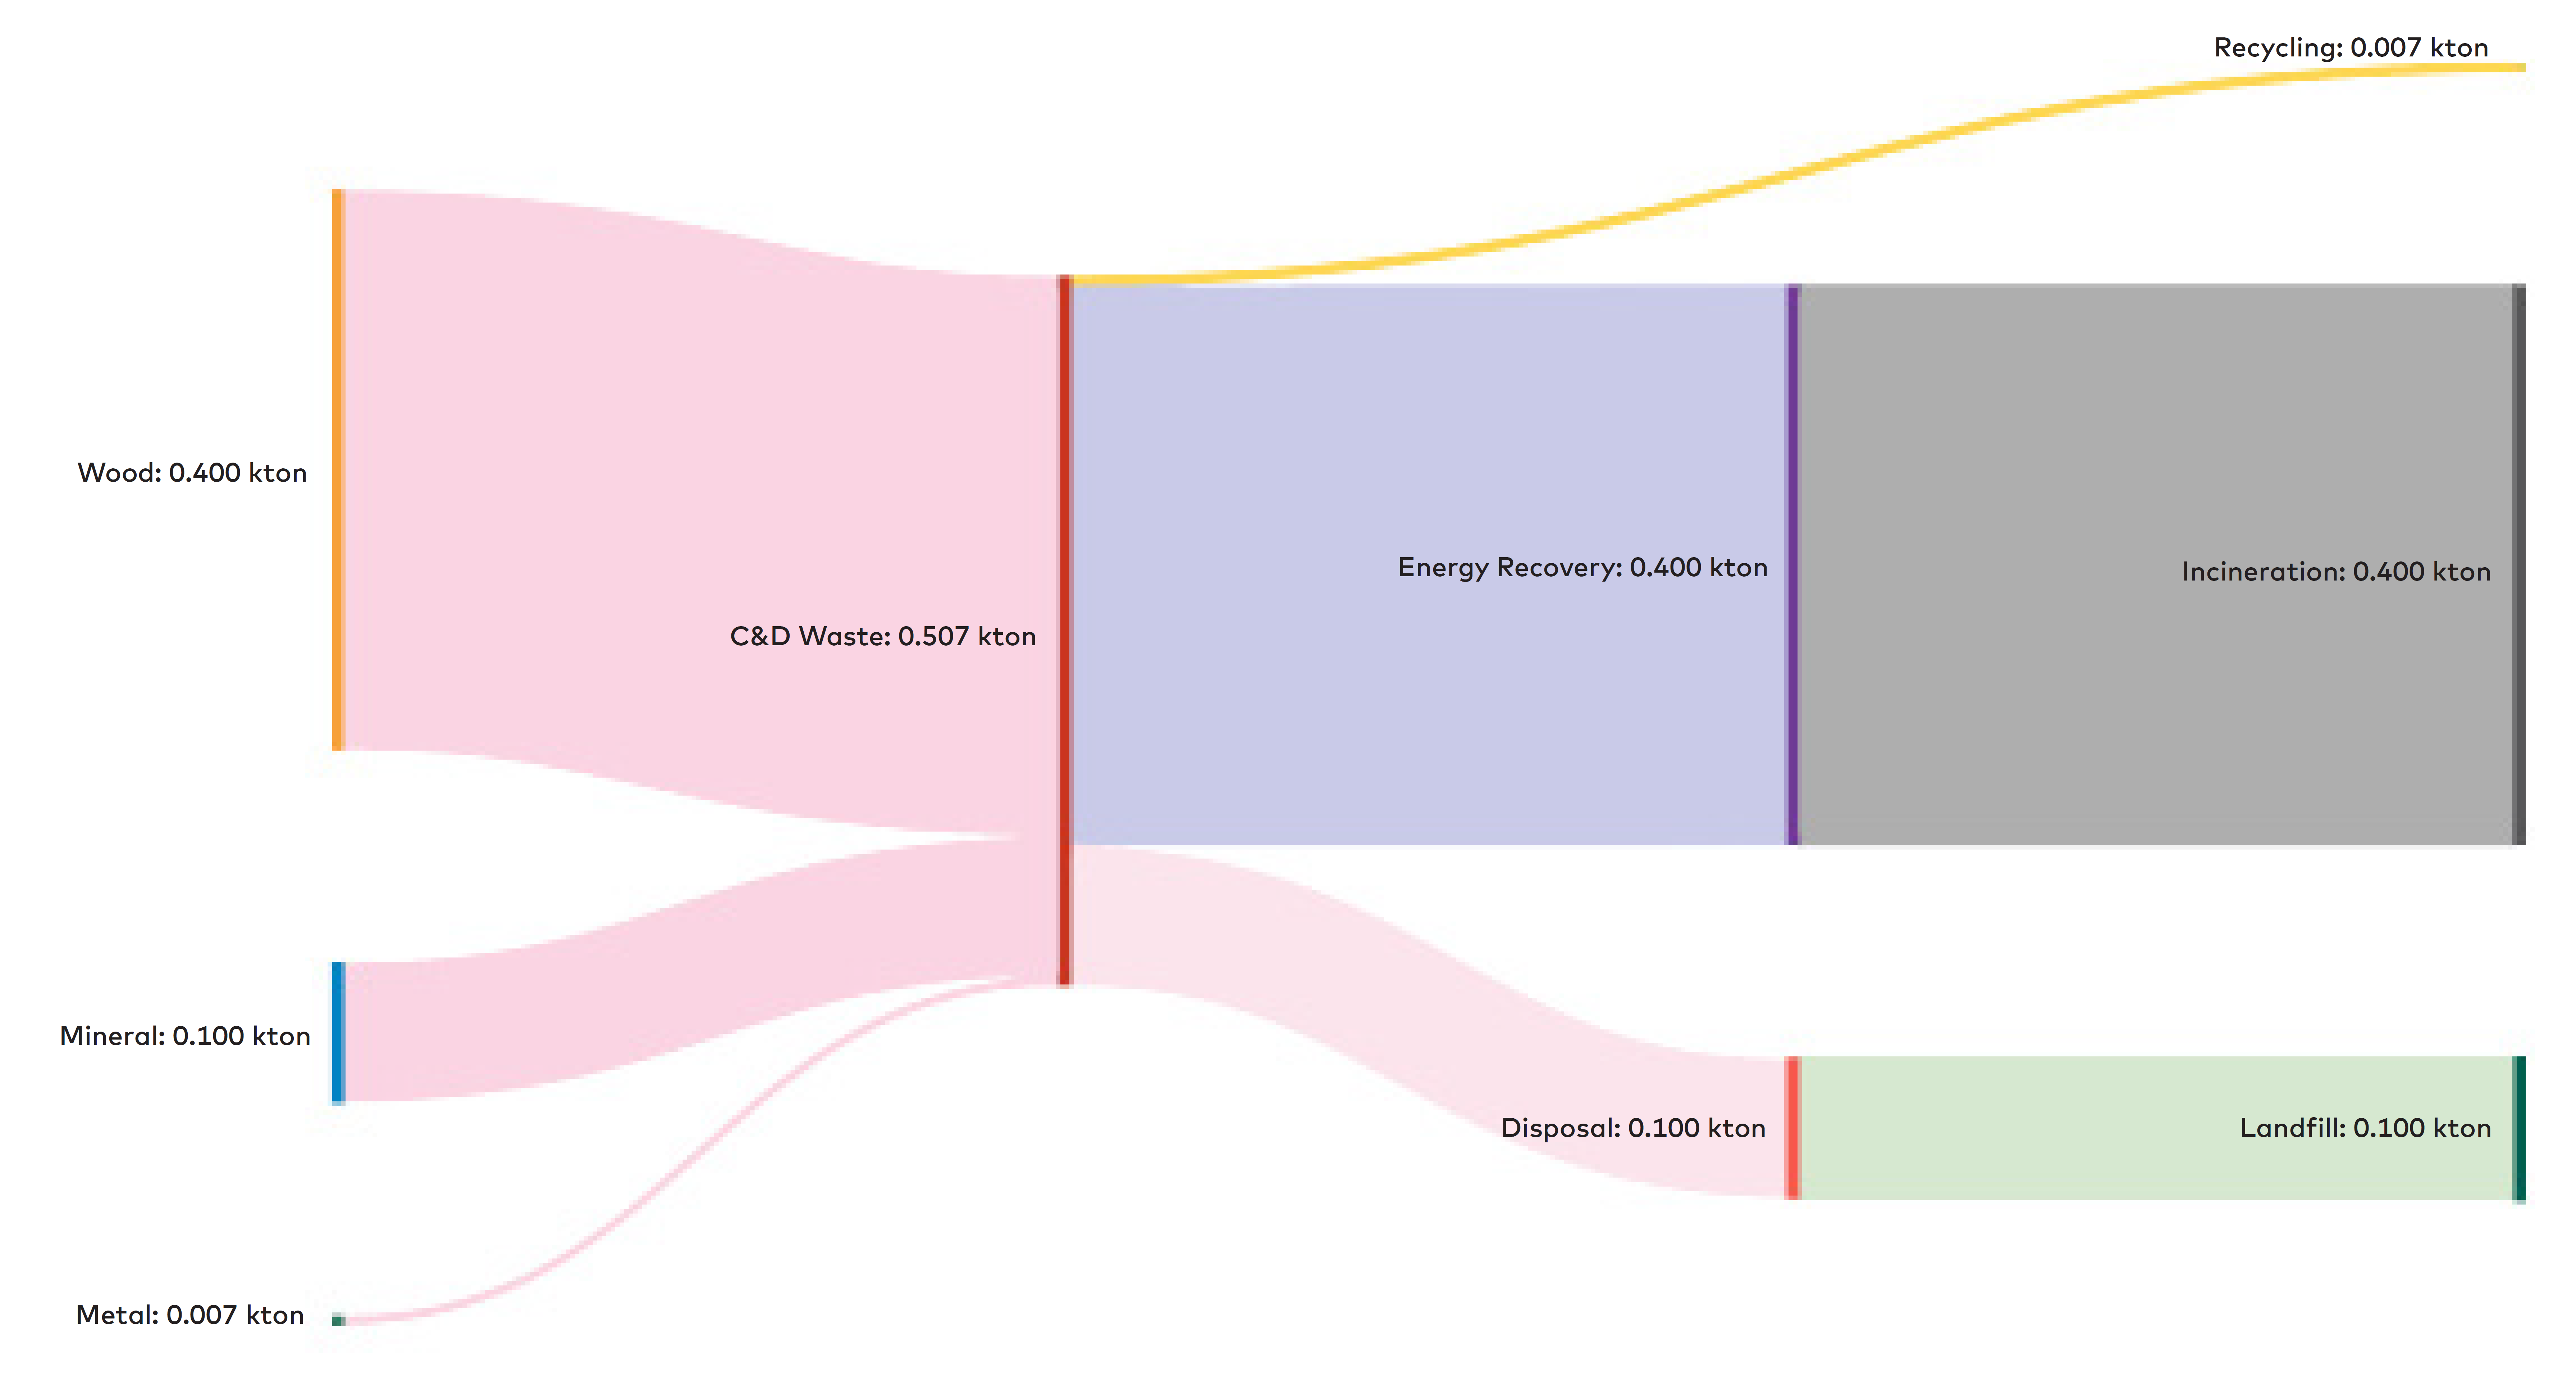
Figure 6: The material flows for CDW in the Faroe Islands for the year 2020. Data on the amounts of CDW was received from the Faroese intermunicipal waste and recycling company, IRF, for the year 2020 and does not include data for Torshavn. The waste company in Torshavn did not respond to request for information for this study.
2.1.4 Finland
The legislation regarding construction and demolition waste in Finland follows the development of European Union waste legislation and regulation, as the Waste Framework Directive and the waste hierarchy. In some respects, however, Finnish legislation is more extensive and stricter than EU regulations.
Waste law, Jätelaki (646/2011
Waste law. 17.6.2011/646. Finlex. Available: https://www.finlex.fi/fi/laki/ajantasa/2011/20110646
Government Degree 978/2021. Finlex. Available: https://finlex.fi/fi/laki/alkup/2021/20210978
In Finland, the following materials are to be separately collected in construction and demolition sites according to the Finish national legislation:
- Concrete, bricks, stone slabs, and ceramics, sorted by grades when possible.
- Asphalt
- Bitumen, roofing felt
- Gypsum
- Untreated wood
- Metal
- Glass
- Plastic
- Paper and cardboard
- Mineral wool insulation
- Surplus soils and aggregates
Current land use and construction Law, Maankäyttö- ja rakennuslaki 132/1999
Land Use and Construction Law 132/199. Available: https://www.finlex.fi/fi/laki/ajantasa/1999/19990132
Proposal of the Government HE 139/2022 vp. Available: https://www.eduskunta.fi/FI/vaski/HallituksenEsitys/Sivut/HE_139+2022.aspx
Ministry of Environment. 2021. Strategic program to promote circular economy. Available: https://ym.fi/kiertotalousohjelma
Few important national legislations concerning especially mineral CDW recycling are Government Decree, Valtioneuvoston asetus eräiden jätteiden hyödyntämisestä maarakentamisessa 843/2017
Government Degree 843/2017. Finlex. Available: https://www.finlex.fi/fi/laki/alkup/2017/20170843
In addition, Finland has defined national End of Waste, EoW, criteria (Government decree, Valtioneuvoston asetus betonimurskeen jätteeksi luokittelun päättymisen arviointiperusteista 466/2022
Government Decree 644/2022. Finlex. Available: https://www.finlex.fi/fi/laki/alkup/2022/20220466
Government Decree 858/2018. Finlex. Available: https://www.finlex.fi/fi/laki/alkup/2018/20180858
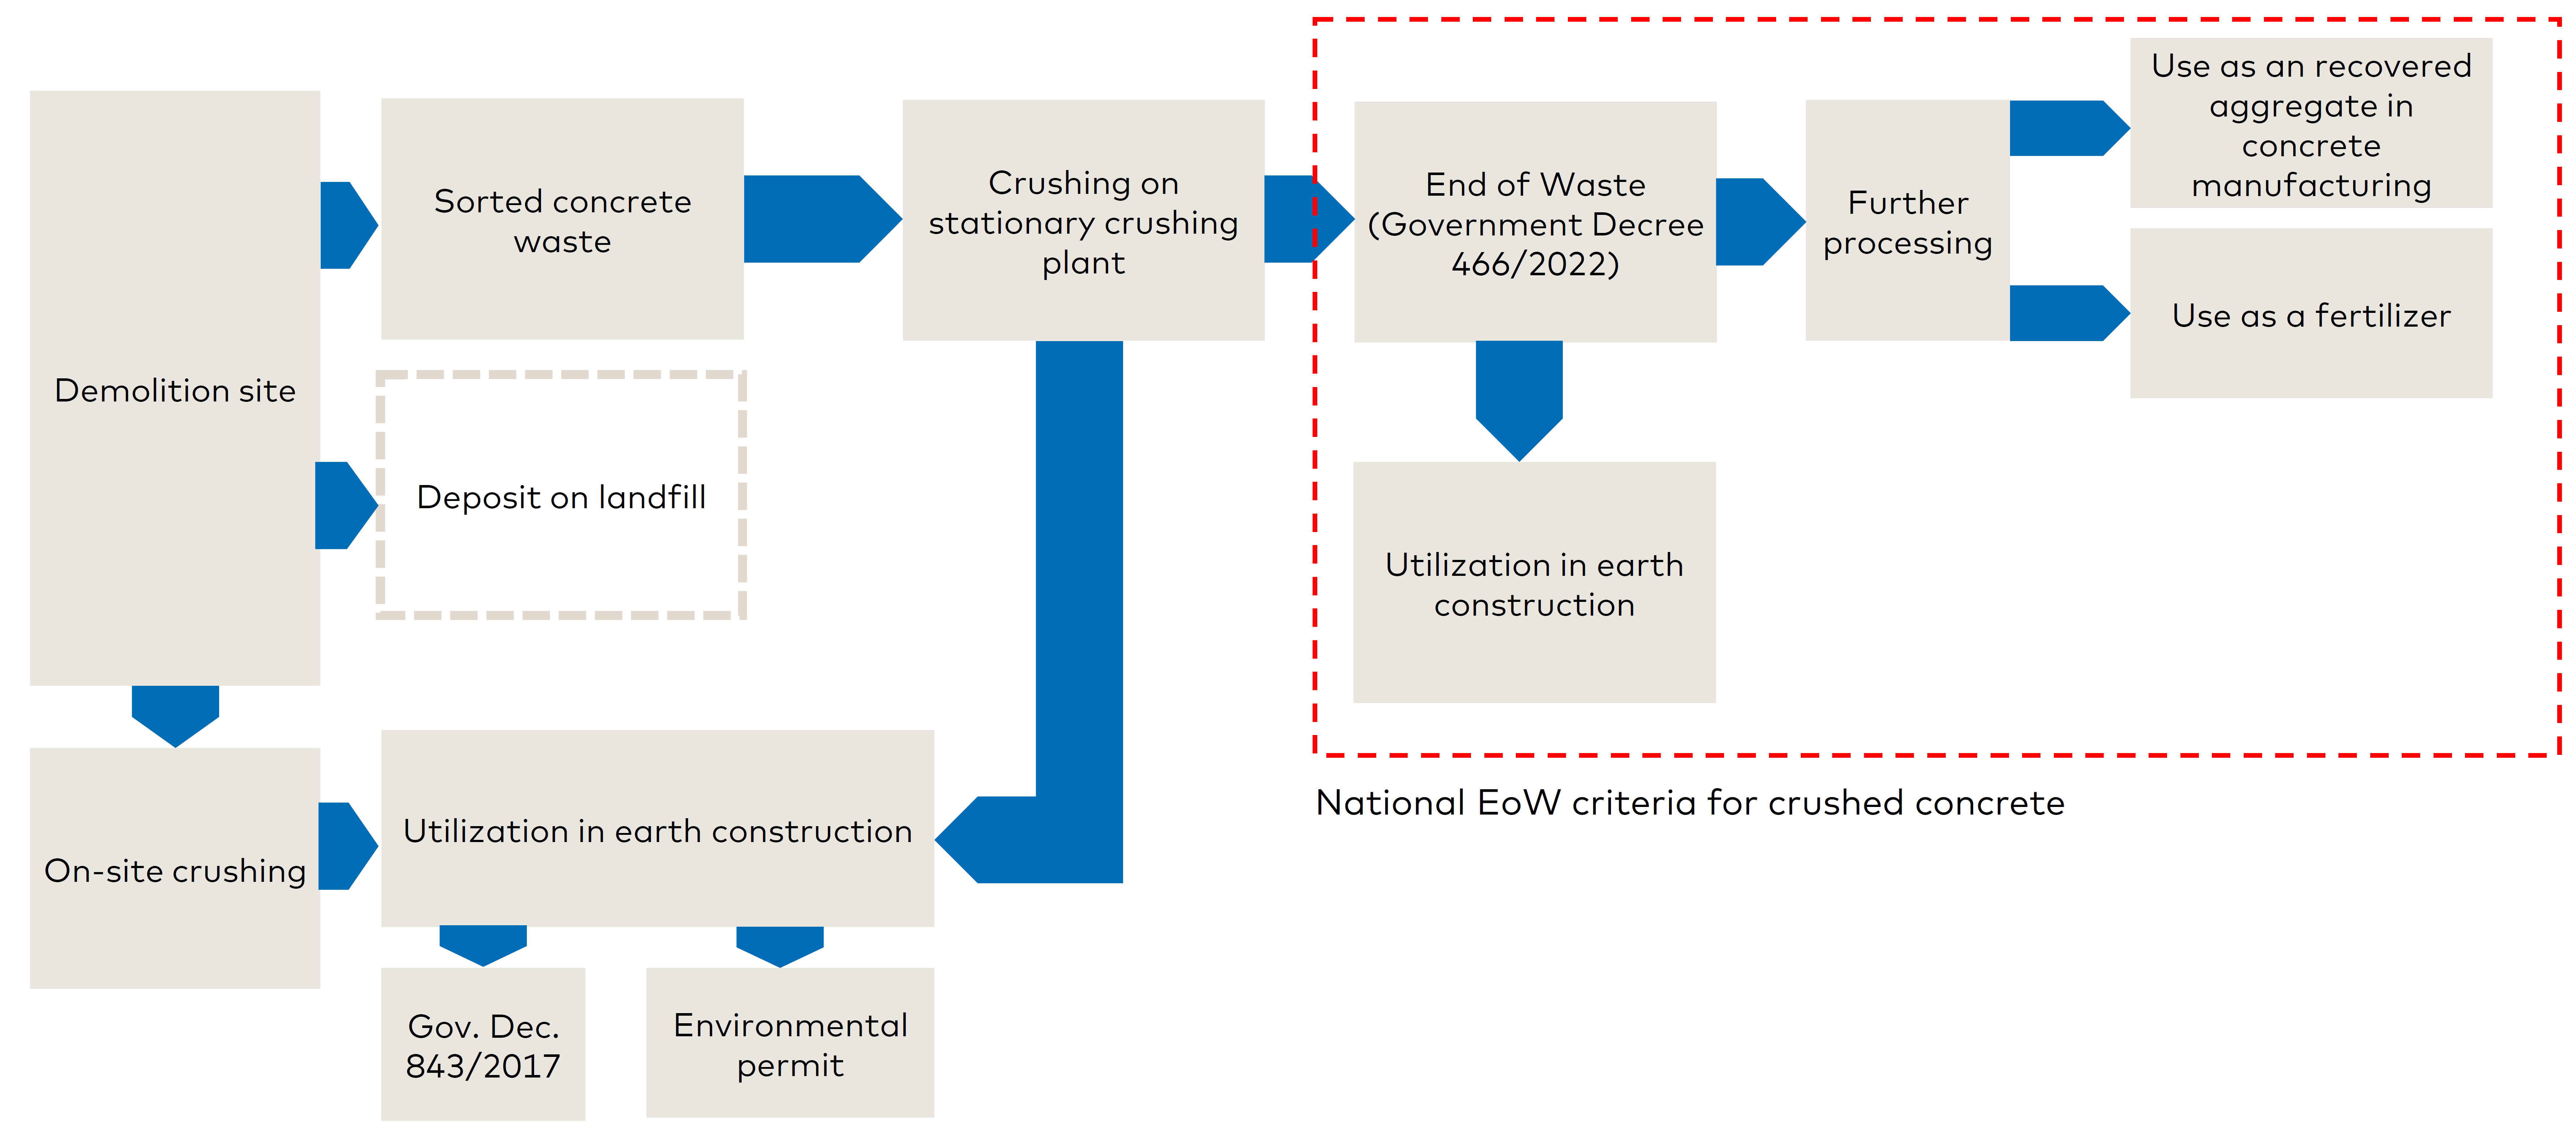
Figure 7. Recycling scheme for concrete waste according to Finnish legislation.
As mentioned above, the laws and decrees on the management on CDW in Finland are more comprehensive than the EU regulations states. Figure 8 shows the waste streams for the CDW treated in Finland for the year 2020 where the CDW streams have been visualised in a Sankey-diagram. The data reporting for the treatment of CDW in Finland is done at a higher level, and it was challenging to find data at a sub-category level and for the treatment methods of the waste fractions, such as what type of material recovery operations take place.
The diagram shows that mineral waste accounts for the majority of the total treated CDW and the second largest material flow is wood waste. The available data is reported at most detailed on according to EWC-Stat codes, meaning that mineral waste includes fractions of e.g., bricks and asphalt. The treatment methods are recycling or material recovery, energy recovery and disposal to landfill.
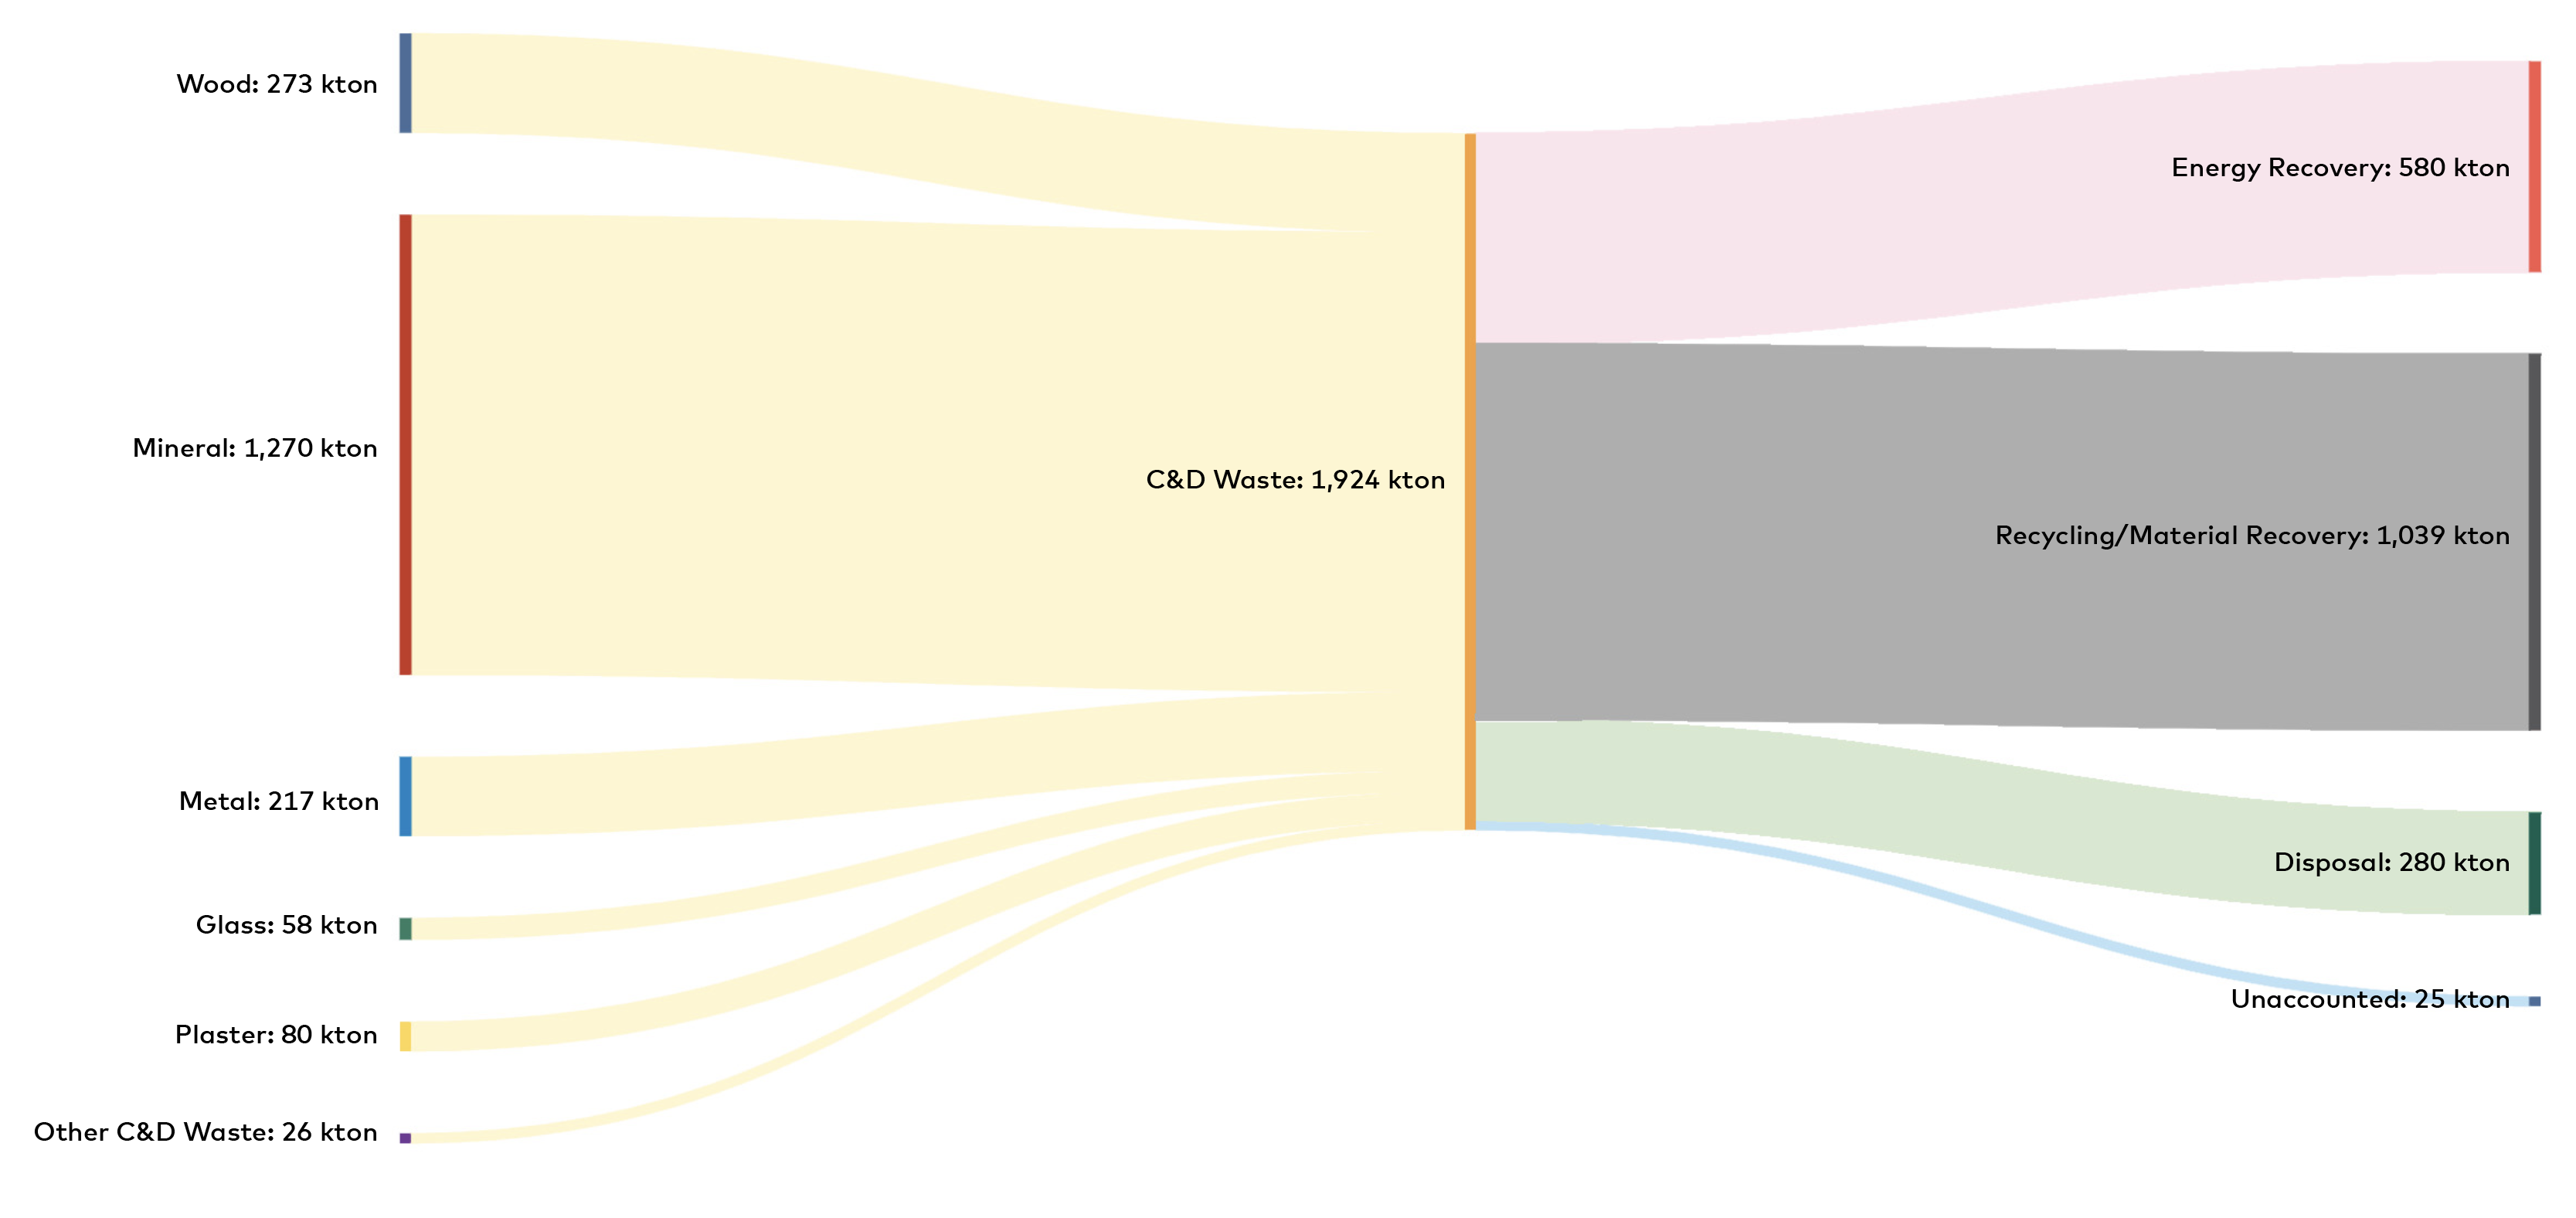
Figure 8: Material flows for CDW in Finland for the year 2020. Data on the amounts of CDW was mainly gathered from Statistics Finland, Tilastokeskus
Tilastokeskus 2023. Jätetilasto. Available: https://pxdata.stat.fi/PxWeb/pxweb/fi/StatFin/StatFin__jate/
Additional sources used during the data gathering process of CDW amounts for 2020:
- Muovitiekartta Suomelle 2020 https://ym.fi/documents/1410903/40549091/rakentamisen_muovit_A4_v3.pdf/9999a63d-a09e-b840-4ab1-fb1de6672fbd/rakentamisen_muovit_A4_v3.pdf?t=1694178723504
- Liikanen, M., Helppi, O., Havukainen, J., & Horttanainen, M. (2018). Rakennusjätteen koostumustutkimus–EteläKarjala. LUT Scientific and Expertise Publications/Tutkimusraportit–Research Reports 82
- Uusiouutiset 2015 https://www.uusiouutiset.fi/asukkaat-innostuivat-kipsilevy-ja-kattohuopajatteen-kierratyksesta/
- Kauppalehti, available: https://www.kauppalehti.fi/uutiset/knauf-oy-kaynnistaa-kipsilevyjen-kierratyksen/b5583945-0e84-37e5-bbd5-adee14b082cc
- Seloy, Lasitietoa, available:
https://seloy.fi/lasin-kierratys/
2.1.5 Åland
Åland islands is an autonomous region of Finland, with its own application of the Finnish waste law, Åland waste law, Landskapslag om tillämpning av rikets avfallslag 2018:83
Åland waste law 2018:83. Ålex. Available: https://www.regeringen.ax/alandsk-lagstiftning/alex/201883
Åland Governmental Decree on Waste. Ålex. Available: https://www.regeringen.ax/alandsk-lagstiftning/alex/202222
Åland Government Decree 2010/79. Ålex. Available: https://www.regeringen.ax/alandsk-lagstiftning/alex/201079#an_201895
In the waste decree 2022:22 the materials that are to be separately collected are specified, and they are the same as in Finland nationally. The goal is a 70 % recycling rate for CDW. Figure 9 shows the material flows for the treated CDW in the Åland Islands in 2020 and the data have been visualised in a Sankey-diagram. Although the Åland Islands is a small region, with around 30.129 inhabitants reported in 2020, the data transparency on the treatment of CDW is considered quite high.
The reported waste categories were for wood, minerals and metals, with plaster waste being included in the amounts for minerals. According to information from the waste handlers in the Åland Islands, the reason for the large amounts of mineral waste was due to a large construction of the road systems in the island. The diagram shows that the largest CDW fraction reported goes to recycling and material recovery. Small fractions end up in landfill and energy recovery.
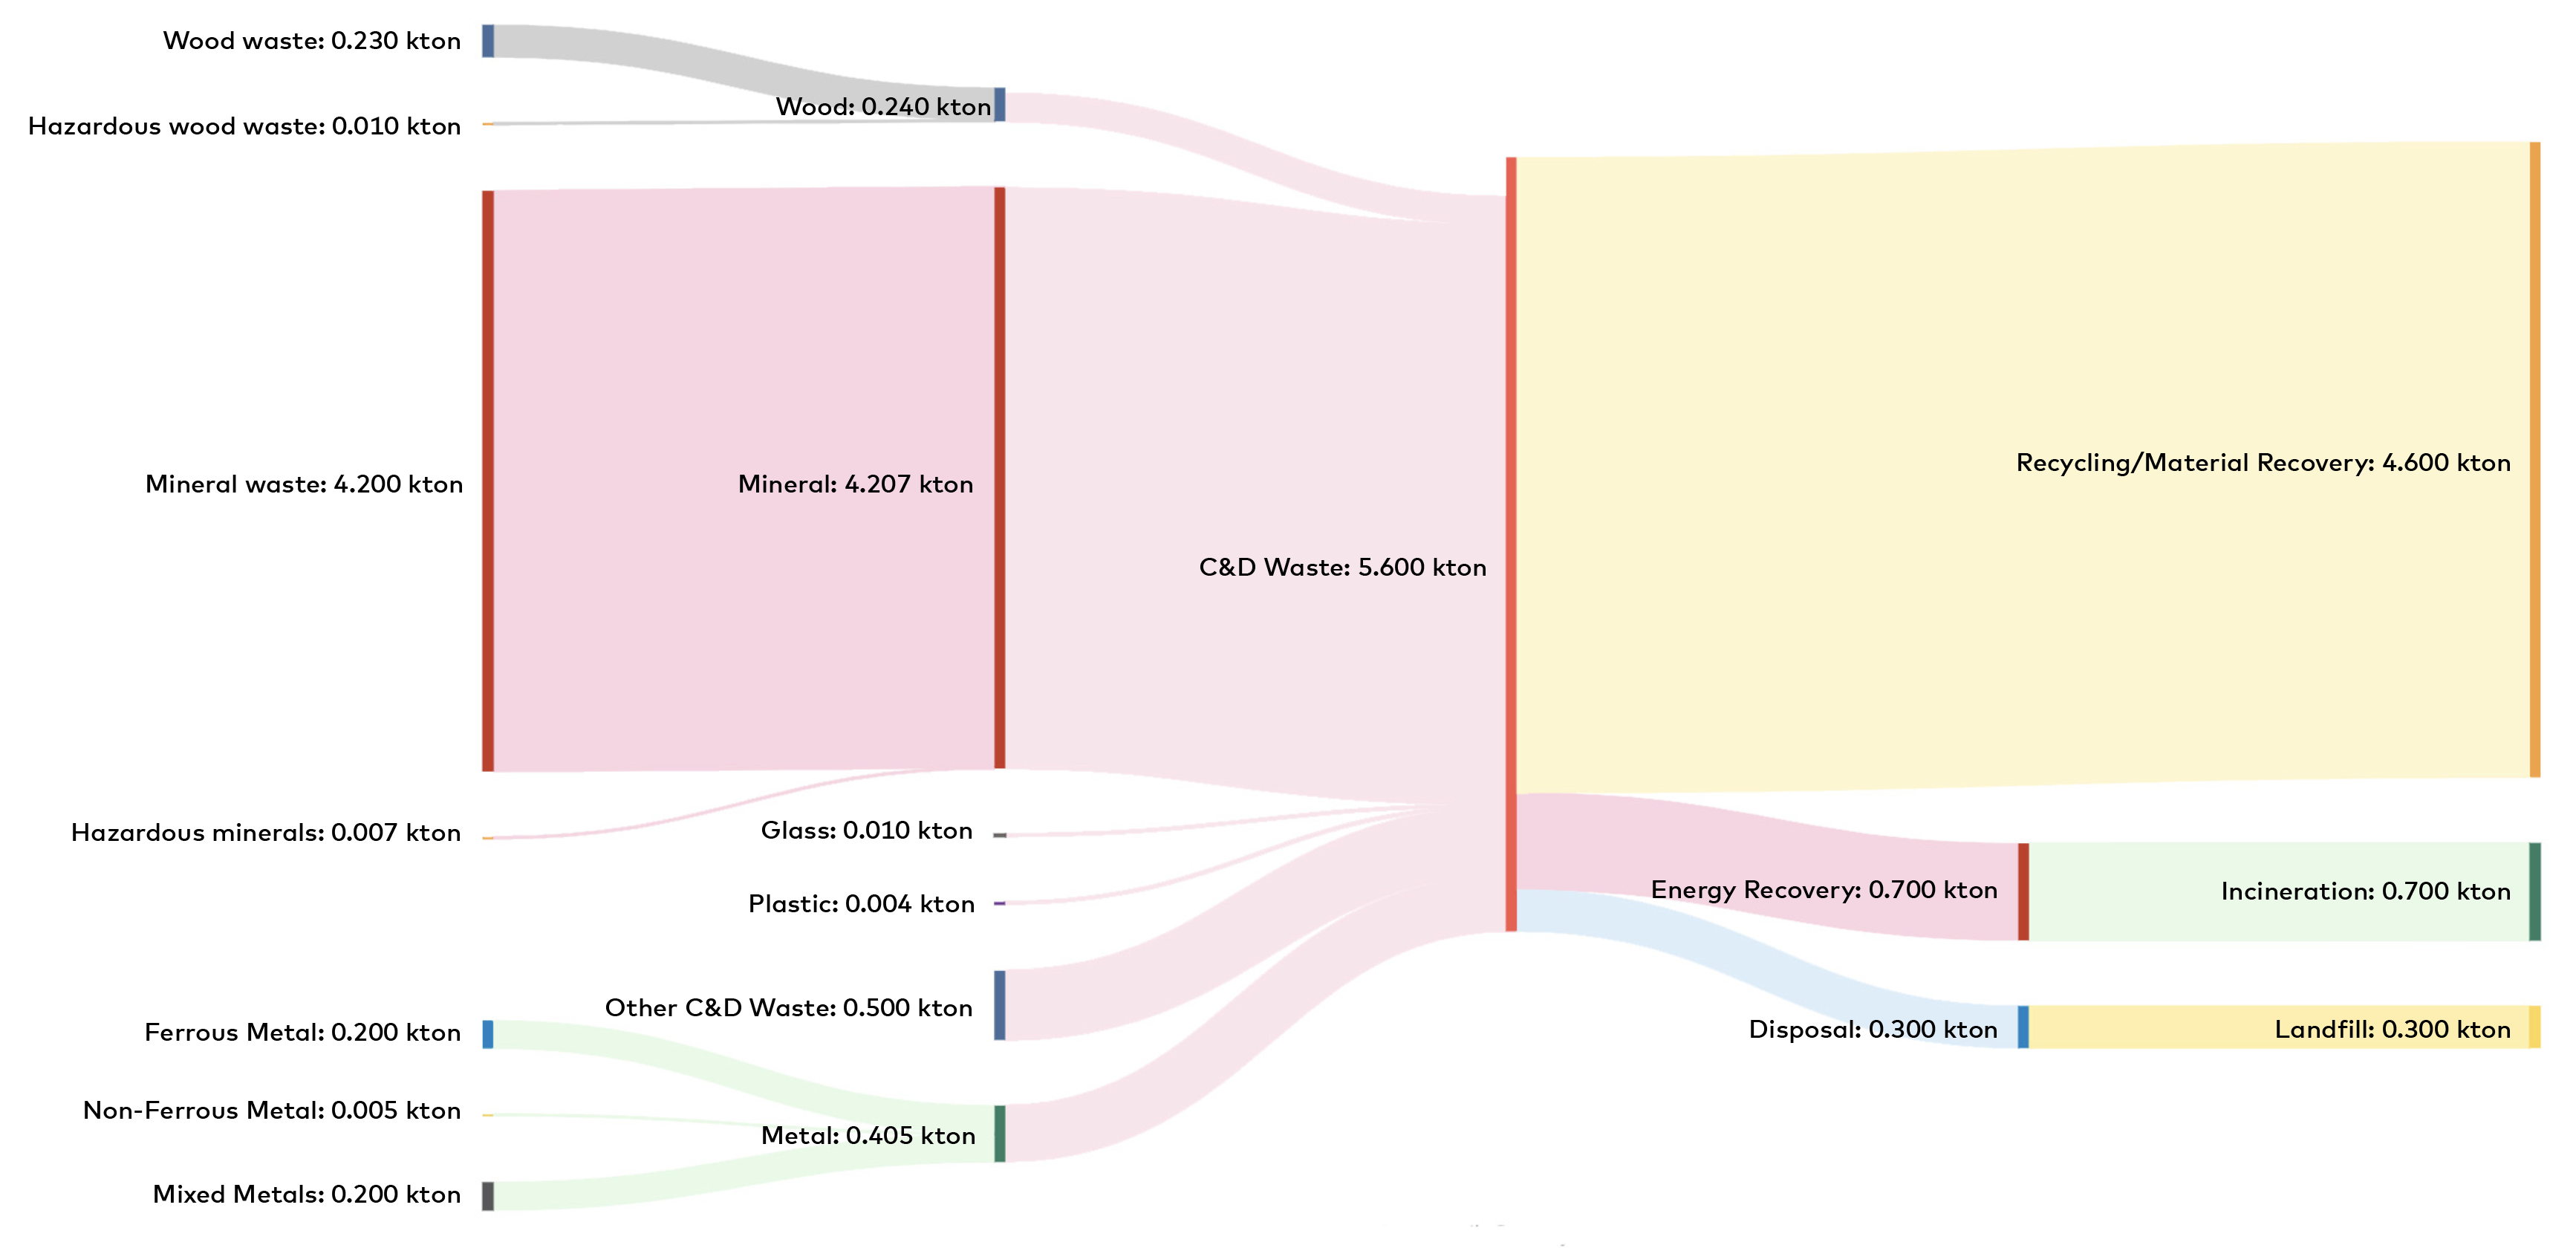
Figure 9: Material flows for CDW in the Åland Islands for the year 2020. Data on the amounts of CDW was gathered from Statistics and Research Åland, ÅSUB, for the year 2020
ÅSUB 2021. Avfallsstatistik 2020. Statistik 2021:5. Available: https://www.asub.ax/sites/default/files/statistics/avfall20_0.pdf
2.1.6 Iceland
The Icelandic national laws on waste treatment, Lög um meðhöndlun úrgangs (55/2003)
Lög um meðhöndlun úrgangs (55/2003). Alþingi. Available: https://www.althingi.is/lagas/nuna/2003055.html
Í átt að Hringrásarhagkerfi – ný stefna í úrgangsmálum. Stjórnarráðið. Available: Stefna um meðhöndlun úrgangs 2021-2031
The national waste law (55/2003) was amended, and the changes entered into force January 1st, 2023. According to the amendments, CDW is defined as all waste resulting from construction and demolition activities, including maintenance and changes during the life of buildings, and their demolition. This definition also includes waste resulting from minor public construction and demolition activities in private homes. The law also states that CDW is to be sorted, at the minimum, into the following categories:
- hazardous materials,
- wood,
- minerals,
- metal,
- glass,
- plastic, and
- plaster
In addition to the national law, Iceland has regulations that further define the management of CDW, one being the Regulation of waste management (803/2023), and the National building regulation (112/2012).
The Waste management regulation, Reglugerð um meðhöndlun úrgangs
Reglugerð um meðhöndlun úrgangs (803/2023). Reglugerðir. Available: https://island.is/reglugerdir/nr/0803-2023
The national building regulation, Byggingarreglugerð
Byggingarreglugerð (112/2012. Húsnæðis- og mannvirkjastofnun. Available: https://www.byggingarreglugerd.is/
- New buildings should be designed and built in such a way that all the waste that may come from them, i.e., due to construction works, maintenance and changes during their lifetime as well as demolition, causes the least possible damage to the environment.
- Before constructions of buildings that require a building permit begins, the owner must submit to the license provider a plan for the management of construction and demolition waste, which includes information on planning, registration, classification, reuse, and disposal, if the project is expected to amount more than 10 ton of waste.
- A list of construction and demolition waste generated during the construction shall be made. Material types and their quantities must be recorded.
- All construction waste must be transported to an approved waste reception facility.
In Figure 10, the material flows for the CDW treated in Iceland in 2020 can be seen, and the data have been visualised in a Sankey-diagram. When comparing the waste categories shown in the diagram to the minimum sorting categories of waste defined in the Icelandic national waste laws, some differences can be seen. That is due to the amendments of the national waste laws came into force in the beginning of 2023 and therefore, data is not available for those categories for the year 2020.
The waste diagram shows that mineral waste and other CDW, mainly asphalt waste, accounts for the largest amounts of the total treated CDW. Furthermore, the majority of the CDW is recovered and goes into backfilling operations. The second largest treatment method for the CDW is recycling, but the type of recycling is unspecified to a large extent. A very small fraction is sent to energy recover as there is no such facility operating in Iceland.
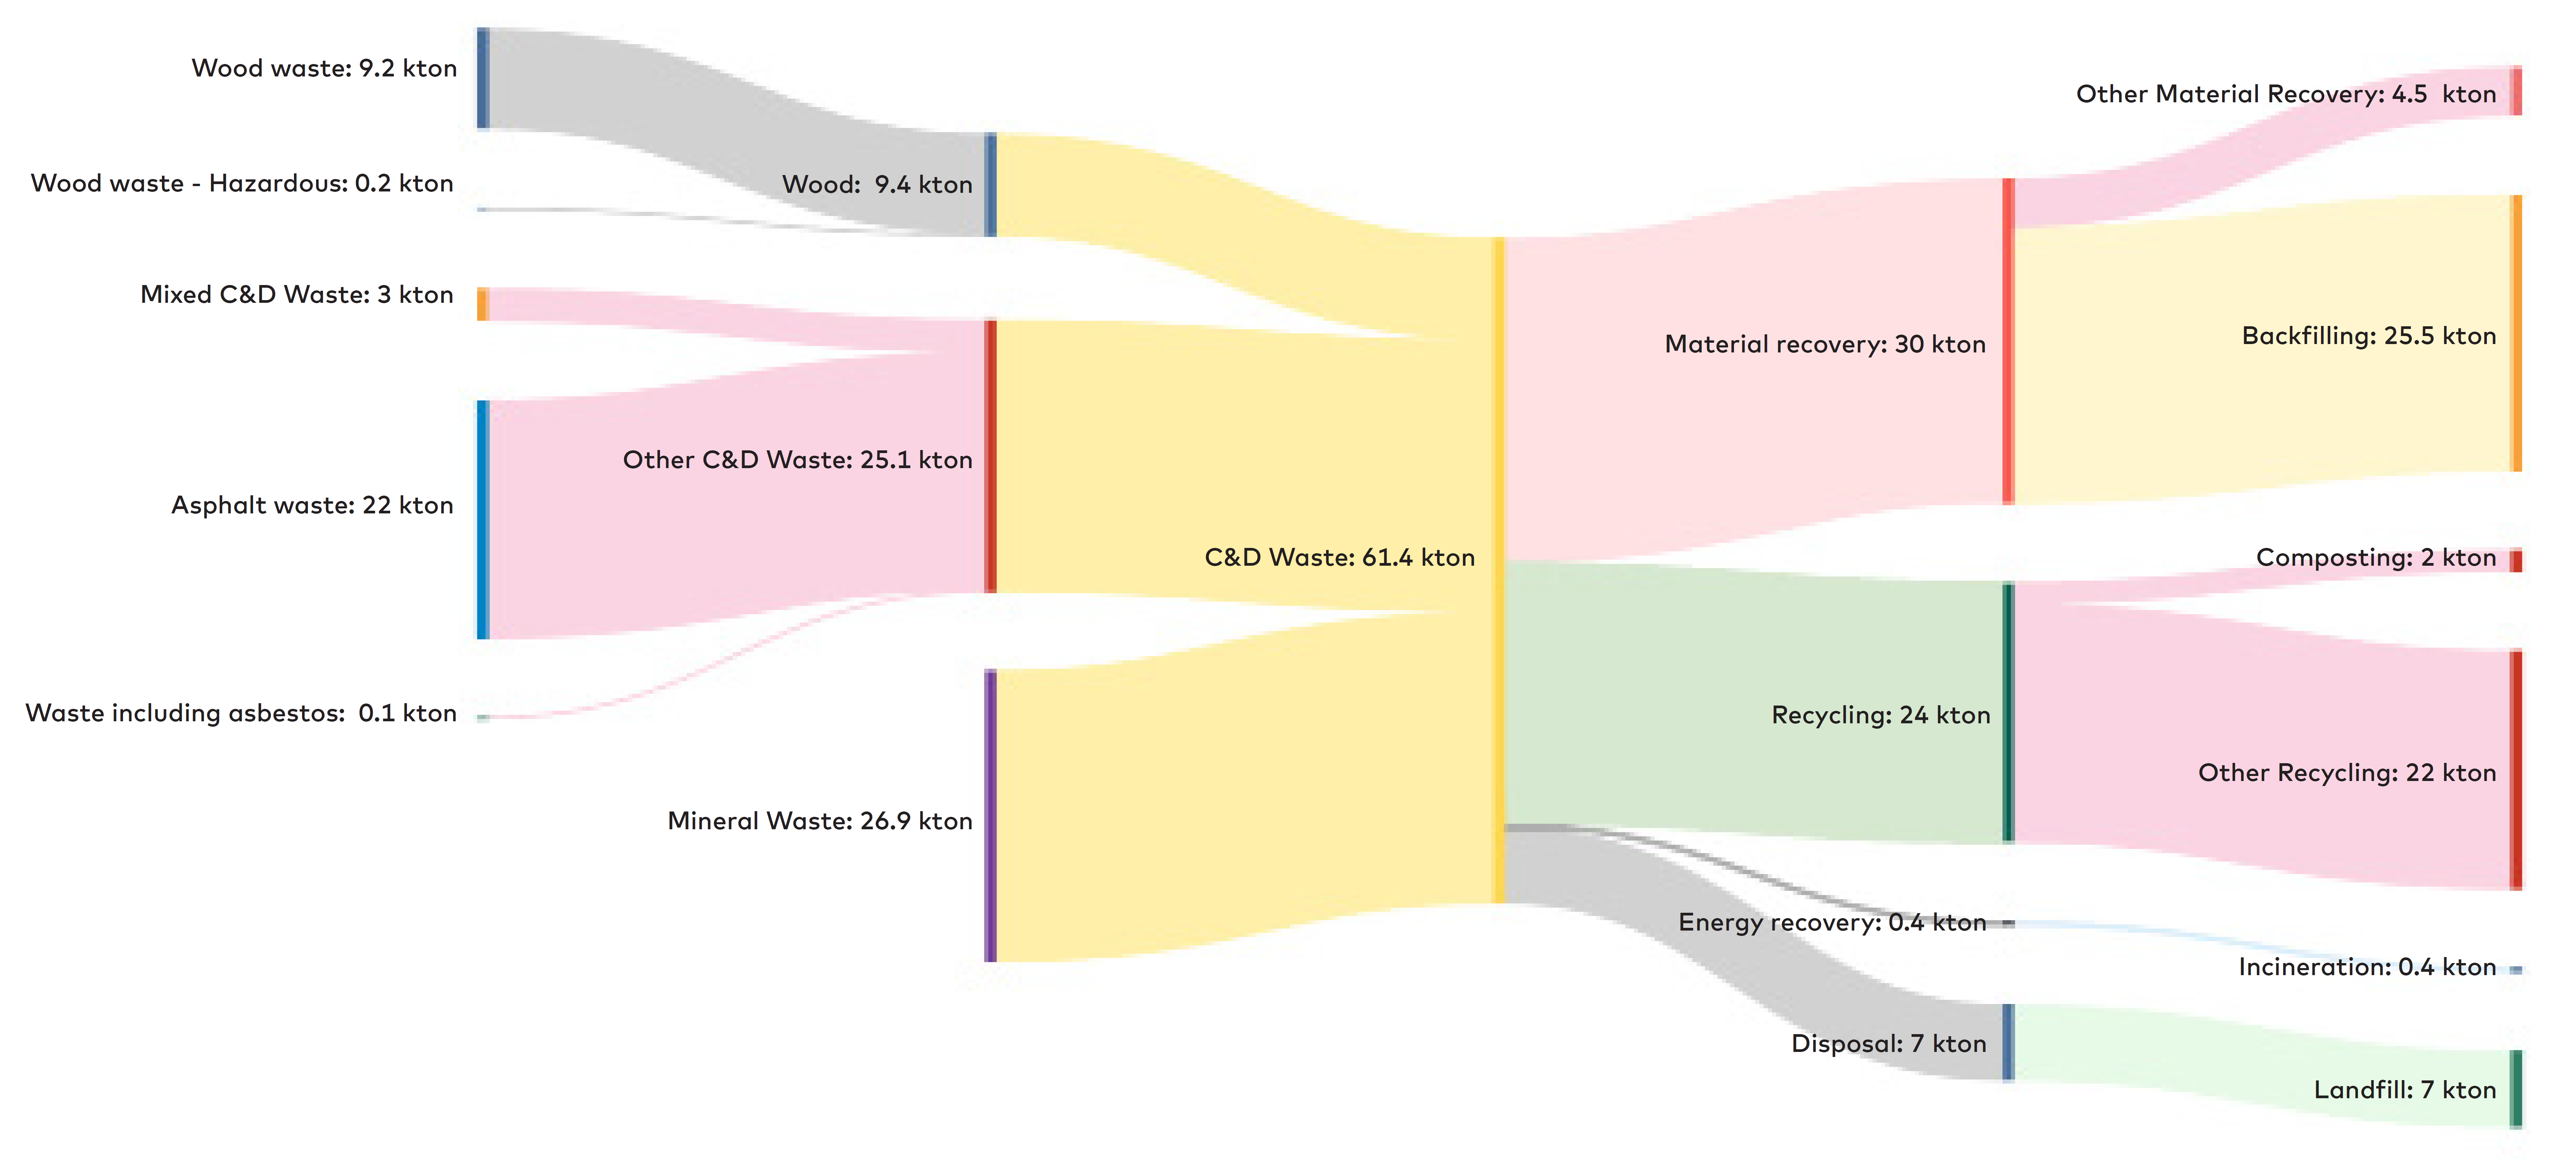
Figure 10: Material flows for CDW in Iceland for the year 2020. Data on the amounts of CDW was received from The Icelandic Environment Agency, Umhverfisstofnun, for the year 2020.
2.1.7 Norway
The law and regulations concerning CDW are set in the “Regulations on technical requirements for construction work” (Byggteknisk forskrift – TEK17)
Forskrift om tekniske krav til byggverk. Available:https://lovdata.no/dokument/SF/forskrift/2017-06-19-840/KAPITTEL_9#KAPITTEL_9
Avfallsforskriften (FOR-2004-06-01-930). LOVDATA. Available: https://lovdata.no/dokument/SF/forskrift/2004-06-01-930
Forurensningsforskriften (LOV-1981-03-13-6). LOVDATA. Available: https://lovdata.no/dokument/SF/forskrift/2004-06-01-931
The Norwegian Environment Agency prepare the laws and regulations for waste from construction and demolition projects and provides guidance to how the rules are to be put in practice
The Norwegian Environment Agency web page. Available: https://www.miljodirektoratet.no/om-oss/dette-er-miljodirektoratet/
- Polluted concrete, bricks and similar (but under limit for hazardous waste)
- Electric and electronic waste
- Hazardous waste
In addition to these it is recommended in guidelines to the legislation and in standard schemes
Sluttrapport med avfallsplan. Available: https://www.dibk.no/globalassets/blanketter_utfyllbare/alle-blanketter/5178-sluttrapport-med-avfallsplan-for-nybygg_2017.pdf
- Wood waste (not impregnated)
- Paper and cardboard
- Glass
- Iron and other metals
- Plastic
- Gypsum/plaster waste
- Concrete, bricks and similar
In the guidelines to the legislation, it is also mentioned fractions like roof covering, ceramics, sanitary porcelain (for reuse), textiles and furnishings.
The technical requirements for construction works are found in Byggteknisk forskrift
Byggteknisk forskrift (TEK17). Direktoratet for byggkvalitet. Available:https://www.dibk.no/regelverk/byggteknisk-forskrift-tek17
Produktforskriften. Available: https://lovdata.no/dokument/SF/forskrift/2004-06-01-922
In Figure 11, the waste streams for the treated CDW in Norway for 2020
Statistisk Sentralbyrå, Statistikkbanken, Avfall fra byggeaktivitet, tabell 09781. Available: https://www.ssb.no/statbank/table/09781/
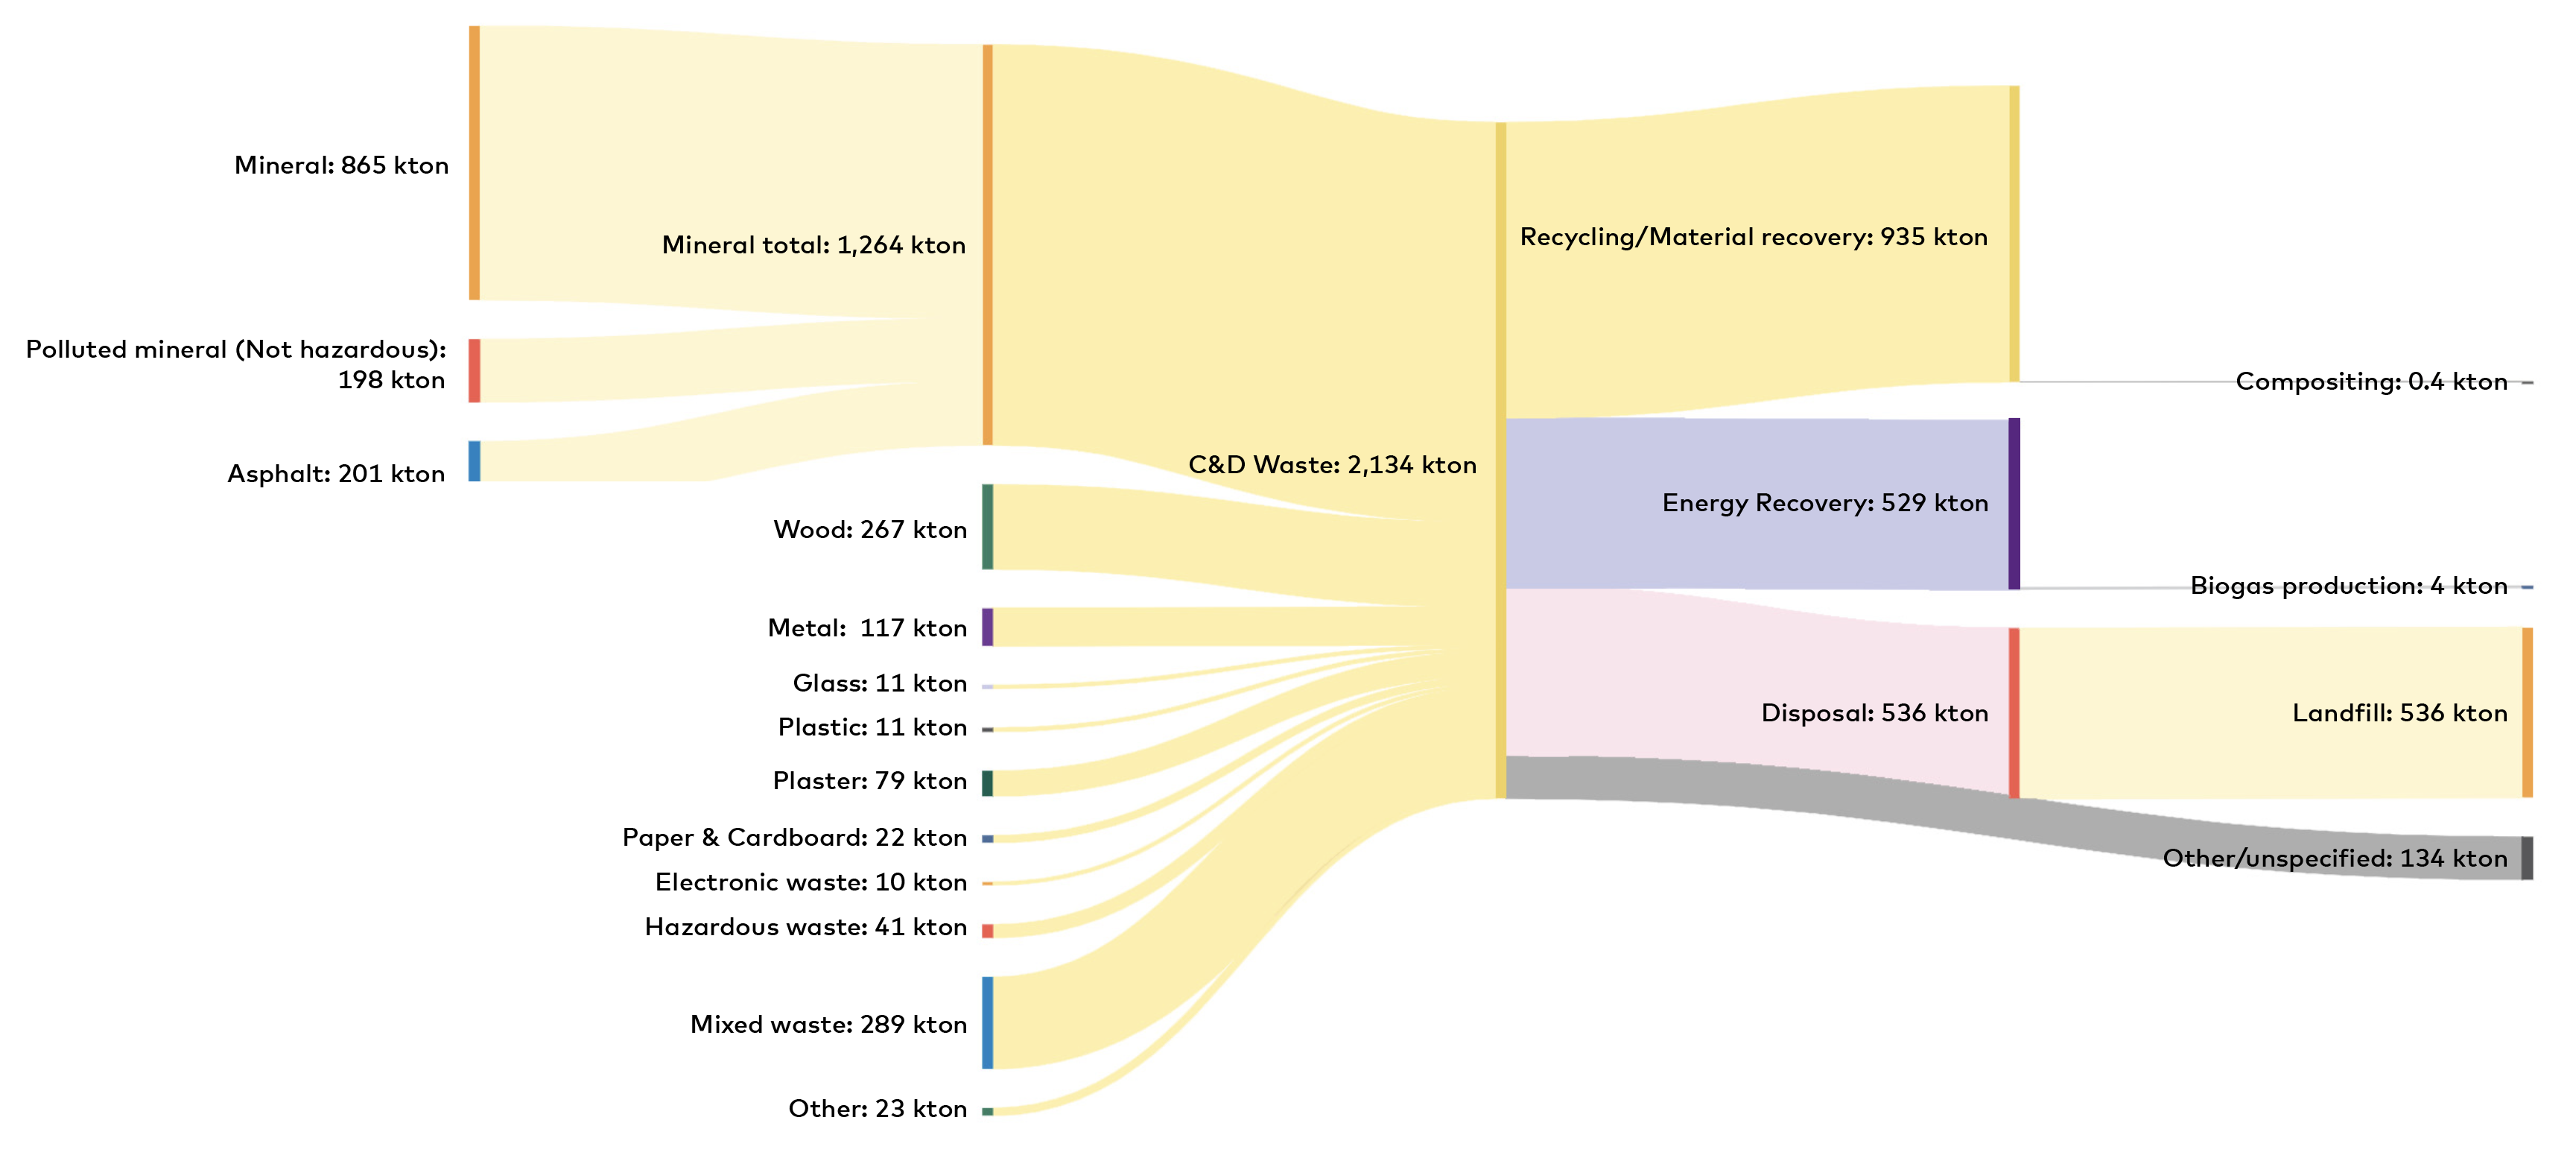
Figure 11: Material flows for CDW in Norway for the year 2020. Data on the amounts of CDW was gathered from Statistics Norway, Statistisk sentralbyrå, for the year 2020
Statistisk Sentralbyrå, Statistikkbanken, Avfall fra byggeaktivitet, tabell 09781. Available: https://www.ssb.no/statbank/table/09781/
2.1.8 Sweden
The legal framework governing Sweden's waste management system is established by both Swedish and European waste legislation, adhering to the waste hierarchy: prevention, preparation for reuse, material recovery, other recycling (including energy recovery), and disposal. This prioritization is contingent on environmental justification and financial feasibility.
The prioritization order for waste prevention and management is outlined in the framework directive for waste, integrated into Swedish legislation through the Swedish Environmental Code (1998:808), specifically in Chapter 2, 5§ and Chapter 15, 10§
Swedish Environmental Code, Miljöbalken SFS 1998:808. Available: https://rkrattsbaser.gov.se/sfsr?bet=1998:808
The Swedish Environmental Code (1998:808) encompasses regulations for waste management, running concurrently with additional waste-related provisions stemming from construction and demolition activities found in the Planning and Building Act (2010:900) (PBL)
Plan och bygglagen SFS 2010:900. Available: https://rkrattsbaser.gov.se/sfst?bet=2010:900
Mandatory on-site sorting of construction and demolition waste is mandated by the Waste Regulation (2020:614)
Avfallsförordning SFS 2020:614. Available: https://rkrattsbaser.gov.se/sfst?bet=2020:614
- Wood
- Mineral materials (e.g., concrete, clinker, ceramics)
- Metal
- Glass
- Plastic
- Plaster
In Figure 12, the waste streams for the treated CDW in Sweden for 2020 can be seen and they have been visualized in a Sankey-diagram. The diagram shows that mineral waste accounts for the largest amounts of the total treated CDW, and wood waste is the second largest waste category. Treatment methods in Sweden are reported as recycling including material recovery, energy recovery, further sorting and disposal to landfill. The majority of the CDW is recovered or recycled as material, and the second largest fraction go to energy recovery.
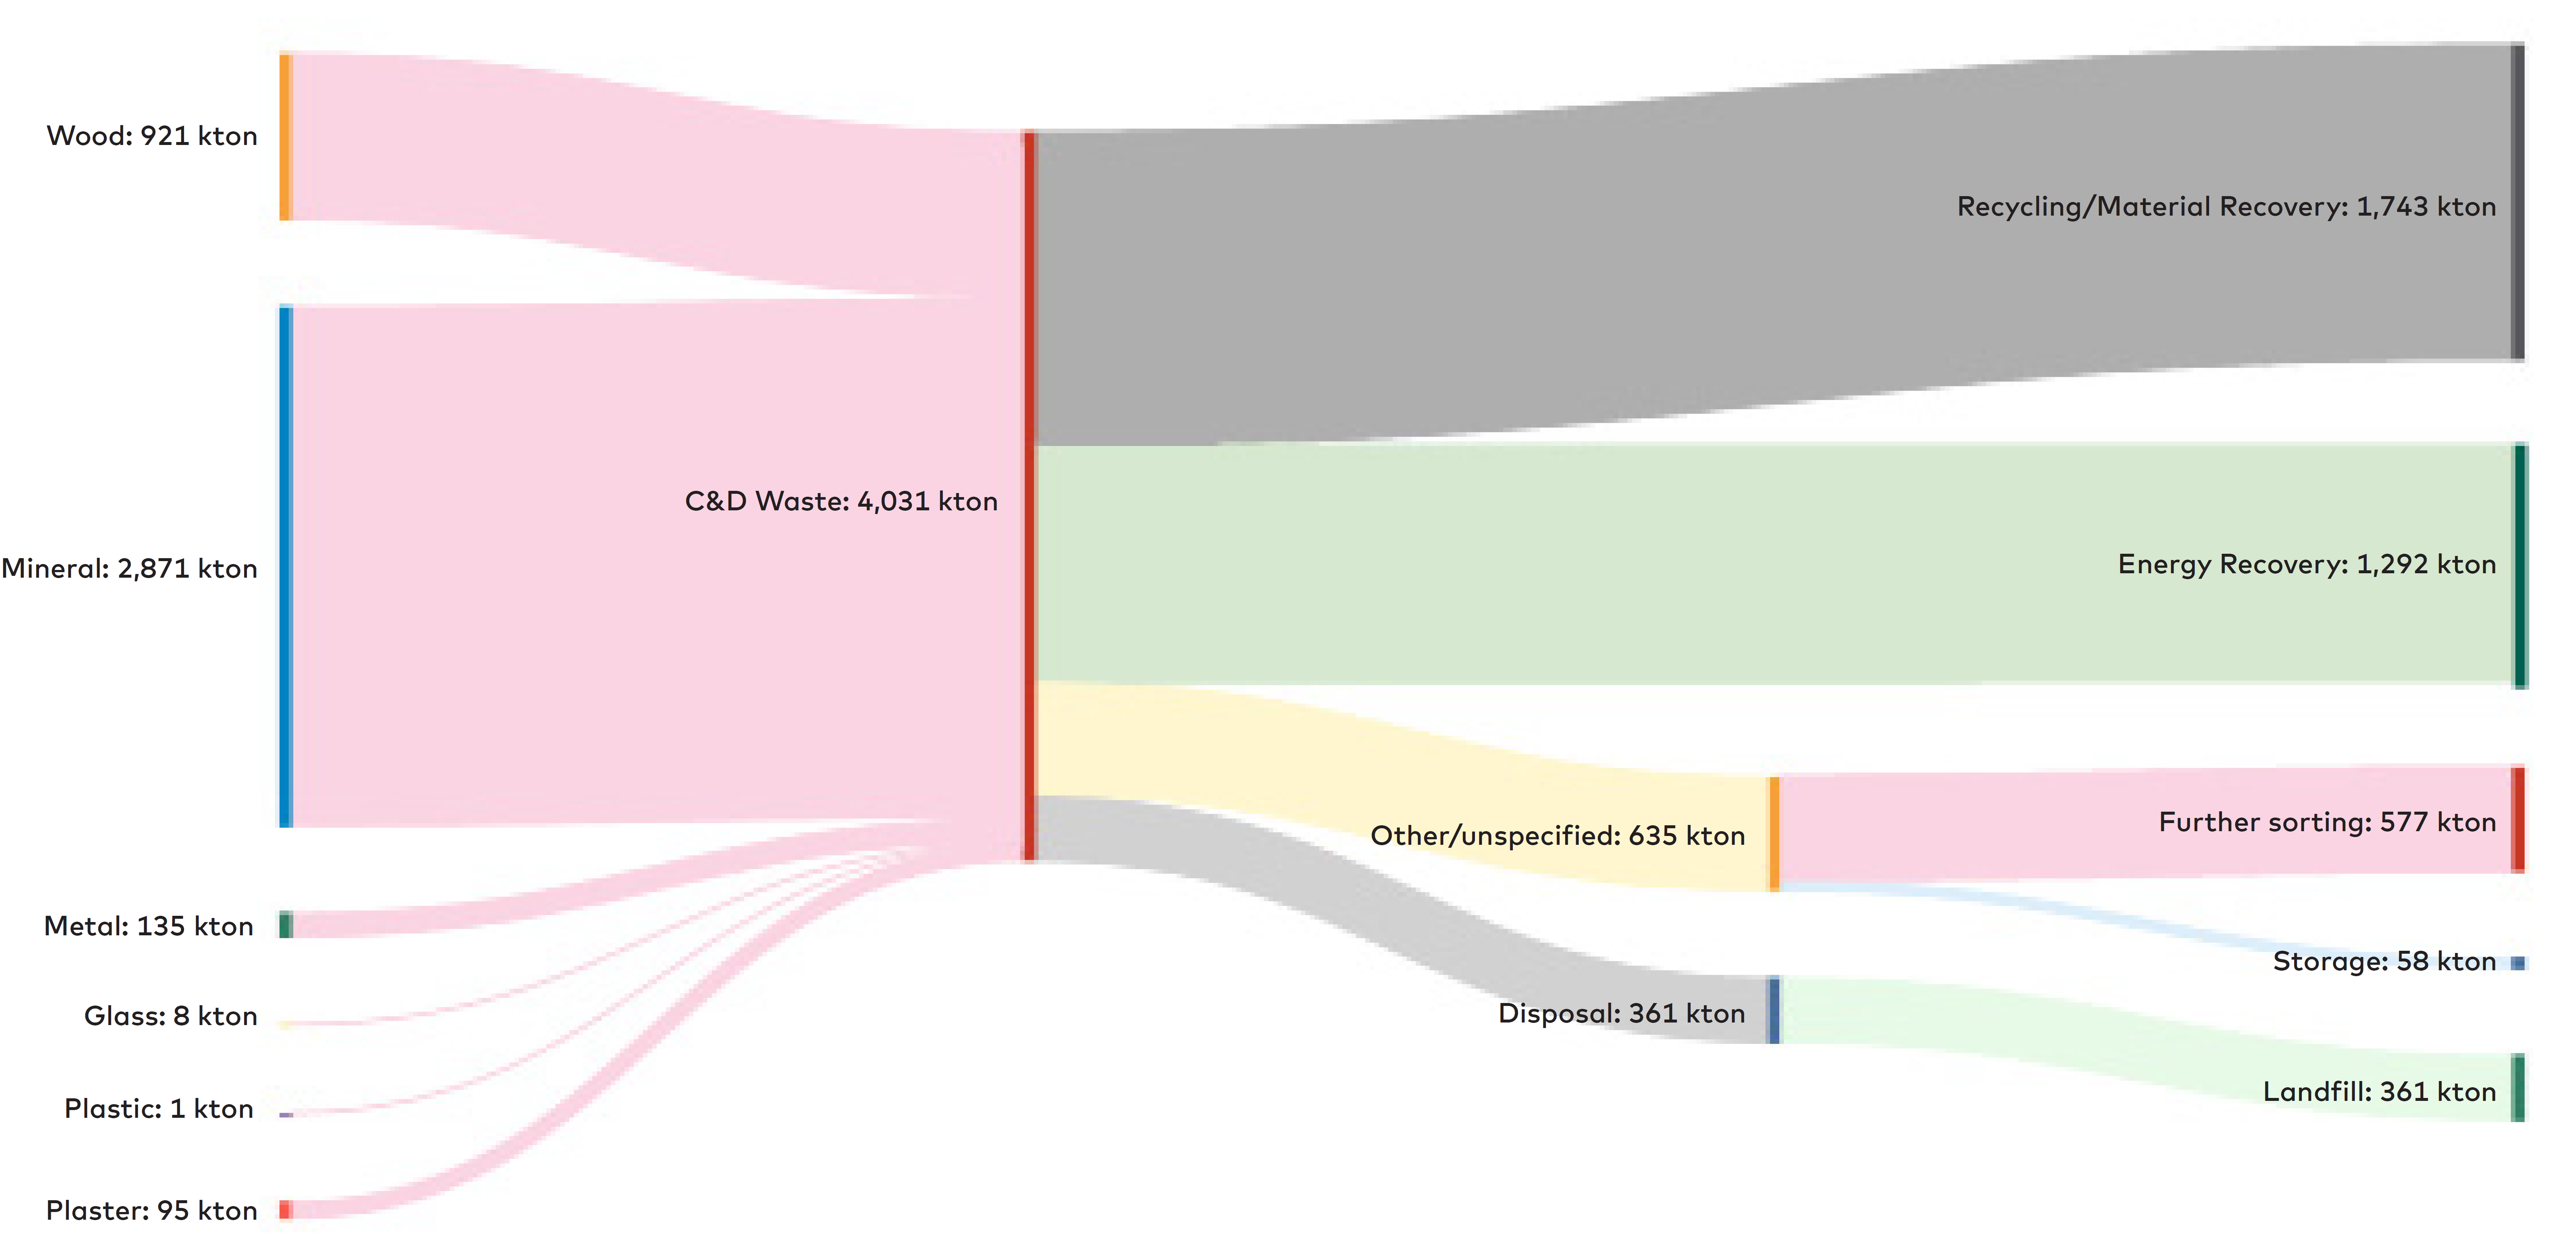
Figure 12: Material flows for CDW in Sweden for the year 2020. Data on the amounts of CDW was received from The Swedish Environmental Research Institute, IVL, for the year 2020
IVL 2023. Personal communication, Jan-Olov Sundqvist.
2.2 CDW treatment processes in the Nordics
This chapter summarizes the typical CDW treatment process in different Nordic countries on a general level. In addition, the current situation of treatment methods for different CDW fractions are evaluated for each country. The largest CDW treatment facilities are listed in Appendix 1. Lists of CDW treatment facilities.
Concrete-, tile-, wood- and metal waste represents the majority of the overall CDW stream. Smaller waste fractions include plastics, glass, plaster/gypsum, mineral insulation, bitumen, ceramics and miscellaneous.
Within the construction and demolition sector, a distinction is drawn between construction waste and demolition waste. Construction waste includes waste from installation and assembly, while demolition waste arises from renovation or complete demolition activities. The degree of purity in construction and demolition waste can vary significantly. Nevertheless, the overall waste management process remains consistent for both construction and demolition
Swedish Construction Federation. 2019. Resource and Waste Guidelines for Construction and Demolition. Available: https://byggforetagen.se/app/uploads/2020/02/Resource-and-waste-guidelines-2019.pdf.
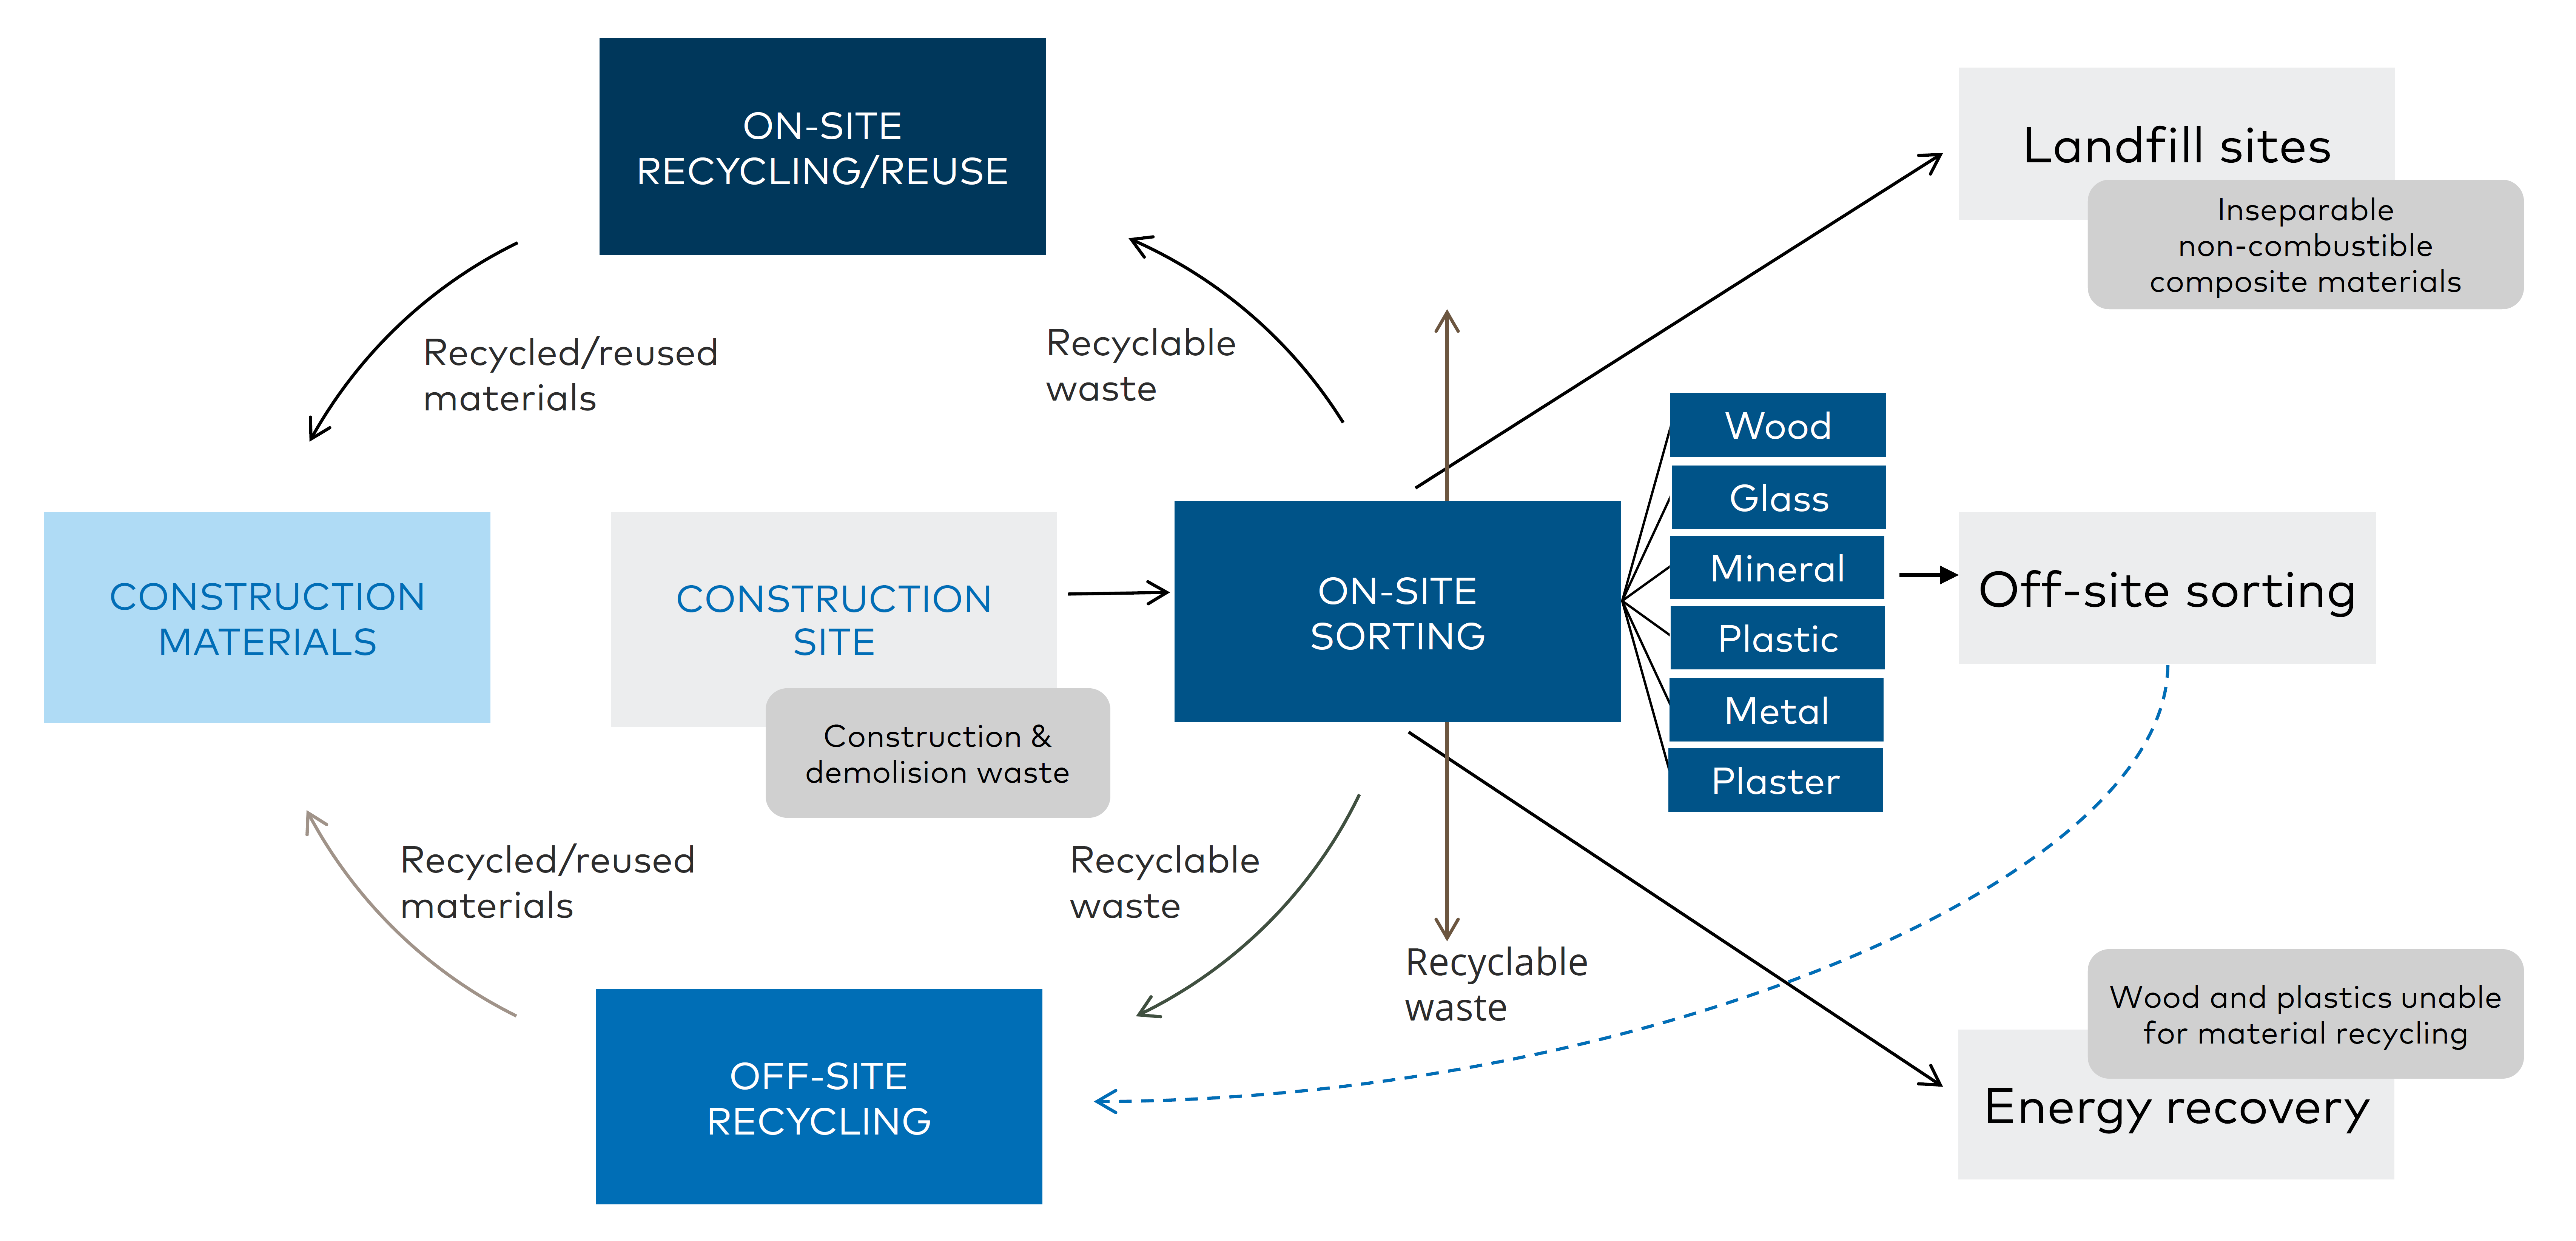
Figure 13. The relationship between on-site and off-site material flows.
CDW recycling can generally be categorized into two main approaches: off-site and on-site recycling. The relationship between on-site and off-site recycling refers to the interdependence of recycling efforts that occur within a facility or property (on-site) and recycling efforts that occur outside of the facility or property (off-site), see Figure 13. On-site recycling establishes the foundation for off-site recycling by reducing the amount of waste that needs to be transported off-site and by separating materials for recycling. Off-site recycling complements on-site recycling by processing the materials that cannot be recycled on-site. If sorted waste cannot be recycled or reused, it may be destined for landfill or energy recovery
Naturvårdsverket. 2023. Bygg- och rivningsavfall. Available: https://www.naturvardsverket.se/vagledning-och-stod/avfall/bygg--och-rivningsavfall/
Wastes containing harmful substances are to be separated from other non-hazardous waste fractions as described in EU waste directive. In demolition sites pre-demolition audit is typically carried out in all Nordics. Typically, a pre-demolition audit includes also waste audit where potential reusable or recyclable materials are determined and materials containing hazardous substances are identified so that they can be demolished separately.
Currently the main methods in the Nordics for treating CDW are energy recovery and material recovery (e.g., use of mineral fraction as backfilling material) or landfilling. Even though these methods have a low rank in the waste hierarchy they are typically the most cost effective especially for smaller scale renovation and demolition projects. Larger projects have typically more comprehensive on-site separation of CDW materials compared to smaller sites. The smaller sites typically only separate largest streams like mineral, wood and metals and rest mixed CDW is transported for further treatment. The current primary treatment methods for different CDW fractions in different Nordic countries are summarized Table 5.
Reuse | Recycling | Material recovery | Energy recovery | Disposal | |
Mineral (concrete, tiles, etc.) | DA, FI, IS, NO, SE | ||||
Metal | DA, FI, IS, NO, SE | ||||
Glass | DA, FI, NO, SE | IS | |||
Wood | DA | FI, IS, NO, SE | |||
Plastic | DA, FI, IS, NO, SE | ||||
Plaster | DA, NO, SE | FI, IS | |||
Mineral insulation wool | DA | FI, IS, NO, SE | |||
Reject from mechanical CDW separation | FI, IS, NO |
Table 5. Summary of the main CDW treatment methods for different fractions in Nordics
2.2.1 Denmark
For years, Denmark has been characterized by a high degree of material recovery, which is mainly due to the use of crushed construction waste as a substitute for primary raw materials. In the 2010s, attention was drawn to hazardous substances in construction materials and the waste legislation was tightened to increase the sorting and quality of the construction waste.
Now, prior to demolition and renovation work, existing buildings and constructions are surveyed, and the presence of hazardous materials are mapped. These materials are then handled in a separate waste stream in the very beginning of the projects. In the last few years, some builders have expanded the surveys with mapping of resources to identify and highlight materials suitable for reuse or recycling. Architects are increasingly focusing on incorporating recycled materials into new constructions.
Waste generated from demolition work, renovation work and maintenance work on buildings and facilities must be reported to the local authorities prior to starting the work and must be sorted on site if it amounts to more than 1 ton of waste, or if the work involve the replacement of double-glazed windows that may have been manufactured in the period 1950 to 1977. If the total amount of waste from a demolition or construction site is expected to be less than 1 ton, on-site sorting is not mandatory. In that case, the waste must be sorted at an off-site facility. The waste-producing company may let unsorted construction and demolition waste, which is suitable for material recovery, be sorted at a suitable registered sorting facility.
Most of the construction waste is handled by large private waste management companies that operates nationwide and have large facilities for treatment of waste (sorting, shredding, crushing etc.). In many cases concrete is crushed by mobile machinery and backfilled on site or used on other projects close by. In Denmark it is usually cheaper to sort and recycle materials, since the landfill fees are very high. There is an emerging market for reusable construction materials but as of today the volume is small and the market is hampered by lack of uniformity and difficulties to comply with building code requirements.
For some specific sorted construction materials (like glass, gypsum, and metals) close to 100 % of the generated waste is recycled in the production of new materials, e.g., glass insulation wool (Isover), glass packaging (Ardagh) and new plasterboards. Metals are largely exported for recycling. Wood waste primarily is recycled into chipboards, but the amount depends largely on the market prices and can therefore fluctuate between recycling into chipboard or used for energy recovery.
The summary of current treatment methods for different CDW fractions are shown in following table below. A list of the largest treatment facilities in Denmark are shown in Appendix 1.
Table 6. Summary of current CDW fraction treatment methods in Denmark
 | Reuse | Recycling | Material recovery | Energy recovery | Disposal | Comment |
Wood | ● | ●●● | - | ●●● | - | Wood waste, both treated and untreated, are mainly used for recycling and energy recovery. A large proportion is recycled and used in the production of particleboards. Small scale reuse of high-quality untreated wood in new constructions. |
Metals | ● | ●●● | - | - | - | Majority of the metals ends up in recycling. Reuse of steel structures has been done in small scale, mainly project-wise. |
Plastic, PVC | - | ●●● | - | - | ●●● | Hard PVC is collected and recycled through VinylPlus (the European PVC industry), and soft PVC is landfilled. |
Plastic, other | - | ●● | - | ●●● | - | On large building sites soft and hard plastic waste is collected for recycling. Plastic waste from smaller sites is energy recovered. Plastic mixed with other waste or plastic compounds are energy recovered. |
Plaster/gypsum | - | ●●● | - | - | ● | Dry gypsum material is recycled and used in the production of new plasterboards. Wet gypsum is landfilled. |
Mineral insulation wool | - | ●●● | - | - | ●● | Mineral insulation wool is recycled and used in the production of new insulation materials. Some of the glass wool insulation is recycled and used in the production of Leca – lightweight expanded clay aggregate. Insulation mixed with other materials is landfilled. |
Reject from mechanical CDW separation | This fraction is not part of the waste stream in DK. | |||||
Mineral (concrete, tiles, etc.) | ● | - | ●●● | - | - | Concrete and tiles are material recovered. Bricks laid in lime mortar can be reused. Bricks laid in cement mortar is difficult to separate and is material recovered. |
Glass | - | ●●● | - | - | - | Glass is recycled in the production of new glass and in the production of glass wool insulation. |
- Seldom used. ● Small scale use ●● Medium scale use ●●● Large scale use
2.2.2 Greenland
Greenland is a vast country with a small and dispersed population. The amount of generated waste is relatively small. All kinds of waste in Greenland have traditionally been disposed by means of discharge to the sea or by landfill.
Since the late 1990s the waste system in the settlements and in the smaller towns have typically consisted of a landfill and an incineration plant, as well as some system for collecting hazardous waste.
In 2019 the five municipalities joined and founded a national waste management company with the purpose of creating solutions for the handling of all kinds of waste in Greenland. This includes the building of two new incineration plants in Nuuk and Sisimiut which will replace the current six regional incinerators and the many outdated small settlement incinerators. Waste suitable for incineration will be collected in the villages and settlements and shipped to the new larger facilities.
Other types of waste will be sent for processing to other locations in Greenland or abroad. The waste will have to be shipped or airlifted, as the villages and settlements do not have interlinking roads. This combined with a relatively small production of waste make many of the solutions used in continental Europe unsuitable since the economic costs will be disproportionately high.
As of today, there are no public or private companies approved for the reception, treatment, or recycling of any type of waste. When asked about recycling of construction waste in Greenland two of the five municipalities answer that they have no knowledge of reuse or recycling of construction and demolition waste in connection with the renovation of existing buildings or for the construction of new buildings.
Metal waste is collected and shipped for treatment in Denmark. Wood and plastic waste is incinerated at local waste incineration plants and glass waste, mineral waste and gypsum waste is landfilled locally. Some mineral waste (concrete) is crushed and used locally as backfilling.
The largest bank in Greenland, Grønlandsbanken, plans to offer loans on more favourable terms for environmentally friendly and sustainable building-/renovation projects.
All hazardous waste (such as waste oils, chemical, paint residues and electronics) throughout Greenland is sorted and then sent to Denmark for further processing.
Waste that is handed over to the municipality's waste reception facilities must, as a minimum, be sorted into the following waste fractions:
- Landfillable waste (asbestos, soft PVC, insulation, bricks, glazed bricks)
- Tires without rims
- Glass and bottles
- Iron and metal
- Soil
- Environmentally hazardous waste
- Waste suitable for combustion
The only CDW-fraction that is systematically collected for recycling is iron and metal. All other fractions are incinerated or landfilled depending on the available local facilities.
2.2.3 Faroe Island
The municipalities are responsible for pickup and waste handling in Faroe Islands. The capital and largest municipality, Tórshavn, has its own waste handling entity, KB. All other municipalities have a common waste handling company, IRF. Both KB and IRF have an incineration plant and work together on landfilling and handling of recycled fractions.
In general, there are facilities for sorting and handling of cardboard and paper, soft plastic waste, aluminium beverage cans, iron scrap and other metals, glass, and hazardous waste, which is collected for recycling and shipped off for recycling or other treatment. To some extent, glass is also landfilled. Building materials such as concrete slam, PVC, window glass, mineral and glass insulation and asbestos, are generally landfilled. Excess soil and stones are landfilled. The biggest fraction that is systematically collected is iron and metal. The collection of plastics and glass waste has not been systematized and hence consist of a modest quantity.
Although older houses are demolished from time to time, in most cases, older houses and industrial buildings are refitted and reused for new purposes. No legislatively controlled mapping of heavy metals and environmentally hazardous waste of buildings takes place prior to reuse or demolition and landfilling.
2.2.4 Finland
Demolition waste treatment process varies in Finland depending on the size of demolition site. Typically, biggest waste fractions like mineral (concrete and tiles), wood and metals are separated on site with excavator. In larger demolition sites the concrete waste can be crushed on site with a mobile crusher or pulverized with excavator. Alternatively, the concrete waste fraction can be transported to stationary treatment plant where it is refined as concrete crush. A lot of demolished material ends up in mixed fraction which is delivered to mechanical treatment plant where it is separated. Certain materials such as gypsum waste is difficult to separate afterwards from mixed waste as it pulverizes easily.
In practice, the separate collection of different waste fractions does not realize in construction and even less in demolition sites, even though it is obligated in the legislation. The separate collection obligation is not generally supervised or there is no penalty for neglecting the obligation. Overall, the costs are main driver to determine what happens to the demolition waste. Largest fractions, such as metals, wood and concrete, have existing recycling or recovery practices and reasonable or even positive price for recycling as a material or energy recovery. However, the waste fractions which requires more work to separate in the demolition site, such as plastics, mineral wool or gypsum waste, typically ends up in mixed CDW and are used for energy recovery or deposited to landfill instead of recycling. The separate collection of many waste fractions would increase the overall costs for demolition projects. Especially the public demolition projects are typically tendered based on lowest price.
As the recycling rate targets for CDW are not achieved, new recommendations and practices arise in a fast pace. Pre-demolition audit is voluntary in Finland, but it is recommended for all buildings over 100 m2. Only the mapping of hazardous substance and asbestos is currently mandatory for all buildings which are constructed or renovated before 1994. Emerging markets in reuse and recycling can be seen, even though still in relatively small scale compared to total amount of CDW.
Finland has variety of treatment plants for mixed CDW. Municipal waste management companies are responsible to arrange waste management for CDW from households, for example waste from renovations. Larger CDW streams from building demolition and construction are typically source separated and delivered for utilization to private waste management companies. Common practice is that the contractor does only limited source separation (for example separation of steel and wood) and sends the mixed CDW to the other private waste management companies for further treatment and recycling. For example, mineral waste fractions, such as concrete and brick waste, are quite often utilized by the demolition contractors themselves for backfilling or other infra construction purposes.
The biggest mixed CDW treatment facilities are located near the major centre of population in Finland (Helsinki metropolitan area, Turku, Oulu and Tampere). The major CDW treatment and recycling plants in Finland are listed in the appendix 1. Especially for the mixed CDW treatment and recycling plants the list is not comprehensive as there are plenty of smaller enterprises which separates and treats mixed CDW around Finland. Typically, the smaller treatment facilities do not have stationary treatment/separation lines and therefore the separation is mainly done with excavator.
The general processing for the different CDW materials is described below:
- Untreated, treated and impregnated wood are typically separated on-site. Untreated wood can be directed to recycling, but still majority of all wood CDW ends up in energy recovery. New recycling alternatives, such as biochar production, are upcoming in Finland. Treated and impregnated wood goes mainly to energy recovery facilities with permission to handle this fraction.
- Mineral CDW, especially concrete waste and bricks, can be used for certain infra construction applications if they fulfil given requirements concerning hazardous substances and technical requirements and they are crushed on site or sent to stationary crushing stations. Mineral waste which is not suitable for infra construction purposes are used as a backfill in landfill structures.
- Mineral insulation wool waste from demolition typically ends up in mixed CDW fraction and in landfills. Small amounts of mineral wool waste have been separated and directed to recycling. However, Finland currently lacks large-scale recycling alternatives for mineral insulation wool which origins from demolition or renovation activities. For new constructions there are collection systems for excess mineral wool insulation materials.
- Metal is sorted out and is delivered for recycling, the metals are melted and used in new products of metal. Metal products can also be reused but it is still relatively small-scale operation.
- Glass is sorted out and is delivered for material recycling and production of new products (e.g., foam glass), the rest ends up in landfill.
- Plastic waste from demolition sites typically ends up in mixed CDW and it is sorted off-site in mechanical sorting facilities. The new construction sites, at least larger ones, have separate collection for packaging plastics. Overall majority of plastic CDW ends up in energy recovery, small amounts end up in recycling and landfill (e.g., majority of PVC).
- Separation of plasterboard waste on-site in demolition sites is typically considered too expensive and therefore it mainly ends up in mixed CDW fraction where only small amounts can be separated off-site for recycling. Plasterboard waste collection from construction sites is easier and it is done in some extent. Good quality plaster waste can be sent to plasterboard production facilities. Currently most of the plaster waste ends up in landfill and small fraction to incineration.
The main treatment methods for different CDW fractions in Finland is summarized in Table 7.
Table 7. Summary of current CDW fraction treatment methods in Finland
 | Reuse | Recycling | Material recovery | Energy recovery | Disposal | Comment |
Wood | ● | ● | - | ●●● | - | Wood waste, both treated and untreated, are mainly used for energy recovery, only minor part is recycled or reused. |
Metals | ● | ●●● | - | - | - | Majority of the metals ends up in recycling. Reuse of steel structures has been done in small scale, mainly project-wise. |
Plastic, PVC | - | ● | - | ● | ●●● | PVC plastics ends up mainly in landfills. A small fraction ends up in energy recovery even though it is problematic in energy recovery due to its chloride content. Recycling is possible but only few companies accepts separately collected PVC waste (e.g., pipes). Overall, FI lacks wide collecting network or commercial recycling facilities for PVC plastic. |
Plastic, other | - | ● | - | ●●● | ● | Many other plastic grades are also technically possible to recycle the dirtiness and mixing with other waste fractions make it difficult to recycle and only few facilities are currently able to process it. Energy recovery is often more cost efficient. A small fraction ends up in landfill. |
Plaster/gypsum | - | ●● | - | ● | ●●● | Gypsum waste is technically recyclable, but the separation of gypsum waste during the demolition is considered problematic. Relatively small proportion of gypsum waste ends up in recycling in FI. Most of the material ends up in landfill as a part of mixed CDW and small amounts ends up also in energy recovery as a part of mixed CDW. |
Mineral insulation wool | - | ●● | - | - | ●●● | Mineral wool waste from demolition has currently only minor recycling options, which are mainly still under development. One example is using as raw material for geopolymers. Majority of the material ends up in landfills as it does not possess significant energy value. Mineral wool from construction sites can be collected and recycled back in production process. |
Reject from mechanical CDW separation | - | - | - | - | ●●● | Low calorific value inhibits energy recovery and material is typically disposed in landfills. Some research has been done about the recycling of the materials, but it lacks any potential large scale recycling options. |
Mineral (concrete, tiles, etc.) | ● | ● | ●●● | ●● | ●● | In FI most of the mineral CDW fraction is recovered or recycled as a material in infra construction. Small scale reuse of bricks and concrete elements have been conducted, mainly in pilot-projects. Smaller amounts ends up in energy recovery together with mixed CDW or in landfill. |
Glass | ● | ●●● | - | - | ● | Most of the glass waste from construction and demolition activities is recycled as a raw material for the new plate glass, foam glass or glass wool insulation production. Occasionally some windows and frames are reused. |
- Seldom used. ● Small scale use ●● Medium scale use ●●● Large scale use
2.2.5 Åland
In Åland, CDW is collected by municipal waste management companies, as well as private actors. The biggest waste companies for CDW on Åland are Svinryggen Deponi Ab and Ålands Renhållning Ab. Svinryggen is publicly owned waste management company and landfill for inert non-hazardous material. Ålands Renhållning Ab, which is a part of Transmar, is the largest private waste company handling CDW
Personal communication Jesper Svanfelt, Svinryggen Deponi Ab. 2023. https://www.svinryggen.ax/
Personal communication Jonas Karlsson, Ålands statistik- och utredningsbyrå. 2023. https://www.asub.ax/sv/statistik/avfallsstatistik-2020
Personal communication Robert Nylund, Ålands Renhållning Ab / Transmar. 2023. https://www.renhallningen.ax/
ÅSUB Ålands statistik- och utredningsbyrå. 2022. Avfallstatistik 2020. Statistik 2021:5, Ålands officiella statistik. Available: https://www.asub.ax/sites/default/files/statistics/avfall20_0.pdf
2.2.6 Iceland
In Iceland, it is in the responsibility of the holder of waste to ensure that waste is moved to appropriate treatment, either it is moved directly to recovery, or to a collection or reception centre
Í átt að Hringrásarhagkerfi – ný stefna í úrgangsmálum. Stjórnarráðið. Available: https://www.stjornarradid.is/Stefna_umhverfis_og_auðlindaráðherra_í_úrgangsmálum.pdf
The municipal waste management companies are responsible to arrange waste management for CDW occurring from households, such as waste accumulated from home renovation projects, and it is therefore the responsibility of the municipalities to ensure that there are waste reception stations available for the public.
For larger quantities of construction and demolition waste, such as from construction projects or from businesses, it is most commonly a private service provider that is chosen and appointed to take care of the waste management. The waste is usually pre-sorted at the job site into appropriate containers, in which the service provider then picks up and transports to appropriate facilities. As the waste categories have different processing fees, it is in the economic interest of the construction contractor/businesses to do the initial waste sorting the correct way.
The private service providers are a diverse group of contractors and operators that offer waste services. Some of these service actors specialize in a specific field and have a license for the reception, transport of waste or other treatment of a specific type of waste while others undertake a wide range of waste services for almost all types of waste. The service providers do business with each other and there are many examples of waste being transferred between parties. Parties that handle waste must have a work permit from the health committee or the Environmental Agency in Iceland according to the nature of the treatment, and the best available techniques should be used for waste management.
Service providers and recycling companies which handle the waste submit a report to the Environmental Agency on the waste they handle, with information on types of the waste and quantity, origin by industry category and municipalities and disposal of each material. Waste producers who dispose of their own waste at the production site or export their own waste for further treatment must submit a similar report. The Environment Agency therefore has an overview of registered waste for each municipality, both for households and legal entities.
Iceland has several waste facilities located around the country, both public and private facilities, but not all treat the same categories of construction and demolition waste. Some only handle a few materials, while other plants have the capacity of taking care of more categories of CDW. The main receivers of construction and demolition waste in Iceland are:
- Public landfills
- Disposal sites for inert waste
- Composting plants
- Mines
- Waste incineration (without energy recovery)
- Scrap metal companies
- Various private service providers
- Other reception points, e.g., occasional landfills in the sea or other
General landfill sites and various service providers are the ones that handle the largest part of construction waste in Iceland. However, it is not known exactly how big a part of the total amount of construction wastes these service providers handle, due to the registration of the amount of construction waste with them is not publicly available. The major CDW treatment facilities in Iceland are listed in Appendix 1. The main treatment methods for different CDW fractions are summarized in Table 8.
Table 8. Summary of current CDW fraction treatment methods in Iceland
 | Reuse | Recycling | Material recovery | Energy recovery | Disposal | Comment |
Wood | - | ●● | ●● | ●●● | ● | Untreated wood waste is mainly used for energy recovery, as a carbon source in the production of silicon metal, but some treated wood waste is recycled through composting. Treated wood waste is recovered through backfilling at landfill sites (e.g. used as biofilter against odour pollution). |
Metals | - | ●●● | - | - | - | Majority of the metals are exported abroad for material recycling. |
Plastic (plastic without processing fee & Styrofoam from C&D) | - | ●● | - | ●● | - | The majority of the plastic that accumulates in IS (not only plastic from CDW) is pressed and baled at the reception and sorting facilities. The plastic is then shipped abroad, for further material recycling, or energy recovery. PET, LDPE, HDPE and PP plastic is shipped abroad for recycling, while other plastic types, e.g. PVC, PS, EPS and other mixed plastics, are shipped abroad for energy recovery. |
Plaster/gypsum | - | - | - | - | ●●● | Gypsum waste is technically recyclable, but the separation of gypsum waste during the demolition is problematic. All of the gypsum waste in IS ends up in landfill and is kept at separate location at the landfilling sites. |
Mineral insulation wool | - | - | - | - | ●●● | Mineral wool waste from demolition has currently only minor recycling options, which are mainly still under development. There is possibility to reuse offcuts from new construction projects instead of disposing of it. However, there is little statistic on how much of the material is reused in IS. The majority of the material ends up in landfills as it does not possess significant energy value. |
Mineral waste (concrete, tiles, etc.) | - | - | ●●● | - | ● | Mineral waste from CDW (classified as inert waste) goes into material recovery as it can be used for backfilling in various settings, such as in construction projects, which reduces the need for mining. A small fraction ends up in landfill. |
Glass | - | - | ●●● | - | ● | Glass from CDW is classified as mineral waste and is therefore treated as mineral waste as described above, where the majority is recovered and used in backfilling operations. |
Mixed construction and demolition waste | - | - | - | ● | ●● | Heterogeneous material which consists mainly of miscellaneous wastes from construction and demolition sites. The materials are sorted manually at the sorting centres, where e.g. large metal parts, wood, recyclable plastics and minerals are sorted into the right material category. For the leftover material which is deemed unsortable is shredded, put through a magnetic separator, baled and placed at the landfill sites. |
Asphalt waste | - | ●●● | ● | - | ● | The asphalt waste is reused in road constructions. Small fraction is recovered through backfilling activities or is disposed at landfilling sites. |
Waste including asbestos | - | - | - | - | ● | The waste is landfilled at specific location at the landfill sites to avoid contamination of asbestos particles. |
- Seldom used. ● Small scale use ●● Medium scale use ●●● Large scale use
2.2.7 Norway
Waste management in the construction sector in Norway is well regulated in the Building Regulation (TEK), which requires the preparation of waste plans before new construction and renovation or before demolition starts. The sorting takes place in large scale on the site for all types of projects if the project is not too small (for projects over 300 m2 for new buildings, over 100 m2 for changes or projects generating over 10 tons of construction and/or demolition waste). Each fraction is collected and sent to reception for the waste. If there is lack of space on the site for many containers for the sorting of each fraction, there may be performed sorting of waste at the reception site. Sorting at the waste reception site will not be accepted as a fulfilment of demand to 70 % sorting of the construction and demolition waste.
Byggteknisk forskrift (TEK17). Direktoratet for byggkvalitet. Available: https://www.dibk.no/regelverk/byggteknisk-forskrift-tek17
For construction waste from sites of new buildings or other constructions (roads, harbours and likewise) it is a similar process with sorting of hazardous waste for no reuse and other waste sorted into fractions for further transport to reception of waste and next for reuse, recycling, incineration, or for landfill.
At the reception site for waste the different fractions will be treated as needed with removing of materials that is not sorted in the correct fraction, removing materials for a cleaner or more homogenous fraction, crushing, if necessary, sort for transport to handling the fraction in another site in Norway or transport to Europa, or handling the fraction at the place. The fractions can be delivered for incineration (energy recovery), reuse, recycling of materials or landfill. Norway do not have an additional landfill tax, which is different from most other Nordic countries.
The general processing for the materials is described below:
- Untreated wood from construction and demolition waste is sent to energy production by incineration. Some amounts can be used for new production of for example chipboard. Treated wood, like painted, varnished and pressure treated (impregnated) wood is delivered to waste facilities with permission to handle this fraction.
- Materials with minerals, like concrete, brick and stone, can be used as backfilling if proved to be free from hazardous substances. Waste facilities will crush the fraction, or this fraction can be crushed at the construction site and be used if needed there as backfilling. If the fraction has a small amount of hazardous substances, it can be used if permission is given after application to Miljødirektoratet/Norwegian Environment Agency. If the fraction is under a given limit for several hazardous substances, it can be used to replace virgin materials, without need to seek for permission, like in backfilling. The limits values are regulated in legislation “avfallsforskriften kap. 14a”. If the amount of hazardous substances is so high that the materials will be categorized as hazardous waste it must be transported to waste facility which is approved for handling this kind of waste. Surplus of insulation made of stone or glass is reused or recycled by delivering the fraction back to the producer or to a recycling site witch also delivers to the producer. Most of the fraction minerals goes to material recovery and landfilling
- Metal is sorted out and is delivered for recycling, the metals are melted and used in new products of metal. Metal products can also be reused but it is still relatively small-scale operation.
- Glass is sorted out and is delivered for material recycling and production of new products (e.g., glass wool), and some goes to landfill. All glass with hazardous substances must be delivered to waste facilities with permission to handle this waste. In Norway, insulating glass units containing PCB, are under an EPR scheme. Ruteretur AS operates as the approved nationwide take-back system for discarded insulating glass units containing PCBs in Norway. Norsk Gjenvinning AS work as a contracting company to recycle the glass and breakdown hazardous components through incineration with energy recovery.
- Plastic is sorted in several fractions, of which some goes to energy recovery, some goes to recycling and production of new products and some goes to landfill.
- Gyspum waste is sorted out and it is delivered for recycling to producer of plasterboard, after it has been crushed and cleaned to plaster powder. Some also goes to incineration, and some goes to landfill.
When a container of waste is delivered to a waste reception the content will be controlled to make sure that it is the right category name that has been used on the fraction. It will be controlled visually, by documents and by random samples. If needed the fraction will be sorted further done manually or with crane and claw.
Fractions that go to energy production will be cleaned for unwanted materials and crushed to the wanted size for the incinerator the fraction is sent to. The fractions used for this is combustible waste and combustible wood (meaning untreated wood).
There are seven large waste incineration plants in Norway, i.e., plants that burn more than 100,000 tonnes of waste per year. They incinerate household waste and some commercial waste. The seven large facilities are in Oslo, Stavanger, Bergen, Trondheim, Kristiansand and Ålesund
Miljøstatus. 2022. Avfallsforbrenning med energiutnyttelse. Available: https://miljostatus.miljodirektoratet.no/tema/avfall/avfallshandtering/avfallsforbrenning-med-energiutnyttelse/
Fractions that are delivered for material recycling will be handled with removal of unwanted materials. Some fractions will be crushed, like concrete, asphalt, bricks and plaster. Others will be cut into smaller parts to make it easier to handle, like wood and metal. Metal will be sent to facilities which will melt it and use it or sell it for new production. If materials are suitable for reuse, they will be sorted manually and registered in different database depending on which waste reception the material is delivered to.
For construction and demolition waste there are facilities and sites with databases like Loopfront, Resirquel, Rehub, Sirken. These companies receive materials from demolition and rehabilitation projects, and excess material from construction of new buildings. The responsibility for quality control of the reused products has been moved from the seller to the buyer, which increases availability of products for reuse. The materials and products are stored until sold for reuse.
The current treatment methods for different CDW fractions in Norway are summarized in the following table (Table 9). The list of the major CDW treatment facilities in Norway are listed in Appendix 1.
Table 9. Summary of main CDW treatment methods in Norway.
 | Reuse | Recycling | Material recovery | Energy recovery | Disposal | Comment |
Wood | ●● | - | ●●● | - | Wood waste, both treated and untreated, are mainly used for energy recovery. Latest data shows that more material from wood waste is used for material recovery than previous years. Material recovery of wood waste is used in production of particleboards. Data from amount of reuse of wood and wood materials is not available. | |
Metals | ● | ●●● | - | - | - | Majority of the metals ends up in recycling. Reuse of steel structures has been done in small scale, mainly project-wise. |
Plastic | - | ●●● | - | ●● | ●● | Based on the statistics, in NO around 50% of plastic CDW is delivered to recycling and another half ends up either in energy recovery or landfill. |
Plaster/gypsum | - | ●●● | - | - | ●●● | In NO around half of the plaster waste ends up for material recycling for the new plaster board production and another half is deposited to landfill. |
Mineral insulation wool | - | ●● | - | - | ●●● | Mineral wool waste from demolition has currently only minor recycling options, which are mainly still under development. In NO majority of the material from demolition sites ends up in landfills as it does not possess significant energy value and lacs recycling alternatives. Excess mineral wool from construction sites can be recycled back into the production process. |
Reject from mechanical CDW separation | - | - | - | - | ●●● | Mixed residual CDW ends up mainly in landfill in NO. However, mixed CDW disposal is expensive and therefore the residual fraction is to be minimized by separating materials on-site when possible. |
Mineral (concrete, tiles, etc.) | - | ● | ●●● | - | ●● | In NO the majority of mineral waste ends up in material recovery such as backfilling. Bricks laid in lime mortar can be reused. The rest goes to landfill. |
Glass | - | ●●● | - | ●●● | ●● | In NO around 35% of glass ends up in recycling, and another 35% ends up in energy recovery. The energy recovery part includes thermal treatment of PCB containing fraction of glass. Around 15% landfills and last 15% in other recovery. Recycled glass is used in the production of new glass and insulation of glass wool. Reuse of windows are considered but typically they are not reused. |
- Seldom used. ● Small scale use ●● Medium scale use ●●● Large scale use
2.2.8 Sweden
In Sweden, waste from construction and demolition (CDW) represents approximately 40 % of all generated waste, when waste from the mining industry is excluded. Of this, approximately 5 % of CDW is hazardous material. Sweden reports a material recovery rate of approximately 50 % for CDW excluding soils and excavation masses
Naturvårdsverket. 2022. Bygg- och rivningsavfall-statistikblad. Available: https://www.naturvardsverket.se/49d418/globalassets/amnen/avfall/statistikblad-bygg-och-rivningsavfall.pdf
Prior to demolition, identification of hazardous materials and components is (exceptions may occur) required, as well as identification of possible material recovery and what the recovery process will look like. Either permission from, or a notification to, the local authorities is required prior to demolition.
Naturvårdsverket. 2023. Vägledning för bygg- och rivningsavfall. Available: https://www.naturvardsverket.se/vagledning-och-stod/avfall/bygg--och-rivningsavfall/
Hazardous CDW, such as asbestos and impregnated wood, demands specialized handling and must be transported to a treatment facility with permission to receive hazardous waste.
In January 2023 all CDW generated from households became municipal responsibility. Municipalities exclusively have the right to transport and treat waste within their waste management jurisdiction. This means that for private individuals renovating at home, waste can only be professionally transported and handled by the municipality or contractors authorized by the municipality
Avfall Sverige. 2022. Annat avfall än kommunalt avfall. Available: https://www.avfallsverige.se/fakta-statistik/avfallsstatistik/annat-avfall-an-kommunalt-avfall/
CDW is received and treated by private waste management companies, as well as by public actors. Facilities often accept all fractions of CDW, and the mixed CDW is usually mechanically sorted, crushed and stored before being delivered to recycling or other treatment. Smaller companies often rely on municipal recycling centres. The bulk of sorted waste is then transported for further treatment
Naturvårdsverket. 2023. Vägledning för bygg- och rivningsavfall. Available: https://www.naturvardsverket.se/vagledning-och-stod/avfall/bygg--och-rivningsavfall/
Naturvårdsverket. 2022. Bygg- och rivningsavfall-statistikblad. Available: https://www.naturvardsverket.se/49d418/globalassets/amnen/avfall/statistikblad-bygg-och-rivningsavfall.pdf
The wood waste from construction and demolition is most often used for energy production. Mineral waste such as concrete is often crushed and used on site as backfilling material.
The Swedish Construction Federation intends to improve resource management within the construction sector by creating industry standards for waste management that comply with the Swedish Environmental Code and the EU Waste Management Hierarchy. These guidelines prioritize waste reduction, reuse, and recycling over disposal methods like landfill and energy recovery. They aid construction companies in managing waste correctly, promote sustainable construction practices, and encourage recycling and reuse.
The list of the major CDW treatment facilities in Sweden are listed in Appendix 1. The current treatment methods for different CDW fractions in Sweden are summarized in Table 10.
Table 10. Summary of current CDW fraction treatment methods in Sweden.
 | Reuse | Recycling | Material recovery | Energy recovery | Disposal | Comment |
Wood | ● | ● | - | ●●● | ● | Wood waste, both treated and untreated, are mainly used for energy recovery. |
Metals | ● | ●●● | - | - | - | Majority of the metals ends up in recycling. Reuse of steel structures has been done in small scale, mainly project-wise. |
Plastic, PVC | - | ●●● | - | - | ●●● | PVC plastics ends up mainly in landfills. Recycling is possible but only few commercial players. PVC is problematic in energy recovery due to chloride content. |
Plastic, other | - | ●● | - | ●● | - | Many other plastic grades are also technically possible to recycle the dirtiness and mixing with other waste fractions make it difficult to recycle and only few facilities are currently able to process it. Energy recovery is often more cost efficient. |
Plaster/gypsum | - | ●● | - | - | ●● | Gypsum waste is technically recyclable, but the separation of gypsum waste during the demolition is problematic. Based on the SWE statistics around half of the material ends up in recycling and other half is landfilled either mixed with other mineral fraction or as a surplus from sieving after mechanical separation process. |
Mineral insulation wool | - | ●● | - | - | ●●● | Mineral wool waste from demolition has currently only minor recycling options. Majority of the material ends up in landfills. Mineral wool from construction sites can be collected and recycled back in production process. |
Reject from mechanical CDW separation | - | - | - | - | ●●● | Heterogeneous material which consists mainly of miscellaneous mineral wastes, wood, plastic and mineral insulation wool and other mixed waste. Low calorific value inhibits energy recovery and material is typically disposed in landfills. |
Mineral (concrete, tiles, etc.) | ● | - | ●●● | - | ● | In SWE majority of the mineral fraction is material recovered |
Glass | - | ●●● | - | - | ● | In SWE the majority of CDW glass is recycled in the production of glass wool insulation. |
- Seldom used. ● Small scale use ●● Medium scale use ●●● Large scale use
2.3 Challenges with recycling and reusing of CDW
The treatment and transportation costs are probably the major factor which guides the selection of treatment method for CDW. For example, the energy recovery option is more easily applied for certain CDW fractions, especially for wood and plastic waste, even though recycling alternative would be available. On-site separation of smaller CDW fractions is in many cases considered too expensive and time consuming and therefore these fractions end up in mixed CDW which is transported to off-site sorting facilities. The mixing of different CDW fractions may prevent the further recycling due to contamination or pulverization during the process. The good availability of cheap virgin raw materials (e.g., aggregates for concrete production) can inhibit the usage or recycled materials even though they would be available.
Hazardous substances are also one factor that limits recycling and reuse of CDW materials. The hazardous substances are especially problematic in certain product categories from previous decades such as mortars, jointing materials, impregnated wood structures, insulation materials, paints or glues. Hazardous substances containing materials needs to be disposed properly to prevent accumulation. Energy recovery can be done from certain hazardous fractions (e.g., treated wood) other fractions are typically landfilled (e.g., asbestos) to remove harmful substances from circulation.
The level of detail of available CDW statistics from different Nordics varies and most of the Nordic countries have only limited data available especially from the smaller CDW fractions. For example, mineral fraction typically includes many smaller fractions, such as gypsum or mineral wool waste, which makes the evaluation of total volumes and current treatment methods difficult.
Mineral waste and wood waste represents the largest CDW fractions in all countries and the increase of recycling or reusing of these materials would have the biggest impact on all CDW recycling and reuse. Certain waste fractions, such as mineral wool waste, plaster waste and reject from mechanical CDW separation, were identified as the most problematic fractions in the terms of recycling in many Nordic countries as these materials typically ends up in landfill. However, the situation between Nordics varies and especially Denmark was identified to have a functional recycling process as these fractions mentioned above were not considered problematic in the terms of recycling.
2.3.1 Mineral waste (concrete and bricks)
Most of the concrete and tile CDW is recovered and backfilled as supporting layers under roads and foundations. This represents a low rank in the waste hierarchy. A step up could be using the materials in the production of new concrete. The main obstacle preventing recycling of concrete waste in new concrete production is good availability of cheap virgin aggregates which makes the recycling unprofitable in many cases.
Another obstacle is possible contaminations. Today the concrete producers typically use concrete waste from element production or other sources where the concrete materials are guaranteed free of contaminations. The concrete waste from demolition activities may contain contaminants (e.g., PCB, PAH, lead compounds, or asbestos), which typically origins from coatings, jointing materials, paints or for example water sealants. In addition, other impurities, such as plastic, ceramic or wood, may mix into concrete during demolition process which limits the use as aggregates in new concrete production. The European waste legislation prescribes that hazardous substances needs to be separated from other waste streams and treated only in specially designed facilities that have obtained permission for hazardous waste treatment. This applies also for demolition waste.
A further step up for concrete waste could be reuse of concrete elements or pillars, but it is difficult to make old materials comply with the new regulations and it is more expensive and time consuming than simply ordering custom fit or standardized new building materials. The regulations are less restrictive when designing outdoor areas and elements, pillars or tiles might find use as outdoor walls or pavement on paths and squares. Different Nordics have or are developing guidelines and practices for concrete structure and brick reuse, but so far, the reuse is estimated to be still rather small-scale activity. The Nordics lacs of unified statistical data concerning the reuse of structural elements.
Most of the Nordic countries have set limit values for hazardous substances which needs to be fulfilled for mineral waste fractions, mainly for concrete and bricks, that are to be utilized e.g., in infra construction purposes. There are variations between countries for example at which point the material needs to be analysed prior to utilization and for what purpose the material can be used. The limit values in Finland differs from other countries as the limit values are mainly set as leachable solutions (L/S = 10) not as a total concentration as in other countries. Finland also has two different limit values: limit values for concrete and brick waste when they are used for certain infrastructure purposes and national EOW criteria for concrete waste. The hazardous substance limit value comparison for utilization is presented in Table 11.
Table 11. Comparison of hazardous substance limit values for concrete or brick waste prior to utilization. Limits values for Iceland were not available for this report.
Substance | Norway | Iceland**** | Sweden*** | Finland Gov. Decr. 843/2017, Limit values for concrete and brick waste utilization in earth construction | Finland Gov. Decr. 466/2022, National EoW criteria for concrete waste | Denmark* |
Limit value (mg/kg dry solids) | ||||||
Heavy metals: | ||||||
Arsenic - As | 15 | 10 | 0,5-2** | 0,1** | 20 | |
Antimony - Sb | 0,3-0,7** | 0,2** | ||||
Cadmium - Cd | 1,5 | 0,7 | 0,04-0,06** | 0,02** | 0,5 | |
Chromium (III) - Cr | 100 (tot) | 40 (tot) | 0,5-10 (tot)** | 0,6 (tot)** | 500 (tot) | |
Chromium (VI) - Cr | 8 | 20 | ||||
Copper - Cu | 100 | 40 | 2-10** | 1** | 500 | |
Lead - Pb (inorganic) | 60 | 60 | 0,5-2** | 0,1** | 40 | |
Mercury - Hg | 1 | 0,3 | 0,01-0,03** | 0,01** | 1 | |
Nickel - Ni | 75 | 35 | 0,4-2** | 0,3** | 30 | |
Zinc - Zn | 200 | 120 | 4-15** | 4** | 500 | |
Vanadium | 2-3** | 0,3** | ||||
Selenium | 0,4-1** | 0,2** | ||||
Barium | 20-100** | 5** | ||||
PCB: | ||||||
∑ 7PCB | 0,01 | 1 | 1 | 0,1 | ||
PAH-compounds: | ||||||
∑ 16 PAH | 2 | 30 | 30 | 4 | ||
Benzo(a)pyrene | 0,1 | 0,3 | ||||
Aliphatic hydrocarbons: | ||||||
C5–C6 | 7 | |||||
C6-C10 | 25 | |||||
>C6–C8 | 7 | |||||
>C8–C10 | 10 | |||||
>C10–C12 | 50 | |||||
C10-C15 | 40 | |||||
C15-C20 | 55 | |||||
C20-C35/40 | 100 | |||||
>C12–C35 | 100 | |||||
Total C6-C35/40 | 500 (C10-C40) | 200 | 100 | |||
Sulphate | 1200-18000** | 300** | ||||
Chloride | 800-11000** | 200** | ||||
Fluoride | 10-150** | 12** | ||||
DOC | 500** | |||||
Other requirements: | ||||||
Floating impurities | 10 cm3/kg | 5 cm3/kg | ||||
Other impurities (metal, clay, gypsum, rubber etc.) | ≤1 w-% | ≤1 w-% | ||||
* There are no national limit values for the substances in Denmark. Limit values in the table here are set in 2020 by a number of Zealand municipalities and as of 2023 the majority of the Danish municipalities follow these guidelines.
** Soluble concentration (mg/kg) determined with SFS-EN 12457-3 batch leaching test or CEN/TS 14405 column leaching test in L/S = 10
*** There are no national limit values for the substances in Sweden. Presented limit values are recommendations based on Naturvårdsverket quideline
Naturvårdsverket. 2010. Handbok: Återvinning av avfall i anläggningsarbeten. Available: https://www.naturvardsverket.se/globalassets/media/publikationer-pdf/0100/978-91-620-0164-3.pdf
**** Iceland has not defined these limit values, but regulations refer to European Legislations on the limit values of hazardous substances. This is therefore still under development in Iceland
Personal Communications. Several actors; Húsnæðis-og Mannvirkjastofnun, Umhverfisstofnun, Hornsteinn, Vegagerðin. 2023.
2.3.2 Metal waste
Metal waste possess significant value and therefore the recycling rate for long has been very high in all the Nordics and possibilities for increasement in recycling rate is negligible. A step up in the waste hierarchy could be reuse of the materials which has been done in some extent nearly in all Nordic countries. However, as for concrete, the reusable steel structures must comply with existing building regulations and technical requirements which makes it typically more difficult and cumbersome compared to construction with new construction products.
2.3.3 Glass waste
The reuse of windows and window frames is possible, and it has been done project-wise in all Nordics. However, a majority of glass waste generated in demolition and construction sites ends up for recycling in Nordics. Glass waste can be recycled for example in glass production, glass wool production or foam glass production. Older glass frames may contain PCB or other hazardous substances in the jointing materials which needs to be separated in recycling process.
2.3.4 Wood waste
Wood waste is mainly across the Nordics recovered as energy and there are limited options for recycling such as use in the production of particle boards or biochar. Wood waste is typically divided in three categories: untreated, treated and impregnated. All kind of treatment such as paintings, wood preservatives, anti mould agents and impregnating agents limits the recycling possibilities of wood waste and treated wood fraction typically ends up in energy recovery
Zhu et al. 2022. Purkumateriaalien kelpoisuus eri käyttökohteisiin turvallisuuden ja terveellisyyden näkökulmasta. Valtioneuvoston selvitys- ja tutkimustoiminnan julkaisusarja 20212:15. Available: http://urn.fi/URN:ISBN:978-952-383-253-4
Untreated wood has the highest potential for recycling and reusing. Denmark stands out with a dedicated large plant for recycling wood waste in particle board production. A step up in the waste hierarchy is reuse of wood in new constructions. In a smaller scale some companies specialise in seeking out higher quality wood waste for use in production of sheds or use more ordinary wood for building interim measures on construction sites. There is a potential to increase the recycling of wood waste and in some extent also to increase the reuse but generally, wood is in large supply in the Nordics (at least in Sweden, Norway, and Finland) making the case for recycling and reuse of wood waste less economical clearcut. A big obstacle in increasing the recycling or reuse of wood waste is the work required in separation into different qualities and grades of wood, including certification and technical control.
2.3.5 Plastic waste
Construction and demolition waste contains a wide variety of plastics. Major plastic grades used in construction are polyethene (PE, both PE-LD and PE-HD) and polypropene (PP). PVC is also commonly used plastic grade in construction e.g., in cables and pipes as well as polyurethane (PU) and polystyrene used in various insulation products. A smaller amount of technical grade (TPE, EP, PC) and special grade (e.g., PI) of plastics are used for special applications where for example high temperature, acid/base or solvent resistance is needed.
Currently majority of the plastics from demolition sites goes to energy recovery or disposal, only minor fraction is directed to material recycling. Especially increasing of the PE and PP grade plastics recycling, which represents the major volume of the plastics in construction, are seen as the most promising way to increase the recycling rate of plastic waste in construction and demolition
Ministry of Environment. 2020. Roadmap for construction plastics in Finland. Available: https://ym.fi/documents/1410903/40549091/rakentamisen_muovit_A4_v3.pdf/
Most plastic waste is in mixed combustible streams for energy recovery. Distinguishing construction from demolition waste is essential, as construction waste, including plastic packaging and install waste (e.g., pipes, insulation, floors), is readily separable for material recycling. Recycling plastic from demolition waste is possible but requires careful evaluation due to mixed plastics from various eras and potential undesirable substances, necessitating a balanced discussion on climate benefits and risks
Naturvårdsverket. 2021. Kartläggning av plastflöden i byggsektorn RAPPORT 6973:2021 Available: https://www.naturvardsverket.se/publikationer/6900/kartlaggning-av-plastfloden-i-byggsektorn/
Sirviö, S. 2007. Rakennusten haitta-aineet. Thesis, available: https://www.theseus.fi/bitstream/handle/10024/12084/2008-03-19-02.pdf?sequence=1
PVC grade plastic waste recycling would also need more development. PVC is undesired in energy recovery due to its chloride content which can have corrosive effects in incinerators, and it typically ends up in landfills. The recycling of hard PVC plastic is technically possible, but it has certain difficulties such as rather small volumes, lack of collection network and treatment need (e.g., sorting and cleaning of PVC material before recycling and possible residues of contaminants such as phthalates, lead or asbestos)
Circhubs. 2018. PCV-Plastic material flow analysis. Available: https://circhubs.fi/tietopankki/pvc/
Nordic Council of Ministers. 2019. PVC Waste in Nordic countries. Available: https://norden.diva-portal.org/smash/get/diva2:1287469/FULLTEXT01.pdf
Tarkett. (n.d.). Återvinning av plast-, linoleum- och textilgolv. Available: https://proffs.tarkett.se/sv_SE/node/atervinning-av-plast-linoleum-och-textilgolv-4105
Tarkett. Undated. Recycling of dismantled floor covers. Available: https://kohdemyynti-lattiat.tarkett.fi/fi_FI/node/purettujen-lattioiden-kierrattaminen-16289
2.3.6 Gypsum waste
Gypsum waste, especially plaster boards, are technically fully recyclable material. Overall, the gypsum waste presents a relatively small fraction, estimated 5-10 w-%, of the total demolition and construction waste. The material pulverises easily and therefore the gypsum boards need to be sorted separately and usually by hand during the demolition process. To recycle the gypsum, it can only contain small number of impurities, such as nails, screws, wallpaper, and wood and it needs to be stored under dry conditions.
According to legal requirements in Denmark, Norway, Finland and Sweden, gypsum waste must be sorted separately as its own waste fraction on site. In Denmark the gypsum waste is sorted and handled separately and recycled and only wet or contaminated materials are landfilled. In Norway approximately 50 % of the gypsum waste is recycled. In Sweden the appropriate treatment for gypsum waste is determined in consultation with the waste contractor and depends on the distance to recycling facilities and landfills, as well as the quality of the gypsum8. In Finland only a small fraction of gypsum waste from demolition sites are recycled because the gypsum waste typically ends up in mixed CDW fraction where it is difficult to sort out due to pulverization. Even though separately collected gypsum can be directed to recycling with lower costs compared to disposal as waste, the overall costs can be still higher for recycling than disposal due to higher demolition costs.
Saint-Gobain, 2023. Gypsum recycling article in webpage. Available: https://www.saint-gobain.fi/news/kipsi-kiertamaan
Liikanen et al. 2018. Rakennusjätteen koostumustutkimus – Etelä-Karjala. Available: https://urn.fi/URN:ISBN:978-952-335-228-5
AFRY. 2022. Rakennuspurkumateriaalien liiketoimintaselvitys – unpublished report for VIRKE-project governed by Iin Micropolis.
2.3.7 Mineral insulation wool waste
Various producers, such as Rockwool, Knauf, Paroc, have developed collection and recycling system for surplus mineral wool (rock and glass wool) waste which is generated during construction
Paroc. 2023. REWOOL recycling service. Available: https://www.paroc.fi/kampanjat/rewool
Knauf. 2023. RESULATION recycling service. Available: https://www.knaufinsulation.com/new-era-of-recycling
Rockwool. 2023. Rockcycle recycling service. Available: https://www.rockwool.com/group/about-us/sustainability/rockcycle/
Wool2Loop. 2023. Final report. Available: https://www.wool2loop.eu/en/
The recycling of old mineral wool material has certain challenges such as quality variation between products (glass and rock wool) and additives used in different decades. The material would require additional work to be separated during demolition and current material recycling options, such as use in geopolymers, requires that the mineral wool waste is stored and transported dry during demolition. In DK mineral insulation wool waste from construction and demolition activities is collected and recycled in the production of new insulation wool. In Sweden, mineral wool is sorted for material recovery or landfill, and while some stone wool manufacturers recycle their insulation waste, there is no industry-wide system
Byggföretagen. (2021). Resurs- och avfallshantering vid byggande och rivning. Available: https://byggforetagen.se/app/uploads/2021/09/20210915-Resurs-och-avfallshantering-vid-byggande-och-rivning.pdf
2.3.8 Reject from mechanical CDW separation
Reject from mechanical CDW separation is mixed waste fraction which is generated during mechanical CDW separation. In Finland a large amount of CDW nowadays ends up as a mixed CDW which is transported from the demolition site to the mechanical CDW separation facility. In the facility it is separated to different fractions which are directed to landfill, energy recovery or recycling. The reject is heterogeneous fraction which typically consists of minerals (concrete, ceramic, gypsum, mineral wool), plastics and wood. In 2022, it was estimated that 10% of all CDW ends up as a reject in Finland
Puhakka, Ville. 2022. Rakennus- ja purkujätteen mekaanisen käsittelyn rejektit Päijät-Hämeen alueella. Available: https://www.labopen.fi/lab-rdi-journal/rakennus-ja-purkujatteen-mekaanisen-kasittelyn-rejektit-paijat-hameen-alueella/
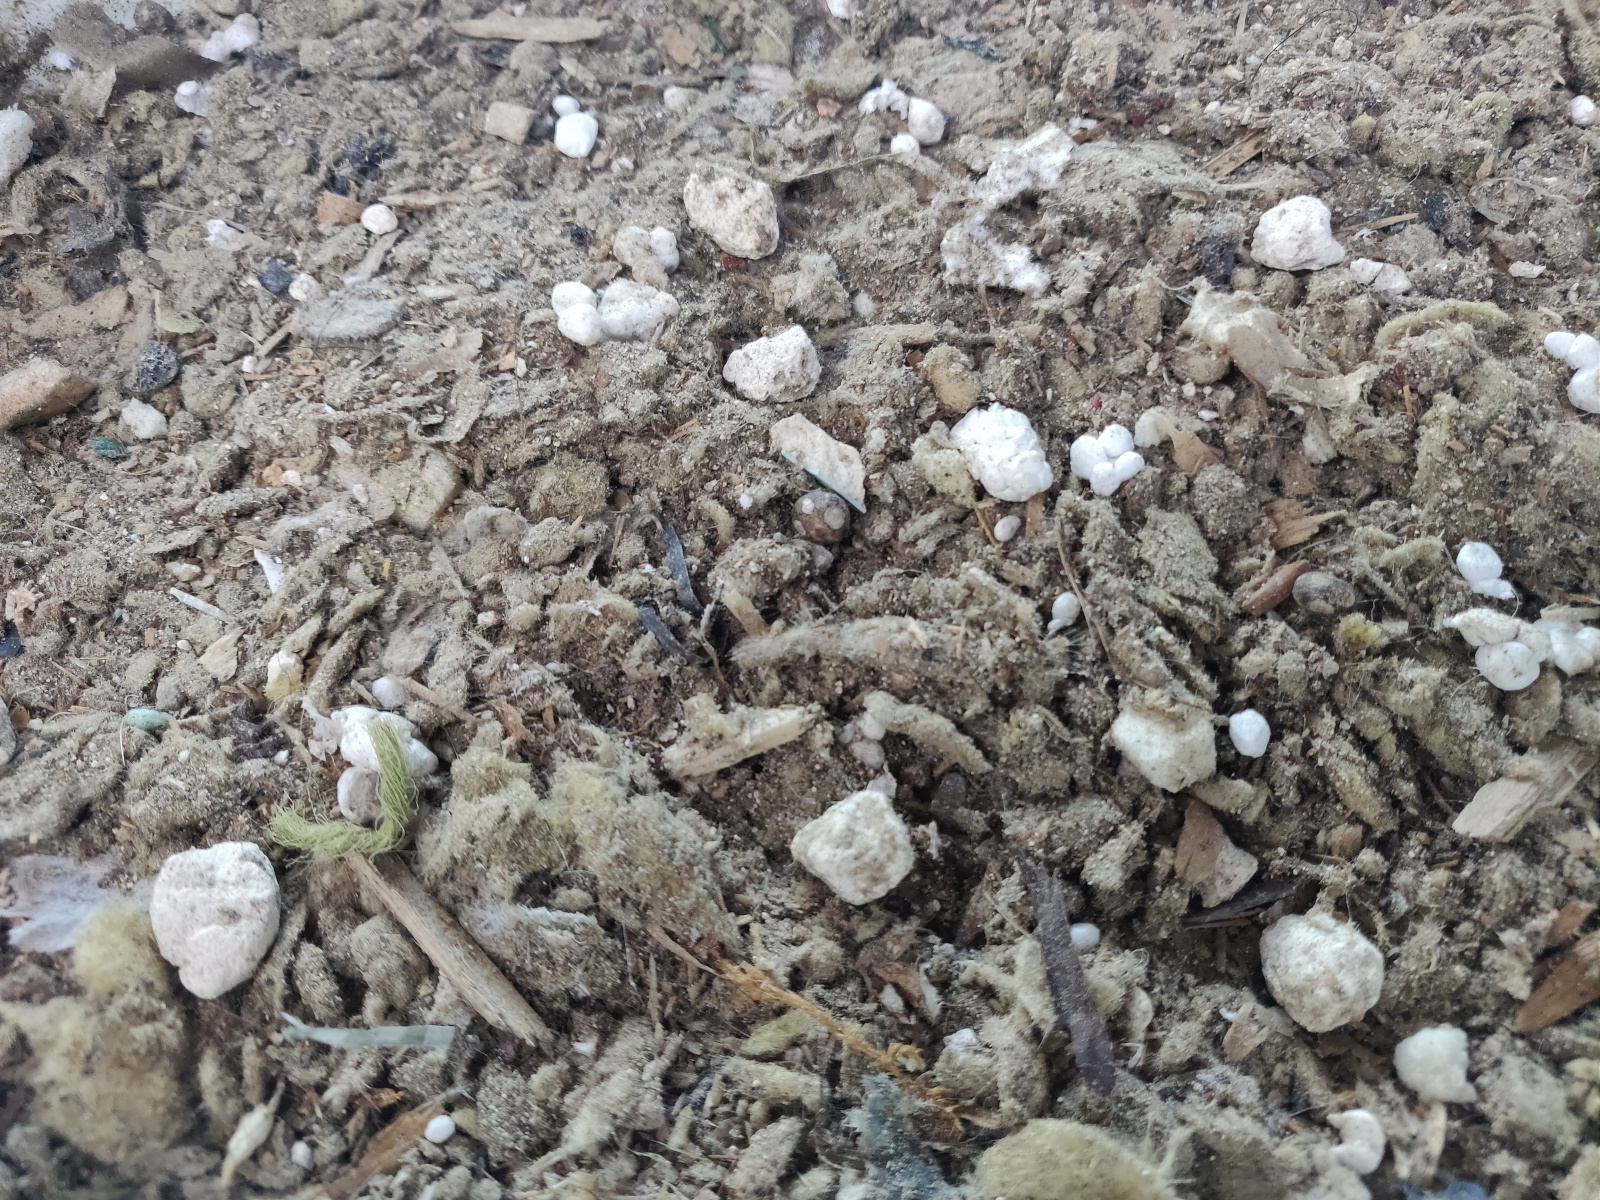
Figure 14. Example of reject from mechanical CDW separation
Puhakka, 2020. Rakennus- ja purkujätteen kierrätyksessä haasteita, blog text. Available: https://blogit.lab.fi/labfocus/rakennus-ja-purkujatteen-kierratyksessa-haasteita/