8. Examples based on information in national statistical databases
With regard to the principle of equal pay, it is important to compare male-dominated and female-dominated occupations. While the gender pay gap for similar work reflects men’s and women’s pay within the same occupations, the focus here is comparing the general level of pay between occupations dominated by different genders (cf. Swedish Gender Equality Agency, 2022, Chapter 7).
It has proved difficult to establish the value of work between two different occupations. Given that this is a subjective judgement, even when structured job evaluation systems are used, there is always room for debate (cf. Hoen et al., 2024), however, this is beyond the scope of the current report. Here we assume sufficient consensus on the equivalence of job requirements between two different occupations to constitute a meaningful comparison. In Sweden, the expert network Lönelotsarna has done extensive work to evaluate and classify occupations in the Swedish labour market into categories based on work of equal value (Harriman et al., 2023). In the following section, occupations that they have assessed as being of equal value are compared. We do not claim that the work performed in these occupations is necessarily of equal value but use their assessment to offer an example of the kinds of insights that can be obtained from the national statistics when two occupations of equal value are identified.
Pair comparisons – comparisons of pay between occupations
Based on Harriman et al. (2023), we chose to compare psychologists and construction engineering professionals, on the one hand, and security guards and child care workers, on the other (Johansson, 2021).
The pay of the male-dominated group of construction engineering professionals differs significantly from that of the female-dominated group of psychologists. The graph below shows the pay of engineering professionals in each country, with a reference value of 100%, in relation to the pay of psychologists. The pay gap between the male-dominated profession of engineering professionals and the female-dominated profession of psychologists is 13–17%.
Figure 4: Psychologists’ pay as a % of that of engineering professionals (reference value 100%) in Finland, Norway and Sweden.
This is a comparison of the average pay between two professions with different gender compositions, and the question of whether male psychologists earn more than female psychologists (similar work) is not of interest. However, it may be interesting to compare male engineering professionals with male psychologists (work of equal value) and female engineering professionals with female psychologists. Again, the engineering professionals’ pay serves as a benchmark in these cases.
It can be seen that in both Sweden and Finland the pay gap is larger among men than among women with regard to work of equal value. This is a common phenomenon. In other words, men can be said to be even more disadvantaged in terms of pay than women when choosing a female-dominated job.
Figure 5: Pay of male and female psychologists as a % of the pay of male and female engineering professionals (reference value 100%) in Finland, Norway and Sweden.
For the occupations of security guards and child care workers, a similar pattern is observed to that of the previous comparison. The pay gap between the male-dominated occupation of security guards and the female-dominated occupation of child care workers is 10–19%.
Figure 6: Child care workers’ pay as a % of that of security guards (reference value 100%) in Finland, Norway and Sweden.
Comparing the occupations by gender, the same pattern emerges as for engineering professionals and psychologists: the differences are greater for men than for women. For example, in Sweden, a male child care worker earns 78% of what a male security guard earns, while a female child care worker earns 85% of what a female security guard earns.
Figure 7: Pay of male and female child care workers as a % of the pay of male and female security guards (reference value 100%) in Finland, Norway and Sweden.
Over time, the pay gap between psychologists and engineering professionals, and security guards and child care workers has narrowed in Finland, Norway and Sweden, but only marginally. In the case of psychologists and engineering professionals, there has been a decrease of 2–3%, and in the case of security guards and child care workers it has been 1–4%. Moreover, the Swedish statistics show that the pay gap was narrowest for both groups in 2020 and has increased slightly since then.
Development over time
Data on the development of the pay gap over time indicate whether the pay gap is narrowing. In this respect, it is important to be able to follow developments over a number of years. As an example, pay development in the female-dominated occupations of department managers in primary and secondary education and adult education, department managers in social and curative care and department managers in elderly care can be compared with the pay development in the male-dominated occupations of IT service managers, production managers in construction and mining, and production managers in manufacturing, between the years 2014 and 2022. The comparison is based on Swedish statistics, in which development over time is easy to follow.
Table 8: Pay gap comparison between female-dominated and male-dominated managerial occupations in 2014 and 2022 respectively. Source: Statistics Sweden.
IT service managers | Construction Managers | Production managers | |
2014–2022 | 2014–2022 | 2014–2022 | |
Department managers in education | 9% -> 13% | 26% -> 17% | 6% -> -3% |
Department managers in social work | 19% -> 21% | 33% -> 25% | 16% -> 7% |
Department managers in elderly care | 14% -> 22% | 29% -> 25% | 11% -> 8% |
IT service managers have seen the best pay growth of all groups, and the pay gap between IT service managers and all three female-dominated managerial occupations has increased. However, the pay gap has narrowed in all other cases, to the extent that in 2022 department managers in education received higher pay than production managers in manufacturing. The gap remains widest between female-dominated managerial occupations and construction managers, although it has narrowed since 2014.
However, comparing pay gaps between two years is not enough. The picture of narrowing pay gaps is more nuanced when more years are added to the comparison. Comparisons between female-dominated managerial occupations and IT service managers have been omitted from the graph below, for readability.
Figure 8: Development of the pay gap from 2014 to 2022, comparing managers in education, social work and elderly care, and managers in construction and manufacturing.
Out of the six occupational comparisons, only two, between managers in manufacturing and managers in both social work and construction, show a slight narrowing trend. Managers in education have received higher pay than production managers in manufacturing since 2016, i.e. the pay gap has been reversed, and since 2020 it has been slowly narrowing in favour of production managers. For all three other comparisons, a narrower pay gap was observed at some point between 2014 and 2022, but the trend has either reversed and is widening or has stabilised at a wider level. Thus, a comparison between only two years is not necessarily an accurate reflection of the situation.
The sharp reduction in the pay gap for comparisons with construction managers in 2018 is not explained by the statistical data. By studying the pay gap over several years, anomalies in single years are less pronounced than if the statistics had been used to study the pay gap in 2018, for example.
Returning to female managers in the Finnish statistics, a group discussed in the section on classifications at the three- and four-digit levels, there are also interesting developments to observe:
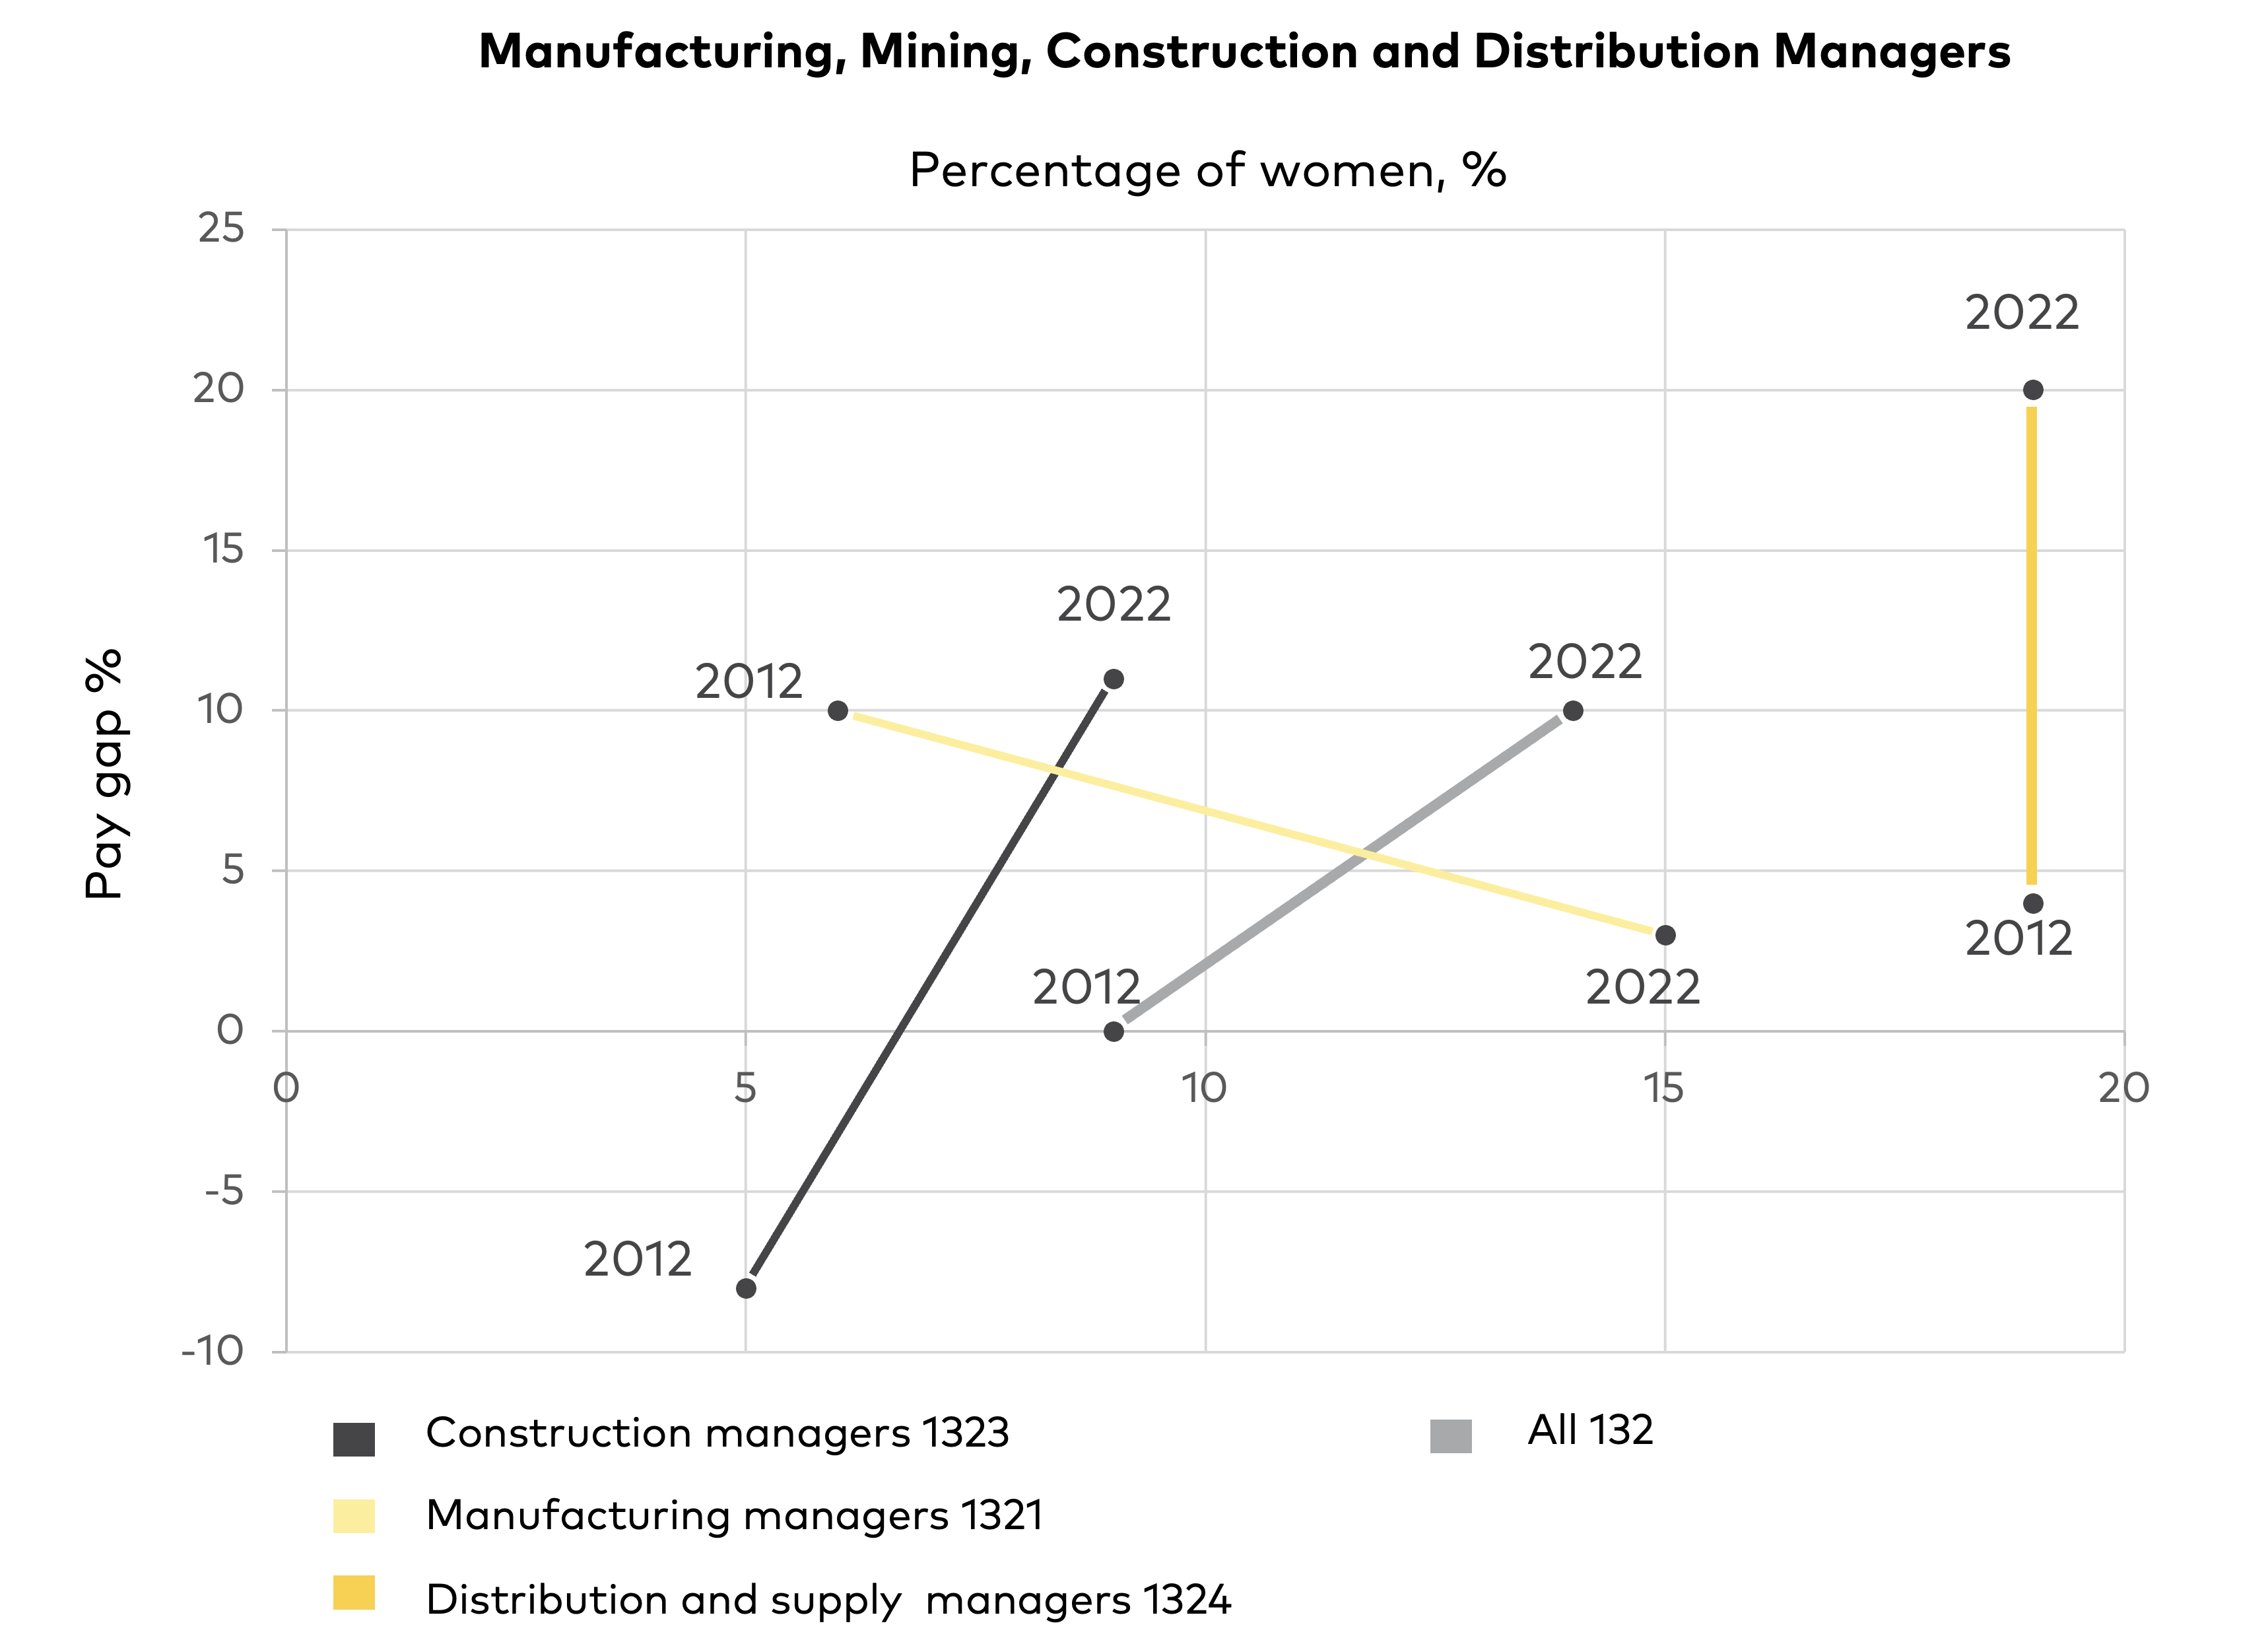
Figure 9: Gender pay gap and proportion of women in occupation 132 Manufacturing, mining, construction and distribution managers and occupational groups, in Finland in 2012 and 2022.
Figure 9 shows that the proportion of women in the minor group (three-digit level 132) increased by five per cent between the reference years. There was no gender pay gap for the group in 2012, but in 2022 there was a gender pay gap of 10%. The gender pay gap therefore increased by more than the corresponding increase in the proportion of women in the occupational area.
If we use statistical data linked to the four-digit level of the occupational classification, other patterns emerge.
- For construction managers (1323), the proportion of women increased by 4%. In 2012, the pay gap for this occupational group was ‘inverted’ with respect to how pay gaps typically manifest, with women earning on average 108% of men’s pay, but by 2022 the pay gap had widened to 11% to the detriment of women.
- For manufacturing managers (1321), the proportion of women also increased, by 11%, but the pay gap narrowed, from 10% in 2012 to 3% in 2022.
- For distribution managers (1324), the pattern is again different with the proportion of women remaining unchanged between 2012 and 2022 but the pay gap increasing by 16%.
Thus, trends can differ significantly, and an increase in the proportion of women in a profession can coincide with either an increase or decrease in the pay gap.
Sector, pay and occupation
In Norway (frontfagsmodellen; front-runner model) and Sweden (industrimärket; industrial mark), there is a more-or-less-formalised agreement that public sector pay may not exceed pay in the export industry, and a similar model is being introduced in Finland (vientivetoinen palkkamalli; export-driven pay model). In practice, pay in the same occupation is usually lower in the local government sector
However, we showed in the section on pair comparisons of pay in different occupations with approximately equivalent requirements for work that the pay for the occupational group security guards was higher in the local government sector than in the private sector in Finland and Norway.
Thus, assuming that individuals working in the same occupation do the similar work, the pay they receive for this work is not necessarily similar if they work in different sectors. This relationship has clear gender equality implications as women are more likely to work in the relatively lower-paid local government sector than men: more than a third of working women compared to about 10% of men in Finland, Norway and Sweden. The table below shows the distribution of women and men across sectors.
Table 9: Percentage of women and men working in the local government, central government and private sectors in Finland, Norway and Sweden.
Women, local govern-ment | Men, local govern-ment kommunal | Women, central govern-ment | Men, central govern-ment | Women, private | Men, private | |
Finland | 35% | 10% | 4% | 4% | 61% | 85% |
Norway | 34% | 10% | 15% | 9% | 52% | 81% |
Sweden | 38%* | 12%* | 6% | 5% | 56% | 83% |
* In Sweden, the regional sector is combined with the local government sector.
In Finland, Norway and Sweden, the mean and median pay in the central government sector are higher than in both the local government and private sectors. In most occupations, the number of central government employees is not large enough to significantly impact average pay in the public sector, and thus the pay differences between the public and private sectors. However there are a few occupations where this is the case.
The matter is further complicated when comparing different occupations in which work of equal value is performed. Support technicians and library staff are two such example occupations, one male dominated and the other female dominated. The sizes of pay gaps vary when sectoral affiliations are taken into account. The table is based on Finnish data. When comparing the private and local government sectors, the pay gap favours the government sector.
Figure 10: Pay gap between and among support technicians and library staff in the local government, state government and private sectors in Finland.
The gap between the lowest and highest average monthly pay for these groups doing potentially equal work is 43%: from €2,541 for librarians employed by local governments to €4,422 for support technicians employed by central government. This is comparable with the already large gap between support technicians and librarians when sectoral affiliation is not taken into account.
Full-time and part-time work
Comparing the pay of full-time and part-time workers is not straightforward, even within the same occupation. In this section, it is assumed that individuals are doing equal work (because they are doing ‘similar’ work), although this is not always the case. It can be seen that both the proportion of full- and part-time employees and the impact of working hours on pay vary considerably across occupations.
It is not self-evident that full- and part-time workers do equal work, even in the same occupation – for example, part-time workers may have less extensive and therefore less skilled tasks than full-time workers, but the opposite can also be true, with part-time workers having more specialised and therefore more skilled tasks. Part-time workers may have inconvenient working hours and thus worse working conditions than full-time workers, or it may be that full-time workers have more inconvenient working hours. Some part-time work may be desired by employees, for example in certain occupations, where the employees may be self-employed alongside their contractual employment relationship, while others may work part time because full-time work is not available.
Full-time employees are generally paid monthly, while part-time employees may be paid either monthly or hourly. When it comes to equal pay for work of equal value, these two types of pay must be comparable. The most common approaches to making full- and part-time pay comparable are converting full-time pay into hourly pay (as Statistics Finland does) or making hourly pay into full-time pay (as Statistics Sweden does). In both cases, total pay is divided or multiplied by normal working hours. It would theoretically be possible, and probably more correct, to make a calculation based on the degree of part-time work (% of full-time work) instead of the monthly pay of part-time employees, but this approach is not used. Converting different types of pay inherently introduces uncertainty and a margin of error in occupational categories where different pay types are used; thus, some of the figures are ‘original’ while others have been converted.
We requested statistics on part-time work by occupational categories from both Finland and Sweden, and in Sweden also by sectors. The intention was to separate ‘short’ and ‘long’ part-time work, i.e. part-time work up to 19 hours and part-time work of 20 hours or more. However, sectoral statistics in Sweden are incomplete: for occupations that exist in both the public and private sectors, the private sector data is missing even for groups of several hundred individuals. For example, the Swedish statistics divide salespersons workers into two occupational codes, for grocery and specialised stores, but do not include data on part-time work for grocery store salespersons. Missing data in the Finnish statistics seems to pertain to occupations with few practitioners, or at least few part-time workers. Due to the gaps in the Swedish statistics, this section is based on Finnish statistics, even though we have learnt from our samples that the situation differs from country to country.
In general, women in the Nordic countries work part time to a greater extent than men (Drange & Egeland, 2014). Across the Nordic countries, part-time work is most common among women in Norway (Mósesdóttir & Ellingsaeter, 2019). Part-time pay is often slightly lower than full-time pay per hour, although this is not always the case.
To provide a general picture, we examined 15 male-dominated and 15 female-dominated occupations from the Finnish statistics. While this may seem like a small sample, it is already clear that in many male-dominated occupations there are few part-time workers, therefore there is a lack of data on pay available in the statistics. We identified only 15 male-dominated occupations that include data on pay for both men and women working short and long part-time hours.
The first question is whether part-time workers receive lower pay than full-time workers, and the second question is whether this also varies by gender. Although part-time workers often receive lower pay than full-time workers, this is not always the case. On the other hand, a gender pay gap is usually present even in comparisons of part-time workers. Two example comparisons, between software and application developers and pharmacists and between heavy truck and lorry drivers and shop salespersons, are presented, which show that the inclusion of part-time work can reveal very different patterns.
First the pay gap between men and women working full and part time in the occupation of software and application developers is examined. Male full-time software and application developers are paid 8% more than their full-time female colleagues. Among part-time workers, there is hardly any gender pay gap, although there is a pay gap to full-time workers.
Women working long part-time hours receive almost the same pay as their full-time female colleagues, with the difference being only 1%, while women working short part-time hours receive 12% less pay than women working full time. Men who work many part-time hours are hit harder: they are paid at the same level as women, 9% less than their full-time male colleagues. If they choose to work short part-time hours, they are paid up to 19% less than men working full time. However, very few men (4%) and also few women (9%) work part time in this occupation.
One occupation that can be considered similar to that of software and application developers is pharmacists, an occupation dominated by women. Here the picture is quite different. Part-time work is much more common, with about 30% of both men and women working part time in this occupation. An examination reveals that there is virtually no gender pay gap within the occupation, either among full-time or part-time workers. On the other hand, both men and women who work few part-time hours earn significantly more than those who work full time, about 10% more than full-time pharmacists.
When comparing these two occupations, the differences present as follows:
Figure 11: Pay of software and application developers and pharmacists, euros, Finland.
The overall pay gap (not shown in Figure 11) between the occupations of software and application developers and pharmacists is up to 30%. But among those working few part-time hours in these occupations, the difference is only 6%. This is mainly due to the fact that men working few part-time hours receive the highest pay among pharmacists and the lowest among software and application developers. The difference between men working few part-time hours across the two occupations is only 3%. However, the difference persists, and it is also worth keeping in mind that the number of software and application developers who receive this low level of pay is very low.
In general, few individuals work part time in male-dominated occupations. Overall, the pay gap between full-time employees and those working particularly short hours is greater among male-dominated occupations than female-dominated ones. This means that the pay gap among those working few part-time hours is often smaller than the overall pay gap between two occupations – and larger in the rare cases in which the female-dominated occupation receives higher pay overall.
The comparisons of part-time pay between occupations with many part-time workers are particularly interesting. Such occupations include shop salespersons (female dominated, 57% work part time) and heavy truck and lorry drivers (male dominated, 30% work part time). Here, part-time pay remains roughly equivalent to full-time pay in the male-dominated occupation, while it falls in the female-dominated occupation.
Figure 12: Hourly pay of heavy truck and lorry drivers and shop salespersons, Finland.
The overall pay gap is 10%. However, the gap is larger among part-time workers, and it is highest among those working many part-time hours, where the occupational pay gap is 16%. This is mainly due to the fact that men in the category of shop salespersons, who are highly paid when working full time, receive significantly lower pay when working part time, dragging down the overall pay level of shop salespersons. Given that more than half of shop salespersons work part time, the overall pay gap of 10% thus paints a misleading picture.
Age
The age structure of occupations can also influence the pay gap at the national level and should be included in Agenda 30 (UN 2025) reporting. In general, pay increases with age. While age is not considered a determinant of pay in itself, it is an indicator of increased experience. When evaluating whether two occupations in which work of equal value is performed, age is not a consideration – requirements of the occupation and not workers’ characteristics should form the basis of the evaluation. However, if the age structure of two occupations differs significantly, this should raise some questions when comparing pay.
Comparing child care workers with security guards and bus and tram drivers with sports coaches and instructors provides an example of how age statistics can complement a general comparison of the pay levels of occupations. It can be seen that the pay gap increases in some age categories and that increased experience in female-dominated occupations does not necessarily have the pay impact that might be expected given its importance as an aspect in valuing occupations.
Take child care workers and security guards, for example. In Finland, 40% of security guards are under 30 years, while this is only true of 19% of child care workers. This ratio is reversed among employees over 50 years: 19% of security guards and 36% of child care workers belong to this age group.
The pay gap between child care workers and security guards is 17%. The gap is 5% larger, at 22%, in the 40-49 age group, which includes a quarter of child care workers. The highest pay for child care workers (in the 40-49 age group) is still 7% lower than the pay received by security guards in the youngest age group. Swedish statistics show a similar trend. The overall pay gap may therefore need further examination.
Figure 13: Pay for security guards and child care workers, Finland.
Almost a fifth (19%) of security guards are aged 24 or under and over half, 53%, are aged 34 or under. The overall pay gap is 19%. The gap is largest in the youngest age group, those aged 18-24 (25%), an example of two groups of workers that are both relatively inexperienced but are still subject to a significant pay gap.
It is common for the age structure of occupations that are considered comparable to differ in that male-dominated occupations have a higher proportion of young workers, not least because comparable female-dominated occupations often require more extensive education. However, this can also be the other way round. When comparing bus and tram drivers (male dominated) with sports coaches and instructors (female dominated) in Finland, the age structure also matters:
In other words, more than half of sports coaches and instructors are subject to a pay gap that is 5% larger than the general figure of 16% suggests, compared to equally experienced bus and tram drivers.
If age serves as an indicator of experience, the statistics may also raise a question about the comparability of occupations: can an occupation that is largely made up of younger individuals be considered to have the same requirements or be one in which work of equal value is performed as an occupation in which most employees have considerably more experience (are 40 years or older)?
Migrant background
The EU Transparency Directive 2023/970 emphasises the importance of an intersectional perspective in comparing men’s and women’s pay. Age is one factor that can interact with gender. Another is ethnicity or race. While statistics on these factors are not collected within the Nordic countries, there are statistics available on country of origin. It is also general knowledge that being born in a country outside Europe is generally correlated with lower pay, mainly due to differences in labour market profile: individuals with a migrant background are overrepresented in a number of occupations with a low level of pay. Within publicly available statistics, it is not possible to examine the gender pay gap, and thus the pay gap, for individual occupations. However, from the Swedish statistical database, data can be extracted that suggests this could be of interest: while the income gap (which includes earnings in addition to pay) between newly arrived women and men is often large, it decreases more and more the longer the individuals remain in Sweden, to generally become narrower than the overall unweighted pay gap in Sweden, which here is 19% (i.e. women’s income is 81% of men’s income). In 2022, this was the trend for individuals from selected countries and for all individuals born outside Sweden combined:
Figure 14: Women’s income as a percentage of men’s in 2022 by number of years in Sweden, by country of origin.
While the income gap between women and men from the same country is thus narrowing, and often reversing, it should be remembered that an income gap between those born in Sweden and those born abroad still exists. The pay gap between Swedish-born men and foreign-born men who have been in Sweden for over 20 years is 10%, while the equivalent figure for women is 4%.