3. Analysis Green charges
This chapter examines the impacts of the selected environmental charges implemented across the Nordic countries. Through an analysis of these measures, the following sections will describe the historical background and historical changes in the charge, assess other changes in the market throughout the years that could have affected market behaviour, and evaluate the intended effect and whether there seems to be a causal relationship. By evaluating the outcomes associated with these fiscal instruments, the chapter aims to provide insights into their efficacy and contribution to improved environmental status and increased sustainability. The two charges are listed per country in the following order: Denmark, Finland, Norway and Sweden.
3.1 Tax on pesticides
Denmark is among the most intensively farmed nations in the European Union, with approximately 62% of the land area consisting of agricultural land (2018). In the mid-1980s, aiming at protecting the groundwater, the regulatory regime started focusing on the impacts of agriculture, introducing several environmentally oriented regulatory measures such as pesticide regulation.
Pedersen et al. (2019). Are independent agricultural advisors more oriented towards recommending reduced pesticide use than supplier-affiliated advisors?
Nielsen et al. (2020). Evaluering af den omlagte pesticidafgift
Pedersen et al. (2019). Are independent agricultural advisors more oriented towards recommending reduced pesticide use than supplier-affiliated advisors?
1986 | First pesticide action plan |
1990 | 3% wholesale tax introduced |
1993 | Prescriptive regulations implemented |
1994 | |
1995 | Pesticide charge implemented |
1996 | Ad valorem tax introduced |
1997 | 8% pesticide decrease achieved |
1998 | Pesticide charge increased tenfold |
2003 | Tax adjusted to counteract pesticide retailers’ internalization of costs |
2005 | |
2009 | Implementation of EU directive 128/2009EC |
2013 | Redesign of pesticide charge, differentiated tax |
2016 | First review of differentiated tax |
2023 | Redesign of differentiated tax |
Figure 2: Historical Development of the Danish Pesticide Tax
In 1986, the Danish government initiated its first pesticide action plan to protect consumers and land workers against health risks (e.g., from ingestion through food and drinking water) and protect the environment.
Nielsen et al. (2020). Evaluering af den omlagte pesticidafgift
Nielsen (2005). Danish Pesticide Use Reduction Programme – to Benefit the Environment and the Health
Kudsk et al. (2018). Pesticide Load – A new Danish pesticide risk indicator with multiple applications
Kudsk et al. (2018). Pesticide Load – A new Danish pesticide risk indicator with multiple applications
The 25% reduction target for 1992 was not achieved. Quite the opposite, pesticide use increased by 2%. Therefore, new initiatives were introduced, including requirements for commercial pesticide users to hold spraying certificates (1993), farmers cultivating more than 10 hectares to keep spraying logbooks (1994), and spraying equipment to be subject to spot checks (1994). An ad valorem tax was implemented in 1996, replacing the 3% fee for the wholesale turnover of pesticides.
In 1997, the Danish Environmental Protection Agency (DEPA) published a progress report based on the Bichel Committee’s assessment of phasing out pesticides. The progress report showed that efforts to tighten pesticide approval had been successful and that the goal to halve the pesticide consumption (measured by kilograms of active ingredient sold) had been achieved. As only an 8% decrease in the TFI was reached (against the projected 50%), the pesticide charge was increased from 37% to 54% in 1998,
Nielsen (2005). Danish Pesticide Use Reduction Programme – to Benefit the Environment and the Health
Nielsen et al. (2020). Evaluering af den omlagte pesticidafgift
Nielsen (2005). Danish Pesticide Use Reduction Programme – to Benefit the Environment and the Health
Benefits and challenges with the tax design
The pesticide tax design between 1986 and 2005 was criticised for being a tax on value, as newer, more expensive, but less hazardous pesticides were taxed higher than older, cheaper, and more hazardous pesticides.
Figure 3: Treatment Frequency Index on Danish agricultural land (Pedersen et al. (2015).
In 2003, it was projected that the TFI could be reduced to 1.4 without significant economic losses to farmers or society. These projections were based on the TFI reduction between 1990–2001 from 3.1 to 2.1. This was never achieved, as seen in Figure 3, which is explained by fluctuating grain prices, decreases in pesticide prices, changes in crop composition, stockpiling, and warmer winters.
Stockpiling is particularly important when examining the TFI statistics, as changes in the political landscape affect stockpiling behaviour. This is illustrated by the spike in the TFI around 2009 when the EU Parliament and Council introduced Directive 2009/128/EC on the sustainable use of pesticides.
Nielsen (2005). Danish Pesticide Use Reduction Programme – to Benefit the Environment and the Health
The EU Parliament & Council (2009). Directive 2009/128/EC of the European Parliament and of the Council of 21 October 2009: establishing a framework for Community action to achieve the sustainable use of pesticides
Figure 4: Development of Pesticide Load from 2011–2022, based on pesticide sale (The Danish Ministry of the Environment and Gender Equality, n.d.).
In 2009, the EU Directive launched the Directive on sustainable use of pesticides (128/2009EC).
European Commission (2009). Directive 2009/128/EC of the European Parliament and the Council of 21 October 2009 establishing a framework for Community action to achieve the sustainable use of pesticides
Kudsk et al. (2018). Pesticide Load – A new Danish pesticide risk indicator with multiple applications
Regeringen (2013). Beskyt vand, natur og sundhed – sprøjtemiddelstrategi 2013-2015
By 2016, the first review of the redesign showed that the PL based on sales was equivalent to 1.40
Miljøstyrelsen (2018). Evaluering af den differentierede pesticidafgift
Ørum et al. (2018). Analyser til brug for evaluering af pesticidafgiften
Miljøstyrelsen (2023). Bekæmpelsesmiddelstatistik 2021
In March 2023, a goal to further reduce the use of pesticides by 27% and PL to 1,46 was established, resulting in a reduced basic charge on pesticides at DKK 20/kg and an increase in PL tax to DKK 140 to further incentivise a redirection towards pesticides with a lower toxicity load. In the sales statistics from 2022,
Miljøstyrelsen (2024). Bekæmpelsesmiddelstatistik 2022
Benefits and challenges with the tax design: homogenous pesticide use
The OECD considers the Danish pesticide tax among the world’s most sophisticated pesticide tax schemes.
OECD (2017). Environmental Fiscal Reform – Progress, Prospects and Pitfalls
A concern with the nudging approach has been the risk of farmers primarily using the cheapest pesticides, causing a risk of developing resistance in weeds, fungi and insects to specific active pesticide components.
Kristensen (2023). Pesticidresistens
Kudsk et al (2018). Pesticide Load – A new Danish pesticide risk indicator with multiple applications
Miljøstyrelsen (2018). Evaluering af den differentierede pesticidafgift
Nielsen et al. (2020). Evaluering af den omlagte pesticidafgift
Evidence shows that the sale of some harmful pesticides has not changed since 2011, indicating that the charge may not effectively have promoted the switch to less harmful agricultural approaches.
Ørum et al (2018). Analyse til brug for evaluering af pesticidafgiften - En beskrivelse af ændringer i pesticidernes priser, salg, forbrug of belastning
Price elasticity and market effects of the pesticide charge
The Danish pesticide tax is notably higher than those in other Nordic countries.
Böcker & Finger (2016). European Pesticide Tax Schemes in Comparison: An analysis of Experiences and Developments
Skevas et al. (2012). Can economic incentives encourage actual reductions in pesticide use and environmental spillovers?
Böcker & Finger (2016). European Pesticide Tax Schemes in Comparison: An analysis of Experiences and Developments
This observation corresponds to a meta-analysis of the elasticity demand for pesticides,
Böcker & Finger (2017). A meta-analysis on the elasticity of demand for pesticides
Use of revenue of the tax
Part of the tax design for the pesticide tax is the reimbursement of the tax revenue back to the agricultural sector.
Retsinformation (2011). 2011/1 LSF 171. Forslag til lov om ændring af lov om afgift til bekæmpelsesmidler
Schou & Streibig (1999). Pesticide taxes in Scandinavia
Nielsen et al. (2020). Evaluering af den omlagte pesticidafgift
With the current version of the tax, it was estimated that the tax increase, and thereby the increase in the price of pesticides, would mean a DKK 150 million increase in expenditures for farmers (after a shift in consumer behaviour).
Nielsen et al. (2020). Evaluering af den omlagte pesticidafgift
Pedersen et al. (2015). The Danish pesticide tax.
De Økonomiske Råd (2021). Dansk klimapolitik frem mod 2030
Landbrug & Fødevarer (2022). Alvorlige konsekvenser af ensartet CO2e-afgift på landbruget
Even though the tax is being reimbursed back to the agricultural sector, which aims to limit competitive distortion, it is still challenging to mitigate distributional effects. The tax load is not homogenous across all farmers – some practitioners use substantially more pesticides than others, but they will not necessarily gain the same compensation from the relief in land-use taxes.
Nielsen et al. (2023). Ex-post evaluation of the Danish pesticide tax: A novel and effective tax design
Synergies and external effects
While the pesticide tax has been evaluated to have (nearly) the intended effects, Denmark's agricultural fields are heavily regulated and affected by other external factors. Overlapping policy frameworks, policy measures, and economic incentives to change agricultural practices have most likely had synergetic effects on the pesticide tax’s efficiency.
No analysis of the collected effects of, e.g. the Water Framework Directive,
The EU Parliament & Council (2000). Directive 2000/60/EC of the European Parliament and of the Council of 23 October 2000 - establishing a framework for Community action in the field of water policy
The EU Council (1992). Council Directive 92/43/EEC of 21 May 1992 on the conservation of natural habitats and of wild fauna and flora
European Commission (2020). EU Biodiversity Strategy for 2030 - Bringing Nature Back Into Our Lives, COM/2020/380 final
The EU Council (1991). Council Directive of 12 December 1991 concerning the protection of waters against pollution caused by nitrates from agricultural sources (91/676/EEC)
The EU Parliament & the Council (2018). Regulation (EU) 2018/848 of the European Parliament and of the Council of 30 May 2018 on organic production and labelling of organic products and repealing Council regulation (EC) No 834/2007
Daugbjerg & Schvartzman (2022). Organic Food and Farming Policy in Denmark: Promoting a Transition to Green Growth
Since 2013, the same year the differentiated pesticide charge was introduced, the agricultural area of organic farming increased from 165,000 hectares to 277,179 hectares in 2023.
Statistics Denmark (n.d.). Production and accounts of organic farming and horticulture
Landbrug & Fødevarer (n.d.). Det økologiske markedet
Fødevarestyrelsen (n.d.). Økologi
European Commission (2021). Action Plan for the Development of Organic Production, COM/2021/141 final/2
3.1.1 Cross Nordic outlook
Pesticide tax schemes have been implemented in all the Nordic countries examined in this study. Among these, the Danish and Norwegian pesticide taxes have attracted significant international interest. The following section provides a brief overview of the approaches to designing pesticide taxes, with a specific emphasis on the Norwegian tax scheme.
Norwegian pesticide tax
The first Norwegian pesticide tax was introduced in 1998, corresponding to 15.5% of the retail price of pesticides. In 1999, the average tax rate doubled, and the first format of a pesticide risk indicator was introduced to supplement the base tax. The tax scheme differentiates between the use of pesticides for commercial and private purposes.
Shou & Streibig (2005). Pesticide Taxes in Scandinavia
Today, Norway utilises the pesticide risk indicator (NERI), which was developed partly to enable the risks of pesticide use and partly as a method for taxing pesticides. NERI functions as a rating system where products' effects on human health are categorised into four risk classes (low, medium, high, and very high risk). The risk class of a pesticide is based on the labelling of the product. Based on the same data, NERI further determines the risk to human health by assessing the operator exposure when preparing and applying the pesticides. Environmental risks are assessed based on effects on earthworms, bees, birds, aquatic organisms, mobility and leaching potential, persistence, and bioaccumulation. Based on accumulated risk scores, NERI classifies the pesticide products into three environmental risk classes. The combination of risks to human health and the environment results in a classification of pesticide products, grouped into seven pesticide tax classes.
Kudsk et al. (2018). Pesticide Load – A New Danish pesticide risk indicator with multiple applications
Nielsen et al. (2023). Ex-post evaluation of the Danish pesticide tax: A novel and effective tax design
The Norwegian pesticide tax has been compared with the redesign of the Danish pesticide tax (the introduction of a differentiated tax in 2013). The Norwegian tax has been deemed as a successful tax design compared to the simple added-value tax (as the Danish pesticide tax before the redesign), especially when looking at the substitution of high-impact products with lower-impact products.
Nielsen et al. (2023). Ex-post evaluation of the Danish pesticide tax: A novel and effective tax design
Kudsk et al. (2018). Pesticide Load – A New Danish pesticide risk indicator with multiple applications
Swedish pesticide tax
Sweden was the first country in Europe to introduce a pesticide tax in 1984, aimed to reduce pesticide use and side effects hereof. The Swedish pesticide tax is based on the amount of active ingredients in the tax. Initially, the tax amounted to €0.48 per kg of active ingredients. The tax was doubled in 1988. In 1994, the tax was again increased to €2.3 per kg of active ingredients, creating revenue of approximately €3.65 million. In this period, there was no link between the revenue generated with the tax and spending on R&D or subsidies. Farmers were subject to paying the tax in advance, based on the expected annual use of pesticides.
Shou & Streibig (2005). Pesticide Taxes in Scandinavia
Pedersen (2015). Introducing a Differentiated Tax on Pesticides in Sweden – Substitution Effects and Possibilities for Load and Use Reductions
Finnish pesticide tax
The tax on pesticides in Finland is based on the Pesticide Act (327/69) and the Pesticide Decree (792/95).
Kristoffersen et al. (2008). A review of pesticide policies and regulations for urban amenity areas in seven European countries
Shou & Streibig (2005). Pesticide Taxes in Scandinavia
Böcker & Finger (2016). European Pesticide Tax Schemes in Comparison: An Analysis of Experiences and Developments
3.2 Tax on residential electricity consumption
Household energy consumption accounts for approximately 30% of Denmark's total energy use (2022). Over 80% of household energy is used for heating and hot water, sourced from district heating, electricity, or burning natural gas, oil, or wood. The remaining 20% (household domestic electricity consumption) powers electrical appliances like fridges, washing machines, and lighting.
Gram-Hanssen, K. (2024). Energiforbrug (husholdninger). Den Store Danske
1973 | 1st energy crisis | |
1977 | 1st tax on electricity | |
1978–80 | 2nd energy crisis, Tax on coal and oil | |
1988–90 | 3rd energy crises, Tax on gas | |
1990 | Action plan for renewable energy | |
Renewable energy production 5 % | 1994 | |
1998 | Enforcement of PSO | |
1999 | EU - Liberalisation of the electricity market | |
2005 | Enforcement of EU Emissions Trading System | |
2018 | Lowering of electricity taxes | |
Renewable energy production 46 % | 2022 | Energy crises, help package PSO phased out |
2023 | Lowering charge to EU minimum for 6 months |
Figure 5: Historical Development of the Danish Tax on Residential Electricity Consumption
Historical overview of the purpose and development of the tax
Danish energy policy has long focused on reducing carbon emissions, decreasing reliance on fossil fuels, and increasing renewable energy (RE) sources, alongside promoting technological advancements and energy efficiency. Energy taxation is also closely interlinked with climate goals and international commitments.
Denmark has one of the world’s largest shares of RE in the energy sector, consisting of 45.6% of the total energy consumption in 2022.
Shultz (2023). Danmarks forbrug af biomasse til energi holder historisk højt niveau
Danish Energy Agency (2024). 2022 Data, tables, statistics and maps – Energy Statistics 2022
There are three different electricity taxes in Denmark, covering electricity used in households, electricity used for domestic heating and electricity used in industrial processes, respectively. This study covers only electricity used in households for electric appliances (not heating). Further on, the “electricity tax” only refers to this tax.
The electricity tax rate is set by the Danish Parliament and adjusted annually through finance law negotiations. The electricity tax on households is the highest in Europe, and there is also a larger gap between household and business electricity tax rates compared to other countries.
Eriksson et al. (2023). Use of Economic Instruments in Nordic Environmental Policy 2018–2021
The electricity tax was introduced in 1977. When it was implemented, the overarching objective to reduce fossil fuel dependency and energy consumption as an effect of the oil and energy crisis in the 1970s.
Skat (n.d). Historik
Energistyrelsen (2016). Danmarks energifortider – hovedbegivenheder på energiområdet
In 1990, the Energy Action Plan Energi 2000 set a goal to expand wind energy by 100 MW by 1994 and introduced initiatives to promote biomass and solar energy. Subsequent energy policy agreements in the 90s supported this expansion. The 1999 electricity reform aimed for 20% of electricity to come from renewable sources by 2003.
Hansen et al. (2005). Vedvarende energi i Norden - Et sammenlignende studie af de nordiske landes vedvarende energipolitikker og virkemidler
Since the beginning of the 2000s, there have been numerous political initiatives to promote the development of renewable energy and decreased use of fossil fuels. In 2007, the Danish government announced a goal towards 2025:
- To reduce fossil fuel usage by 15% further by 2025
- To achieve at least 30% renewable energy for the total energy sector, including 60% renewable electricity production by 2025. This would be done by doubling wind power capacity.Sovacool et al. (2008). Is the Danish Wind Energy Model Replicable for Other Countries?
In 2012, the Danish government, together with the parliament, agreed on the so-called Energy Agreement (Energiaftalen). The agreement set a vision and objectives for Danish energy politics between 2012–2020, among other things, to increase the use of renewable energy. As part of the agreement, the different energy charges were investigated to analyse effect and efficiency from a socio-economic perspective to be able to make necessary regulatory changes in line with the objectives. The analysis concluded, among other things, that the tax on electricity is relatively expensive compared to other energy sources and a relatively inefficient instrument to achieve political energy objectives and that the so-called PSO tax is distorting competition in the market.
The PSO tax on domestic electricity consumption was introduced in 1998 to support renewable energy (RE) investments. Around 10% of Danish electricity bills consisted of the PSO tax, which was a separate tax from the electricity tax. The revenue from the tax was earmarked to specifically support emerging RE sources that were not yet mature enough to compete in the energy market. However, the PSO was gradually phased out between 2017–2022
Skatteministeriet (2020). Skatteøkonomisk redegørelse 2019
Jerking (2016). Forstå sagen: Det betyder PSO-aftalen. Altinget
In 2018, the Danish Government agreed on a new Energy Agreement to ensure cheaper green electricity. The agreement lays the foundation to reduce the electricity tax on households by around 15% between 2019–2025, with the objective to boost green electricity utilisation.
Energi-, Forsynings- og Klimaministeriet (2018). Energy agreement 2018
Skatteministeriet (2018). Den høje danske elafgift tjener ikke samme grønne formål som tidligere
New estimations from the Danish Tax Authority in 2019 showed that the combined changes of both phasing out the PSO tax and relaxing the electricity tax would provide a total socio-economic profit of around €540 million. Abolishing the PSO tax alone was projected to boost the economy by around €340 million, while reductions in the electricity tax were estimated to add another €200 million in profit (2020 level). Since 2022, the PSO tax has been completely phased out. In 2022, there was a new reform package called “Faster at work, a stronger labour market” (Hurtigere i job, et stærkere arbejdsmarked), where there were renewed agreements on gradual reductions in the domestic electricity tax between 2022–2030. The electricity tax was reduced by €0.018/kWh from July 1st, 2022, and will be reduced by another €0.022/kWh between 2024 and 2030 (2022 prices).
Skatteministeriet (2022b). Faktaark: Lempelse af elafgift til minimumssats i seks måneder
The price reductions are estimated to provide tax revenue thanks to increased electricity demand. In 2025 and 2030, respectively, it is estimated to be around €160 million after refunds and behavioural changes have been accounted for.
Skatteministeriet (2022a). Afgifter - provenuet af afgifter og moms
Use of revenues of the tax
In 2022, total revenue from electricity taxes amounted to around €1.28 billion.
Skatteministeriet (2022a). Afgifter - provenuet af afgifter og moms
Danmarks Statistik (n.d.). 2022 gav pæn vækst i både BNP og beskæftigelse
Over the past 25 years, energy tax revenue as a percentage of GDP rose until 2000, then declined. Since then, revenue from fossil fuel taxes has dropped by about a third, climate and environmental taxes have halved, and electricity tax revenue has remained steady. This decline reflects the growing use of renewable energy, which has reduced the tax base.
Skatteministeriet (2019). Skatteøkonomisk redegørelse 2019
Stockfleth (2024). Elafgift – Hvad er afgifter på el i Danmark?, Elberegner.dk
Energinet (n.d.). Aktuelle tariffer
GlobalPetrolPrices.com (2024). Electricity prices, March 2024
Electricity consumption, shift in energy sources and reduced CO2 emissions
The background and historical perspectives of the electricity tax show that the overall aim of the electricity tax can be divided into three main objectives: to reduce dependency on fossil fuels, reduce electricity consumption and fiscal revenue. According to statistics from Skatteministeriet (2019),
Skatteministeriet (2020). Skatteøkonomisk redegørelse 2019
Skatteministeriet (2020). Skatteøkonomisk redegørelse 2019
Skatteministeriet (2020). Skatteøkonomisk redegørelse 2019
Energinet (2024). Foreløbige gennemsnit af miljødeklarationer 2023
Figure 6: Household energy consumption divided into energy mix (Danish Energy Agency (2023). 2022 Data, tables, statistics and maps – Energy Statistics 2022)
Figure 7: Energy consumption from Danish households between 1990–2022 (Danish Energy Agency (2023). 2022 Data, tables, statistics and maps – Energy Statistics 2022
Thanks to the shift in fuels, there has been a significant reduction in CO2 emissions from electricity consumption. The amount of CO2 emitted for each unit of electricity consumed has been reduced by more than 70%, as shown in Figure 8 below.
Danish Energy Agency (2023). 2022 Data, tables, statistics and maps – Energy Statistics 2022
Figure 8: Change in CO2 emissions (million tons) from the Danish electricity production between 1992–2021 (Energistyrelsen, energy statistics 2022).
Consequently, the presented statistics demonstrate that political will and objectives, together with regulations, raised awareness and economic instruments, have successfully driven significant growth in renewable energy sources and cut CO2 emissions.
3.2.1 Intended effect of policy instrument
As discussed in previous sections, a combination of regulations, information sharing, and subsidies for research and technology development, along with taxes, have all played a role in driving the green transition in Denmark's energy sector.
Nielsen & Pedersen (2013). Hvordan kan staten fremme innovation, der fører til bæredygtige energisystemer?
Hansen et al. (2005). Vedvarende energi i Norden - Et sammenlignende studie af de nordiske landes vedvarende energipolitikker og virkemidler
Sovacool et al. (2008). Is the Danish Wind Energy Model Replicable for Other Countries?
Denmark is often mentioned as a successful example of fostering favourable conditions for wind power. Denmark cannot, as compared to the other Nordic countries, rely on geothermal or hydropower as a renewable energy carrier, which is why wind power has been of extra importance.
Andersen (2015). Reflections on the Scandinavian Model: Some Insights into Energy Related Taxes in Denmark and Sweden
Energistyrelsen (n.d.). Dansk Energipolitik
There is, however, not a clear causal relationship between the electricity tax and a technology shift in the market to support RE. The effectiveness of the electricity tax in the 2020s is questioned as to whether it hinders the green transition. Due to the high tax rates on electricity in Denmark, electricity is much more expensive than other energy forms like coal, oil, and natural gas. The existing taxation scheme is considered outdated and contradictory, as it distorts consumer behaviour by working against the policy goal of further decarbonisation in electricity production and making electricity more affordable for end users.
Albertsen et al. (2020). Implementing dynamic electricity taxation in Denmark
Albertsen et al. (2020). Implementing dynamic electricity taxation in Denmark
Dugstad (2024). Carbon pricing acceptance – the role of revenue recycling among households and companies in Norway
Several stakeholders have in recent years expressed a need for a relaxation of the electricity tax because it is considered to hinder the green transition and incentivise RE. A report from 2017 by business organisation Danish Energy, named Green Power Denmark since 2022, when merged with Wind Denmark and Dansk Solkraft (“Danish Sun Power”), argues that the household electricity tax is disproportionately higher than the environmental damage from production, because the tax surpasses taxes on other energy sources, even when adjusted for CO2 emissions.
Lykkegaard & Shultz (2017). Økonomiske effekter ved at reducere elafgiften
Green Power Denmark (2023). Finanslov skal sætte en slutdato for elafgiften
Klimarådet (2016). Nedtrapning af afgift på el
Kosonen & Nicodéme (2009). The role of fiscal instruments in environmental policy
Hoel-Holt et al. (2023). Impact assessment of emergency market intervention measures to tackle high energy prices.
CONCITO(2024). Energiproduktionens betydning for fremtidens arealanvendelse.
The Danish Ministry of Taxation states, in an analysis of the household electricity tax from 2022, that the tax is very high even though the share of renewable energy is increasing and constitutes a larger share of the total energy supply. Since the share of RE is increasing, it is argued that the tax should be lowered. Apart from being profitable from a climate perspective, it is also estimated to generate socio-economic revenue and increase GDP, as a reduction would increase the demand for electricity in favour of RE production. The analysis from the Ministry of Taxation, therefore, concludes the tax to be both expensive and an inefficient measure to achieve energy political achievements. Furthermore, it is also claimed that a reduction of the tax would be especially beneficial for people with low income.
Skatteministeriet (2022b) Faktaark: Lempelse af elafgift til minimumssats i seks måneder
Csereklyei (2020). Price and income elasticities of residential and industrial electricity demand in the European Union
Furthermore, a paper from Mikael Skou Andersen shows that when comparing energy content, also called the calorific value of the energy carriers (measured in Giga Joule (GJ)/kWh), the electricity tax is significantly higher than taxes on fossil fuels like oil and gas. Additionally, the tax is an ad valorem tax, taxing the end consumer instead of the polluter, making it an unprecise instrument to steer electricity consumption towards more RE and reduce CO2 emissions. Therefore, according to Skou Andersen and efficient pricing mechanisms, the tax should be taxing the polluter (in this case, the energy producer), and it should be harmonised across energy sources based on the calorific value GJ/kWh. Skou Andersen further shows that if energy was taxed equally across energy sources (based on GJ/kWh) and paid by the producer instead of the end consumer, it would not be necessary to subsidise renewable energy sources to the same extent as is done in 2024, because RE would compete on more equal terms with other energy sources.
Andersen (2015). Reflections on the Scandinavian Model: Some Insights into Energy Related Taxes in Denmark and Sweden
Taxing the end consumer (on electricity) incentivises reduced consumption and creates more awareness regarding electricity consumption and conservation. On the other hand, is residential electricity consumption estimated to be fairly inelastic, meaning that a causal relationship between the tax and effect on overall electricity consumption is difficult to isolate. The causality between the electricity tax and the shift towards increased RE supply and reduced CO2 emissions seems, on the other hand, to be weak.
3.3 Carbon Tax
Finland was the first country to introduce carbon-based taxation for energy products in 1990 with a tax of €1.19 per tonne of CO2.
Eriksson et al. (2023). Use of Economic Instruments in Nordic Environmental Policy 2018–2021
Grosjean et al. (2024) Carbon Pricing in Nordic Countries
The range of standardized energy taxation covers heating fuels, light and heavy fuel oil, coal, natural gas, and electricity.
Forsström et al. (2022). Taustaselvitys Suomen energiaverotuksen kehitystyölle
International Energy Agency (2023). Finland 2023 Energy Policy Review
Table 1: Finland’s Fuel Tax Application (International Energy Agency (2023). Finland 2023 Energy Policy Review).
Sector | Fuel/user | Unit | Energy content tax | Carbon tax | Security payment | Total* | EUR/GJ** |
Transport | Diesel | EUR/litre | 0,3457 | 0,2456 | 0,0035 | 0,5948 | 16,1 |
Gasoline | EUR/litre | 0,5379 | 0,2149 | 0,0068 | 0,7596 | 23,0 | |
Heating and mobile machinery | Heavy fuel oil | EUR/litre | 0,1159 | 0,1867 | 0,0028 | 0,3054 | 7,9 |
Light fuel oil | EUR/litre | 0,1033 | 0,169 | 0,0035 | 0,2758 | 7,1 | |
Natural gas | EUR/MWh | 10,33 | 12,94 | 0,084 | 23,354 | 6,5 | |
Coal | EUR/tonne | 71,45 | 147,81 | 1,18 | 220,44 | 8,5 | |
Electricity | Household | EUR/MWh | 22,4 | 0 | 0,13 | 22,53 | 6,3 |
Industry | EUR/MWh | 0,5 | 0 | 0,58 | 0,2 |
* Excluding value-added tax.
** Estimate based on: fuel oil 0,039 GJ/L, gasoline 0,033 GJ/L, coal 26 GJ/tonne.
While this analysis focuses on the tax’s role in reducing CO2 emissions from fuel use, given the disaggregation of the CO2 component from the energy content tax only occurred after the tax had been operating for some time, causal inferences for the overall impact of the tax should deal with the tax in aggregate.
Finland's energy taxation aims to reduce emissions by promoting a shift away from fossil fuels and contribute to the national target of carbon neutrality by 2035. However, energy taxes also aim to support central government finances through consistent tax revenue and to align with EU energy and climate directives. The EU Energy Taxation Directive (ETD) of 2003/96/EC went some way to standardising energy taxes within the EU and establishing the main framework for taxation. Until now this includes determining the products subject to tax, setting minimum tax rates, and specifying options for exemptions. However, given the age of the directive it is widely accepted that reform is needed, although finding a compromise position capable of becoming a law has proved difficult.
Asquith (2024). EU Energy Tax Reform Unresolved.
Figure 9: Tax levels for heating fuels (Ministry of Finance. (2021). Report of the working group on energy taxation reform: A proposal for implementing the intentions and goals of the Government Programme and for further development of energy taxation
Since the initial imposition of the Finnish tax, the EU Emissions Trading System (ETS) has also come into effect starting in 2005, targeting different sectors to the Finnish domestic tax.
European Commission (2007). The EU Emissions Trading System (EU ETS)
Use of revenues
In Finland, energy taxes are excise taxes that target the consumption of energy products. In 2023, the total amount of revenues from energy taxes were €4,238 million, making it the cornerstone of Finland's environmental taxation.
Ministry of Finance (2021). Report of the working group on energy taxation reform: A proposal for implementing the intentions and goals of the Government Programme and for further development of energy taxation.
Ministry of Finance (2021). Report of the working group on energy taxation reform: A proposal for implementing the intentions and goals of the Government Programme and for further development of energy taxation.
Vehmas et al. (1999). Environmental taxes on fuels and electricity: Some experiences from the Nordic countries.
Vehmas (2005). Energy-related taxation as an environmental policy tool—the Finnish experience 1990–2003.
International Energy Agency (2023). Finland 2023 Energy Policy Review.
Key tax expenditures in energy taxation include tax refunds for energy-intensive companies and agricultural practitioners. Overall, companies eligible for these refunds have received back about 70% of the energy taxes they paid.
Koljonen et al. (2019). Energiantuotannon valmisteverotuksen kehittäminen Suomessa
Laukkanen & Maliranta (2019). Yritystuet ja kilpailukyky, Valtioneuvoston selvitys- ja tutkimustoiminnan julkaisusarja
Ministry of Finance, Finland (n.d.). Energiaverotus
Given that Finland has taken a largely tax neutral approach of simply reincorporating tax revenues into the overall budget, Finland’s expenditure on fossil fuel subsidies should also be noted. As a proportion of GDP Finland’s combined explicit and implicit fossil fuel subsidies are second only to Denmark in the Nordics at 0.88% of GDP, although it should be acknowledged this is on the lower end for Europe as a whole.
World Bank (n.d.) Fossil fuel subsidies (% of GDP)
European Court of Auditors (2022). Energy taxation, carbon pricing and energy subsidies.
Evidence and Implications of Price Elasticity
Available research shows that demand for transport and heating fuels in Finland is likely to be fairly price inelastic. One study of the OECD countries using data from 1978–2016 estimates the average own price elasticity of gasoline to be -0.7, and the price elasticity of diesel to be -0.35.
Liddle & Huntington (2020). “On the Road Again”: A 118 country panel analysis of gasoline and diesel demand.
Bernstein & Madlener (2011). Residential Natural Gas Demand Elasticities in OECD Countries: An ARDL Bounds Testing Approach.
Interestingly given this logic, a study of UK manufacturing calculated an own price-elasticity -1.08 for gas and -1.38 for coal.
Steinbuks (2010). Interfuel substitution and energy use in the UK manufacturing sector
Industry is by far the greatest sectoral consumer of energy in Finland.
International Energy Agency (2023). Finland 2023 Energy Policy Review
3.3.1 Intended effect of policy instrument
As noted, energy taxes have a number of objectives, not all of which are environmental. However, the intended environmental impact of the tax is to reduce carbon emissions via incentivising efficiency measures and switching to greener alternatives. Attributing causation and the additionality of tax regarding emissions reductions is difficult for a number of reasons. Most obviously is the potential for carbon leakage beyond the borders of the taxing nation, however given our focus on national impacts we will exclude this concern from the present analysis. Even domestically, emissions reductions are the result of a complex set of dynamics, not least a policy mix which extends far beyond an individual tax. This is especially true when we examine a nation as a whole, where differing impacts across sectors may interact with one another. Isolating the impacts of individual taxes with confidence is thus difficult and the Finnish case is no different. This is further compounded by the limited post-hoc policy analysis on Finland’s energy tax.
However some work does exist analysing the potential impacts of the tax. While on balance this work provides a generally positive picture of its ability to reduce carbon emissions, countervailing evidence exists which casts doubt on the effectiveness of the tax as a standalone mechanism for emissions reductions.
Evidence of positive impact
One of the foundational studies on the tax calculates that the tax reduced overall fuel demand by around 5% by 2012, with demand for coal and heavy oil being reduced by an even greater degree albeit from a lower baseline.
Speck & Jilkova (2009). Design of Environmental Tax Reforms in Europe: Finland in Carbon-energy taxation: lessons from Europe
Lin & Li (2011). The effect of carbon tax on per capita CO₂ emissions
Sairinen (2012). Regulatory reform and development of environmental taxation: The case of carbon taxation and ecological tax reform in Finland. In J. Milne & M. S. Andersen (eds.) Handbook of Research on Environmental Taxation Reform
A 2020 paper constructing a computable general equilibrium model identifies an expected emissions reduction of around 10% given a carbon price of $80 per tonne which is comparable to the rate Finland uses today.
Khastar et al. (2020). Evaluation of the carbon tax effects on the structure of Finnish industries: A computable general equilibrium analysis.
Mideksa (2024). Pricing for a cooler planet: An empirical analysis of the effect of taxing carbon.
The introduction of carbon taxes has led some sectors to adopt cleaner technologies to offset higher operational costs and maintain competitiveness.
Khastar et al. (2020). Evaluation of the carbon tax effects on the structure of Finnish industries: A computable general equilibrium analysis.
Laukkanen et al. (2019). The impact of energy tax refunds on manufacturing firm performance: evidence from Finland’s 2011 energy tax reform
Vehmas (2005). Energy-related taxation as an environmental policy tool—the Finnish experience 1990–2003.
Laukkanen et al. (2019). The impact of energy tax refunds on manufacturing firm performance: evidence from Finland’s 2011 energy tax reform
Köppl & Schratzenstaller (2021). Effects of Environmental and Carbon Taxation – A literature review
Vehmas (2005). Energy-related taxation as an environmental policy tool – the Finnish experience 1990–2003
Casting doubt on the positive story
One study in particular casts doubt on the positive picture above. Fernando (2019) uses data until 2004 and a synthetic control methodology to conduct a comparative analysis of the environmental impacts of carbon taxes across Finland, Sweden, Norway and Denmark.
Fernando (2019). The Environmental Effectiveness of Carbon Taxes: A comparative Case Study of the Nordic Experience
Ibid.
Fernando’s study ends its analysis in 2004 to avoid potential confounding impacts from the EU ETS. Since then both the nominal carbon price used for the tax as well as the effective carbon price when considering the ETS have both increased significantly. In line with Fernando’s analysis, we would therefore expect to see the abatement impact of Finland’s tax increase in this more recent period, however this will be hard to prove due to the complexities outlined previously. The negative conclusion can be drawn from the analysis thus: during the early years when Finland’s carbon tax rate was extremely low it had minimal impact.
Nonetheless this conclusion appears contrary to some of the others outlined in this analysis which also focus on a similar time period. This contradiction points to the difficulty in undertaking effective causal analysis of taxation impacts and resolving it in either direction is far too great a task for this piece of research. However it should be noted that the synthetic control methodology used by Fernando is the methodology which allows the messy world of the social sciences to come closest to the scientific ‘gold standard’ of the randomised control trial (RCT), meaning these results should be taken to hold significant weight and arguably preferred over results from simpler methodologies such as DID as found elsewhere.
Concerning substitution effects
More concerning are the substitution effects which have occurred to produce any apparent carbon reduction which has been observed in Finland. Fossil fuels have primarily been replaced by solid biomass in the Finnish energy supply,
International Energy Agency (2023). Finland 2023 Energy Policy Review
Ibid.
Biomass appears in environmental accounting as carbon neutral based on a model of life-cycle carbon emissions and sequestration; trees and other biomass extract carbon from the atmosphere and so when burned they are only re-releasing carbon which has previously been drawn down. Re-growing forests and similar plantations in theory enables the sector to continue to draw down and re-release the same total stock of carbon, amounting to an overall neutral climate impact while still generating energy.
The first major problem with this logic is described by Haberl et al. (2012, p. 2):
“Plants do absorb carbon, but this line of thought makes a ‘baseline’ error because it fails to recognize that if bioenergy were not produced, plants not harvested would continue to absorb carbon and help to reduce carbon in the air. Because that carbon reduction would occur anyway and is counted in global projections of atmospheric carbon, counting bioenergy that uses this carbon as carbon-neutral results in double-counting.”
Haberl etl al. (2012). Correcting a fundamental error in greenhouse gas accounting related to bioenergy
Furthermore, the re-sequestration of carbon dioxide from burning trees into new plants takes time, meaning burning trees can cause increases in atmospheric CO2 that can last many years, contributing significantly to the heating of the planet over that time.
Brack (2017). Woody biomass for power and heat: Impacts on the global climate
Laganière et al. (2017), Range and uncertainties in estimating delays in greenhouse gas mitigation potential of forest bioenergy sourced from Canadian forests
Furthermore, even this payback calculation assumes that the carbon released will be re-sequestered at all. Since 2021 Finland’s land use sector has become a net carbon emitter rather than carbon sink, with a vast reduction in the carbon sequestered by Finland’s forests since 1990.
Natural Resources Institute Finland [Luke] (2023). Greenhouse gas inventory 2022: No significant changes in the final results for the agriculture and LULUCF sectors compared to the preliminary data published in December 2023
European Commission (2023). Climate Action Progress Report 2023: Finland Country Profile
Finally, even beyond the litany of concerns which arise from the burning of solid biomass when properly accounted for, the fuel also carries the risk of emissions going missing from carbon accounts altogether. Due to environmental accounting rules, biomass is accounted for in the land-use sector rather than the energy sector. However it has long been noted that for a number of reasons it is likely that in practice biomass emissions in the energy sector are not fully accounted for in land-use accounts.
Brack (2017). Woody biomass for power and heat: Impacts on the global climate.
Against this backdrop, we can see that the true impact of Finland’s carbon tax is far more questionable. While the tax does appear to have driven emissions reductions according to orthodox accounting frameworks, over the tax’s period of operation Finland has increased its use of biomass for fuel.
Pelkmans et al. (2021). Implementation of bioenergy in Finland – 2021 update
3.3.2 Cross Nordic outlook
All Nordic countries now impose some form of domestic carbon tax, however there are differences. The most significant of these is the tax rate used in each country. The table below offers a summary comparison across the Nordic countries, with impact data drawing the comparative analysis by Fernando (2019). The overarching conclusion is that in Norway and Sweden, which have the highest and second highest tax rates in the Nordics respectively, impacts have been more pronounced. However research also demonstrates that Finland's worrying substitution of bioenergy for fossil fuels is also pronounced in Sweden and Denmark, albeit to a lesser extent.
Hansen et al. (2021). Managing sustainability risks of bioenergy in four Nordic countries.
Country | Date introduced | Tax Structure Grosjean et al. (2024). Carbon Pricing in Nordic Countries. | Current Nominal Rates (€/ton of CO₂) Currency figures have been converted to Euros for all countries except Finland, and so should be taken as approximate. | Legal commitments around revenue use Marten & van Dender (2019). The use of revenues from carbon pricing | Impact Impact analysis from: Fernando (2019). The Environmental Effectiveness of Carbon Taxes: A comparative Case Study of the Nordic Experience |
Finland | 1990 | Initially based on carbon content; now includes both CO₂ and energy content. Carbon tax based on whole lifecycle carbon emissions. | €77/tCO2 for transport, €53/tCO2 for heating Impact analysis from: Fernando (2019). The Environmental Effectiveness of Carbon Taxes: A comparative Case Study of the Nordic Experience | Returned to the national budget. | Mixed evidence, with a number of studies showing positive impact while another giving a more doubtful view. Reliance on woody biomass significantly negates sustainability impact. |
Sweden | 1991 | Unified based on carbon content of fuel. | €122 Impact analysis from: Fernando (2019). The Environmental Effectiveness of Carbon Taxes: A comparative Case Study of the Nordic Experience | Returned to the national budget. | High emissions reductions. Lower reliance on bioenergy than Finland, but still a significant proportion of ‘renewables’. |
Norway | 1991 | Unified based on carbon. Also includes GHG emitting fluorocarbons | €90 Impact analysis from: Fernando (2019). The Environmental Effectiveness of Carbon Taxes: A comparative Case Study of the Nordic Experience | Returned to the national budget. | Highest emissions reductions (Fernando, 2019). Low reliance on bioenergy. |
Denmark | 1992 | Unified based on carbon. Also includes GHG emitting fluorocarbons | €24 rising to €47 in 2025 World Bank (2023). Carbon Pricing Dashboard: Denmark – Carbon Tax Factsheet. | Returned to the national budget. | Difficult to judge significant impacts due to far lower rates (Fernando, 2019). Lower reliance on bioenergy than Finland, but still a significant proportion of ‘renewables’. |
Iceland | 2010 | Unified based on carbon. Also includes GHG emitting fluorocarbons | €35 World Bank (2023a) Carbon Pricing Dashboard: Iceland – Carbon Tax Factsheet. | Returned to the national budget. | No analysis available but known low reliance on bioenergy. |
3.4 Beverage packaging tax (deposit refund system)
Finland’s beverage packaging tax forms part of a wider packaging reuse and recycling scheme by aligning with Finland’s deposit refund system (DRS) for beverage bottles. Importers, producers and beverage packaging companies whose products include soft drinks and alcoholic drinks are liable to pay an excise duty on packaging, however this is waived if they voluntarily participate in the DRS for recyclable and reusable containers.
Finnish Tax Administration (n.d). Excise Duty on Beverage Containers
Background on the DRS and Tax System
The DRS is a system where each beverage bottle or can has an additional charge, or a deposit, that gets returned to the consumer when they deposit the used bottle or can into a machine. This system is done with the intention of motivating consumers to return used beverage packaging, as well as ensuring that the cost for recycling of beverage packaging is paid for by producers. In Finland, the deposit is €0.15 for cans, €0.20 for 0.5l plastic bottles and €0.40 for 1.5l plastic bottles and €0.10 for glass bottles.
Palpa (n.d.). Millaisia Pakkauksia Voi Palauttaa?
The deposit refund system in Finland started in 1950 with a scheme to recollect, wash and reuse glass bottles. The scheme underwent developments going from the recollection and reuse of glass bottles to the recycling of one-way packaging including both plastic and glass bottles and aluminum cans. The modern scheme began in 1992,and the timeline below shows key developments in Figure 10.
1992 |
|
1994 |
|
1996 |
|
2004 |
|
2007 |
|
2008 |
|
2011 |
|
2012 |
|
Figure 10: Historical development of Finland's deposit refund system (E-circular. Finland: Deposit system (DRS – deposit refund system))
In the modern day, the largest deposit refund system operator, controlling the majority of the market is Suomen Palautuspakkaus Oy, known as Palpa, a nonprofit company managing and developing the recycling systems in Finland.
Palpa (n.d-a). Front Page
Ettlinger (2016). Deposit Refund System (and Packaging Tax) in Finland
Palpa (n.d.-b). Palpa Briefly
Palpa (n.d.-c). Who Can Register to Palpa?
Palpa (n.d.-d). Who Pays for the Recycling of Beverage Packages?
Palpa (n.d.-b). Palpa Briefly
In Finland, the deposit refund system is voluntary for producers to participate in. However, if they do not participate in the deposit refund system, they have to incur a packaging tax.
Palpa (n.d.-e). Deposit Refund System
Palpa (n.d.-e). Deposit Refund System.
Finnish Tax Administration (n.d.). Excise Duty on Beverage Packaging
This packaging tax acts as an incentive for producers to participate in the deposit refund system, as being a part of the scheme is both cheaper as well as cultivates a responsible image of the producer who is participating in the scheme. In 2023, the packaging tax revenue in Finland was €13 million, 0.01% of the total tax revenue.
Veronmaksajat (n.d.). Tax Collection in Finland.
The tax was first introduced in 1994, and at first the only exemptions applied to reusable beverage containers. A lessened tax was placed on recyclable one-way packaging that participated in the deposit refund system at €0.17 per litre of beverage packaging, compared to €0.67 per litre of packaging not in the system. From 2005–2008, the tax on one-way packaging in the deposit refund system was halved, and in 2008 one-way packaging that are participants in the deposit refund system became wholly exempt from the beverage packaging tax.
Ettlinger (2016). Deposit Refund System (and Packaging Tax) in Finland
Interview with Sirje Stén, Ministerial Adviser at Ministry of the Environment of Finland
3.4.1 Intended effect of policy instrument
Instead of primarily being used to collect additional tax revenue, the packaging tax works as an incentive to motivate producers to join the deposit refund system. This can be seen with the small amount of tax revenue collected compared to the large sum in deposits passed through the deposit system yearly (€13M and €360M respectively), showing the scale of producers who choose to opt in to the deposit refund system instead of paying the beverage packaging tax. The packaging tax has been so successful at incentivizing producers into being a part of the deposit refund system that Finland is one of the leading countries in the world when it comes to beverage packaging recycling.
Palpa (n.d.-a). Front page
The beverage packaging tax thus also does not function like a traditional Pigouvian tax for internalising negative externalities, where the tax ‘prices in’ the externality and reduces the harmful market activity by raising its cost to reflect the true social cost. In contrast the beverage packaging tax does not act to directly price in the externalities caused by littering and poor waste disposal, but instead incentivises takeup of an alternative system by producers which facilitates externality reducing consumer behaviour. This still has the desired effect however; by creating a system that incentivises consumers to accurately return their beverage packaging, the negative externalities caused by littering and inaccurate waste disposal is reduced significantly.
Eggert et al. (2004). On the Economics of Bottle Deposits
The deposit return rate is 98% for aluminum cans, 90% for PET plastic bottles and 99% for glass bottles, with an average overall return rate of 97%.
Palpa (n.d-f). Return Rates
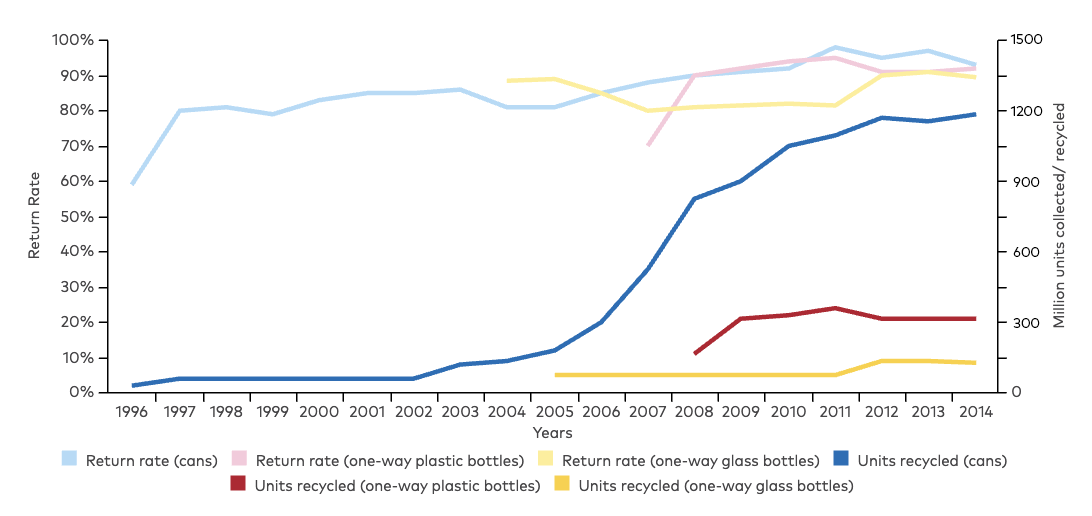
Figure 11: Development of Finnish DRS (Ettlinger, S. (2016). Deposit refund system (and packaging tax) in Finland)
This success shows the importance of the tax on producers/retailers being paired with a system which creates economic incentives for consumers also. Interestingly, anecdotal evidence points to some consumers returning disproportionately to the scheme compared with others, by sourcing and returning others’ waste containers.
IS (2018). Finns have earned large sums just by collecting bottles
While there is no large-scale data validating these accounts, they may point to a potential differential behavioural impact of the deposit charge across the population, with the behaviour of some consumers being far more responsive than others. Given the relatively small sums of money available to be claimed via the return systems, this effect may point to a negative income elasticity in DRS participation. Empirical research into these differential behavioural impacts would prove a valuable area for further study.
Impact on innovation and production choices
The question of whether the packaging tax stimulates innovation in the market was raised in an expert interview with a ministerial adviser to the Finnish Minister of Environment. Their view is that the packaging tax has not led to innovation in the market. Even the contrary can be true, as the extension of the tax exemption to one-way packaging combined with developments in EU policy around plastics has resulted in a significant shift away from reusable packaging and into single-use packaging.
Ettlinger (2016). Deposit Refund System (and Packaging Tax) in Finland
Nurminen (2021). The Finnish Reuse System for Beverage Packages
Zero Waste Europe, and Reloop (2020). Reusable vs Single-Use Packaging: A Review of Environmental Impact
Sinkko et al. (2024). Exploring the environmental performance of alternative food packaging products in the European Union
3.4.2 Cross Nordic outlook
The deposit refund system for beverage packaging has been implemented in several countries globally, and while following a similar premise, there are differences in implementation. Finland, Sweden, Norway as well as Denmark all have deposit refund systems for beverage packaging. Some have mandatory deposit refund systems while others, such as Finland, have opt-in schemes motivated by taxation.
In Sweden, all beverage packaging is required to be part of an approved recycling scheme to be able to be sold in stores. Exemptions are in the case of dairy products of 50% dairy and above.
Pantamera (n.d.) Brewery, Producers & Importers
Swedish Environmental Protection Agency (n.d.) Return Deposit System for Plastic Bottles and Metal Cans
The Danish deposit return system mandates all beverage and packaging companies to comply with the obligation to accept used beverage containers. The obligation also aims to ensure that 90% of single use beverage packaging is recycled through the Dansk Retursystem.
Food Times (n.d.) Deposit Return Scheme: Danish Excellence in Beverage Packaging Recycling
Dansk Retursystem (n.d) Expenses in the Returns and Deposit System
Bottle Bill (n.d.-a). Denmark
Norway has an environmental tax on top of a base tax on single-use packaging. The environmental tax is lower in products under an approved deposit refund system, dependent on the return rate. For example, products with a 95% or over return rate are exempt from the tax,
Norwegian Tax Administration (n.d). Beverage Packaging Tax
Bottle Bill (n.d.-b). Norway
In Iceland no packaging tax is in operation and no plans to introduce such a tax. However producers and importers do instead pay a recycling levy. For single use beverage PET packaging, there is advanced fee modulation that takes both recyclability and recycled content into account. However Iceland was the first country in the world to set up a deposit system on a national scale for a wide range of containers, with the DRS being mandatory in the country.
European Environment Agency (2024a). Early warning assessment related to the 2025 targets for municipal waste and packaging waste: Iceland.
Country | Mechanism | Overall return rate (2023) |
Finland | Beverage packaging tax is used as an incentive to motivate producers to participate in the deposit refund system as participating exempts them from paying the beverage packaging tax. | 97% Palpa (n.d.-f). Return Rates |
Norway | Environmental tax reductions used as an incentive to promote the deposit return scheme. There is a reduced environmental tax on producers if they participate in the deposit refund system, dependent on rates of return. | 92.3% Tomra (n.d.) Norway Deposit Return Scheme |
Sweden | Mandatory deposit return scheme that producers are obliged to partake in. Noncompliance results in fines. | 88.5% Pantamera (n.d.-a) Collection and Deposit Statistics |
Denmark | Mandatory deposit return scheme, existing for both one-way and refillable beverage containers. | 92% Dansk Retursystem (n.d.) About Deposits |
Iceland | No packaging tax. Recycling levy with advanced fee modulation for single use plastics. Mandatory DRS. | 85% Endurvinnslan (n.d.). Home |
3.5 The NOX fund
NOX emissions
Nitrogen oxides (NOX) are the collective term for the nitrogen oxides NO and NO2, which are significant components of harmful air pollution. NOX is formed in combustion processes, such as engines, power plants, and boilers, as well as industrial processes with very high temperatures (e.g., in smelters). Locally and regionally, NOx emissions are associated with impaired lung function and worsening of asthma, as well as respiratory diseases (e.g., COPD) and cardiovascular disease, while also ground-level ozone can be harmful to both humans and vegetation. NOx also contributes to acid rain, which harms ecosystems and vegetation, causes fish mortality, and damages materials and buildings.
What is NOX? Available at: https://www.noxfondet.no/en/articles/what-is-nox/. (Accessed: 19 September 2024).
In 2022, Norway's total NOx emissions were approximately 135,000 tonnes. The primary sources of these emissions were oil and gas extraction, the maritime industry, and road traffic, which collectively accounted for 68% of the total NOX emissions.
Menon Economics (2024). Evaluering av fritak for betaling av avgift på utslipp av NOX. Menon-publikasjon nr. 34/2024.
Figure 12: Total NOx emissions by source in 2022, tonnes of NOx
Statistics Norway, table 08941
The instrument
To fulfil the Gothenburg protocol, Norway has implemented different instruments to reduce NOX emissions over the last twenty years. These instruments include a charge, an emission cap, and voluntary contributions to a NOX fund with an accompanying tax exemption.
Norway introduced a tax on NOX emissions in 2007 with the purpose of contributing to cost-effective reductions in the emissions. The Norwegian Parliament sets the NOX tax. In 2023, the tax was NOK 24.46 (€2) per kg of NOX. The rate has roughly grown with the Consumer Price Index (CPI) since its introduction in 2007. The tax applies to:
Nordic Council of Ministers. (2023). The use of economic instruments in the Nordic countries 2018–2021. The tax applies for both the Norwegian mainland and the continental shelf. Exemptions are made for vessels travelling between Norwegian and foreign ports, vessels used for fishing and caching in distant waters, aircrafts travelling between Norwegian airports and foreign airports plus mission units covered by and environmental agreement signed with the Norwegian government for initiating measures to reduce NOX that are implemented in accordance with established national environmental goals.
- Propulsion of machinery with a total installed engine effect of more than 750 kW.
- Engines, boilers, and turbines with a total heating effect exceeding 10 MW.
- Flaring at offshore and onshore installations.
During the initial consideration of the NOX tax in the Norwegian Parliament, compensatory arrangements were proposed due to pressure from affected business organizations. Consequently, a voluntary agreement was introduced, with the possibility of tax exemption. Negotiations with the authorities in 2008 led to the NOX Fund. Business entities within the agreement pay a rate per kg of NOX emissions to the NOX Fund and are exempt from the NOX tax. The rate to the NOX fund is typically lower than the NOX tax. The income from the NOX Fund is used for emission-reducing measures at affiliated companies, which means that the members can apply for support from the fund to implement measures (Menon 2024). With typically lower rates and the possibility to pay for measures to reduce emissions (and thus payment to the fund), the NOX fund should thus be preferred by the businesses.
The development in emissions of NOX, different environmental agreements (NOX instruments) and the Gothenburg Protocol targets are illustrated in Figure 13. The environmental agreements are described in detail in Menon (2024).
Menon Economics (2024). Evaluering av fritak for betaling av avgift på utslipp av NOX. Menon-publikasjon nr. 34/2024.
Figure 13: Emissions of NOx, Environmental agreements and the Gothenburg Protocol targets (orange dots), tonnes of NOx.
Statistics Norway, table 08941.
The board of the NOX Fund sets the rates paid into the fund to achieve the environmental goal in the agreement. These are differentiated with a high rate for entities involved in oil and gas extraction and a lower rate for other businesses (including fishing vessels, shipping, land-based industry, aviation, district heating, etc.). The gap between the rates has narrowed during the agreement period according to the agreement's structure. In 2023, the rates were NOK 17 and 11 (€1.45 and 0.94) per kg of NOX, respectively, for members of the environmental agreement. The agreement has been renegotiated twice since 2008.
Menon Economics (2024). Evaluering av fritak for betaling av avgift på utslipp av NOX. Menon-publikasjon nr. 34/2024. The Environmental Agency conducts compliance checks in accordance with the agreement (every two years) and assesses whether companies affiliated with the agreement have met the emission requirements. Companies are sanctioned if the environmental goals are not met, but this has not yet happened.
The Textbox below briefly compares the instrument to corresponding instrument in Sweden. An important difference is that in Sweden the income to the system, is (neutrally) returned to the businesses, whereas in Norway the income is targeted for measures to reduce measures.
Textbox 1: Information about the NOX tax in Sweden.Anthesis (2024). Analys av stödsystem för NOX-åtgärder inom industri- och energisektorerna. Anthesis rap-port 24/1. The Swedish Government (2024). Utgiftsområde 20: Klimat, miljö och natur.
Anthesis (2024). Analys av stödsystem för NOX-åtgärder inom industri- och energisektorerna. Anthesis rap-port 24/1. The Swedish Government (2024). Utgiftsområde 20: Klimat, miljö och natur.
Emissions from the transport sector, the paper and pulp industry, as well as the electricity and district heating sectors, account for most of the NOx emissions in Sweden.
In 1992, Sweden introduced a NOx tax that today covers all operations producing more than 25 GWh of electricity, district heating, and process heat (useful energy) per year. When the tax was introduced, it was set at SEK 40 per kg of NOx emissions and included facilities producing more than 50 GWh of useful energy. The tax is SEK 50 per kg of NOx, and emissions are measured and reported continuously.
The revenues from the tax are paid back to the industry based on how much energy each establishment generates. This means that all actors within a collective pay a tax per kilogram of emissions, and the tax is then refunded to the emitters based on the distribution key. The net recipients, the winners in the system, are those who produce the lowest NOx emissions per unit of useful energy produced.
Since the introduction of the tax, soda recovery boilers and the paper and pulp industry were exempt from the tax. Recently, the Swedish government proposed to expand the NOX tax to also include soda- and black liquor boilers in a sperate permanent fee group with full reimbursement to further reduce NOX emissions. Emissions from such boilers account for a substantial share of the NOX emissions.
Possible responses
The current system involves a choice between paying the NOx tax or the contribution rate to the NOx Fund. In both alternatives, the companies face higher costs compared to the option without NOx tax and without an environmental agreement, which can lead to different responses (Menon, 2024):
- Reallocation of capital: Businesses can shift capital from activities that cause NOx emissions to other activities. This will be at a cost for businesses, and lead to reduced NOx emissions.
- Investments in low-emission technologies: Increased costs for emissions will provide an incentive to invest in low-emission technologies. With the possibility of fancial support for measures, businesses within the agreement will have a stronger incentive to do this than businesses that pay the NOx tax.
- Reducing emissions from existing operations: When operating costs increase, it may be profitable to produce less. In addition to reduced emissions, this leads to lower value creation in the businesses.
- Raising market prices: If the competitive situation in the market allows it, a company can pass part of the cost to others in the value chain. In such cases, market prices increase, which contributes to reduced demand for the product. Many of the NOx emitters are competitive businesses in an international market and have limited ability to set higher prices than their competitors.
3.5.1 Intended effect of the NOx fund
Effects on NOX emissions
Menon (2024)
Menon Economics (2024). Evaluering av fritak for betaling av avgift på utslipp av NOX. Menon-publikasjon nr. 34/2024.
Figure 14: Actual and counterfactual emissions for fishing and hunting, petroleum activities, and shipping, tons of NOx.
Menon Economics (2024). Evaluering av fritak for betaling av avgift på utslipp av NOX. Menon-publikasjon nr. 34/2024.
Today's environmental agreement is considered to provide the greatest emission reduction and is the most cost-efficient.
Menon Economics (2024). Evaluering av fritak for betaling av avgift på utslipp av NOX. Menon-publikasjon nr. 34/2024.
Other effects
Menon (2024)
Menon Economics (2024). Evaluering av fritak for betaling av avgift på utslipp av NOX. Menon-publikasjon nr. 34/2024.
Measures that reduce the use of fossil fuels also reduce CO2 emissions. This is especially true for measures that affect energy efficiency or transition away from combustion engines (electrification). If a measure reduces fossil energy use for a company by 10%, both NOx emissions and CO2 emissions from energy use decrease by 10%. Measures to reduce emissions of NOX will also lead to reductions in health costs, and damages to the environment (acidification, eutrophication), materials, and crops.
Menon Economics (2024). Evaluering av fritak for betaling av avgift på utslipp av NOX. Menon-publikasjon nr. 34/2024.
Relative to the NOX tax, the NOX Fund implies a loss of government revenue, see Figure 15. the instrument has a distributional effect, transferring benefits from other sectors in Norway primarily to the shipping and fisheries sectors. Menon (2024)
Menon Economics (2024). Evaluering av fritak for betaling av avgift på utslipp av NOX. Menon-publikasjon nr. 34/2024.
Figure 15: NOx tax and payments to the NOx fund, and hypothetical revenue to the state.
Menon Economics (2024). Evaluering av fritak for betaling av avgift på utslipp av NOX. Menon-publikasjon nr. 34/2024.
Economic instruments to reduce NOX-emissions have been thoroughly covered and analysed in the Nordic, e.g., see Coria et al. (2023), Hagem, Holtsmark & Sterner (2013), Sterner (2023), and Sterner & Fredriksson (2004).
Coria, J., Dupoux, M., Faucheux, L. & Slunge, D. (2023). What drives the substitution of hazardous flame retardants in electronic appliances in Sweden? Cleaner Waste Systems Vol. 6. Hagen, C., Holtsmark, B. & Sterner, T. (2013). Om den norske politikken for reduksjon av utslipp av NOX. Samfunnsøkonomen nr. 2 2014. Sterner, T. (2003). Instruments for Environmental Policy. The Swedish International Development Coopera-tion Agency. Sterner, T. & Fredriksson, P. G. (2004). The Political Economy of Refunded Emissions Payment Programs. Working Papers in Economics, nr 147.
3.6 The waste Incineration tax
CO2 emissions
Waste incineration involves burning waste in a furnace to recover energy. In Norway about 33% of the waste was incinerated in 2022, see Figure 16. Emissions from waste incineration has been increasing in Norway and was in 2022 almost 1 million tCO2e (about 2% of total GHG emissions).
Figure 16: Ordinary waste after treatment (in %). Exported waste is recorded under the treatment method used abroad. Imported waste is not included in the statistics. Contaminated materials that are landfilled or used as cover material are not included.
Statistics Norway (2023). Økning i avfallsmengden i 2022. Available at: https://www.ssb.no/natur-og-miljo/avfall/statistikk/avfallsregnskapet/artikler/okning-i-avfallsmengden-i-2022. (Accessed: 19 September 2024).
The instrument
The Norwegian population generates more waste per person than the European average, reaching 726 kg per capita in 2020.
The Nordic Council of Ministers (2024a). Waste incineration in the Nordic countries: A status assessment with regard to emissions and recycling. TemaNord 2024:524.
The Norwegian Ministry of Finance (2024). Skatter og avgifter 2025 (Prop. 1 LS). Available at: https://www.regjeringen.no/contentassets/aa5e7ba7a4154aecbed44df60c214f35/no/pdfs/prp202420250001ls0dddpdfs.pdf.
Emissions from waste incineration in Norway are included in the EU ETS if they result from the combustion of fuels in installations with a total rated thermal input exceeding 20 MW. This does not apply to installations for the incineration of hazardous or municipal waste.
The Norwegian Ministry of Finance (2024). Skatter og avgifter 2025 (Prop. 1 LS). Available at: https://www.regjeringen.no/contentassets/aa5e7ba7a4154aecbed44df60c214f35/no/pdfs/prp202420250001ls0dddpdfs.pdf.
Emissions from Norwegian municipal waste incinerators outside the EU ETS fall within the scope of the Effort Sharing Regulation (ESR), which establishes emissions reduction targets for non-ETS sectors. Under the climate agreement with the EU, Norway has agreed to cut its non-ETS emissions by 40% by 2030 compared to the 2005 level. Concerning non-ETS emissions from waste incineration, the main strategy is to achieve emission reductions through taxation and the implementation of Carbon Capture and Storage (CCS).
The Nordic Council of Ministers (2024a). Waste incineration in the Nordic countries: A status assessment with regard to emissions and recycling. TemaNord 2024:524.
The waste incineration tax was introduced in 2022. The tax applies to waste delivered for incineration in Norway. The purpose of the tax is to contribute to cost-effective reductions in greenhouse gas emissions. The tax is also intended to reduce other environmental damages from waste, including hazardous waste. Additionally, the tax generates revenue for the state treasury. To provide incentives for incineration plants to reduce emissions through waste sorting, these plants can apply to the Norwegian Environment Agency to use a plant-specific emission factor when calculating the tax. CO2 emissions that are captured and stored (CCS) are exempt from the tax.
The Norwegian Ministry of Finance (2024). Skatter og avgifter 2025 (Prop. 1 LS). Available at: https://www.regjeringen.no/contentassets/aa5e7ba7a4154aecbed44df60c214f35/no/pdfs/prp202420250001ls0dddpdfs.pdf.
Textbox 2: Rates for the waste incineration tax for 2024.The Norwegian Ministry of Finance (2020). Skatter, avgifter og toll 2020 (Prop. 1 LS).
The Norwegian Tax Administration (n.d.). Waste incineration tax. Available at: https://www.skatteetaten.no/en/business-and-organisation/vat-and-duties/excise-duties/about-the-excise-duties/avfallsforbrenning/. (Accessed: 19 September 2024).
The Norwegian Ministry of Finance (2020). Skatter, avgifter og toll 2020 (Prop. 1 LS).
The Norwegian Tax Administration (n.d.). Waste incineration tax. Available at: https://www.skatteetaten.no/en/business-and-organisation/vat-and-duties/excise-duties/about-the-excise-duties/avfallsforbrenning/. (Accessed: 19 September 2024).
The Norwegian Tax Administration (n.d.). Waste incineration tax. Available at: https://www.skatteetaten.no/en/business-and-organisation/vat-and-duties/excise-duties/about-the-excise-duties/avfallsforbrenning/. (Accessed: 19 September 2024).
Waste that generates greenhouse gas emission allowances pursuant to the Greenhouse Gas Emission Trading Act: NOK 176 (€15) per ton CO2.
Other waste: NOK 882 (€75) per ton CO2.
The excise duty is calculated by multiplying the amount of waste delivered, measured in ton by a factor of 0.5498 ton fossil CO2 per ton of waste. It is, as mentioned, possible to apply to the Norwegian Environment Agency for an assessment of a facility-specific factor.
The rate of the waste incineration tax was NOK 238 (€20) per ton of CO2 in 2023, NOK 192 (€16) per ton CO2 in 2022, and NOK 149 (€13) per ton in 2021.
The Norwegian Government has expressed plans to gradually increase the tax rate for waste incineration along with the standard tax rate for non-ETS emissions to about NOK 2000 (€171) per ton of CO2eq in 2030. While the three waste incineration plants currently covered under the EU ETS are also covered by the waste incineration tax, the Norwegian government also plans to consider rises in carbon tax rates in conjunction with the price of emission allowances in the EU ETS.
The Norwegian Ministry of Finance (2024). Skatter og avgifter 2025 (Prop. 1 LS). Available at: https://www.regjeringen.no/contentassets/aa5e7ba7a4154aecbed44df60c214f35/no/pdfs/prp202420250001ls0dddpdfs.pdf.
The textbox below gives a brief overview of waste incineration and relevant instruments in other Nordic countries.
Textbox 3: Legislative frameworks for waste incineration in the other Nordic countries.The Nordic Council of Ministers (2024a). Waste incineration in the Nordic countries: A status assessment with regard to emissions and recycling. TemaNord 2024:524.
The Nordic Council of Ministers (2024a). Waste incineration in the Nordic countries: A status assessment with regard to emissions and recycling. TemaNord 2024:524.
Waste incineration plays a major role in the Nordic countries, both as a means of decreasing waste volumes while avoiding landfills (which are not used for untreated waste on a large scale anymore in the Nordics) and in terms of energy delivery to industry and households, especially in district heating. The Nordic countries have a higher incineration capacity than is fulfilled from their domestic waste. The gap is filled with imported waste from other countries. With the district heating sector decarbonizing its operation, fossil emissions stemming mainly from the incineration of plastic waste make up a large part of the total fossil CO2 emissions in district heating.
Common for all Nordic countries is a considerable integration between waste incineration and the district heating sector. Legislation and rules, however, differ between the countries. Examples are national implementation of the ETS trading scheme and taxation (such as in Denmark and Sweden), but also whether changes in capacity are legally specified. Denmark, for example, has an active policy goal to reduce the waste incineration capacity. The other countries in the Nordics, on the other hand, currently do not have any goals to reduce their waste incineration capacity. For Finland in particular, waste incineration plants have been installed more recently, resulting in incentives for the energy companies to continue using the existing infrastructure at least for its technical lifetime. A political goal of reducing the capacity in turn would be counteractive to these incentives.
Ambitious political circular economy goals are in place in all the Nordic countries. Whether they can be reached depends primarily on the future use of plastics, both concerning their amount, composition and sorting rates. Illegal handling of waste is a problem, especially where high gate fees and a lack of legal consequences suggest a high financial return at low risk.
Possible responses
The waste incineration tax can lead to different effects:
The Norwegian Ministry of Finance (2024). Skatter og avgifter 2025 (Prop. 1 LS).
- It can reduce the volume of products that create emissions during incineration (in this case, fossil waste).
- It can also incentivise better waste management (sorting, reuse, or recycling) and investment in new emissions-reducing technologies, including carbon capture and storage (CCS).
Incineration plants have several ways to adapt to the tax. They can pass the tax on through higher prices for waste management. Parts of the industry have claimed that there is no room to increase prices for waste management services due to strong competition from Sweden and Denmark. However, The Norwegian Ministry of Finance (2024)
The Norwegian Ministry of Finance (2024). Skatter og avgifter 2025 (Prop. 1 LS).
The Norwegian Ministry of Finance (2024). Skatter og avgifter 2025 (Prop. 1 LS).
The waste incineration tax incentivizes incineration plants to reduce emissions through better waste management. They can invest in new systems for sorting the fossil part of the waste and apply for a lower facility-specific emission factor. This results in a lower overall tax cost for plants that sort out a large portion of their fossil waste. CO2 emissions from waste incineration that are captured and stored (CCS) are exempt from the tax. This exemption gives facilities that implement CCS technology a competitive advantage, as the variable costs represented by the tax will be lower for these facilities than for those that do not invest in CCS technology.
The Norwegian Ministry of Finance (2024). Skatter og avgifter 2025 (Prop. 1 LS).
3.6.1 Intended effect of the waste incineration tax
Effects on emissions
Figure 17 shows the CO2 emissions from waste incineration in Norway over time. The figure indicates some reduction in emissions from 2018 to 2022. It is challenging to estimate any causal effect on emissions by the tax. Generally, the effects tend to be larger over time. This is typically the case when businesses need to invest in new production assets or organize production in new ways to adapt to the tax. Business cycles, tax levels in other countries, and technological developments will also influence the development of emissions in the sector.
Figure 17: CO2 emissions from waste incineration in Norway 1990–2022.
Statistics Norway, table 08940
Other effects
The Norwegian Ministry of Finance (2024)
The Norwegian Ministry of Finance (2024). Skatter og avgifter 2025 (Prop. 1 LS).
- that the waste incineration tax provides facilities with incentives to reduce emissions by rewarding facilities that invest in emission-reducing measures and separate the fossil part of the waste,
- further increases in the waste tax level towards 2030 could negatively affect the competitiveness of Norwegian facilities and the profitability of Norwegian district heating production.
- suggestion to keep the waste incineration tax practically unchanged in 2025. The tax will be further increased to the general level in 2026 following the climate plan.
A tax on waste incineration will make district heating production more expensive, either directly by having the district heating producers pay the tax or indirectly by forcing producers to shift towards other, initially more expensive, energy sources. The tax on waste incineration contributes to the transformation of the Norwegian economy, but in isolation, it will reduce the amount of district heating produced in Norway.
The Norwegian Ministry of Finance (2024). Skatter og avgifter 2025 (Prop. 1 LS).
The Norwegian Ministry of Finance (2024)
The Norwegian Ministry of Finance (2024). Skatter og avgifter 2025 (Prop. 1 LS).
The tax could lead to carbon leakage. In 2022, 68% of waste exported from Norway went to Sweden and 14% to Denmark. Until 2024, Swedish and Danish incineration plants within EU ETS faced higher carbon prices than the Norwegian tax, so the waste tax did not disadvantage Norwegian businesses competitively. However, in most of 2024, the Norwegian tax exceeded the price in EU ETS. Swedish and Danish plants face lower emission prices because their calculations use lower emission factors. Norwegian waste exports decreased between 2017 and 2023. Despite a nearly 25% tax increase from 2022 to 2023, exports to Sweden also declined. The development in the export and import of combustible waste for 2017–2022 is shown in Figure 18. Multiple factors influence export volumes, making it difficult to attribute changes directly to the tax. The government's plan to raise the tax to NOK 2,000 (€171) by 2030 could disadvantage Norwegian businesses. If the tax leads to increased waste exports to the EU, the impact on emissions becomes uncertain, as these emissions would fall under the EU ETS. Waste export could contribute to increased emissions from transport, depending on distance and the transport method.
The Norwegian Ministry of Finance (2024). Skatter og avgifter 2025 (Prop. 1 LS).
Figure 18: Development in the export and import of combustible waste 2017–2022.
The Norwegian Environment Agency (2024). Eksport og import av avfall.
Emissions from waste incineration contain harmful substances that can negatively impact health and the environment, including dust, NOx, acidifying compounds such as HCl, HF, and SO2, as well as environmental toxins like heavy metals and dioxins. Some waste incineration plants use treatment systems that also result in emissions to water. In addition, new types of waste are generated, such as bottom ash and filter dust, which must be properly managed.
The Norwegian Environment Agency (2024). Eksport og import av avfall.
In a circular economy perspective, the tax could translate to increased costs for households and businesses to dispose of waste and thus contribute to more efficient resource use. Norway has one of the highest consumption levels per person in the world, and only 2.4% of all materials used in Norway are recycled back into the economy.
SNL (2023). Sirkulær økonomi.
Textbox 4 summarises recent studies on the effect of economic instruments within the circular economy. These studies show that economic instruments to promote circularity have been implemented in Norway, other Nordic countries, and the EU in recent years. Additionally, the studies show that economic instruments can be used to both achieve reduced emissions and circularity. It is mentioned that cooperation between countries especially can be useful as both emissions and poor waste management are issues that often span across countries.
Textbox 4: Economic instruments and the circular economy.SOU (2024: 67). Om economiska styrmedel för en mer cirkulär ekonomi (SOU 2024:67). NILU (2024). Nasjonalt samfunnsoppdrag om sirkulærøkonomi: Forslag til organisering. NILU rapport 2/2024. The Nordic Council of Ministers (2024b). Policy Options for Reducing Consumption-Based Emissions. TemaNord 2024:545. Menon Economics, Cicero, NIBIO, NIVA & Sintef (2024). Litteraturoversikt: effekter av økonomiske virkemidler for å fremme sirkulær økonomi. Notat 1/2024.
SOU (2024: 67). Om economiska styrmedel för en mer cirkulär ekonomi (SOU 2024:67). NILU (2024). Nasjonalt samfunnsoppdrag om sirkulærøkonomi: Forslag til organisering. NILU rapport 2/2024. The Nordic Council of Ministers (2024b). Policy Options for Reducing Consumption-Based Emissions. TemaNord 2024:545. Menon Economics, Cicero, NIBIO, NIVA & Sintef (2024). Litteraturoversikt: effekter av økonomiske virkemidler for å fremme sirkulær økonomi. Notat 1/2024.
Menon et al. (2024) have analyzed literature on effects of different economic instruments on circularity. Waste taxation was one of these instruments. The study found that taxation of landfills in the UK was successful in both generating state revenue, reducing the waste being sent to landfills and increasing the rate of recycling. Similar effects have been found from the introduction of landfill tax in Italy. Other studies that have evaluated landfill taxation and incineration taxation in in Norway found relatively modest effects of the taxes on waste streams. In general, the study by Menon et al. found that effects of other instruments (such as taxes on materials for use in construction etc.) on circularity are often small.
In Norway, the Ministry of Climate and Environment is considering a “mission” for the circular economy aimed at the implementation of circular solutions, with a focus on green and digital transformation. NILU is supporting the ministry and has inter alia proposed how to organize the mission (NILU 2024). Several workshops have been held to limit the focus for the missions’ objectives. The focus for the objectives of the mission have now been limited towards reduced consumption, reuse, and sharing economy. Some of the main take-homes from the workshops are that economic instruments are relevant to make business models viable. Regulations and development of standards are however central.
Recently, a committee appointed by the Swedish government released a report on financial governance to promote the transition to a circular economy (SOU 2024:67). The committee finds that the regulation of the circular economy is becoming increasingly comprehensive and is increasingly occurring within the EU. Waste management was one of the first areas to be regulated within the EU, with a focus on protecting health and the environment, as well as promoting recycling. These fundamental rules for waste management have influenced the formulation of other regulations. The committee also found that economic instruments specifically aimed at developing a more circular economy, are relatively rare. This could be due in part to the difficulty of implementing such instruments at the EU level, as well as the challenges in designing national economic instruments that achieve the desired purpose.
The Nordic Council of Ministers (2024) recently released a report on policy options for reducing consumption-based greenhouse gas emissions and other air pollutants across the Nordic countries, especially focusing on key consumption sectors. The main message of the report is that available consumption-based emissions statistics and trends motivate and support policy action. This action could be further supported by improved statistics, clear policy ambitions and Nordic cooperation. Furthermore, their mapping shows that there is no lack of possible options for policymakers that seek to reduce consumption-based emissions. Further analysis to combine promising policies in actionable and effective packages is recommended. In the report, it was also mentioned that consumption-based emissions often involve multiple countries, and coordinated approaches can be especially effective.
3.7 Aviation tax
The Swedish aviation tax was introduced in 2018
Skatteverket (2024). Flygskatt.
SVT (2018). I april införs nya flygskatten – SAS hotar flytta avgångar.
3.7.1 Intended effect of policy instrument
To understand the impact of an aviation tax, it is important to be aware of both income elasticities, price elasticities, and other possible behavioural impacts of a tax. Causal claims cannot be inferred from simply comparing flight data before and after a tax was introduced.
Only a few studies have assessed the impact of the Swedish aviation tax. A notable study is a dissertation by Stråle (2022).
Stråle, J. (2022). Travel demand and environmental policy.
Stråle, J. (2021). Household level heterogeneity in the income elasticities of demand for international leisure travel.
With a Conditional Cencored Quantile Regression (CCQR) they compare the income elasticity of each percentile (Quantile) of households with similar characteristics (conditional), not including roughly the half of households with no international air travel in a given year (censored).
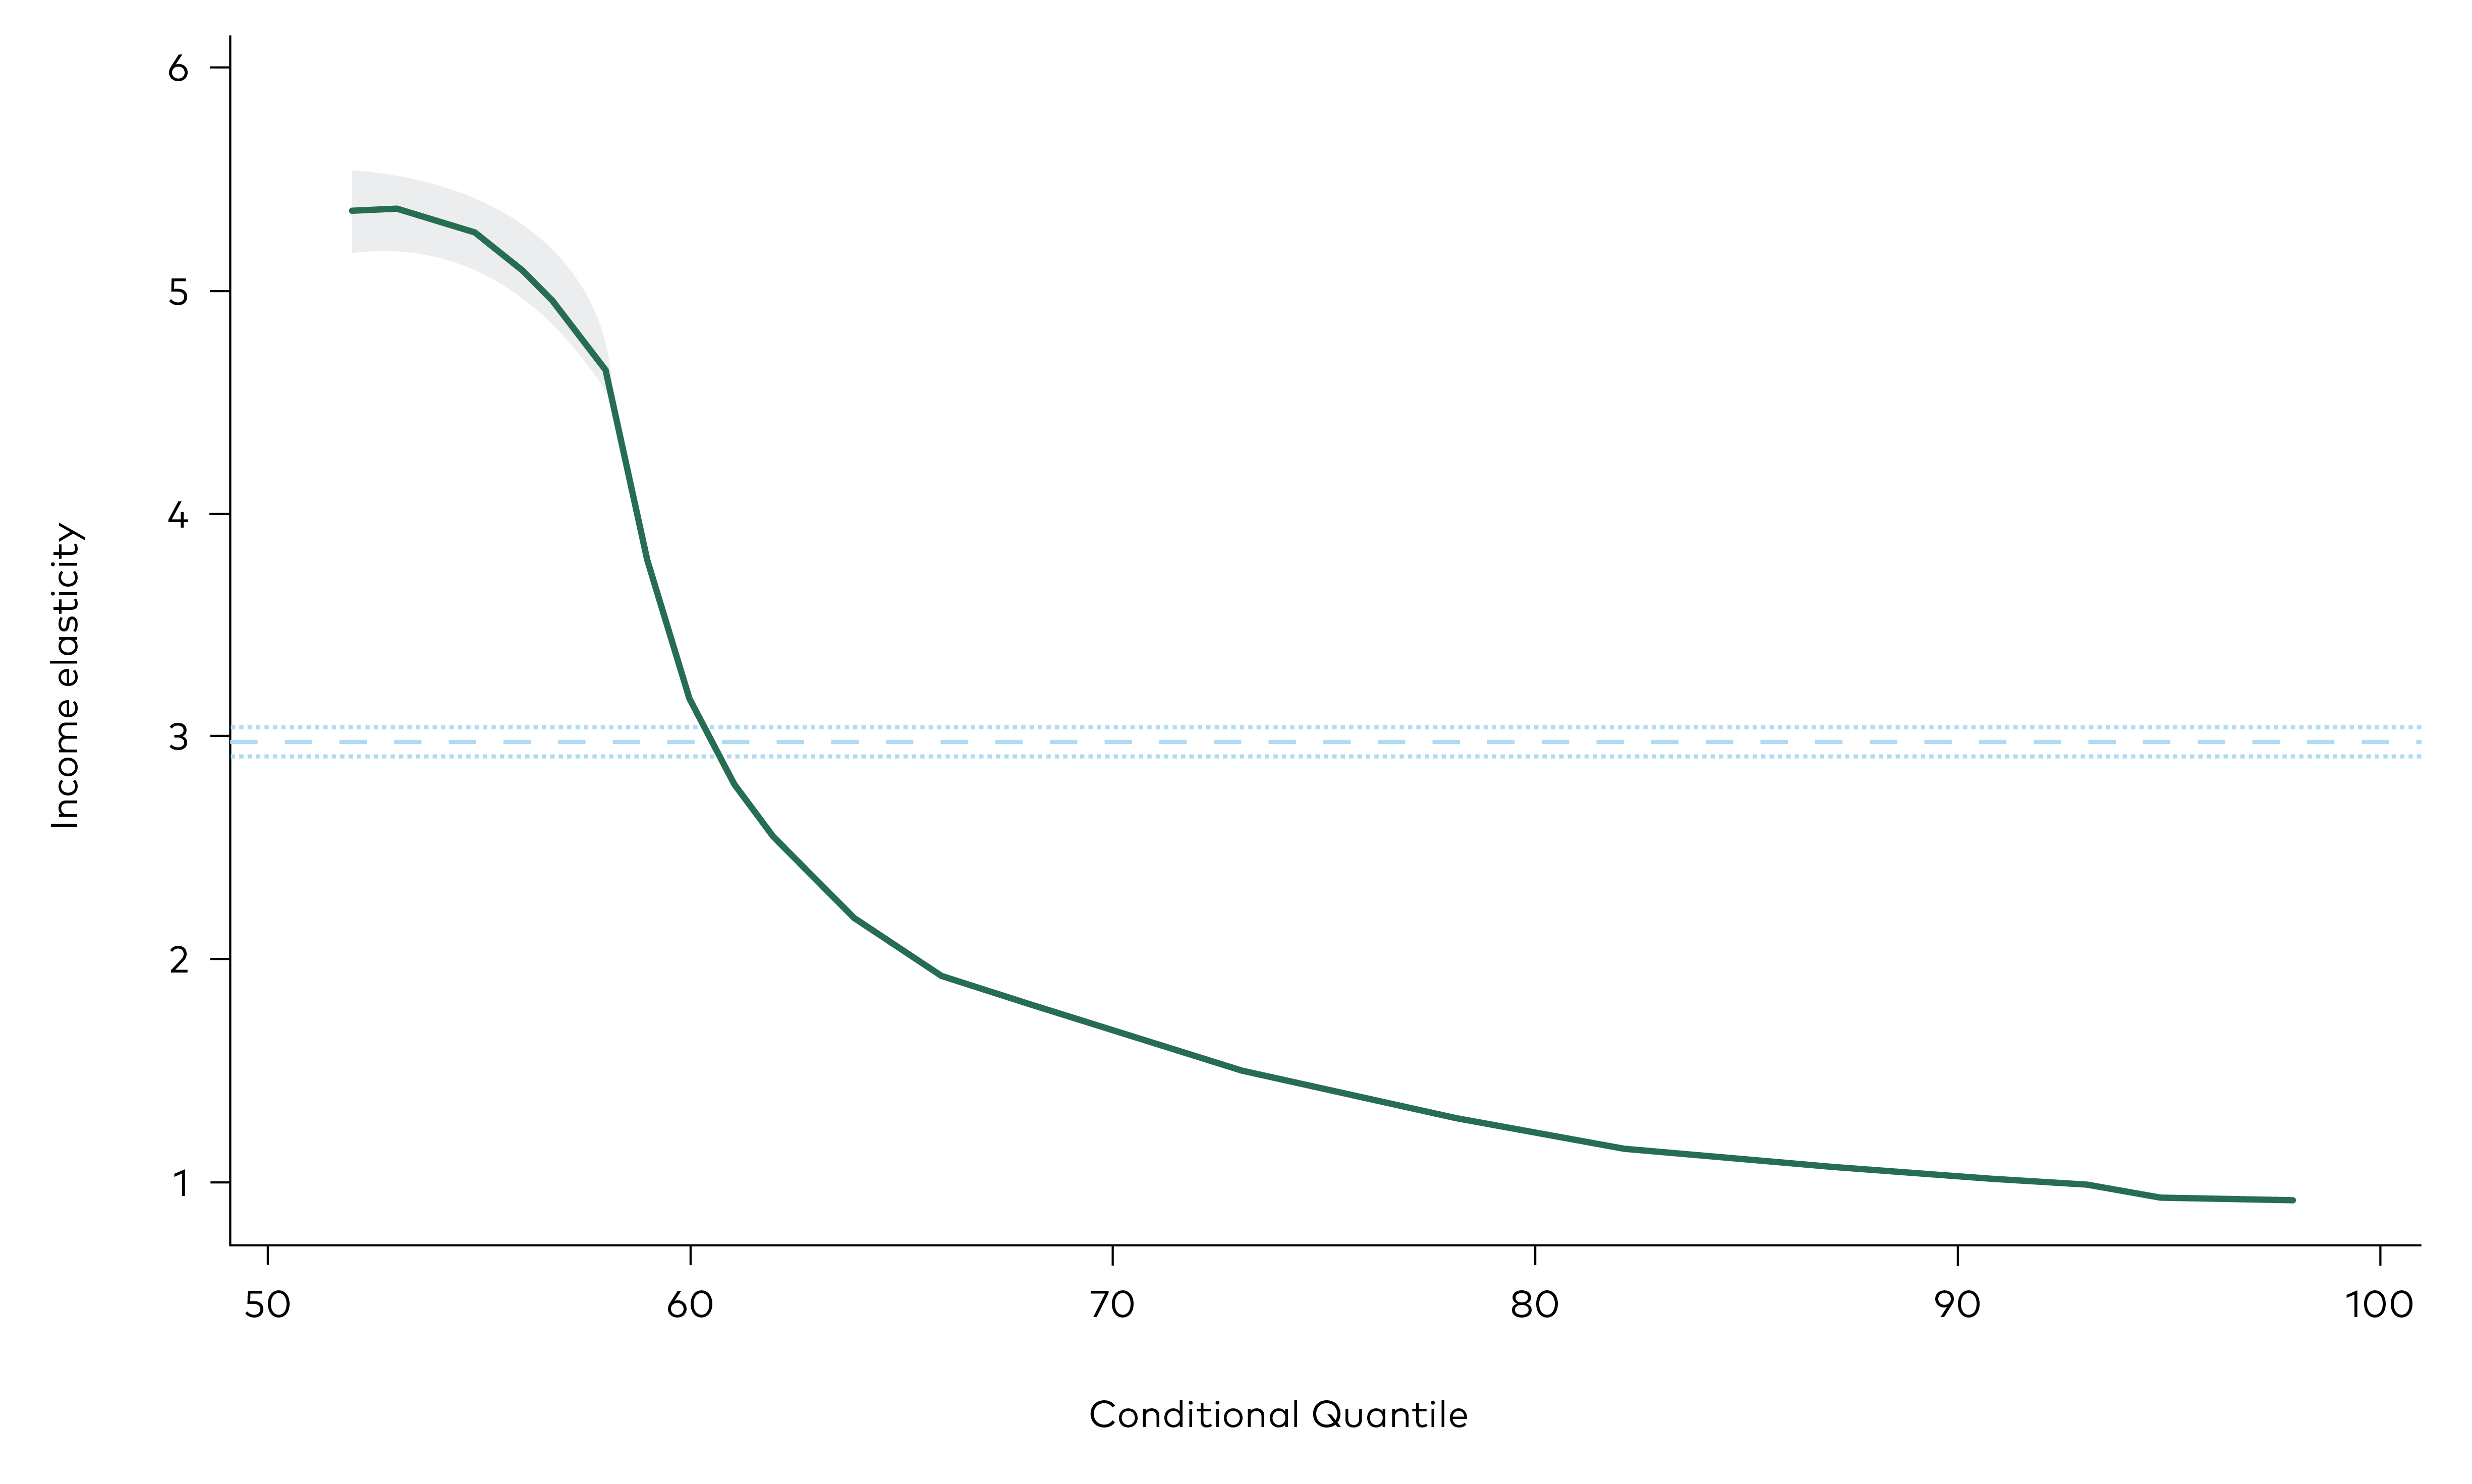
Figure 19: Income elasticity of international air travel in Sweden (Stråle, 2022).
In a second paper, currently a Working Paper, Stråle
Stråle, J. (2021). The Effects of the Swedish Aviation Tax on the Demand and Price of International Air Travel.
The results show a clear reduction in airfare travel following the aviation tax. Under the first quarter following the introduction of the tax, travel was reduced by 6%. This effect increased over time, reaching 13% in the last quarter of 2019. However, no significant impact is found on prices. This indicates that there is some other effect that drives the reduction in air travel from the introduction of the tax. Stråle explains this as likely being an effect of the media attention that made the negative external effects of flights more salient. It is also not straightforward to conclude that prices were not affected (lack of evidence of an effect is not evidence of no effect). The impact on travel quantities, however, were still larger than the expected impact that could have been explained by the price elasticity and an increase in the price of the same magnitude as the tax. This is verified by estimations of the price elasticity using web-scraping of flight prices and quantities of flights consumed. The estimated price elasticity is -0.76. Regardless of uncertainties regarding the price effects, this study shows that the impact of the aviation tax was significant, with a larger impact than what could be explained only by the price elasticity. Additional behavioural impacts played an important role.
A similar study, using the same methodology, showed that the introduction of the German aviation tax significantly reduced the number of flights in Germany.
Borbely, D. (2019). A case study on Germany’s aviation tax using the synthetic control approach.
The aviation tax is progressive. High-income groups spend a higher share of their income on air travel compared to low-income groups. As income levels increase over time, flight transportation is likely to increase as well. This increase will be driven mainly by currently infrequent fliers, who have a high-income elasticity. In the long run, any impact of a tax (if not at significantly higher levels) is likely to be dwarfed by income effects.
The aviation tax was set at a rather low level, far below a Pigouvian tax rate that would capture the whole social cost of carbon. Still, the tax has been one step in the direction of internalizing external costs, which can be seen as better than nothing. Mostly, however, it may act as a symbol tax, suggesting that flights are something that the government understands hurts the environment and is something that we should actively try to minimize. The tax design, however, is far from what economists would call “first-best”. A first-best aviation tax would put a price on the damaging source rather than the end product. It would tax the fuels (with some modification to also adjust for contrail effects) rather than the number of travellers. Such a tax would not only reduce demand by higher prices, it would also provide incentives for the flight companies to use cleaner alternatives fuelling the flights. In an ideal world, the tax would also be international.
Taxes such as the aviation tax can also be seen as signal taxes, signalling to the industry how the government wants the industry to look in the future. However, for air travelling, the confidence in technical solutions that can effectively replace the currently highly polluting fuels is likely low. These technical solutions are starting to appear but are at no capacity to replace any large share of current fuel use. Once confidence in these types of alternatives rise, governments may want to use policies to signal that the industry needs to transform.
Emissions from international aviation is part of the EU ETS. However, the ETS only covers flights within EU. It also does not account for additional negative externalities from high-altitude effects, which amount to roughly 40% of the total climate impact from aviation.
Larsson, J., Elofsson, A., Sterner, T. & Åkerman, J. (2019). International and national climate policies for aviation: a review.
The acceptance of the policy has been varied. While the aviation industry has argued against the tax, public acceptance has been relatively high. However, when compared with other less stringent policy alternatives, the tax is less popular.
Larsson, J., Matti, S. & Nässén, J. (2020). Public support for aviation policy measures in Sweden.
Matti, S., Nässén, J. & Larsson, J. (2022). Are fee-and-dividend schemes the savior of environmental taxation? Analyses of how different revenue use alternatives affect public support for Sweden’s air passenger tax.
Larsson, J. et al. (w.d)
3.7.2 Cross Nordic outlook
Among the Nordic countries, only Sweden and Norway have existing aviation taxes. The tax in Norway is similar to the Swedish design, was introduced in 2016, and has also been subjected to criticism and debate. Denmark will implement a very similar policy in 2025. In Finland, an aviation tax has been proposed and discussed, but never implemented. A study on the potential effectiveness and cost of aviation taxes in Finland compared alternative policy designs.
Valtioneuvosto, Statsrådet (2022). Undersökning ger ny information om alternativ för genomförande och effekter av flygskatt i Finland.
3.8 Plastic bag tax
Sweden introduced a plastic bag tax in May 2020 to comply with EU directives targeting plastic waste reduction. The tax imposes a SEK 3 (equivalent to €0.26, 09/12-2024) levy per plastic bag on manufacturers and importers, raising checkout prices for consumers. It aims to reduce single-use plastic consumption by encouraging the use of alternatives like reusable or paper bags. This measure responds to the EU’s broader directive to limit plastic bag consumption to 40 bags per capita by 2025, primarily to combat litter and reduce ecological harm.
Nielsen, T. D., Holmberg, K., & Stripple, J. (2019). Need a bag? A review of public policies on plastic carrier bags – Where, how and to what effect?
Martinho, G., Balaia, N., & Pires, A. (2017). The Portuguese plastic carrier bag tax: The effects on consumers’ behavior.
Regeringskansliet (2023). Plastpåseskatten ska avskaffas.
Central to the evaluation of the plastic bag tax is understanding the motive behind its introduction. Although there has been some confusion surrounding the rationale, the primary purpose was to comply with EU directives aimed at reducing plastic bag consumption to minimize litter. The Swedish government’s response to this directive was the implementation of the tax. In assessing the tax's success, we can either focus on its specific impact on plastic bag consumption or adopt a more holistic approach, examining how the tax influences various behaviours with broader effects on the environment and climate.
3.8.1 Intended effect of policy instrument
Available evidence reveals a substantial reduction following the tax’s introduction. However, most estimates are based solely on comparisons between pre- and post-tax sales figures. While the tax likely influenced demand, several other factors could also have contributed, such as increased media attention, heightened public awareness, and store practices like routinely asking customers if they need a bag. The most comprehensive analysis, to the authors' knowledge, was conducted by Romson et al.
Romson, Å., Boberg, N., Erikccon, F.A., Herlaar, S. & Sanctuary, M. (2022). Försäljningseffekter av skatt på plastpåsar.
Romson et.al. note a substantial difference in both plastic bags sold, and paper bags sold before and after the tax. However, to better isolate the specific tax impact from other influences, they conduct analyses accounting for potential seasonal trends and shifts related to the COVID-19 pandemic, which may have affected stores in varying ways. For instance, travel patterns likely differ by store location, with some stores more frequently accessed by car, while others see higher foot traffic or public transport usage. The authors use a difference-in-difference (DiD) regression analysis. This method allowed the authors to compare pre- and post-tax sales data and estimate the tax effect separately from other external influences. Fixed effects were included for each store to account for store-specific effects. Key data was gathered from 43 grocery stores across Sweden, focusing on monthly sales volumes of plastic and paper bags as well as store revenue from January 2020 to September 2022. Results from the analysis revealed an 83% decrease in plastic bag sales per unit of revenue and a 103% increase in paper bag sales, suggesting consumers switched to paper bags as a less expensive option. A survey conducted in February 2022 further supports these findings, showing that nine out of ten consumers frequently bring their bags, with 70% preferring reusable bags like cloth or multi-use options. These findings show that the tax substantially shifted consumer behaviour, reducing reliance on single-use plastics and instead increasing the use of alternatives in Sweden.
We can also not entirely exclude the possibility that the large shift in consumer behaviour was partly an effect of a general attitude shift. Due to the nationwide tax implementation, the study by Romson et al could not include stores unaffected by the tax as a control group. Instead, they rely on the assumption that the tax was the only time-varying change that influenced consumption from a store-level perspective. The authors suggest future research could compare Swedish stores with those in neighbouring countries without the tax. Another factor influencing plastic bag use may be how cashiers ask customers about bags. In Swedish grocery stores, customers typically choose bags themselves, while in other types of stores, cashier behaviour may have a greater impact.
Given the goal of reducing the consumption of plastic bags, the tax must be seen as successful. With a more holistic view of goals and considering the entire negative externalities and paper bag consumption, the success is less clear. To the best of our knowledge, we lack holistic studies that explore both the causal impacts of the tax, combined with LCA of the negative impacts of both alternatives.
3.8.2 Cross Nordic outlook
Denmark introduced a tax on plastic bags in 1994, requiring retailers to pay a levy per bag, which is often passed on to consumers. This approach has significantly reduced plastic bag usage, from 800 million to 400 million bags,
European Union (2019). The case for taxing plastic.
Lindin, I.K. (2023). Kraftig fall i plastposesalget, men hva så?