2. Background
Externalities
Side-effects caused by anthropogenic activities are often referred to as externalities. Examples of this can be pollution, eutrophication, and reduced biodiversity. However, externalities may also be something positive, such as bees from beehives pollinating nearby fruit trees. Third parties can be dependent on these externalities, as shown in Figure 1, and if the impact is negative this causes societal problems where the cost often lands on the third party, or at the society. This Impact – Dependency explanation is a part of the Natural Capital Protocol, where the importance of including the cost from adverse effects from human activities into decision makings is discussed (Natural Capital Coalition 2016). One guiding principle within the EU environmental policy is the “polluter pays principle” which says that the driver of the impact must either reduce their impact or compensate those suffering from the reduction in the natural capital.
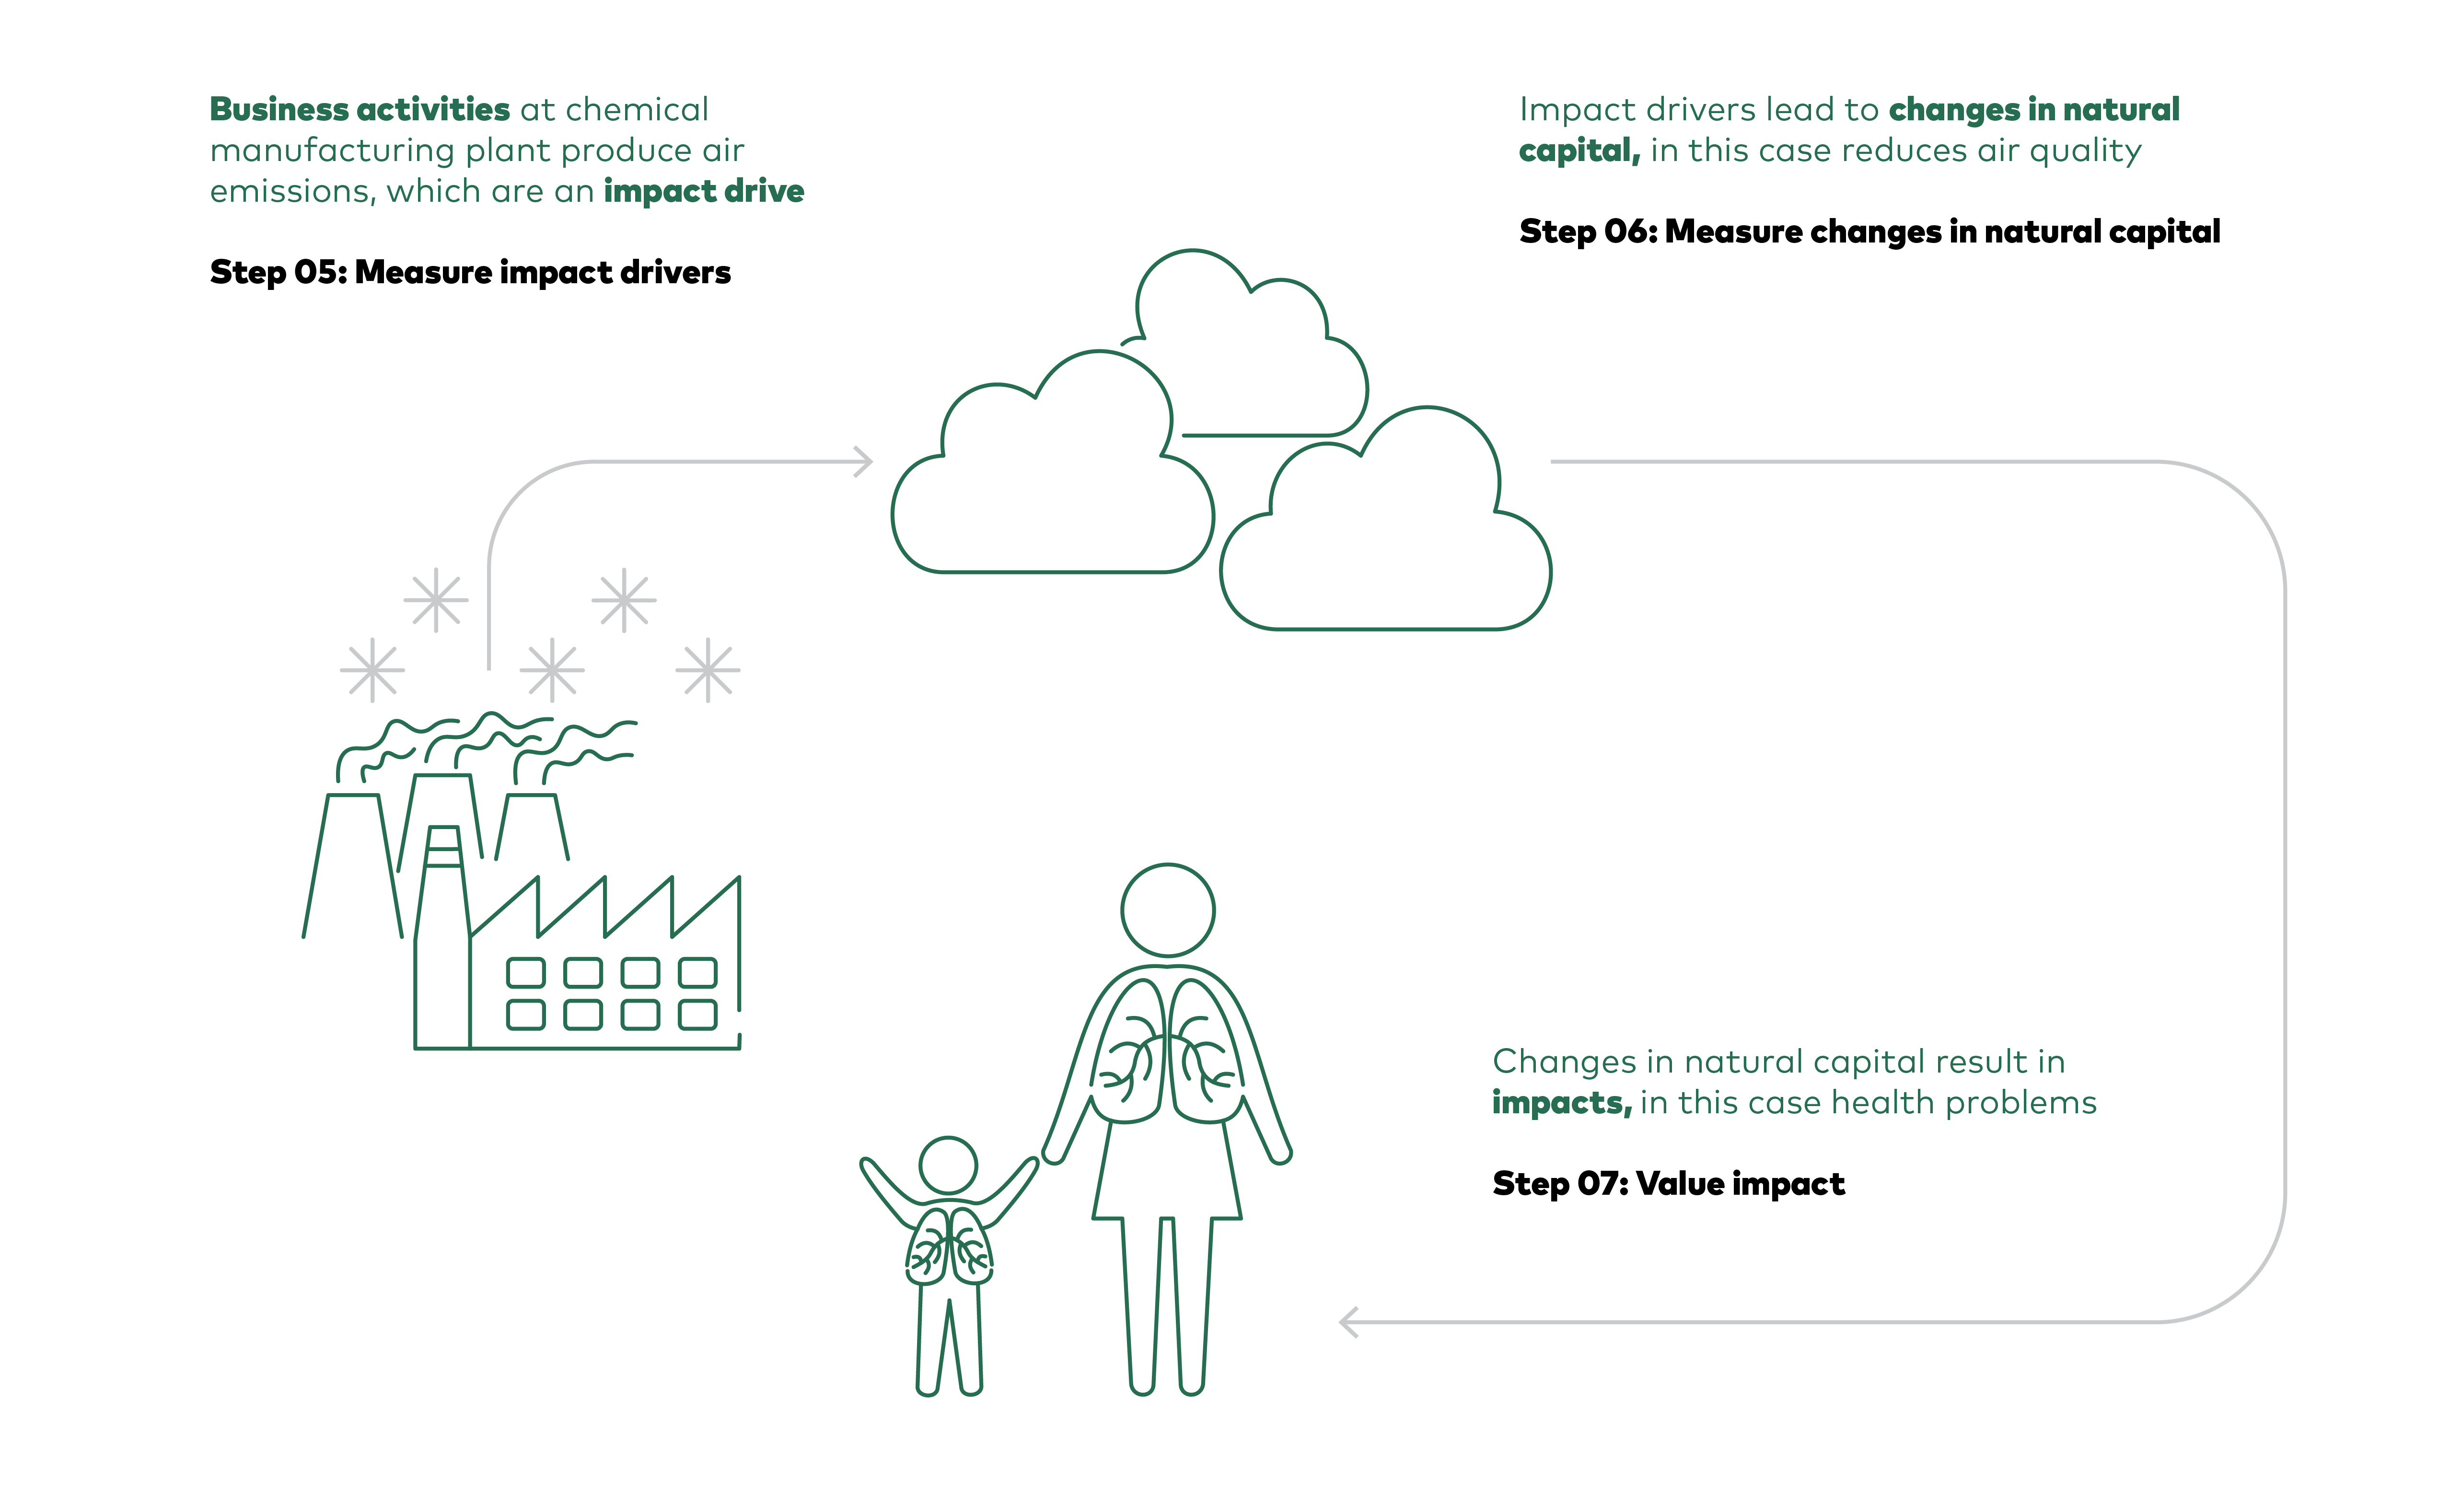
Figure 1 Impact pathways as described by Natural Capital Protocol.
Economic benefits
Nature-based solutions (NBSs) offer multiple economic benefits, including direct protection against sea-level rise, storm surges, and rainfall damage. They also deliver broader sets of benefits such as enhanced public health benefits, biodiversity, and ESSs in terms of regulating ecosystem services like water purification (improved water quality) and, carbon sequestration, as well as cultural ecosystem services in terms of recreational, landscape aesthetical and educational benefits.
For the topic of societal benefits, the question who the beneficiaries are, and who should pay for these benefits arise. The EU line that the polluter should pay is clear, there may however be occasions where the driver is unknown, or for other reasons cannot be held responsible, and in such cases the society must address the problem. Actions to reduce adverse effects might also be taken by other agents, and in such cases these agents may be compensated by the society. An example of this is the scheme implemented by the Swedish Forestry Agency were forest owners gets financial compensation for letting out their land for restoring old wetlands (Gråd, Isaksson, and Eriksson 2024). Other examples related to this report is how to share costs for a reduction of nitrogen and phosphorous running out in the Baltics, where the beneficiaries clearly are all countries around the Baltic Sea.
Regardless of who address the negative externalities, to form well informed decisions with the purpose of maximising societal benefit, the improved natural capital should be monetised and included in the decision process.
We have identified several positive externalities from NBSs, and, in this chapter, we will briefly discuss some of them.
Carbon sequestration
Emissions of greenhouse gases is a global problem, with massive social costs. Reestablishing wetlands may be one part in sequestrate carbon back into the soil, especially on peat rich areas. For this project we estimate possible sequestration of CO2 to be between 0.48 and 3.76 ton/ha/year giving a span of sequestrated CO2e/ha/year from 1.76 ton until 13.80 ton (Lin 2020). We further follow the recommended social cost of carbon with marginal reduction in societal cost being in the range of 6.7 to €222/ton CO2e (WGI 2021).
Water purification
Wetlands that capture runoff water originating from agricultural areas also capture excessive nutrients that would otherwise lead to eutrophication of lakes, rivers, and coastal areas. Under optimal conditions, wetlands may absorb up to 100 kg of phosphorus (P) and 1,000 kg of nitrogen (N) per hectare annually. Such optimal conditions are not to be expected from all wetlands, but an average annual uptake of 50 kg P and 500 kg N per hectare is a reasonable assumption (Weisner, Johannesson, and Tonderski 2015). The benefits in terms of avoiding or reducing eutrophication can be monetised using a damage function approach where the avoided damage costs can be valued either averting prevention costs (such as water purification expenses), replacement costs (in terms of building a water treatment plant with the capacity of needed to capture the nutrients captured by the wetland), or stated preference methods (Contingent valuation (CV) or Discrete Choice Experiment (DCEs) in terms of mapping affected households’ WTP to avoid this eutrophication scenario. For this report we use the values recommended by the Swedish Environmental Protection Agency which are based on contingent valuation surveys of households willingness-to-pay for improved water quality from reduced eutrophication (Söderqvist and Wallström 2017).
Besides nitrogen and phosphorus, wetlands might also capture microplastics from runoff storm water. The filter effect varies depending how close to an urban area the wetland is, and since microplastic have only recently been identified as an environmental stressor, there is a lack of empirical scientific evidence to quantify the impacts. The damage cost of plastics that reach the ocean was however, estimated to be between $3,300 and $33,000 per metric ton in 2019 by Beaumont et al. (2019).
Another positive water related effect is the reduction of water flow peaks in the water management system, when water is slowed down on its way out to the ocean, rather than running directly to the drainage systems. This benefit is hard to estimate, since a water treatment plant has both running cost in the form of energy used, but also an investment cost based on load at the peaks. For this report we only estimate the reduction in operational costs, and this is estimated to between SEK (2.0–5.0)/m3 (Karras and Read 2016)
Increased Biodiversity
Increased biodiversity increases people’s wellbeing by providing both use and non-use values, in terms of recreational value and existence and bequest values, respectively. These benefits can be measured in stated preference (SP) surveys where a representative sample of the affected population (usually those living close to an implemented NBS) are asked their willingness to pay (WTP) for a specific increment in biodiversity in the area. In a study in Germany, Meyerhoff, Angeli, and Hartje (2012) found a value of €2,360 to €8,780 per year and hectare of restored wetlands. Another way of monetising increased biodiversity from greening is to estimate the value of reduced land-use. This method is particularly useful in dense urban or industrialised areas. Sustainable Impact Metrics estimate the eco cost value by reduced land-use in the Nordics to €6,900/hectare (Sustainability Impact Metrics 2024). This estimate is based on a biodiversity factor for the Nordic countries of 0.125 on a scale from 0 to 1, where 1 represents countries where a large part of the country consists of rainforest.
Recreational and educational values
Besides contributing to increased biodiversity, reestablished wetlands may also contribute with cultural ES in terms of educational, landscape aesthetical, and recreational values to the people living nearby. Both the educational as well as the recreational values may be enhanced with information boards and excursion spots in and nearby the wetlands. A discrete choice experiment (DCE) in England and Wales estimates the annual educational benefits to be in the range of £93 to £98 per hectare reestablished wetland, and the corresponding span for annual recreational value per hectare in the same study is £245 to £472 (Christie and Rayment 2012). Vegetation is known for its calming effect on people, especially in urban areas. There is therefore a recreational value from greening in terms of increased blue and green infrastructure in urban areas. Here we use estimates from Fruth et al. (2020) indicating annual values of 94 - 105 €/person for street greening, and 68 -100 €/person for green facades.
Reduced effects from Urban Heat Islands
Urban Heat Islands (UHI) occur in urban areas due to an increased amount of heat absorbing materials such as concrete and asphalt combined with a lack of temperature regulating vegetations. This together with additional heat emissions from anthropogenic activities results in the UHI phenomenon. In a warmer climate the adverse effect from UHI is increasing, and health issues correlated to heatwaves are thereby increasing. In a Nordic context this effect is still relatively small, but a study by Huang et al. (2023) indicates that also for the bigger Nordic cities there is an estimated annual UHI related cost of deaths of around €50/capita. The same study concludes that a reduced imperviousness by 10 percent reduces the cost related to increased mortality by around one € per person per day during a heatwave. One way to reduce the UHI effect is to increase the surface greenery in the city. This may be done by green roofs, green facades, trees, and plant boxes in the streets as well as more parks. Measures like this may reduce the surrounding temperature from 1oC up to as much as 6oC in the surrounding areas (Bergen 2010) .
Opportunities for benefit transfer
Desk research, such as this, does not include performing new Revealed Preference (RP) or Stated Preference (SP) studies to value the identified externalities. Instead, we rely on existing studies and use benefit transfer techniques (or more general; value transfer, as both benefits and costs can be transferred): we apply recent guidance for environmental benefit transfer (Johnston et al. 2021) and seek to find valuation studies that value approximately the same change in the environmental good as in our case studies; both in terms of the baseline level, size and direction of change (increment/decrement), over the same type affected population (local, regional, national) and close geographically (same country or neighbouring countries) and in time (recent valuation studies are preferred over older ones). As individual preferences for both public health and environmental goods and ecosystem services vary spatially, with income level and over time; recent high-quality valuation studies from countries with similar average income level (in terms of Gross Domestic Product (GDP) per capita) as well as institutional and cultural contexts are preferred for benefit transfer. When there are spatial and temporal differences, these need to be adjusted for and/or transfer error bounds added to the monetary estimates used (Ready and Navrud 2006). In the valuation of ESs from NBS, Zanini et al. (2024) points out the importance of considering the quality and validity of the original valuation studies used for benefit transfer, and described a framework for benefit transfer from ESS impacted by NBS, that will be applied here.
Discount rates and time horizons
When annual future costs and incomes are recalculated to a Net Present Value the discount rate, the rate at how we valuate the future compared with today, must be set. On this topic there are suggestions ranging from 1.4% p.a. discussed in the Stern report up to 3.5-4% p.a. used by countries when discounting future events. Another approach used by some Nordic countries is to use a discount rate declining over time in two or more steps. Since the choice of discount rate has a significant impact on the net present value, especially under longer time horizons, we in our report perform the calculations with the three different discount rates 2, 3, and 4 percent.
Regarding the choice of time horizon, we choose to base our calculations on a 70-year timespan. The principle here is to base it on the expected life-length of the implemented solution, but rather than using different time horizons for the different projects we see a value in increasing the comparability by having the same horizon for all our identified solutions. We also assume that for implementation with a short life expectancy, reinvestments will be made during the 70-year span to maintain the full effect. Further, since the discounting effect on the net present value is high, the difference between 70 and 100 years in time horizon increases the NPV with less than 10%.