4. Results and Discussion
The number of phytoplankton (including microzooplankton) species detected from the different sample volumes showed no trend in terms of sample volume (Table 1). In some instances, the highest number of species was detected from the smallest sample volumes (20 mL and 200 mL). However, the majority of detected species were consistently present across all sample volumes (Figure 4). This indicates that the sample was well-mixed before subsampling for different volumes and that all tested sample volumes are suitable for detecting most of the species present in the sample.
This finding is further supported by statistical analysis of the differences in the average number of species detected per sample volume (Table 2). For most samples, no statistically significant difference (p>0.05) was observed between the average number of species detected across the sample volumes. Significant differences were identified only for the SMHI_Anholt E and SYKE samples. In the case of SMHI_Anholt E sample, further statistical testing revealed no significant differences between specific sample volumes. This suggests that variability across all sample volumes led to statistically significant result when testing all sample volumes together, but the differences between specific volumes individually were not large enough to show significance. Thus, this result was interpreted as having no meaningful differences between the sample volumes. In the case of the SYKE sample, a statistically significant difference was observed between the 20 and 500 mL sample volumes. This could potentially be attributed to how the sample was mixed prior to taking subsamples. Vigorous mixing of the sample may cause cells to burst, leading to the release of intracellular DNA. This could result in uneven detection of species across sample volumes and may also explain the detection of unique species in specific sample volumes.
Volume (mL) | |||||||
Sample | 1000 | 500 | 200 | 20 | Morph | Shared | HAB |
SMHI_Anholt E | 80 | 88 | 97 | 92 | 52 | 7 | 8 |
SMHI_BY2 | 50 | 67 | 69 | 64 | OW | OW | 5 |
SYKE | 91 | 95 | 79 | 80 | 48 | 8 | 4 |
MFRI | 94 | 93 | 98 | 101 | 40 | 16 | 13 |
UiO | 109 | 72 | 86 | 85 | OW | OW | 5 |
NIVA | ND | 120 | 117 | 114 | 36 | 6 | 5 |
NINA | 105 | 112 | 111 | 103 | 20 | 1 | 4 |
TalTech | 136 | 138 | 135 | 128 | 24 | 5 | 2 |
IOW | 99 | OW | OW | OW | 25 | 1 | 2 |
LHEI | 87 | 89 | 91 | 80 | 56 | 9 | 4 |
AU | ND | ND | 140 | 117 | OW | OW | 0 |
Firum | 103 | 119 | 122 | 105 | 16 | 10 | 12 |
Ifremer | 162 | 153 | 168 | 156 | 30 | 4 | 13 |
Table 1. Overview of average number of phytoplankton (incl. microzooplankton) species detected in different sample volumes and morphology-based detection (Morph). Shared: the number of species detected by eDNA and morphology, HAB: harmful algal bloom species detected based on eDNA, OW: ongoing work; ND: no data
When comparing the number of phyto- and microzooplankton species detected by eDNA and morphology, the species numbers identified by morphology were notably lower (Table 1). This difference can be attributed to the ability of eDNA to identify species that are either too small (<20 µm) or lack distinctive external characteristics required for species level identification. Additionally, the number of shared species between all sample volumes combined and morphology-based detection was relatively low, with a maximum of 16 shared species (Table 1). However, morphology-based identification also detected some species that were not identified by eDNA. This discrepancy could be due to the absence of DNA sequences for those species in the public databases used for taxonomic assignment. This may also be influenced by the choice of molecular marker, as some markers are more effective at differentiating specific groups or genera. To address this limitation and capture a broader diversity, the use of several molecular markers has been recommended (Sildever et al. 2021). Moreover, discrepancies could arise from taxonomic inconsistencies, whereas the same species might be assigned different names in morphological and genetic databases. This highlights the need for improved integration and standardisation between morphological and molecular taxonomic frameworks.
Shapiro-Wilk test | Levene`s test | ANOVA | Tukey HSD | ||||||
Sample | W | p | F | Pr(>F) | df | F | Pr(>F) | df | |
SMHI_Anholt E | 0.90 | 0.16 | 1.42 | 0.31 | 8 | 5.03 | 0.03 | 8 | NS |
SMHI_BY2 | 0.97 | 0.88 | 0.68 | 0.59 | 8 | 1.87 | 0.21 | 8 | |
SYKE | 0.96 | 0.77 | 0.30 | 0.83 | 8 | 4.81 | 0.03 | 8 | 20 vs 500 mL, S |
MFRI | 0.93 | 0.35 | 0.66 | 0.60 | 8 | 0.34 | 0.80 | 8 | |
UiO | 0.92 | 0.27 | 0.97 | 0.45 | 8 | 1.24 | 0.36 | 8 | |
NIVA | 0.98 | 0.98 | 2.01 | 0.22 | 6 | 0.75 | 0.51 | 6 | |
NINA | 0.93 | 0.39 | 0.65 | 0.61 | 8 | 0.58 | 0.65 | 8 | |
TalTech | 0.95 | 0.57 | 1.24 | 0.36 | 8 | 0.34 | 0.80 | 8 | |
LHEI | 0.96 | 0.77 | 0.22 | 0.88 | 7 | 4.15 | 0.06 | 7 | |
Firum | 0.94 | 0.49 | 1.28 | 0.35 | 8 | 1.81 | 0.22 | 8 | |
Ifremer | 0.91 | 0.24 | 0.08 | 0.97 | 8 | 0.57 | 0.65 | 8 | |
Table 2. Statistical analysis of differences between the average number of species detected by each sample volume. Samples from IOW and AU are not included due to work in progress. NS: not statistically significant (p>0.05), S: statistically significant (p<0.05).
The number of harmful algal bloom (HAB) species detected based on eDNA ranged from 2 to 13, depending on the sampling location (Table 1, Appendix 3). When comparing the HAB species detected across different sample volumes, a 200 mL sample volume reliably detected all HAB species present in the various sample volumes. In contrast, the detection of HAB species from the 20 mL sample was inconsistent. Based on these findings, it is recommended to use 200 mL as the reliable minimum sample volume for identifying phyto- and microzooplankton diversity as well as for detecting HAB species. Furthermore, the study also demonstrated that sample volumes between 200 mL to 1000 mL, filtered according to the described protocol, can be readily compared. This is similar to the findings reported by Latz et al. (2024), where different sample volumes (500mL, 200 mL, 100 mL, and 10 mL) were compared in terms of species richness, α- and β-diversity. They also found that from sample volume of 200 mL the diversity and richness reached a plateau and variation between replicates decreased from that sample volume.
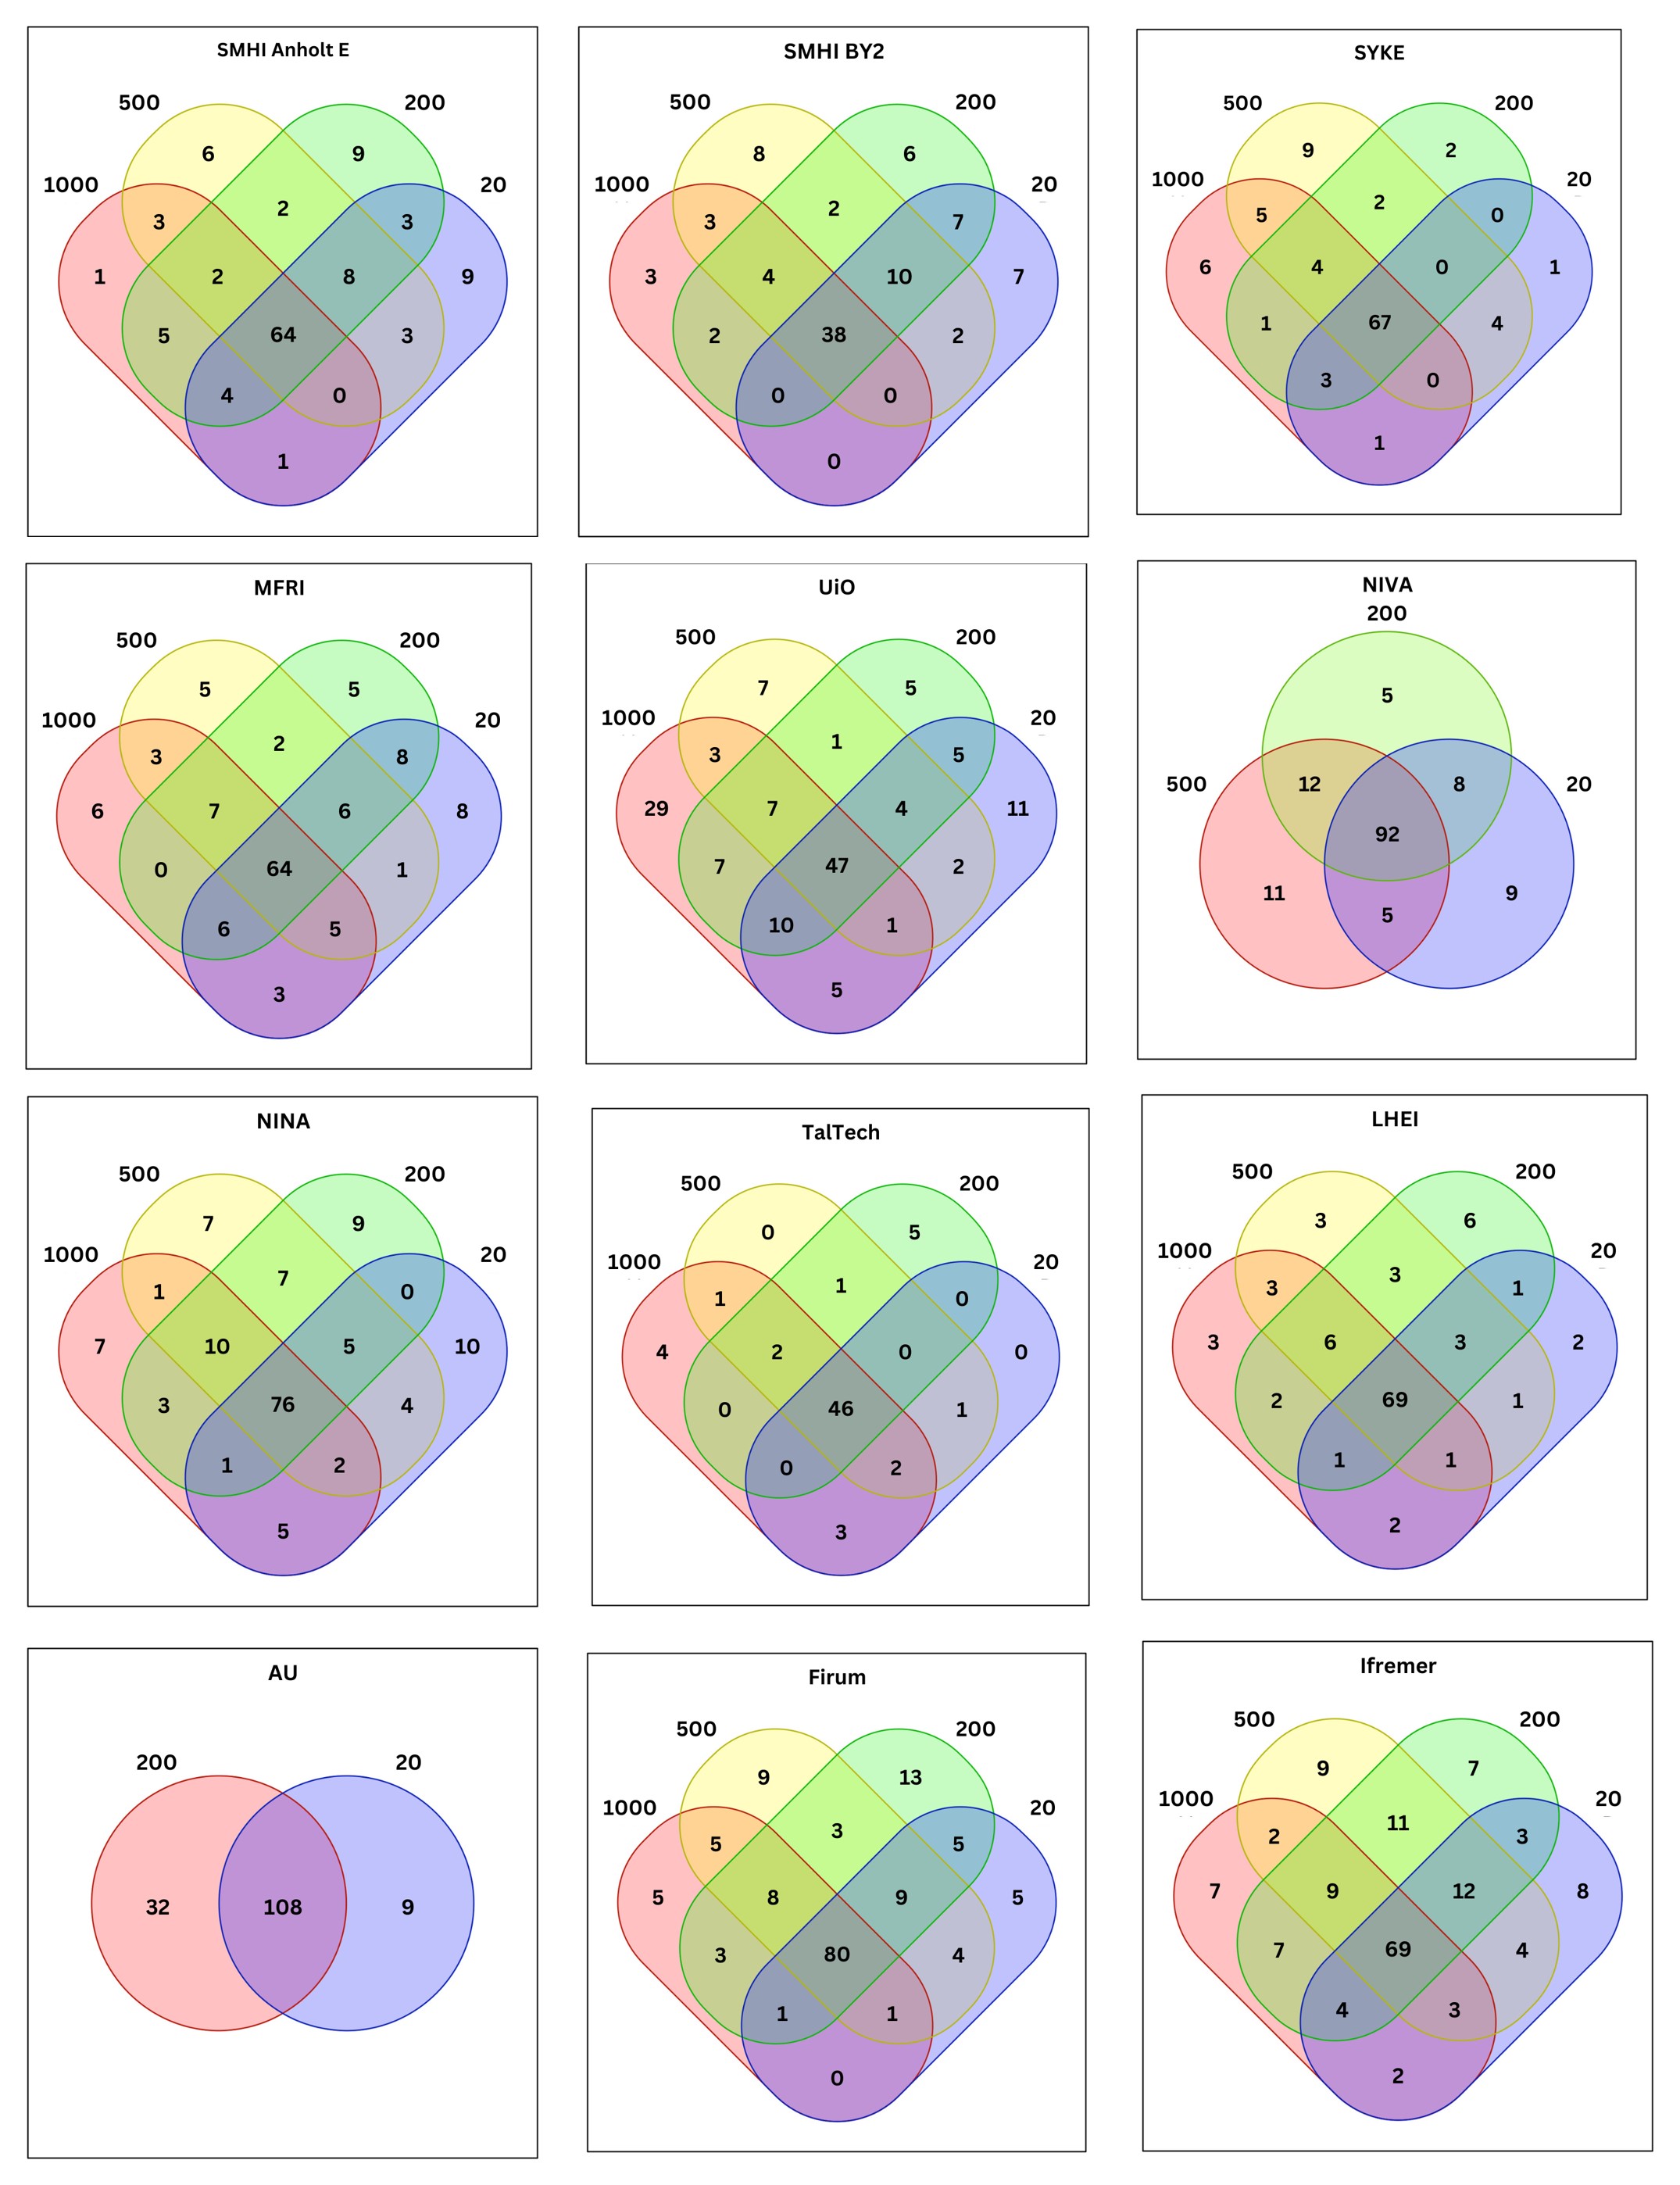
Figure 4. Venn diagrams for each sample displaying the overlap and differences in species detected between the different sample volumes (1000 mL, 500 mL, 200 mL, and 20 mL).